Article

Land Cover Change Intensifies Actual and Potential Radiative Forcing through CO2 in South and Southeast Asia from 1992 to 2015

1
Laboratory of Geospatial Technology for the Middle and Lower Yellow River Regions, Henan University, Kaifeng 475001, China
2
Department of Environmental and Geographical Science, University of Cape Town, Rondebosch 7701, South Africa
3
Institute of Geographic Sciences and Natural Resources Research, Chinese Academy of Sciences, Beijing 100101, China
*
Author to whom correspondence should be addressed.
Int. J. Environ. Res. Public Health 2019, 16(14), 2460; https://doi.org/10.3390/ijerph16142460
Submission received: 4 June 2019 / Revised: 3 July 2019 / Accepted: 4 July 2019 / Published: 11 July 2019

Abstract

:
Land cover change (LCC) and its impact on CO2 sequestration and radiative forcing (RF) could dramatically affect climate change, but there has been little effort to address this issue in South and Southeast Asia over a long period of time using actual land cover information. In this study, annual land cover data from 1992 to 2015 were used to assess the CO2 flux and corresponding RF due to LCC in South and Southeast Asia. The results showed that 553.2 × 10³ km2 of the region experienced LCC during this period, mostly due to land reclamation, urban expansion, and deforestation. These LCC caused a marked net decrease in net ecosystem productivity (NEP) as a composite of the various land cover categories during the whole study period, especially since 2001. The CO2 sequestration was 2160 TgCO2 during the early 1990s however cumulative sequestration decreased by 414.95 TgCO2 by 2015. Correspondingly, the cooling effect of NEP, i.e. the total actual RF, was −0.366 W m−2 in South and Southeast Asia between 1992 and 2015. However, the potential RF of the cumulatively reduced NEP due to LCC relative to the 1990s resulted in a warming effect of 2.33 × 10⁻³ W m−2 in 2015. Our study provides an applicable framework to accurately assess the potential effect of large-scale LCC on climate.

1. Introduction

The impacts of land cover change (LCC) on CO2 must be accounted for when considering its mitigation effects in order to meet the Paris climate target [1]. LCC influences the amount of CO2 sequestered by terrestrial ecosystems through biogeochemical cycles and has been recognized as playing a significant role in global radiative forcing (RF) [2,3]. Numerous studies have demonstrated the profound effect of historical land cover on current and future climate [4,5]. Large-scale increase in global croplands (pastures) and a corresponding decrease in forest cover resulted in substantial CO2 emissions before 2000 and, indeed, CO2 emissions from LCC still account for approximately 10% of the total CO2 emissions in recent decades [6,7,8]. Importantly, changing land cover in a particular region can not only impact the climate over the world, but also impact the animal and plant habitats [9,10]. Moreover, climate change, especially temperature fluctuation, would increase the risks of public health.
CO2 is an important driver of climate change and will continue to be so in the future [11]. Extensive studies have been undertaken on changes in atmospheric CO2 concentration and their relationship to climate change across different timescales [12]. Nowadays, the effects of LCC on climate due to the change in CO2 has been analyzed in many studies [13,14,15]. However, although some of the above studies have taken into account the attenuation of CO2, the changing temporal patterns of total CO2 emissions have been neglected, as has the corresponding RF response affected by different integration years. In addition, most analyses have used simulated data in developing the scenarios with little research using actual land cover data in the corresponding period [8,16].
South and Southeast Asia is comprised of the countries that lie between the tropics to the south of China (Figure 1), occupying a total area of 8.87 million km2. Since the 1990s, many countries such as India and Indonesia in South and Southeast Asia, have experienced a number of dramatic LCCs, including urban expansion, agricultural development, deforestation, and afforestation [17,18]. Previous studies have focused on the impact of LCC on the carbon cycle and evaluated its effects on carbon flux through various means, including ecosystem modelling, remote sensing, covariance observation, or using CO2 assimilation data [19,20]. However, such studies are usually limited to the analysis of one specific type of land cover conversion on the specific region [19,21]. Results thus far lack uniformity and there are discrepancies even when the eddy covariance type of measurement is used [20]. In addition, compared to the relatively complete CO2 flux network in China, North America, and Europe, there are only limited monitoring sites in South and Southeast Asia (AsiaFlux: http://asiaflux.net/?page_id=22) and these are too remote to analyze the CO2 flux of land cover categories in the region.
It is clear, therefore, that a detailed understanding of the influence of LCC on CO2 flux and RF in South and Southeast Asia is needed. The aim of this study is to develop a suitable framework to assess the RF response to the change of net ecosystem productivity (NEP) resulting from LCC between 1992 and 2015. Specifically, the objectives of this paper are as follows: (i) To obtain land cover categories and associated NEP values for each year between 1992 and 2015, (ii) to establish the benchmark NEP value, and (iii) to calculate the RF values of these years.

2. Materials and Methods
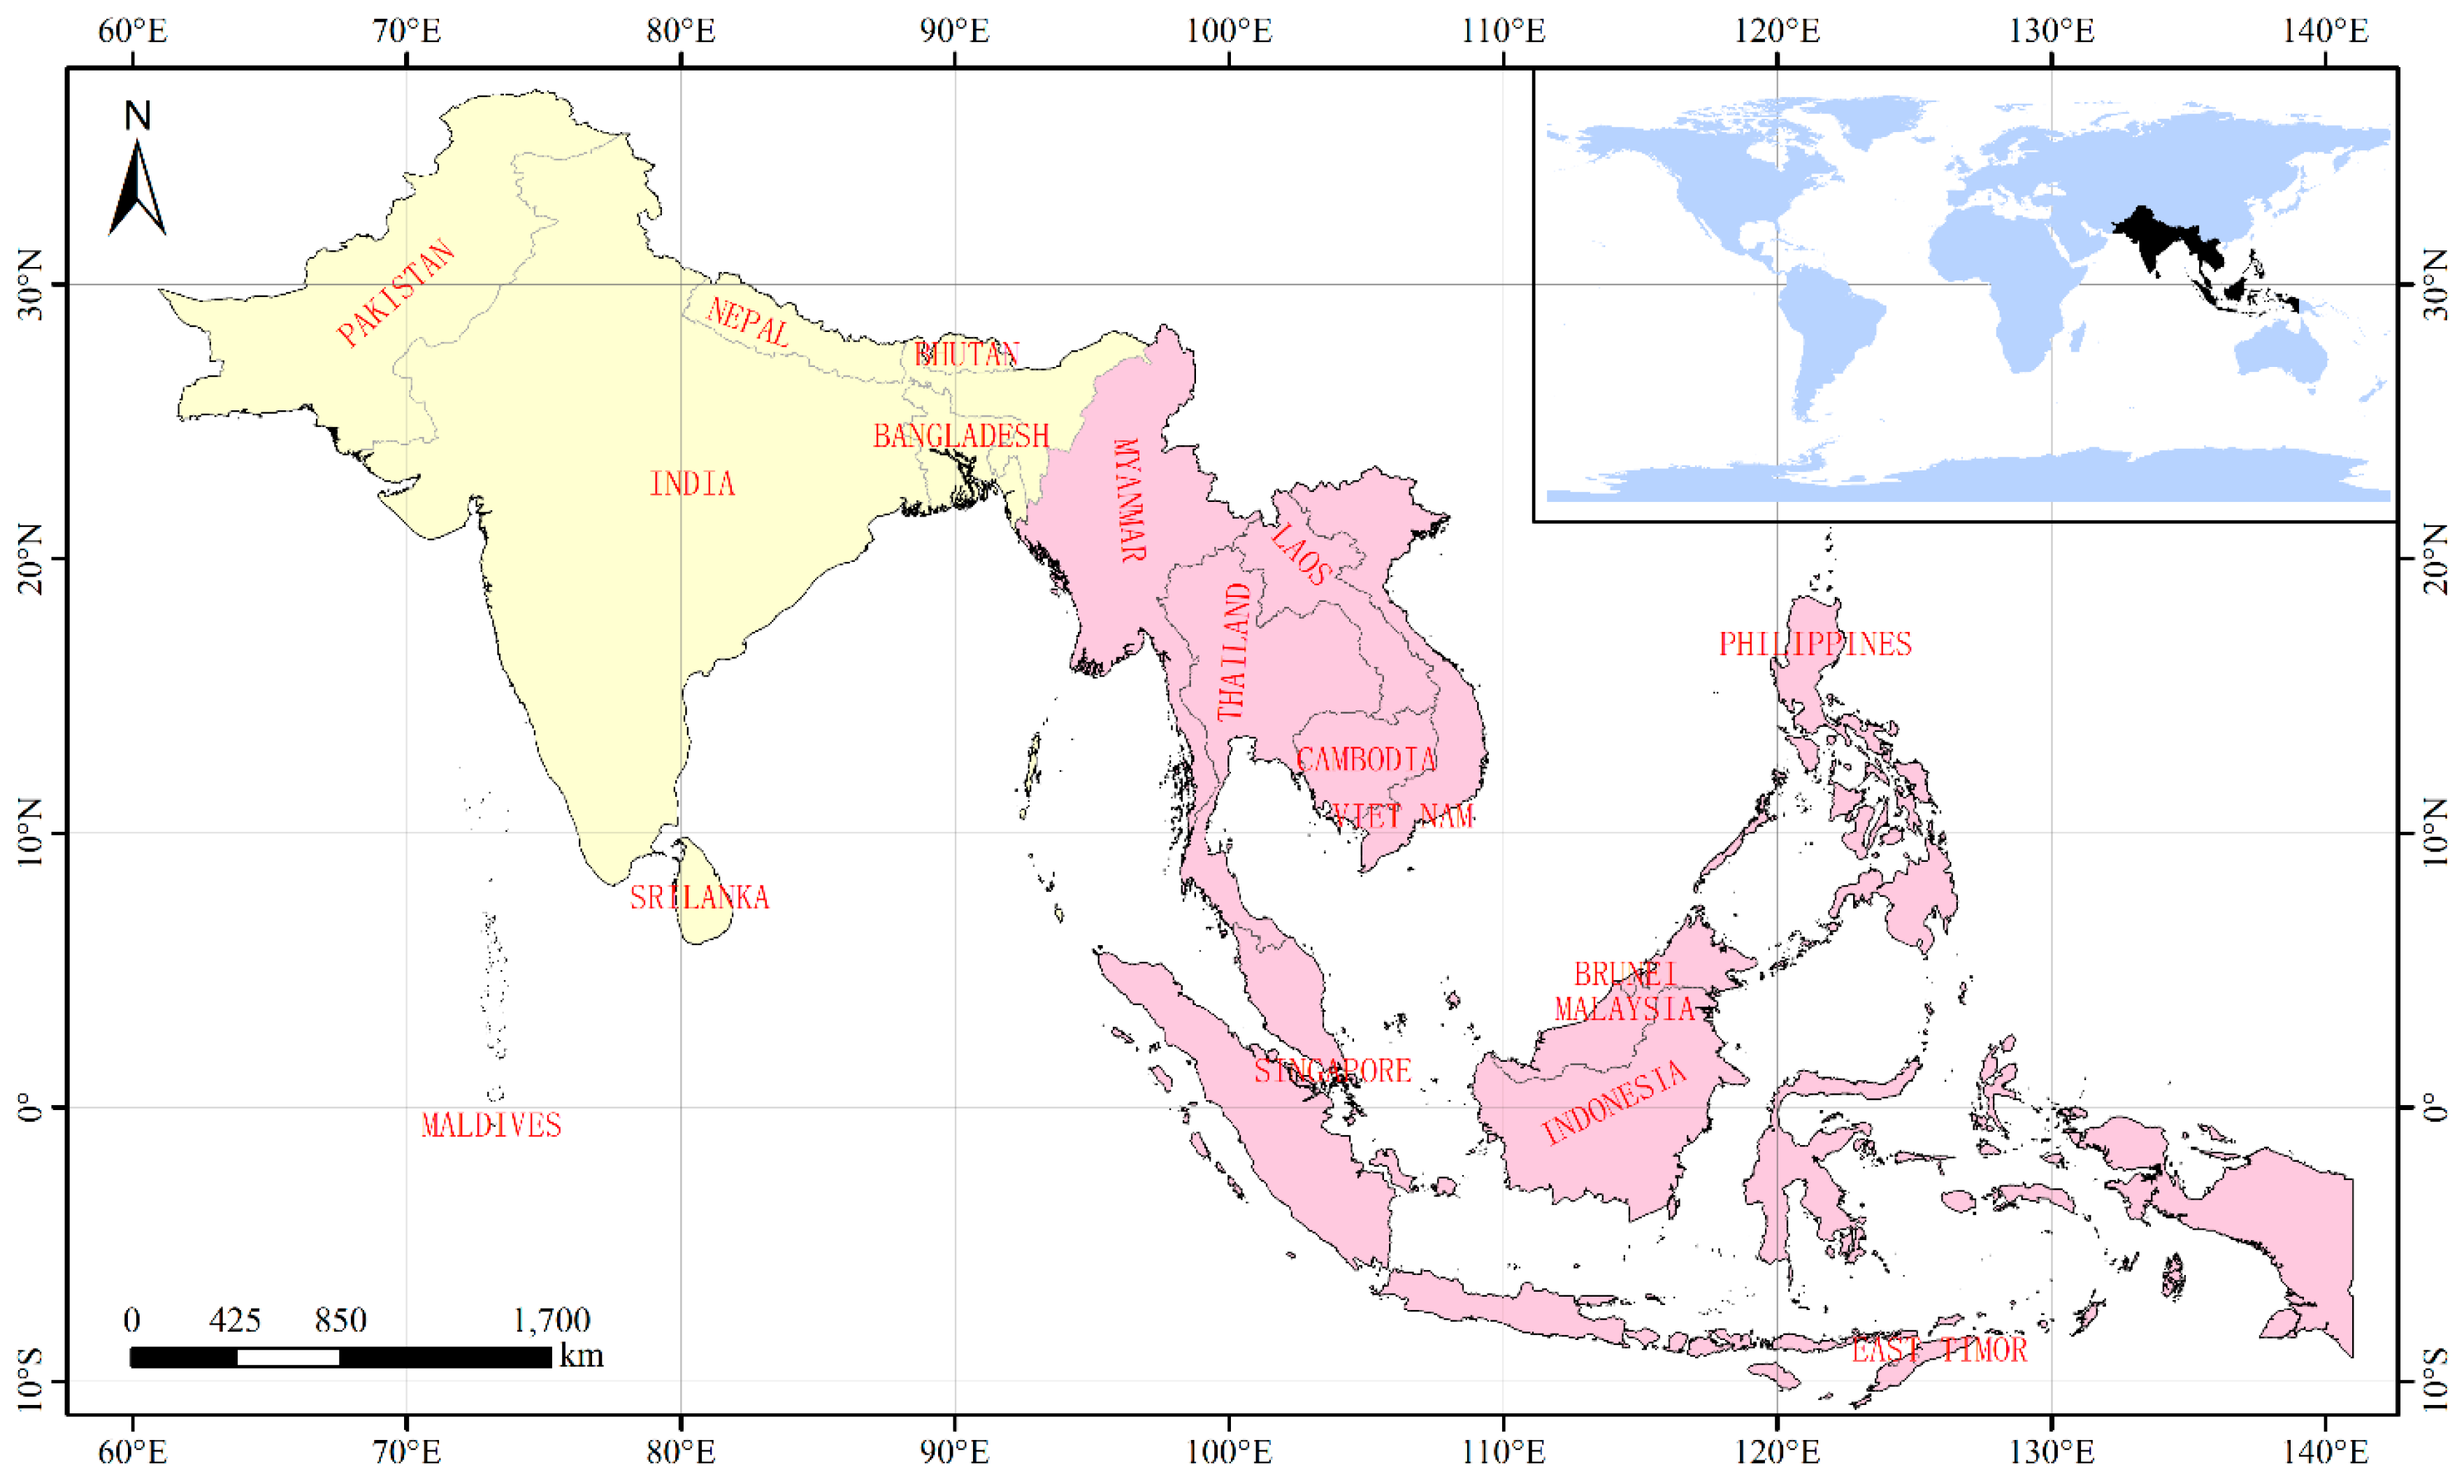
2.1. Study Area

The study area includes the two regions of South Asia and Southeast Asia (Figure 1). A total of 7 countries, Bangladesh, Bhutan, India, Maldives, Nepal, Pakistan, and Sri Lanka make up South Asia. The climate of these places varies from tropical monsoon in the south, to temperate in the north, a range which is influenced by altitude, proximity to the ocean, and the characteristics of the monsoon season. There are 11 countries in the region defined as Southeast Asia, namely, Brunei, Cambodia, East Timor, Indonesia, Laos, Malaysia, Myanmar, Philippines, Singapore, Thailand, and Vietnam. The climate is hot all year and rainfall is generally caused by the seasonal monsoon. Exceptions to this are found in Northern Vietnam and the Himalayan region, where higher elevations produce a cooler, subtropical climate (https://en.wikipedia.org/wiki/Main_Page).

2.2. Study Data

Data of 3 categories were collected for this study, specifically the annual land cover, terrestrial ecoregions, and NEP values for a suitable range of land cover categories. Annual land cover data at 300 m resolution for the period 1992 to 2015 are based on the Land Cover Map (v2.0.7; http://maps.elie.ucl.ac.be). The annual land cover data is also the only one that has been released to the public currently. The terrestrial ecoregions data were obtained from the map of terrestrial ecoregions of the world [22]. NEP data for each land cover categories were collated from current available literature.
In this study, with the annual land cover and terrestrial ecoregions data, the final land cover categories were defined based on plant functional categories (Figure 2) [23]. Based on previously published studies that considered the parameter of ecosystem-atmosphere exchange of CO2 in different terrestrial ecoregions, we determined NEP values for the various land cover categories and corresponding annual CO2 flux as shown in Table 1 (±NEP). All the NEP data were from public literatures.

2.3. Assessing the RF of Land Cover Category Change

In this analysis, we aimed to quantify the specific RF of LCC on an annual basis from 1992 to 2015. In order to assess the effects of terrestrial carbon uptake, firstly it was necessary to establish the regional benchmark quantity of CO2 uptake for the initial early 1990s conditions. In order to account for changes in net CO2 caused by land cover and to assess their effects on climate, an initial benchmark value is required against which the subsequent changes can be analyzed [33]. Here we used the mean NEP during 1992 to 1995 to represent the initial level of carbon sequestration (ICS) in the early 1990s. Thereafter, we compared the NEP of each of the subsequent years with the benchmark values. LCC is directly reflected in annual NEP values and the annual difference (AD amount) between NEP and ICS in each of the following years represents corresponding changes in the quantum of CO2 sequestration. Finally, we used a simplified climate response model to calculate the RF of NEP of terrestrial land cover from 1992 to 2015. There are many models that estimate the interactions between land cover, CO2, and RF [34]. However, considering the large uncertainties and discrepancies of their parameterizations and schemes, explicitly for illustrative purposes we adopted the widely-used empirical approach of Joos et al. (2013) to calculate RF [16,35].
(i) CO2 concentration. The changing NEP (Ct in tC) carried in various land cover categories or LCC can be converted to atmospheric CO2 concentration (ACt in ppm) by:
A C t = C t / ( 2.213 × 10 9 ) ,
(ii) Actual RF (ARF). If the annual NEP > 0, then local land cover is acting as a carbon sink and therefore has a cooling effect, which can be expressed by the annual actual RF (ARF):
A R F = 5.35 ln ( 1 + a b s ( A C t ) / C 0 ) ,
where abs(f) is an absolute value function and C0 is the background atmospheric CO2 concentration with a value of 354.39 in the early 1990s (www.esrl.noaa.gov/gmd/).
If the annual NEP < 0, then the annual warming effect of ARF can be calculated by:
A R F = 5.35 ln ( 1 + a b s ( A C t ) / C 0 ) ,
(iii) Potential RF (PRF). Since natural ecosystems are in general carbon sinks and sequestrate CO2 from atmosphere, the concept of potential RF (PRF) is used here to express the potential climate effect of LCC.
If the annual difference between NEP and ICS is more than zero (AD > 0), local LCC results in carbon uptake and has a cooling effect. In this case, the exponential decay process of CO2 is ignored directly and only the first annual value of A C t is involved in the calculation of the same year. Or, if the AD < 0, there would be warming effect that compared with the ICS. Atmospheric CO2 at year t (t > 1991) can be calculated as:
A C t = [ f 0 + f 1 × e x p ( t τ 1 ) + f 2 × e x p ( t τ 2 ) + f 3 × e x p ( t τ 3 ) ] Δ C
where f0, …, f3 and τ1, …, τ3 are the critical constants, usually used to define the global carbon cycle model [16,36]. Here we assign these parameter values based on the results of multi-mode simulations [16]. The changed Ct can be converted to added CO2 concentration ΔC (in ppm) by Δ C = ( C t C 0 ) / ( 2.213 × 10 9 ) . This formula accounts for the exponential decay process of CO2 [37].
Similar to the formula in Equation (3), the warming effect and the corresponding PRF due to LCC can be calculated by:
P R F = 5.35 ln ( 1 + a b s ( A C t ) / C 0 )

3. Results

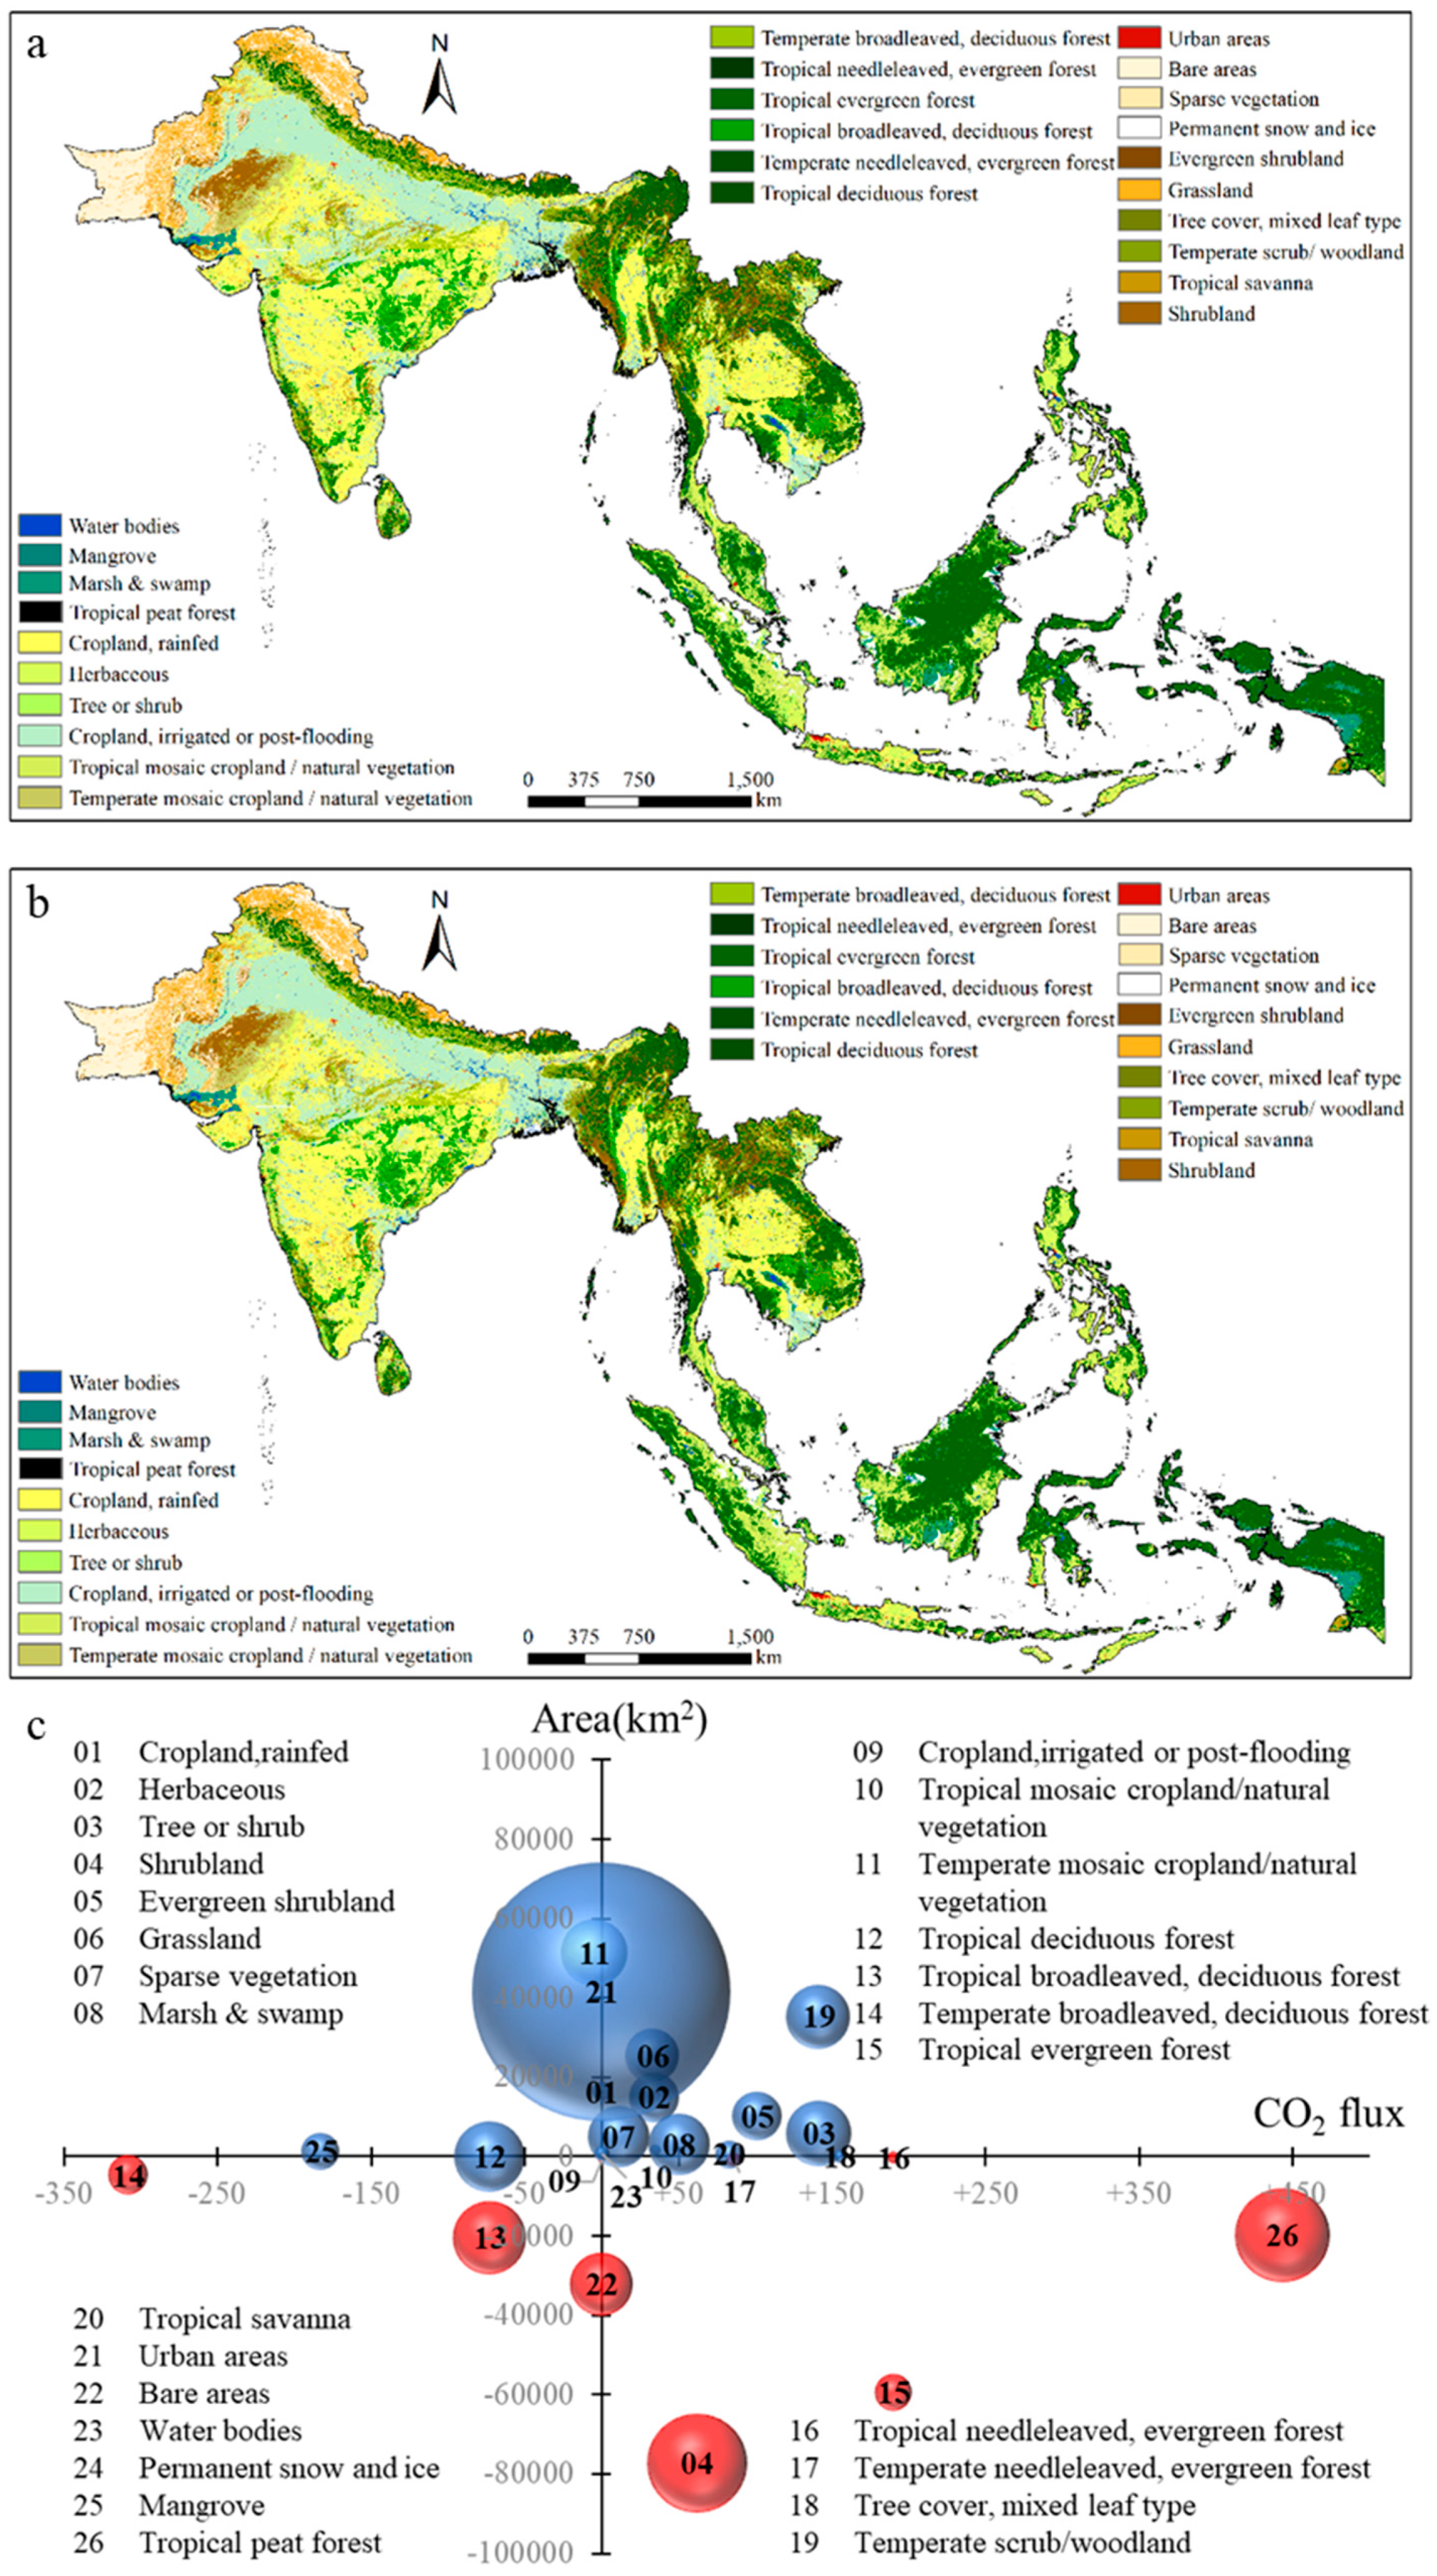
3.1. Land Cover and Land Cover Category Change

Currently, croplands and tropical evergreen forests are the two most abundant land cover categories in the region, each representing almost 20% of the study area (Figure 2). Croplands are most commonly found across India, Myanmar, Thailand, and Vietnam, while tropical evergreen forests are most prominently distributed in Malaysia, Indonesia, Brunei, Philippines, Cambodia, Vietnam, and other Southeast Asian countries. Land covered by cropland, either irrigated or naturally flooded, is distributed mainly in the northern part of India, accounting for 13% of the study area. The areas covered by mosaic cropland/natural vegetation in both tropical and temperate regions account for more than 5% of the total, with most of this land cover type existing in Southeast Asia.
Between 1992 and 2015, the land cover category changed across 553.2 × 10³ km2 of the region, and the most common conversions were urban expansion, land reclamation, and deforestation. The single largest proportion change in land cover was associated with urban expansion. The total amount of land classified as urban area in South and Southeast Asia increased by 41.5 × 10³ km2, representing a 1.72 fold increase from 1992 to 2015. Land cover categories, such as tropical mosaic cropland/natural vegetation, urban areas, and temperate scrub/woodland, expanded rapidly by increasing more than 25 × 103 km2 for each type during the period in question. Tropical deciduous forest, tropical mosaic cropland/natural vegetation, and temperate scrub/woodland increased by more than 10%. Differently, shrubland, tropical peat forest, tropical evergreen forest, and tropical broadleaved, deciduous forest experienced the most significant decline, reducing in area by more than 18 × 103 km2 for each type. Tropical peat forest and shrubland were both reduced by more than 20% over the time period.

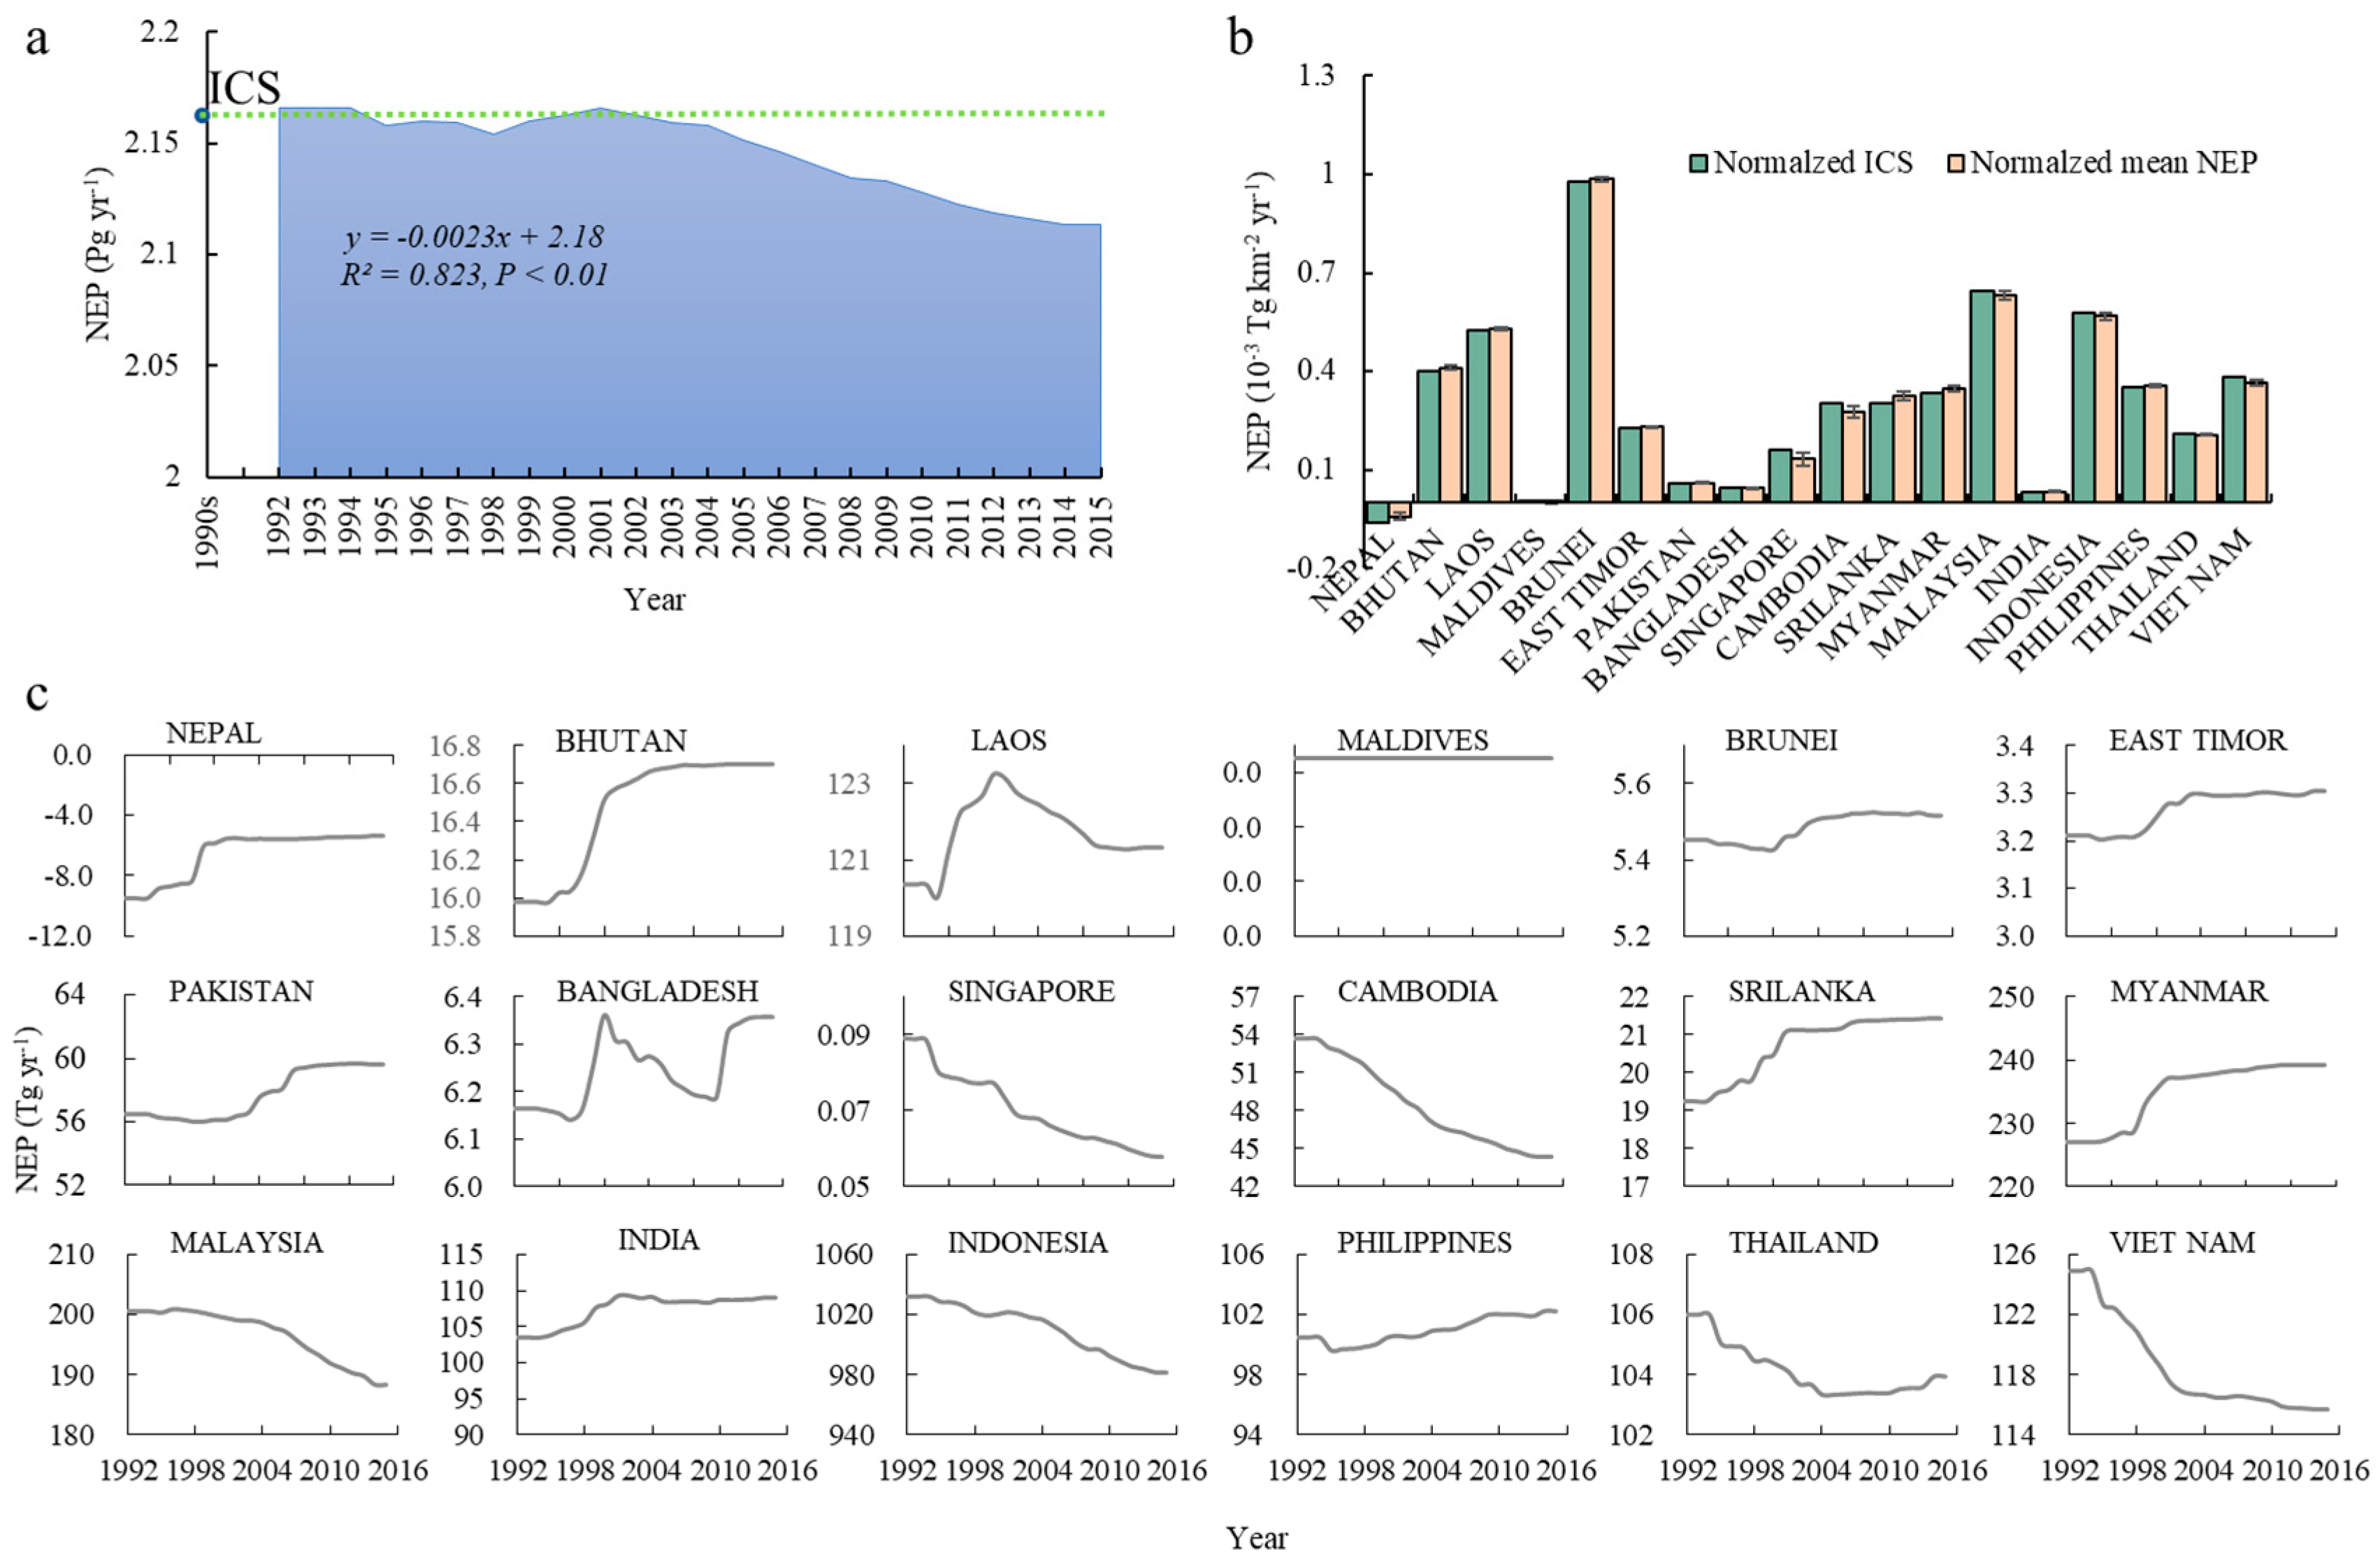
3.2. Annual Variations in NEP

For South and Southeast Asia as a whole, for the period 1992 to 2015, the values of ICS and mean annual NEP were 2.164 Pg and 2.146 Pg, respectively. The overall trend of NEP revealed a clear net decrease of 2.44 Tg yr−1 over the period (Figure 3a). In order to compare the ICS and NEP during 1992–2015 more effectively, we normalized the ICS and the multi-annual mean NEP for each country by converting the units to NEP per unit area. The normalized ICS and NEP for Brunei, Malaysia, Indonesia, and Laos all exceeded 0.5 × 10⁻³ Tg km−2 yr−1 (Figure 3b). The normalized multi-annual mean NEP values were greater than normalized ICS in 11 of the countries. In fact, the dynamics of the NEP also reflect this. With the exception of Nepal and Maldives, all 16 countries in South and Southeast Asia act as carbon sinks (Figure 3c). Most countries actually exhibited increased NEP relative to the benchmark between 1992–2015. However, because of substantial reductions in several of the larger countries, including Indonesia, Thailand, and Vietnam, the overall NEP values declined from 2.16 Pg in the early 1990s to 2.11 Pg in 2015 (Figure 3c). Indonesia had the largest NEP values, accounting for nearly half of the total region area as a whole and exhibited ICS and multi-annual averages of 1031.1 and 1010.1 Tg, respectively. Myanmar, Malaysia, Laos, India, Philippines, Thailand, and Vietnam all exceeded 100 Tg NEP annually. Among these, Myanmar, India, and Philippines all exhibited a trend of increase, while Cambodia, Malaysia, and Indonesia showed clear reductions.
In order to further evaluate the impact of LCC on NEP, we compared the AD of the annual recent NEP with the benchmark NEP values of the early 1990s (ICS). The results showed that the total AD of NEP was characterized by accelerated decreases (Figure 4a). When annual NEP is compared with ICS, AD during 1992–2002 remained around −2.0 Tg, with a range of −9.54 to 2.02 Tg. Thereafter, the AD increased and, by 2015, reached 50.41 Tg, indicating that the overall ability of the land cover of the region to sequester CO2 was declining year by year.
Over the study period, the quantum of cumulative carbon sequestration decreased by 414.95 Tg compared with the early 1990s. Among the 18 countries, the largest contributors to this change were Indonesia (503.5 Tg), Vietnam (139.3 Tg), Cambodia (118.8 Tg), and Malaysia (94.2 Tg). In fact, the amount of NEP in some countries, such as Myanmar, India, Nepal, and Laos increased over a year (Figure 4b). However, the total increased amount of NEP was too far to offset the substantial decreasing amount of NEP in several major countries. The result was also mutually confirmed with the point we obtained above.

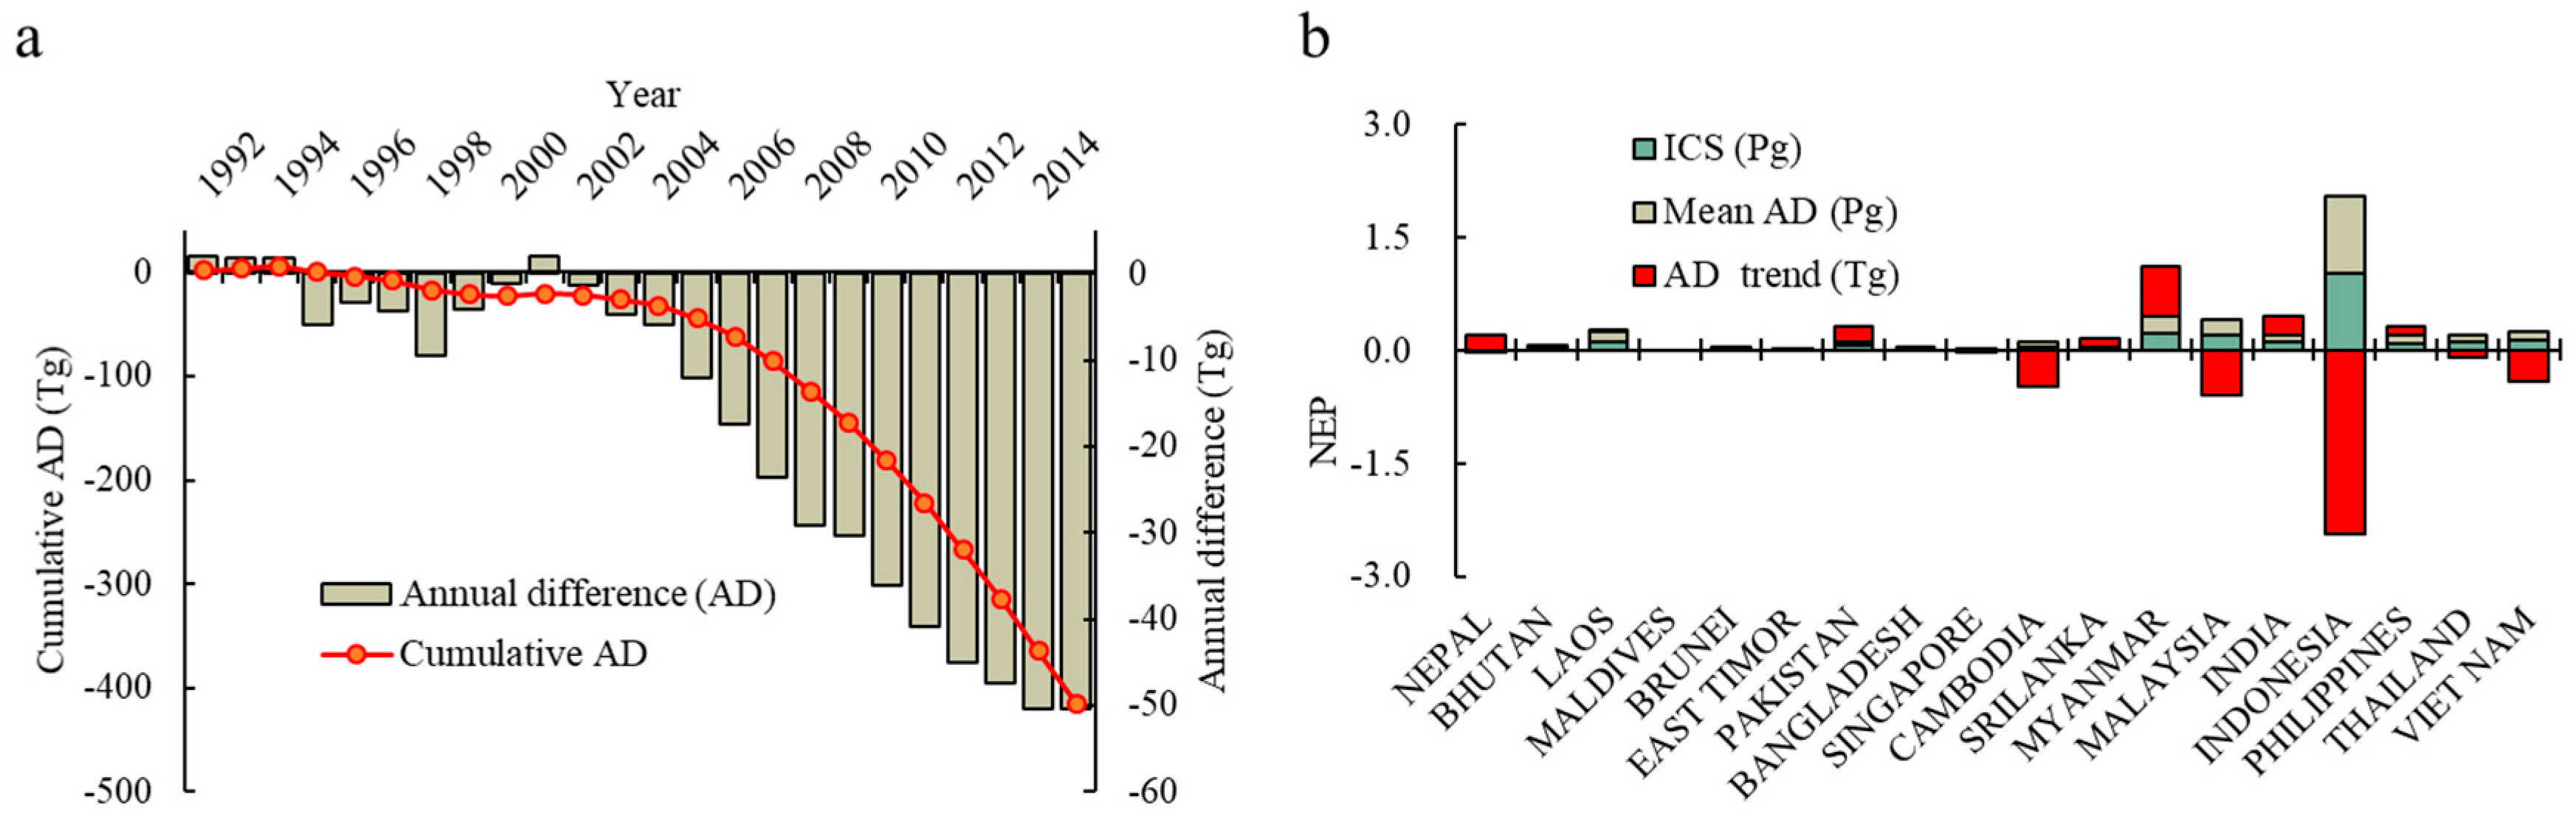
3.3. RF of Land Cover and Land Cover Category Change

Land cover change intensifies radiative forcing. From the perspective of global temperature change, ±RF represents the warming or cooling effect due to the annual change of NEP or AD. The results show that, while NEP remained positive in the region, the AD was negative in almost all 18 countries. This indicates that the climate effect of terrestrial ecosystems of South and Southeast Asian countries from 1992 to 2015 was cooling overall however the magnitude of this effect is declining with time due to LCC. Analysis of the temporal and spatial dynamics of annual actual radiative forcing (ARF) during 1992 to 2015 and potential radiative forcing (PRF) in 2015 is shown in Figure 5. Annual ARF changes are similar to trends in NEP in that, during 1992 to 2015, values declined by a total of −0.366 W m−2. However, the annual negative ARF had a shapely increase trend, especially since 2002, meaning that the capacity of carbon sequestration by terrestrial land cover categories in the study area decreased over time (Figure 5a). Unlike ARF, PRF continued to rise because it considers the cumulative RF across the whole study period (Figure 5a). Compared to the ICS, the PRF in 2015 reached 2.331 × 10⁻³ W m−2. In essence, this means that the NEP reduction caused by LCC during 1992 to 2015 yielded a warming effect of 2.331 × 10⁻³ W m−2 to 2015. In particular, Figure 5a clearly shows that both ARF and PRF exhibited a very significant linear increase since 2001.
In general, less negative values of ARF induce pronounced cooling effects, correspondingly, larger positive PRF values induce stronger warming effects due to LCC, which may be intensified or attenuated by other anthropogenic and/or natural factors. ARF values for all countries in the region were negative (Figure 5b), indicating that all the countries made a general contribution to the cooling effect, especially Indonesia, Myanmar, and Malaysia, which have mean ARF values below −0.3 W m−2, such that these countries play a role in global temperature attenuation. In terms of PRF, six countries exhibited positive values, namely Indonesia, Vietnam, Cambodia, Malaysia, Thailand, and Singapore, showing that LCC in these countries markedly impacted climate through an accentuated warming effect. In addition, in terms of the climate effect of various land cover types, urban area expansion and deforestation in particular, the area shrinking of tropical peat forest and tropical needle leaved evergreen forest contributed the most in the whole study area with 90.26% shares on the total RF increment during the study period.

4. Discussion

4.1. Uncertainty Analysis

There are inherent problems in assessing the accuracy of estimating terrestrial productivity [38,39]. While accurate assessment of the net CO2 emissions arising from LCC is a fundamental research goal, unfortunately there remains considerable uncertainty in such estimates. A meta-analysis of 250 studies of carbon responses to land cover change revealed conflicting results for several land cover transitions, with some resulting in net carbon uptake (for example agriculture to forest) while others involved carbon release (mature forest to agriculture) [40]. In the present study, because the land cover classification used is based mainly on the functional characteristics of terrestrial vegetation, the land cover categories identified may not necessarily correspond to each other in regard to CO2 flux. Additionally, the situation of widely distributed cropland and forest ecosystem is complex. Photosynthesis and subsequent harvesting, biomass burning, deforestation, degradation, and other greenhouse gases like N2O have not been considered [41]. This means that the study does not account for the effects of all greenhouse gases from these land cover categories and simplifies the NEP changes within the same land cover category. This also implies that CO2 emissions due to deforestation and CO2 uptake due to regrowth may be underestimated in this study. However, our results showed that the NEP during the 1990s was 589.1 TgC yr−1, which is similar to the result (546.6 TgC yr−1) obtained by Cervarich et al. (2016). As for the flux, results differ widely between studies [38,42]. Other studies reveal NEP values that are much higher than our results, implying that considering only the land cover category change may underestimate the climate regulation effect of LCC to some extent. To further explore the specific results of this study, we can compare several basic ratios with global results for reference. The study area accounts for 8.87/149 = 5.95% of the global continental land mass. For the NEP and RF, for reference, the annual values of NEP during 2006–2015 and RF during 2003–2012 were calculated to compare the global results with Global Carbon Project and other studies. The ratios of NEP and RF reached 9.28 (103/1110) and 6.98%, respectively [43,44]. The fact that these ratios are greater than their respective areas indicates the importance of regional factors in regulating climate change.
The CO2 flux between vegetation and soil is not synchronized. For example, the annual carbon release from soil varies until the soil is “set” to another type of land cover completely. For this issue, some studies introduced a bookkeeping approach to address which calculations were based on stocks of carbon in vegetation and soils but not the CO2 fluxes for ecosystems [13,24,45]. Although carbon stocks are relatively fixed and using CO2 flux during 1992–2015 can sensitively capture the resultant RF, carbon stocks can be used to calculate a long-term result, which can completely consider the full decomposition of various biomasses or ecosystems. Overall, although the accuracy of the study data and methods themselves may be constrained, the calculated result and framework are suitable for assessing the relative changes in the nature and distribution of changes in RF.

4.2. Problem and Prospects

Key results obtained in this study are noteworthy. This study was undertaken on the basis of a carbon balance, which considered the initial condition (benchmark) of the early 1990s to be NEP = 0, enabling subsequent changes in the NEP and the corresponding RF variations to be effectively evaluated. The results reveal that, although total NEP in South and Southeast Asia remained positive during 1992–2015, CO2 sequestration by various land cover categories declined substantially, and the cooling effect of NEP in the region declined over the study period. This situation emerged directly from the corresponding LCCs. The Southeast Asian tropical rainforest is the second largest tropical rainforest on earth, with data revealing that the area under this land cover category has continued to decline during the period in question [39]. Coupled with urban expansion and increased farmland conversion, NEP has been reduced with concomitant climate implications, as indicated.
In contrast to previous studies that used simulated data and numerical models, our analysis of the effect of NEP on RF employed actual annual land cover data during 1992–2015. The simplified parameterization scheme used in this study not only facilitated the use of actual land cover data, but also avoided the constraints of numerical models based on the explicit correspondence between land cover and RF in the aspect of biogeochemistry. It was confirmed that the results of the single general circulation model (GCM) often have very large discrepancies and the Coupled Model Intercomparison Project (CMIP) are thus used by IPCC to analyze the RF and climate effects of greenhouse gases [16,34]. In fact, based on the multi-mode simulations, simplified climate response models are generally parameterized to reflect the main characteristics of GCMs and these methods have been used extensively by IPCC. The analysis here enables the direct interpretation of RF changes corresponding to CO2. In addition, many studies commonly assess the climate effects of CO2 on the basis of a comparison with a pre-industrial revolution atmosphere and, in the process, integrate their analyses over a period of 100 years or more [36,46]. The global atmospheric CO2 concentration was 278.00 ppm in 1750 compared to more than 350 ppm in the 1990s. The assessment results based on 1990s actually indicated a contribution since 1990 for future temperature. Furthermore, in the process of data analysis, annual CO2 emissions are important for calculating the RF since it can consider the real-time situation. However under the condition whereby the total amount of emitted CO2 is fixed, a different emission time or emission scenario will also affect its CO2 concentration at a certain year, and then affect the subsequent RF [16,37].
However, given that the simplified carbon-climate parameterization scheme cannot consider biomass burning, black carbon, and other factors associated with LCC, a full evaluation of the radiative forcing in South Asia/Southeast Asia remains elusive, although the climate effect of CO2 can be analyzed. In this study, NEP, the actual, and potential RF (ARF and PRF) were used to construct a bookkeeping framework for a preliminary assessment of the climate effect of LCC. In order to improve the assessment approach, two aspects should at least be considered in future to more finely resolve the climate effects of LCC. One issue is the temporal scale. Limited by the formula and analysis period, the later in the sequence that the LCC occurs, the lower its effect because the remaining amount of CO2 decay is not computed after 2015. This study was strictly stuck in the study period. A second issue concerns the framework itself. Although CO2 is the main greenhouse gas and the focus of this study, other greenhouse gases, including CH4 and N2O, are affected by LCC [24,36]. The climate effect of LCC also involves biogeophysical processes. Changes emanating from variations in land cover are well correlated with spatial patterns in surface biogeophysical parameters, such as albedo, evapotranspiration, surface roughness, etc. [13,47,48]. LCC represent an even stronger driver of climate change when taking into account biogeophysical mechanisms and biogeochemistry aspects at the local or regional scale [8]. Therefore, considering the basic assessment framework utilized in this study, other related work on the climate effect of LCC should be conducted in the future.

5. Conclusions

This study used actual land cover data in South and Southeast Asia from 1992 to 2015 to assess actual and potential radiative forcing of CO2 due to land cover category change in South and Southeast Asia from 1992 to 2015. Although the bookkeeping approach adopted does not account for other complex biogeochemical and biogeophysical effects, our framework enables a rapid assessment on the climate effects of LCC. Results of this preliminary assessment indicate that the ability to sequestrate CO2 was weakened due to LCC during 1992 to 2015, resulting in a net warming effect of 2.33 × 10⁻³ W m−2 to 2015. In particular, both ARF and PRF exhibited a very significant linear increase since 2001. Overall, the presented results could contribute to other sciences in the broader perspectives, especially climate change and its effects on the living world.

Author Contributions

Conceptualization, M.E.M., Y.C., G.Z., and J.D.; methodology, Y.C. and Y.F.; software, N.L. and Y.C.; formal analysis, Y.C., N.L., Y.F., G.Z., and J.D.; writing—original draft preparation, Y.C. and G.Z.; writing—review and editing, Y.C. and M.E.M.; supervision, M.E.M.; funding acquisition, Y.C.

Funding

This research was funded by the Natural Science Foundation of China, grant number 41671425 and 41401504; Chinese National Key Basic Research Program, grant number 2014CB954302, Scientific Research Start-up Funding of Special Talent Zone (Zhaodong Feng), and Key Research Program of Frontier Sciences by the Chinese Academy of Sciences (QYZDB–SSW–DQC005).

Acknowledgments

The authors acknowledge the Climate Change Initiative, European Space Agency for providing land cover data (v2.0.7, http://maps.elie.ucl.ac.be/CCI/).

Conflicts of Interest

The authors declare no conflict of interest.

References

  1. Harper, A.B.; Powell, T.; Cox, P.M.; House, J.; Huntingford, C.; Lenton, T.M.; Sitch, S.; Burke, E.; Chadburn, S.E.; Collins, W.J.; et al. Land-use emissions play a critical role in land-based mitigation for Paris climate targets. Nat. Commun. 2018, 9, 2938. [Google Scholar] [CrossRef] [PubMed]
  2. Matthews, H.D.; Weaver, A.J.; Eby, M.; Meissner, K.J. Radiative forcing of climate by historical land cover change. Geophys. Res. Lett. 2003, 30, 21–27. [Google Scholar] [CrossRef]
  3. Feldman, D.R.; Collins, W.D.; Gero, P.J.; Torn, M.S.; Mlawer, E.J.; Shippert, T.R. Observational determination of surface radiative forcing by CO2 from 2000 to 2010. Nature 2015, 519, 339–343. [Google Scholar] [CrossRef] [PubMed]
  4. Foley, J.A.; Costa, M.H.; Delire, C.; Ramankutty, N.; Snyder, P. Green surprise? How terrestrial ecosystems could affect earth’s climate. Front. Ecol. Environ. 2003, 1, 38–44. [Google Scholar]
  5. Pielke, R.A.; Pitman, A.; Niyogi, D.; Mahmood, R.; Mcalpine, C.; Hossain, F.; Goldewijk, K.K.; Nair, U.; Betts, R.; Fall, S. Land use/land cover changes and climate: Modeling analysis and observational evidence. Wiley Clim. Chang. 2011, 2, 828–850. [Google Scholar] [CrossRef]
  6. Ciais, P.; Sabine, C.; Bala, G.; Bopp, L.; Brovkin, V.; Al, E.; House, J.I. Carbon and Other Biogeochemical Cycles: Climate Change 2013: The Physical Science Basis. Contribution of Working Group I to the Fifth Assessment Report of the Intergovernmental Panel on Climate Change Change. Comput. Geom. 2013, 18, 95–123. [Google Scholar]
  7. Klein Goldewijk, K.; Beusen, A.; Van Drecht, G.; De Vos, M. The HYDE 3.1 spatially explicit database of human-induced global land-use change over the past 12,000 years. Glob. Ecol. Biogeogr. 2015, 20, 73–86. [Google Scholar] [CrossRef]
  8. Devaraju, N.; Bala, G.; Nemani, R. Modelling the influence of land-use changes on biophysical and biochemical interactions at regional and global scales. Plant Cell Environ. 2015, 38, 1931–1946. [Google Scholar] [CrossRef]
  9. Mahmood, R.; Pielke, R.A.; Hubbard, K.G.; Niyogi, D.; Dirmeyer, P.A.; Mcalpine, C.; Carleton, A.M.; Hale, R.; Gameda, S.; Beltrán-Przekurat, A. Land cover changes and their biogeophysical effects on climate. Int. J. Climatol. 2014, 34, 929–953. [Google Scholar] [CrossRef]
  10. Chen, G.S.; Notaro, M.; Liu, Z.; Liu, Y. Simulated local and remote biophysical effects of afforestation over the Southeast United States in Boreal Summer. J. Clim. 2011, 25, 4511–4522. [Google Scholar] [CrossRef]
  11. Myhre, G.; Boucher, O.; Bréon, F.; Forster, P.; Shindell, D. Declining uncertainty in transient climate response as CO2 forcing dominates future climate change. Nat. Geosci. 2015, 8, 181–185. [Google Scholar] [CrossRef]
  12. Parrenin, F.; Masson-Delmotte, V.; Köhler, P.; Raynaud, D.; Paillard, D.; Schwander, J.; Barbante, C.; Landais, A.; Wegner, A.; Jouzel, J. Synchronous change of atmospheric CO2 and Antarctic temperature during the last deglacial warming. Science 2013, 339, 1060–1063. [Google Scholar] [CrossRef] [PubMed]
  13. Anderson-Teixeira, K.J.; Snyder, P.K.; Twine, T.E.; Cuadra, S.V.; Costa, M.H.; Delucia, E.H. Climate-regulation services of natural and agricultural ecoregions of the Americas. Nat. Clim. Chang. 2012, 2, 177–181. [Google Scholar] [CrossRef]
  14. Bayer, A.D.; Pugh, T.A.M.; Krause, A.; Arneth, A. Historical and future quantification of terrestrial carbon sequestration from a Greenhouse-Gas-Value perspective. Glob. Environ. Chang. 2015, 32, 153–164. [Google Scholar] [CrossRef]
  15. Serna-Chavez, H.M.; Kissling, W.D.; Veen, L.E.; Swenson, N.G.; van Bodegom, P.M. Spatial scale dependence of factors driving climate regulation services in the Americas. Glob. Ecol. Biogeogr. 2018, 27, 828–838. [Google Scholar] [CrossRef] [Green Version]
  16. Joos, F.; Roth, R.; Fuglestvedt, J.S.; Peters, G.P.; Enting, I.G.; Bloh, W.V.; Brovkin, V.; Burke, E.J.; Eby, M.; Edwards, N.R. Carbon dioxide and climate impulse response functions for the computation of greenhouse gas metrics: A multi-model analysis. Atmos. Chem. Phys. 2013, 13, 2793–2825. [Google Scholar] [CrossRef]
  17. Langner, A.; Miettinen, J.; Kukkonen, M.; Vancutsem, C.; Simonetti, D.; Vieilledent, G.; Verhegghen, A.; Gallego, J.; Stibig, H.J. Towards operational monitoring of forest canopy disturbance in evergreen rain forests: A test case in continental Southeast Asia. Remote Sens. 2018, 10, 544. [Google Scholar] [CrossRef]
  18. Ouyang, Z.; Fan, P.; Chen, J. Urban built-up areas in transitional economies of Southeast Asia: Spatial extent and dynamics. Remote Sens. 2016, 8, 819. [Google Scholar] [CrossRef]
  19. Tao, B.; Tian, H.; Chen, G.; Ren, W. Changes in carbon fluxes and pools induced by cropland expansion in South and Southeast Asia in the 20th century. Biogeosci. Discuss. 2011, 8, 11979–12012. [Google Scholar] [CrossRef]
  20. Ichii, K.; Ueyama, M.; Kondo, M.; Saigusa, N.; Kim, J.; Alberto, M.C.; Ardö, J.; Euskirchen, E.S.; Kang, M.; Hirano, T. New data-driven estimation of terrestrial CO2 fluxes in Asia using a standardized database of eddy covariance measurements, remote sensing data, and support vector regression. J. Geophys. Res. Biogeosci. 2017, 122, 767–795. [Google Scholar] [CrossRef]
  21. Lee, S.J.; Kim, J.; Ichii, K.; Cho, C.H. Land Cover Composition Around AsiaFlux Sites and Carbontracker-Asia Net CO2 Flux Evaluation. In Proceedings of the Joint Conference of AsiaFlux, HESSS, and KSAFM, Seoul, Korea, 21–24 August 2013. [Google Scholar]
  22. Olson, D.M.; Dinerstein, E.; Wikramanayake, E.D.; Burgess, N.D.; Powell, G.V.N.; Underwood, E.C.; D’Amico, J.A.; Itoua, I.; Strand, H.E.; Morrison, J.C. Terrestrial ecoregions of the world: A new map of life on Earth: A new global map of terrestrial ecoregions provides an innovative tool for conserving biodiversity. Bioscience 2001, 51, 933–938. [Google Scholar] [CrossRef]
  23. Bontemps, S.; Defourny, P.; Radoux, J.; Van Bogaert, E.; Lamarche, C.; Achard, F.; Mayaux, P.; Boettcher, M.; Brockmann, C.; Kirches, G. Consistent Global Land Cover Maps for Climate Modelling Communities: Current Achievements of the ESA’ Land Cover CCI. In Proceedings of the ESA Living Planet Symposium, Edinburgh, English, 9–13 September 2013. [Google Scholar]
  24. Anderson-Teixeira, K.J.; Delucia, E.H. The greenhouse gas value of ecosystems. Glob. Chang. Biol. 2011, 17, 425–438. [Google Scholar] [CrossRef]
  25. Stoy, P.; Katul, G.; Siqueira, M.; Juang, J.; Novick, K.; Mccarthy, H.; Oishi, A.; Oren, R. Role of vegetation in determining carbon sequestration along ecological succession in the southeastern United States. Glob. Chang. Biol. 2010, 14, 1409–1427. [Google Scholar] [CrossRef]
  26. Luyssaert, S.; Inglima, I.; Jung, M.; Richardson, A.; Reichsteins, M.; Papale, D.; Piao, S.; Schulzes, E.; Wingate, L.; Matteucci, G. CO2 balance of boreal, temperate, and tropical forests derived from a global database. Glob. Chang. Biol. 2007, 13, 2509–2537. [Google Scholar] [CrossRef]
  27. Li, H.; Zhang, F.; Li, Y.; Wang, J.; Zhang, L.; Zhao, L.; Cao, L.; Zhao, X.; Du, M. Seasonal and inter-annual variations in CO2 fluxes over 10 years in an alpine shrubland on the Qinghai–Tibetan Plateau, China. Agric. For. Meteorol. 2016, 228, 95–103. [Google Scholar] [CrossRef]
  28. Kato, T.; Tang, Y.; Gu, S.; Hirota, M.; Du, M.; Li, Y.; Zhao, X. Temperature and biomass influences on interannual changes in CO2 exchange in an alpine meadow on the Qinghai–Tibetan Plateau. Glob. Chang. Biol. 2006, 12, 1285–1298. [Google Scholar] [CrossRef]
  29. Clark, K.L.; Gholz, H.L.; Moncrieff, J.B.; Cropley, F.; Loescher, H.W. Environmental controls over net exchanges of carbon dioxide from contrasting Florida ecosystems. Ecol. Appl. 1999, 9, 936–948. [Google Scholar] [CrossRef]
  30. Borges, A.V.; Djenidi, S.; Lacroix, G.; Théate, J.; Delille, B.; Frankignoulle, M. Atmospheric CO2 flux from mangrove surrounding waters. Geophys. Res. Lett. 2003, 30, 1558. [Google Scholar] [CrossRef]
  31. Ishida, S.S.; Nagano, T.; Waijaroen, S. Influences of deforestation on carbon balance in a natural tropical peat swamp forest in thailand. Seibutsu Kankyo Chosetsu 1999, 37, 115–128. [Google Scholar]
  32. Suzuki, S. Influences of deforestation on heat and carbon balances in a natural tropical pear swamp forest in Thailand. Seibutsu Kankyo Chosetsu 2001, 39, 329–330. [Google Scholar]
  33. West, T.O.; Marland, G. Net carbon flux from agricultural ecosystems: Methodology for full carbon cycle analyses. Environ. Pollut. 2002, 116, 439–444. [Google Scholar] [CrossRef]
  34. Eyring, V.; Bony, S.; Meehl, G.A.; Senior, C.; Stevens, B.; Stouffer, R.J.; Taylor, K.E. Overview of the Coupled Model Intercomparison Project Phase 6 (CMIP6) experimental design and organisation. Geosci. Model Dev. 2016, 9, 1937–1958. [Google Scholar] [CrossRef]
  35. Muñoz, I.; Campra, P.; Fernández-Alba, A.R. Including CO2 emission equivalence of changes in land surface albedo in life cycle assessment. Methodology and case study on greenhouse agriculture. Int. J. Life Cycle Assess. 2010, 15, 672–681. [Google Scholar] [CrossRef]
  36. Kirschbaum, M.U.; Saggar, S.; Tate, K.R.; Thakur, K.P.; Giltrap, D.L. Quantifying the climate-change consequences of shifting land use between forest and agriculture. Sci. Total Environ. 2013, 465, 314–324. [Google Scholar] [CrossRef] [PubMed]
  37. Hasselmann, K.; Sausen, R.; Maier-Reimer, E.; Voss, R. On the cold start problem in transient simulations with coupled atmosphere-ocean models. Clim. Dyn. 1993, 9, 53–61. [Google Scholar] [CrossRef]
  38. Cervarich, M.; Shu, S.; Jain, A.K.; Arneth, A.; Canadell, J.; Friedlingstein, P.; Houghton, R.A.; Kato, E.; Koven, C.; Patra, P. The terrestrial carbon budget of South and Southeast Asia. Environ. Res. Lett. 2016, 11, 105006. [Google Scholar] [CrossRef] [Green Version]
  39. Zeng, Z.; Estes, L.; Ziegler, A.D.; Chen, A.; Searchinger, T.; Hua, F.; Guan, K.; Jintrawet, A.; Wood, E.F. Highland cropland expansion and forest loss in Southeast Asia in the twenty-first century. Nat. Geosci. 2018, 11, 556–562. [Google Scholar] [CrossRef]
  40. Ziegler, A.D.; Phelps, J.; Yuen, J.Q.; Webb, E.L.; Lawrence, D.; Fox, J.M.; Bruun, T.B.; Leisz, S.J.; Ryan, C.M.; Dressler, W. Carbon outcomes of major land-cover transitions in SE Asia: Great uncertainties and REDD+ policy implications. Glob. Chang. Biol. 2012, 18, 3087–3099. [Google Scholar] [CrossRef]
  41. Villamor, G.B.; Pontius, R.G.; van Noordwijk, M. Agroforest’s growing role in reducing carbon losses from Jambi (Sumatra), Indonesia. Reg. Environ. Chang. 2014, 14, 825–834. [Google Scholar] [CrossRef]
  42. Kondo, M.; Ichii, K.; Patra, P.K.; Poulter, B.; Calle, L.; Koven, C.D.; Pugh, T.A.M.; Kato, E.; Harper, A.B.; Zaehle, S. Plant regrowth as a driver of recent enhancement of terrestrial CO2 uptake. Geophys. Res. Lett. 2018, 45, 4820–4830. [Google Scholar] [CrossRef]
  43. Alkama, R.; Cescatti, A. Biophysical climate impacts of recent changes in global forest cover. Science 2016, 351, 600–604. [Google Scholar] [CrossRef] [PubMed] [Green Version]
  44. Houghton, R.A.; Nassikas, A.A. Global and Regional Fluxes of Carbon from Land Use and Land-Cover Change 1850–2015: Carbon emissions from land use. Glob. Biogeochem. Cycles 2017, 31, 456–472. [Google Scholar] [CrossRef]
  45. Houghton, R.A.; Hackler, J.L. Sources and sinks of carbon from land-use change in China. Glob. Biogeochem. Cycles 2003, 17, 1987–1999. [Google Scholar] [CrossRef]
  46. Millar, R.J.; Fuglestvedt, J.S.; Friedlingstein, P.; Rogelj, J.; Grubb, M.J.; Matthews, H.D.; Skeie, R.B.; Forster, P.M.; Frame, D.J.; Allen, M.R. Emission budgets and pathways consistent with limiting warming to 1.5 °C. Nat. Geosci. 2017, 10, 741–747. [Google Scholar] [CrossRef]
  47. Andrews, T.; Betts, R.A.; Booth, B.B.B.; Jones, C.D.; Jones, G.S. Effective radiative forcing from historical land use change. Clim. Dyn. 2016, 48, 1–17. [Google Scholar] [CrossRef]
  48. Burakowski, E.; Tawfik, A.; Ouimette, A.; Lepine, L.; Novick, K.; Ollinger, S.; Zarzycki, C.; Bonan, G. The role of surface roughness, albedo, and Bowen ratio on ecosystem energy balance in the Eastern United States. Agric. For. Meteorol. 2018, 249, 367–376. [Google Scholar] [CrossRef]
Figure 1. Area: South Asia (light yellow region) and Southeast Asia (light pink region).
Ijerph 16 02460 g001
Figure 2. Land cover category change in study area. Spatial pattern of land cover categories in 1992 (a) and 2005 (b), and (c) temporal change of various land cover categories between 1992 to 2015. Bold and black numbers are the land cover categories; the size of circles represents magnitude of change, while their color indicates increase (blue) and decrease (red) of various categories.
Ijerph 16 02460 g002
Figure 3. Values of NEP in the study area during 1992–2015. (a) Annual values of NEP in South and Southeast Asia; (b) annual values of NEP for all 18 countries; (c) initial level of carbon sequestration (ICS) and annual difference (AD) values of all 18 countries. The NEP of Maldives is zero due to its pocket land area.
Ijerph 16 02460 g003
Figure 4. Dynamics of annual differences (AD) and cumulative AD over year (a); and the statistical information of AD and ICS in various countries (b).
Ijerph 16 02460 g004
Figure 5. Actual radiative forcing (ARF) and potential radiative forcing (PRF) in South and Southeast Asia (a) and 18 countries (b).
Ijerph 16 02460 g005
Table 1. Atmosphere exchange of CO2 of each undisturbed land cover type.
Land Cover TypeCO2 Flux aReferences b
Cropland, rainfed0[13,24]
Herbaceous+34[13,24]
Tree or shrub+141[13,24]
Cropland, irrigated or post-flooding0-
Tropical mosaic cropland/natural vegetation+35[13,24]
Temperate mosaic cropland/natural vegetation−5[13,24]
Tropical evergreen forest+190[13]
Tropical broadleaved, deciduous forest−73[13]
Temperate broadleaved, deciduous forest−308[13,25,26]
Tropical needle leaved evergreen forest+190[13,26]
Temperate needle leaved, evergreen forest+86[13,26]
Tropical deciduous forest−73[13,26]
Tree cover, mixed leaf type+155[13,24,26]
Temperate scrub/woodland+141[24]
Tropical savanna+83[13,24]
Shrubland+62[27]
Evergreen shrubland+101[28]
Grassland+33[13,24,26]
Sparse vegetation+11[13,24]
Marsh and swamp+50[29]
Urban areas0-
Bare areas0-
Water bodies0-
Permanent snow and ice0-
Mangrove−183[30]
Tropical peat forest+443[31,32]
Note: a positive (+) and negative (−) values represent the CO2 uptake and release of various undisturbed land cover types, respectively. Units: kmol ha−1 yr−1. b “-” means that there is no available references for the net ecosystem productivity (NEP) value.

