1. Introduction
The urban heat island (UHI), which is the phenomenon where cities are typically warmer than surrounding rural areas is a result of the process that natural landscapes with vegetation and permeable surfaces are gradually replaced by dense buildings with large heat capacity [
1,
2,
3]. Along with anthropogenic heat sources, the transformation alters the natural solar and hydrological balances of cities, thereby making UHI a common phenomenon worldwide [
4,
5,
6,
7,
8]. The UHI and heat waves are thought to have a large impact on energy consumption [
9], human health [
10], air pollution [
11], and ecological balances [
12]. As the rapid urbanization and industrialization continue, more people will be influenced by UHI, and it will impose new challenges for sustainable urban planning [
13]. Thus, it is necessary to have a obtain a better understanding of the UHI, which will help in making adaptions to climate change and human development [
14].
UHI intensity varies constantly [
15]. As a result, the temporal variation of UHI intensity has become one of the most important themes in UHI studies [
16,
17,
18]. Currently, two efficient methods are used to conduct UHI research, namely meteorological observations [
19,
20] and thermal remote sensing [
21,
22]. Owing to the availability of remote sensing images, daily, monthly, seasonal, annual, and long-term variations of surface urban heat island (SUHI) intensity are more common in the literature [
19,
23,
24]. However, there are two main limitations in current SUHI research. First, the validation of satellite-derived land surface temperature (LST) is difficult to conduct owing to the mismatch between resolution of images and ground measurements [
25]. Second, higher temporal resolution, for example hourly variations of UHI, is not well recorded in the literature [
15]. Unfortunately, available literature on this theme is sparse. SUHI studies conducted by thermal remote sensing are subject to the local time when the images are acquired. Appropriate quantification of UHI is an essential foundation for studying the effects of extreme heat [
26].
Different from LST, air temperature is observed by precise instruments in weather stations with high accuracy and consistency. In addition, air temperature is closer to the apparent temperature, which affects residents’ behaviors and choices [
26]. A reinforced understanding of the hourly variations of UHI can benefit dwellers and urban managers in many ways. For example, it can help dwellers to manage their time for outdoor activities in daily life and may reduce energy consumption by decreasing the utility time of air conditioning [
27,
28]. In the past, limited meteorological stations or the use of automobile transects made it difficult to conduct spatially continuous analysis. Nowadays, a large air temperature network with sufficient weather stations has overcome the limitations of spatial resolution. For example, a dense meteorological network of 23 locations across 5 y were used to monitor the urban climate in a small Portuguese city and adequate results were obtained [
29]. With the advantages of high temporal resolution and accuracy, meteorological observations can provide fine-scale temporal information on UHI.
Numerous studies have explored the effects of different land use types and surface factors on the SUHI [
17,
30,
31,
32]. For instance, a significant correlation was found between impervious surfaces and LST [
33,
34], while vegetation and water bodies could effectively reduce the SUHI intensity [
35,
36,
37,
38]. Most of these studies employed LST to explore the relationships between the SUHI and land use. As mentioned previously, the results of the influence of land use on the SUHI were based on a particular time. The cooling and warming rates of urban and rural areas should also be discussed UHI studies with high temporal resolution [
20]. In addition, the effect of the urban canopy and radiation balance on the causes of UHI have been explored by many studies [
39,
40,
41]. However, the fine-scale variations of air temperature among different land use types are seldom reported. In other words, there is little literature about how the air temperature of different land use changes during a day at different local times. As a result, it is very difficult to comprehensively determine the hourly variation of temperature among land use types in a comprehensive way using LST/RS.
The UHI effect differs by city. The UHI intensity of cities located in tropical and temperate zones has been explored in many studies [
7,
19,
42,
43,
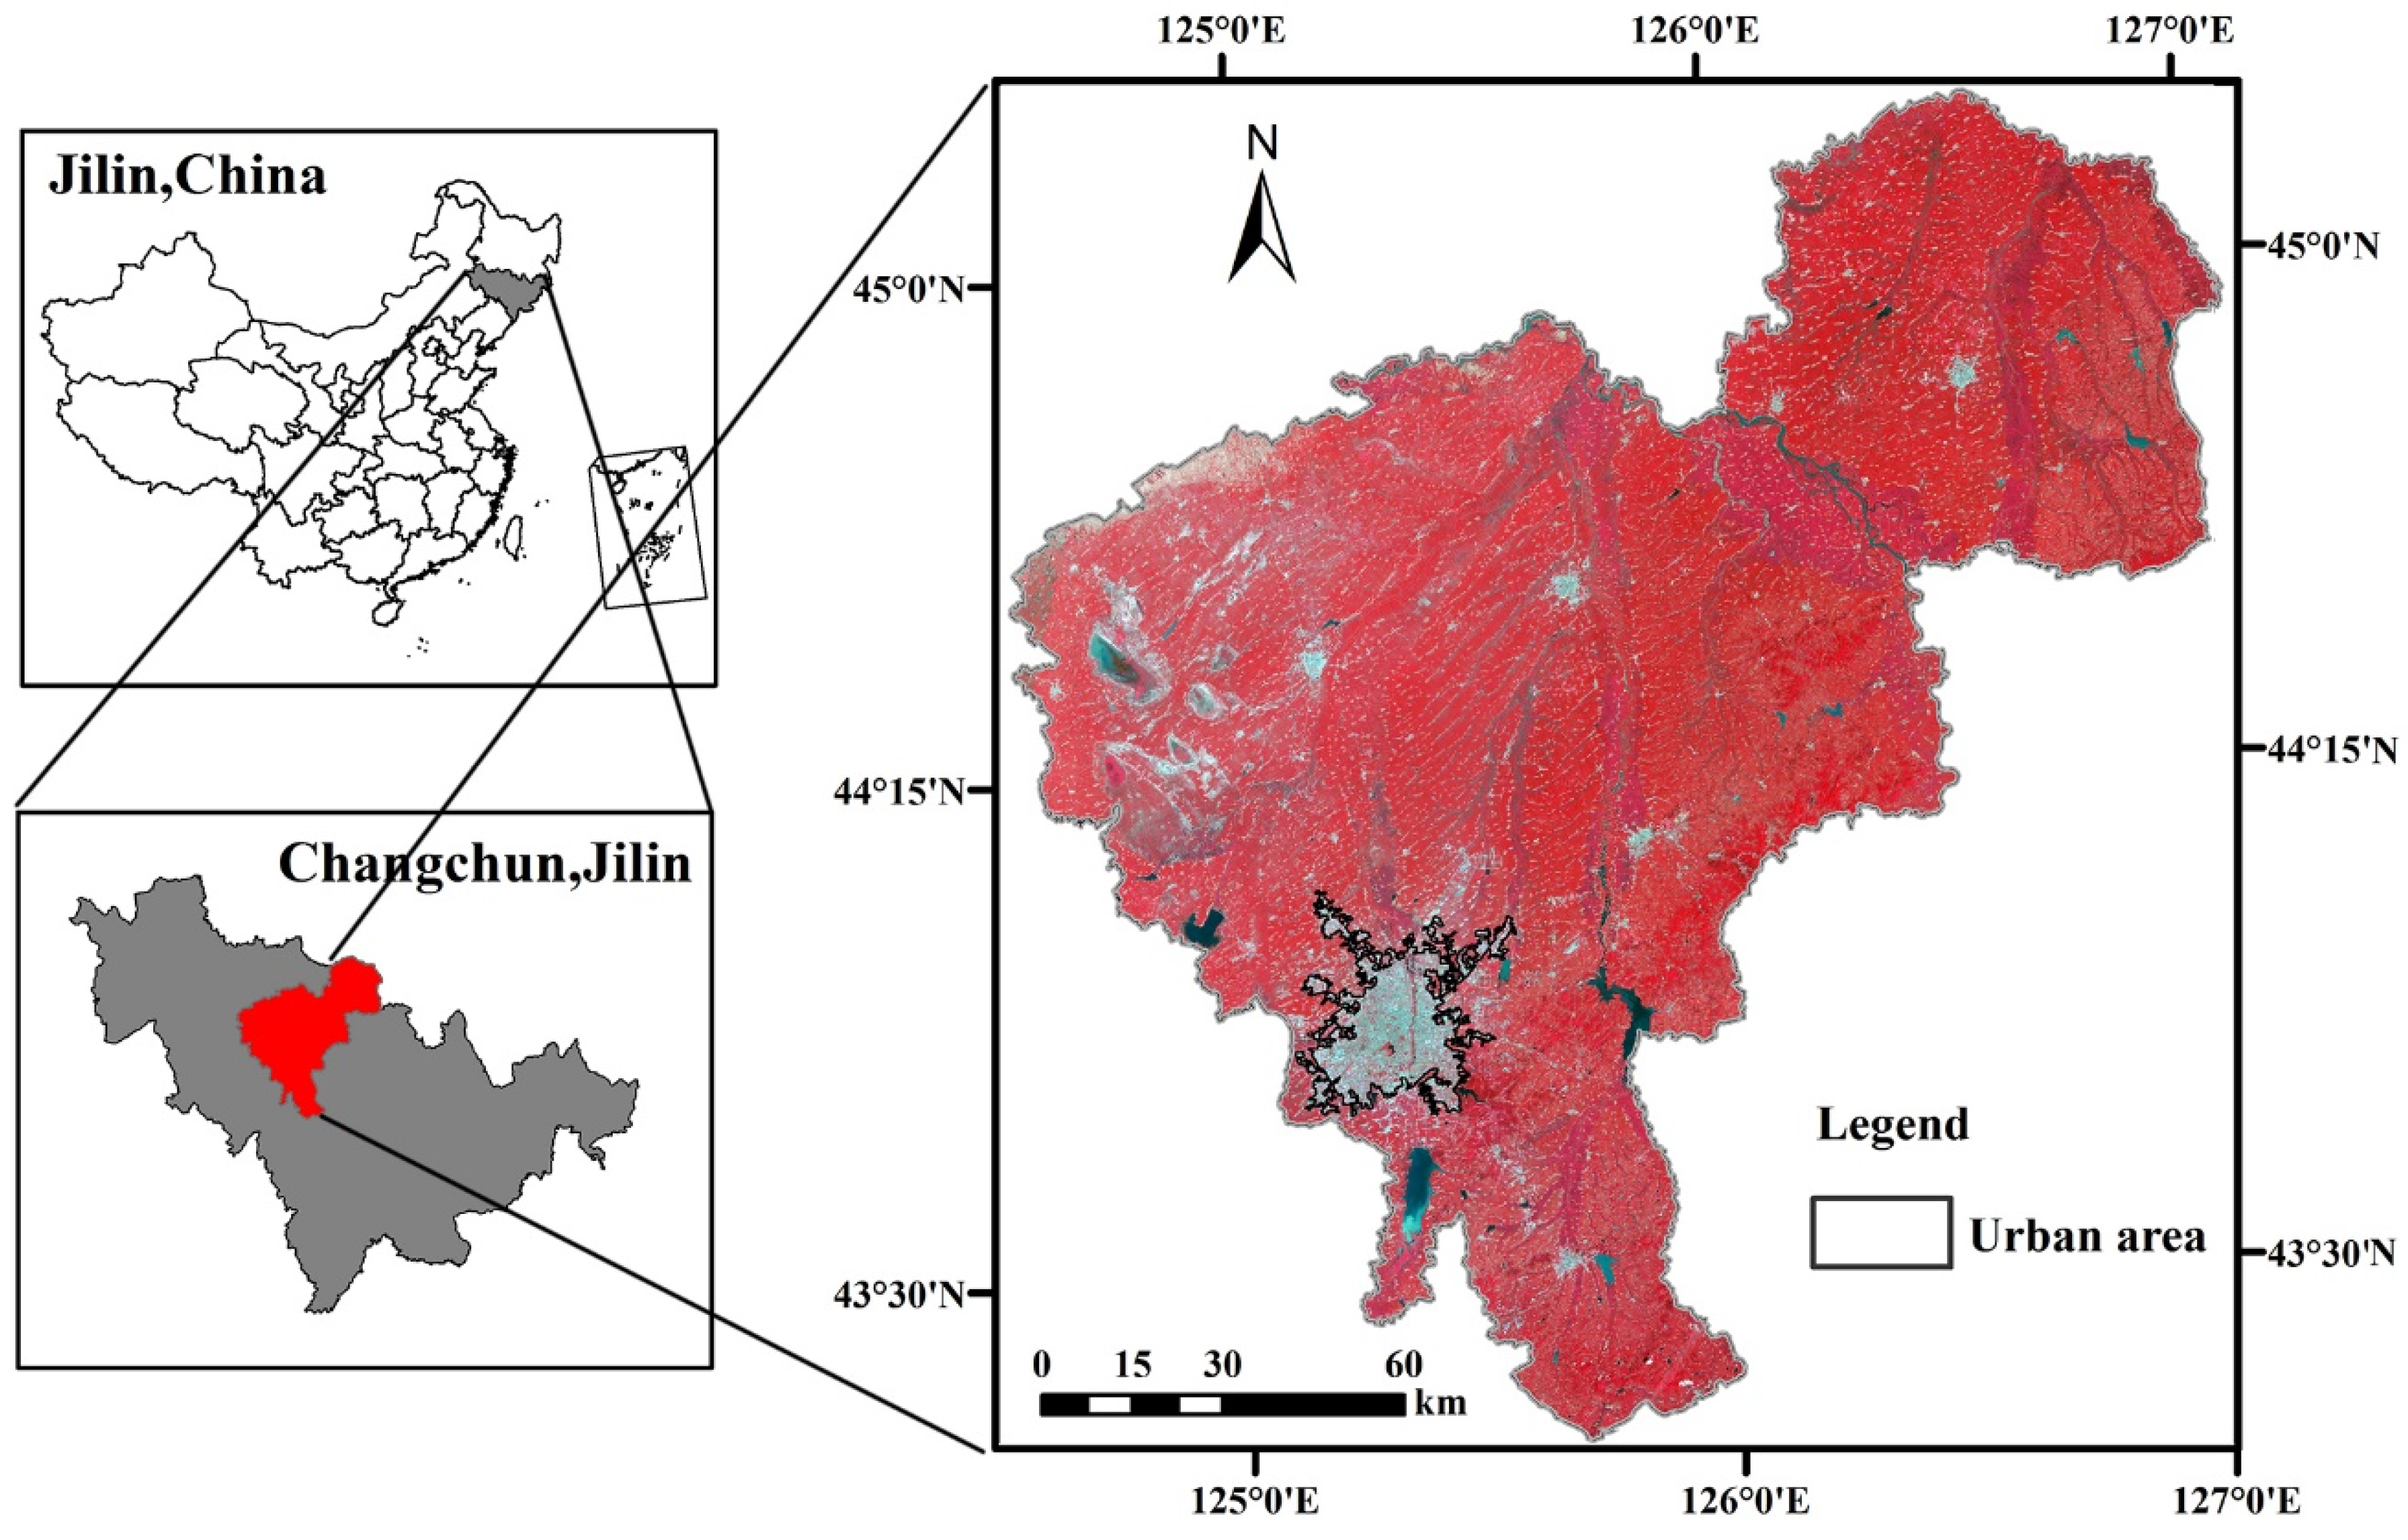
44]. However, information on UHI intensity characterized by air temperature in snowy climate cities needs to be strengthened to enrich the theoretical and case studies. Taking Changchun, which is a cold zone city with hot summers (June-August), as a case study, hourly air temperatures collected from 195 meteorological stations during August 1-31, 2015 were used to explore the hourly evolution of the UHI. The specific objectives were to (1) investigate the hourly variations of air temperature and UHI intensity to determine their differences and (2) analyze the air temperature differences among land use types to explore their different hourly cooling and warming rates. It is hoped that this study will enhance our understanding of the hourly variations of UHI and provide insights into UHI mitigation measures to benefit planners, decision makers, and dwellers.
4. Discussion
4.1. The Temporal Features of UHI Intensity
A better understanding of the fine temporal features of UHI intensity during the daytime could influence the suggested time for outdoor activities, preparation for the energy use of air conditioners and identification of the time when disease related to heat waves occur [
56,
57].
It was found in this study that the hourly variation of urban air temperature was very different from that of UHI intensity. High temperatures in a city do not indicate intense UHI intensity. In addition, during 08:00 and 13:00, approximately 40% of the days between August 1 and August 31 showed an “inverse” UHI intensity. This may have been due to the fact that there was a large area of bare soil with high air temperatures outside the urban area. For daytime and nighttime differences, Changchun exhibited a prominent nocturnal UHI effect with an average intensity of 1.51 °C, and the mean daytime UHI intensity was 0.49 °C. The phenomenon that nocturnal UHI intensity was stronger than that in the daytime was consistent with other studies [
58], even although Changchun is a snowy climate city.
UHI intensity is the temperature difference between urban and rural areas. It can be affected by external factors, such as solar radiation, wind speed, cloud cover, location, time of day, and season, and internal factors, such as the different materials in urban and rural areas and their sensitivities to the environment [
3,
5,
59]. For temporal variations, solar power plays an important role in the thermal environment [
60]. The difference in solar energy received by the Earth at different times is the most important driving force. During the nighttime, there is no solar energy, and the temperature is related to the latent heat flux [
21].
4.2. The Spatial Features of Air Temperatures
The spatial patterns of land use with different thermal characteristics can have an important influence on the distribution of the thermal environment [
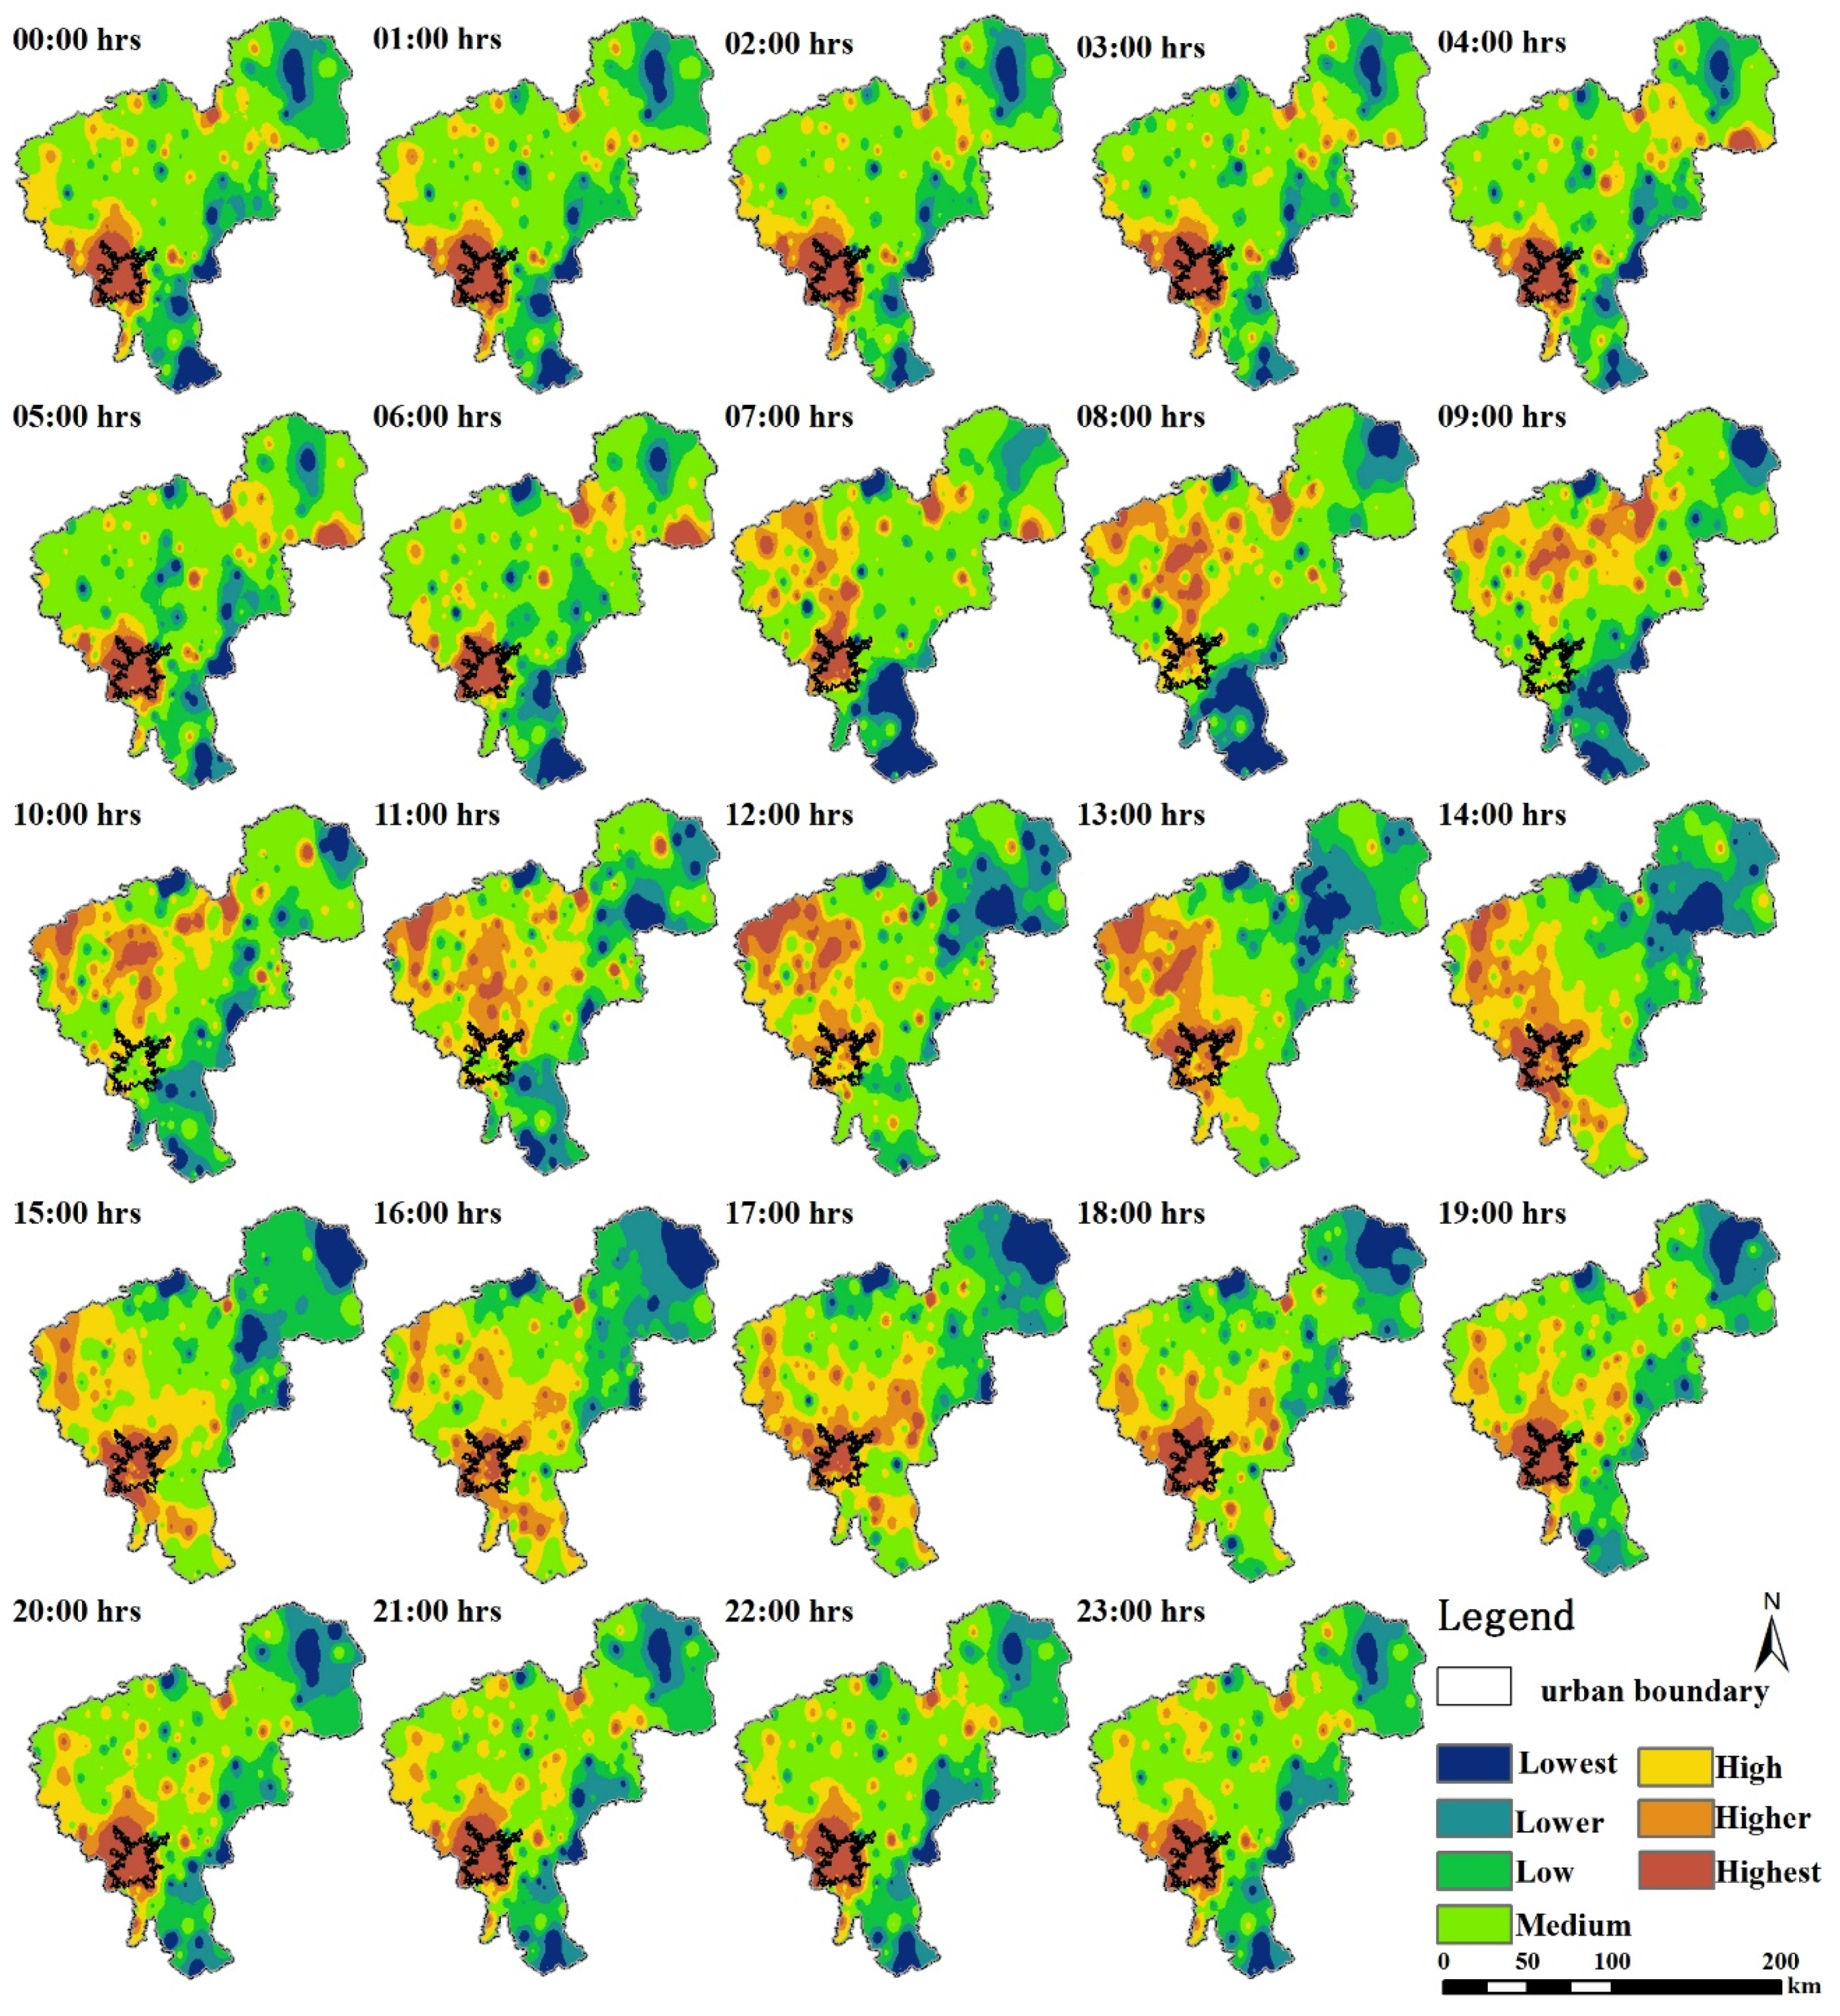
24]. In general, the urban area was warmer than the rural area most of the time during the hottest season, especially at nighttime. However, it was apparent that the thermal environment also varied significantly in different areas and at different hours (
Figure 4 and
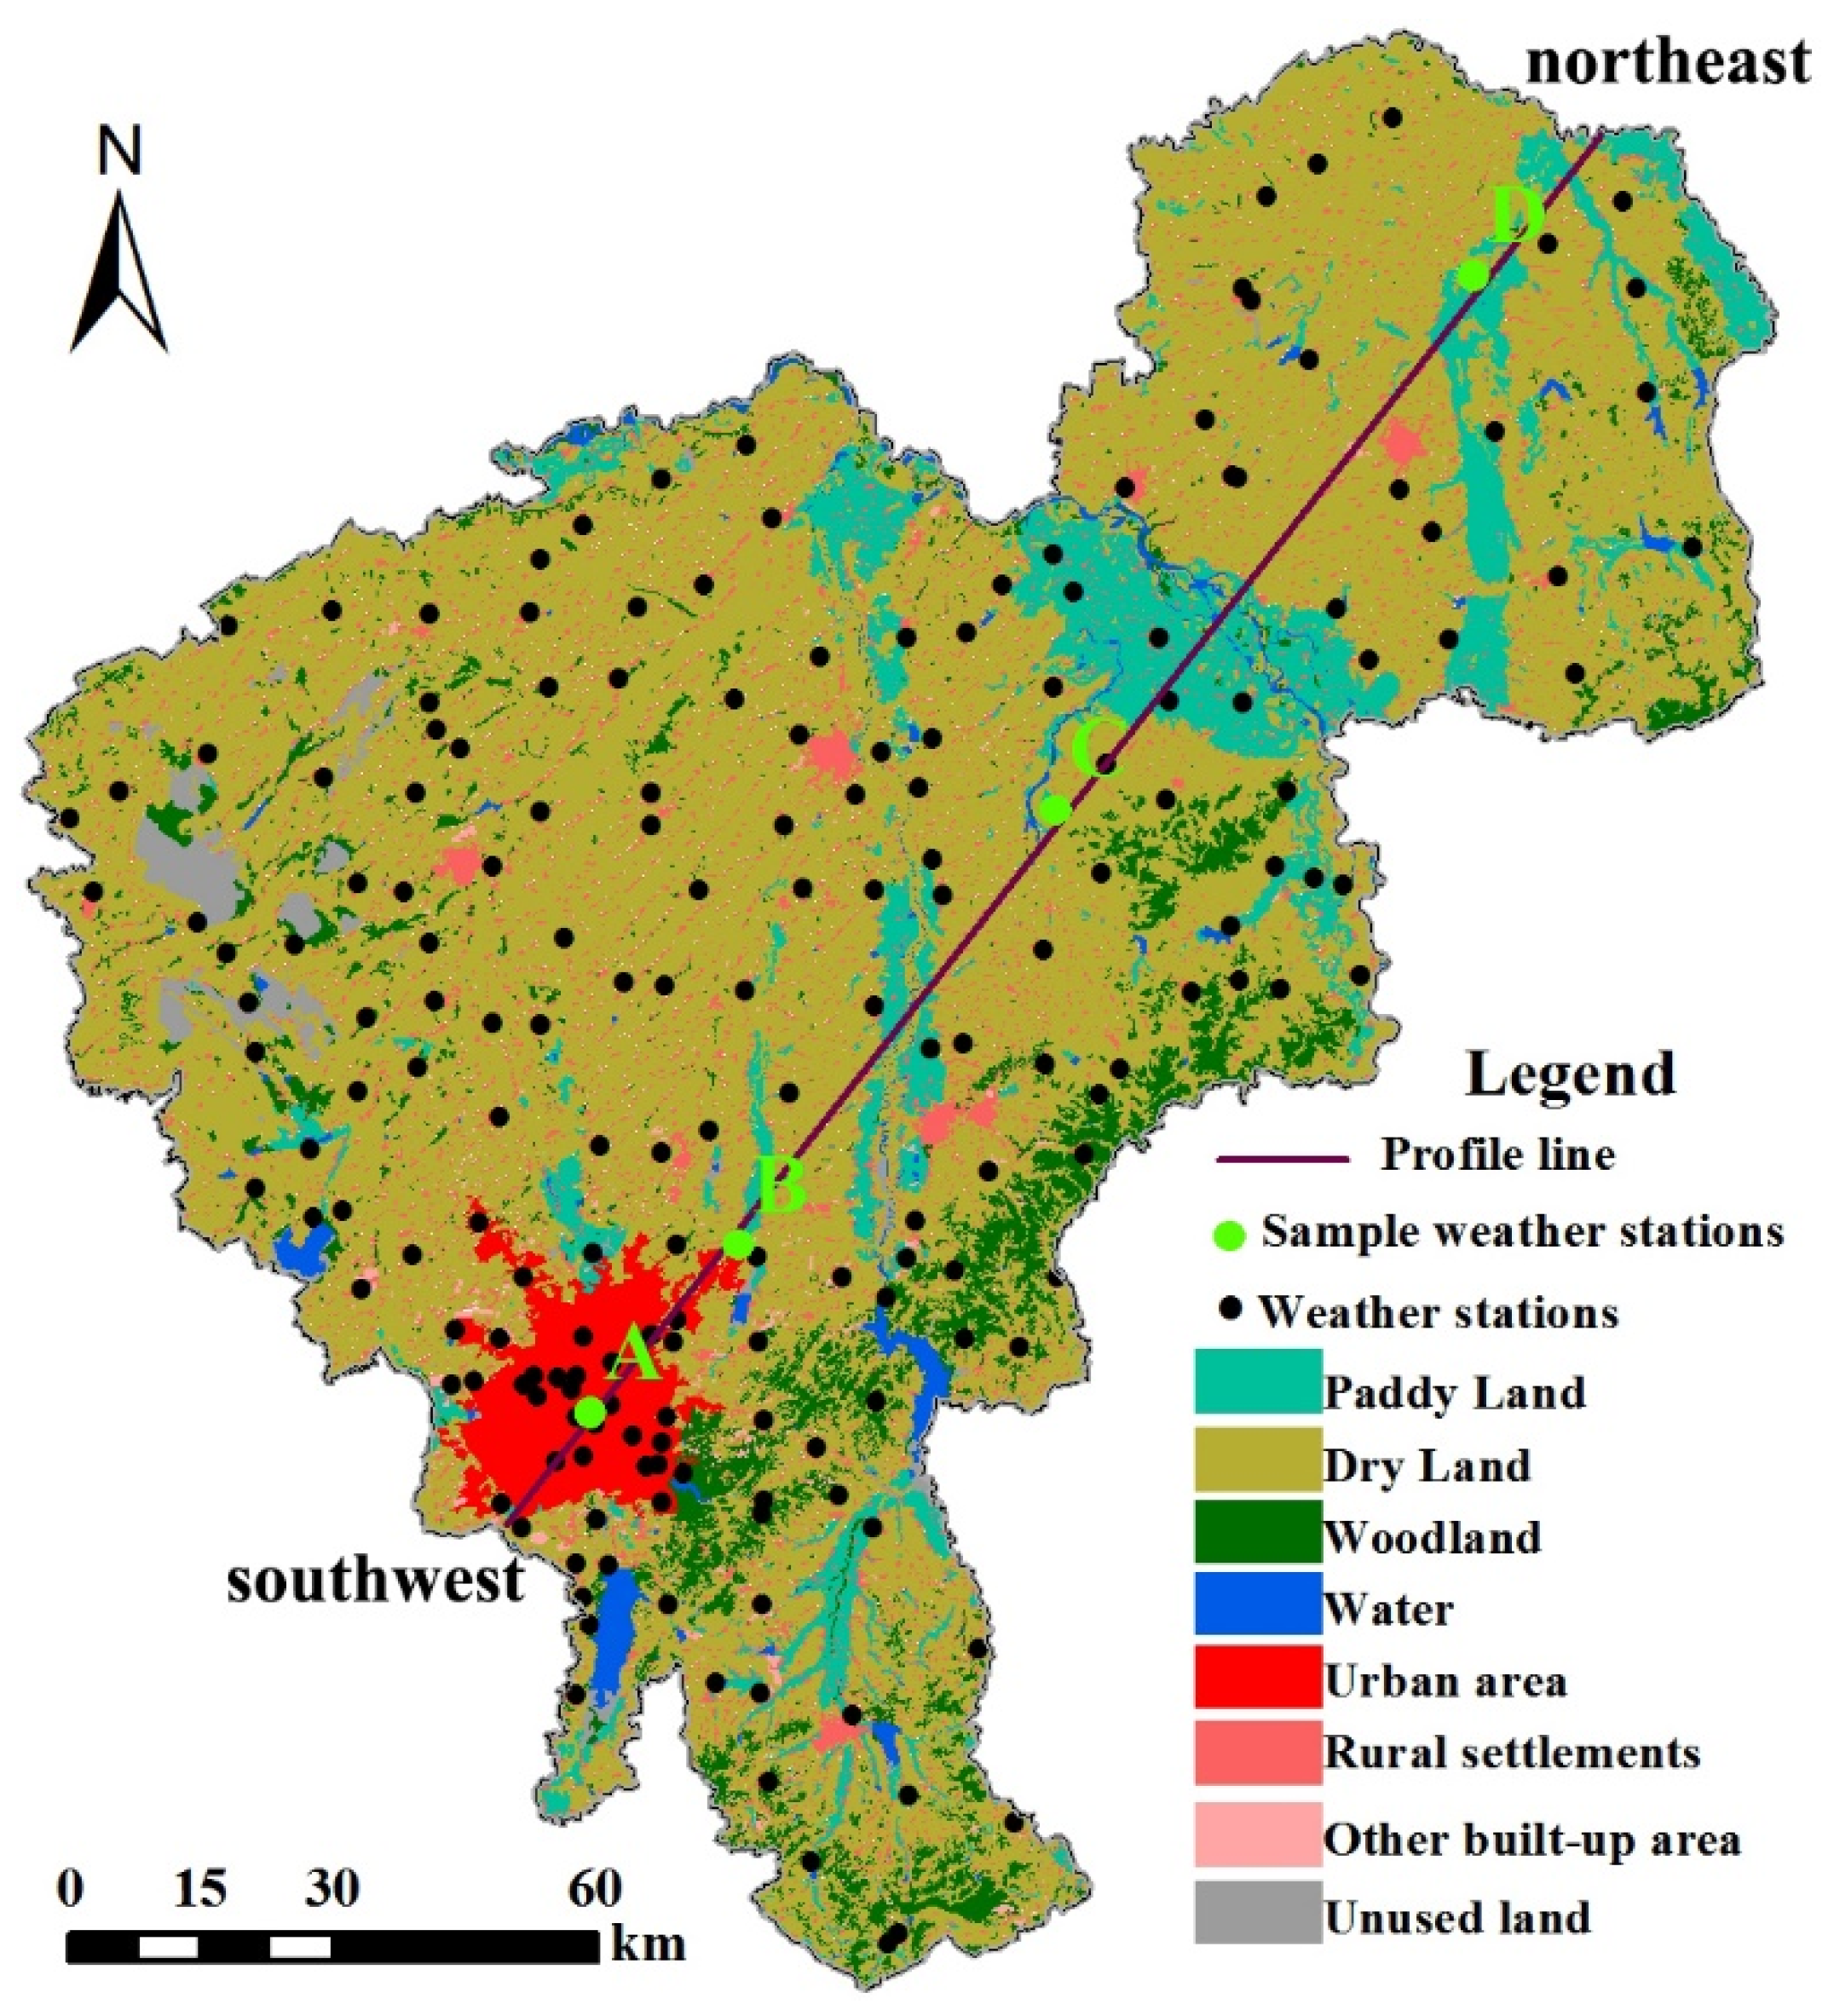
Figure 7). For spatial variations, there was a large difference between the urban area which consisted of mass asphalt, concrete, metal and glass that affected the thermal environment, and rural natural landscapes, such as forests and crops. Land use types with different thermal characteristics according to the changes of temperature explained the spatiotemporal variations to some extent, as also reported by Zhang [
61].
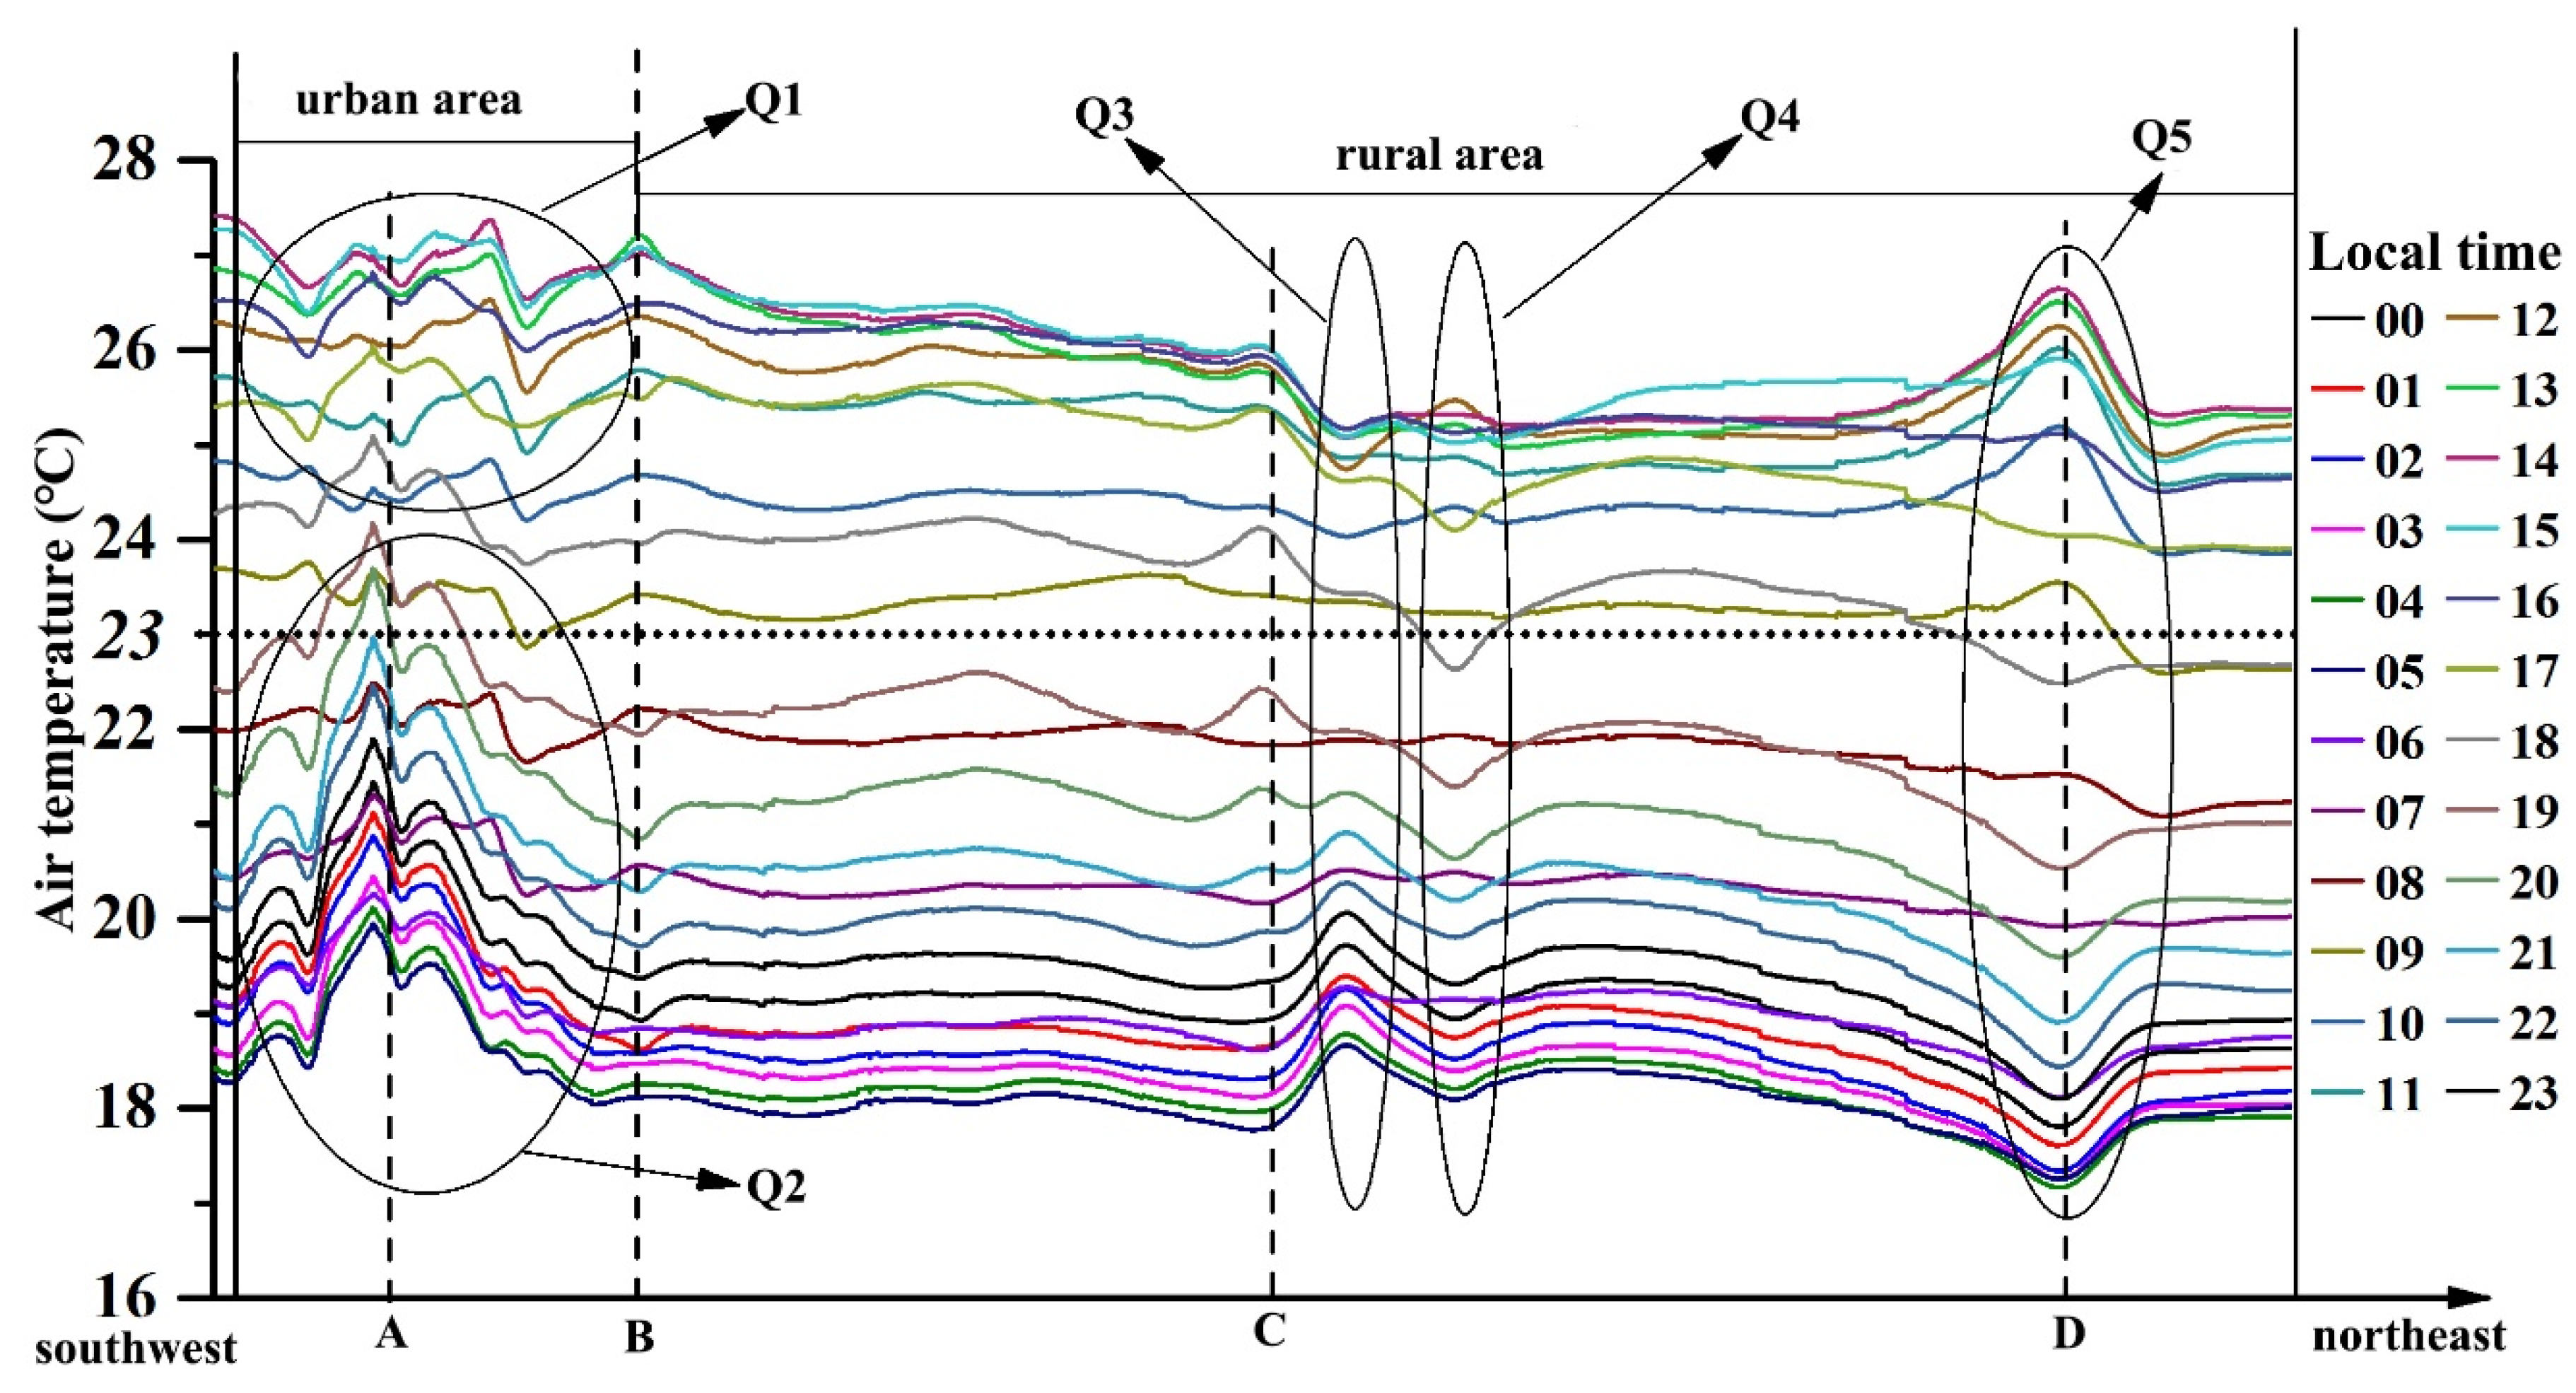
The mean temperatures of some of the rural stations were higher than those at station A during this period (
Figure 4d). One possible reason for this was that station A was located in a green space or other cooling land use types (parks), which had low temperatures in the city area. Another possible explanation was that the air temperature of some land use types, such as unused land (bare soil and sand), was high during the daytime.
Compared to the urban area, the rural area had a larger temperature range. For some bare land, the temperature could have been higher than that in the city; meanwhile, there was a large amount of woodland and paddy land in rural areas whose temperatures were always lower than those in the urban area. In addition, the higher latitude in the northeast part with less solar energy may have also caused low temperatures.
The cause of the higher air temperature in the city area could have been partially explained by mass anthropogenic heat, heat stored and re-radiated by urban buildings with high heat flux [
62], and lack of green spaces. However, as described in
Section 3.4, when the air temperature of dry land was higher than 23 °C, it seemed that the temperature differences between the urban and rural areas were small and the urban area did not show regular patterns. It could be inferred that 23 °C was the threshold in this case as the air temperature profiles showed different trends. The UHI intensity would not have been severe when the temperature was higher than 23 °C. One possible reason for this was that the land use was not sensitive to high temperature when the air temperature was higher than 23 °C.
4.3. The Warming and Cooling Rates of Different Land Use
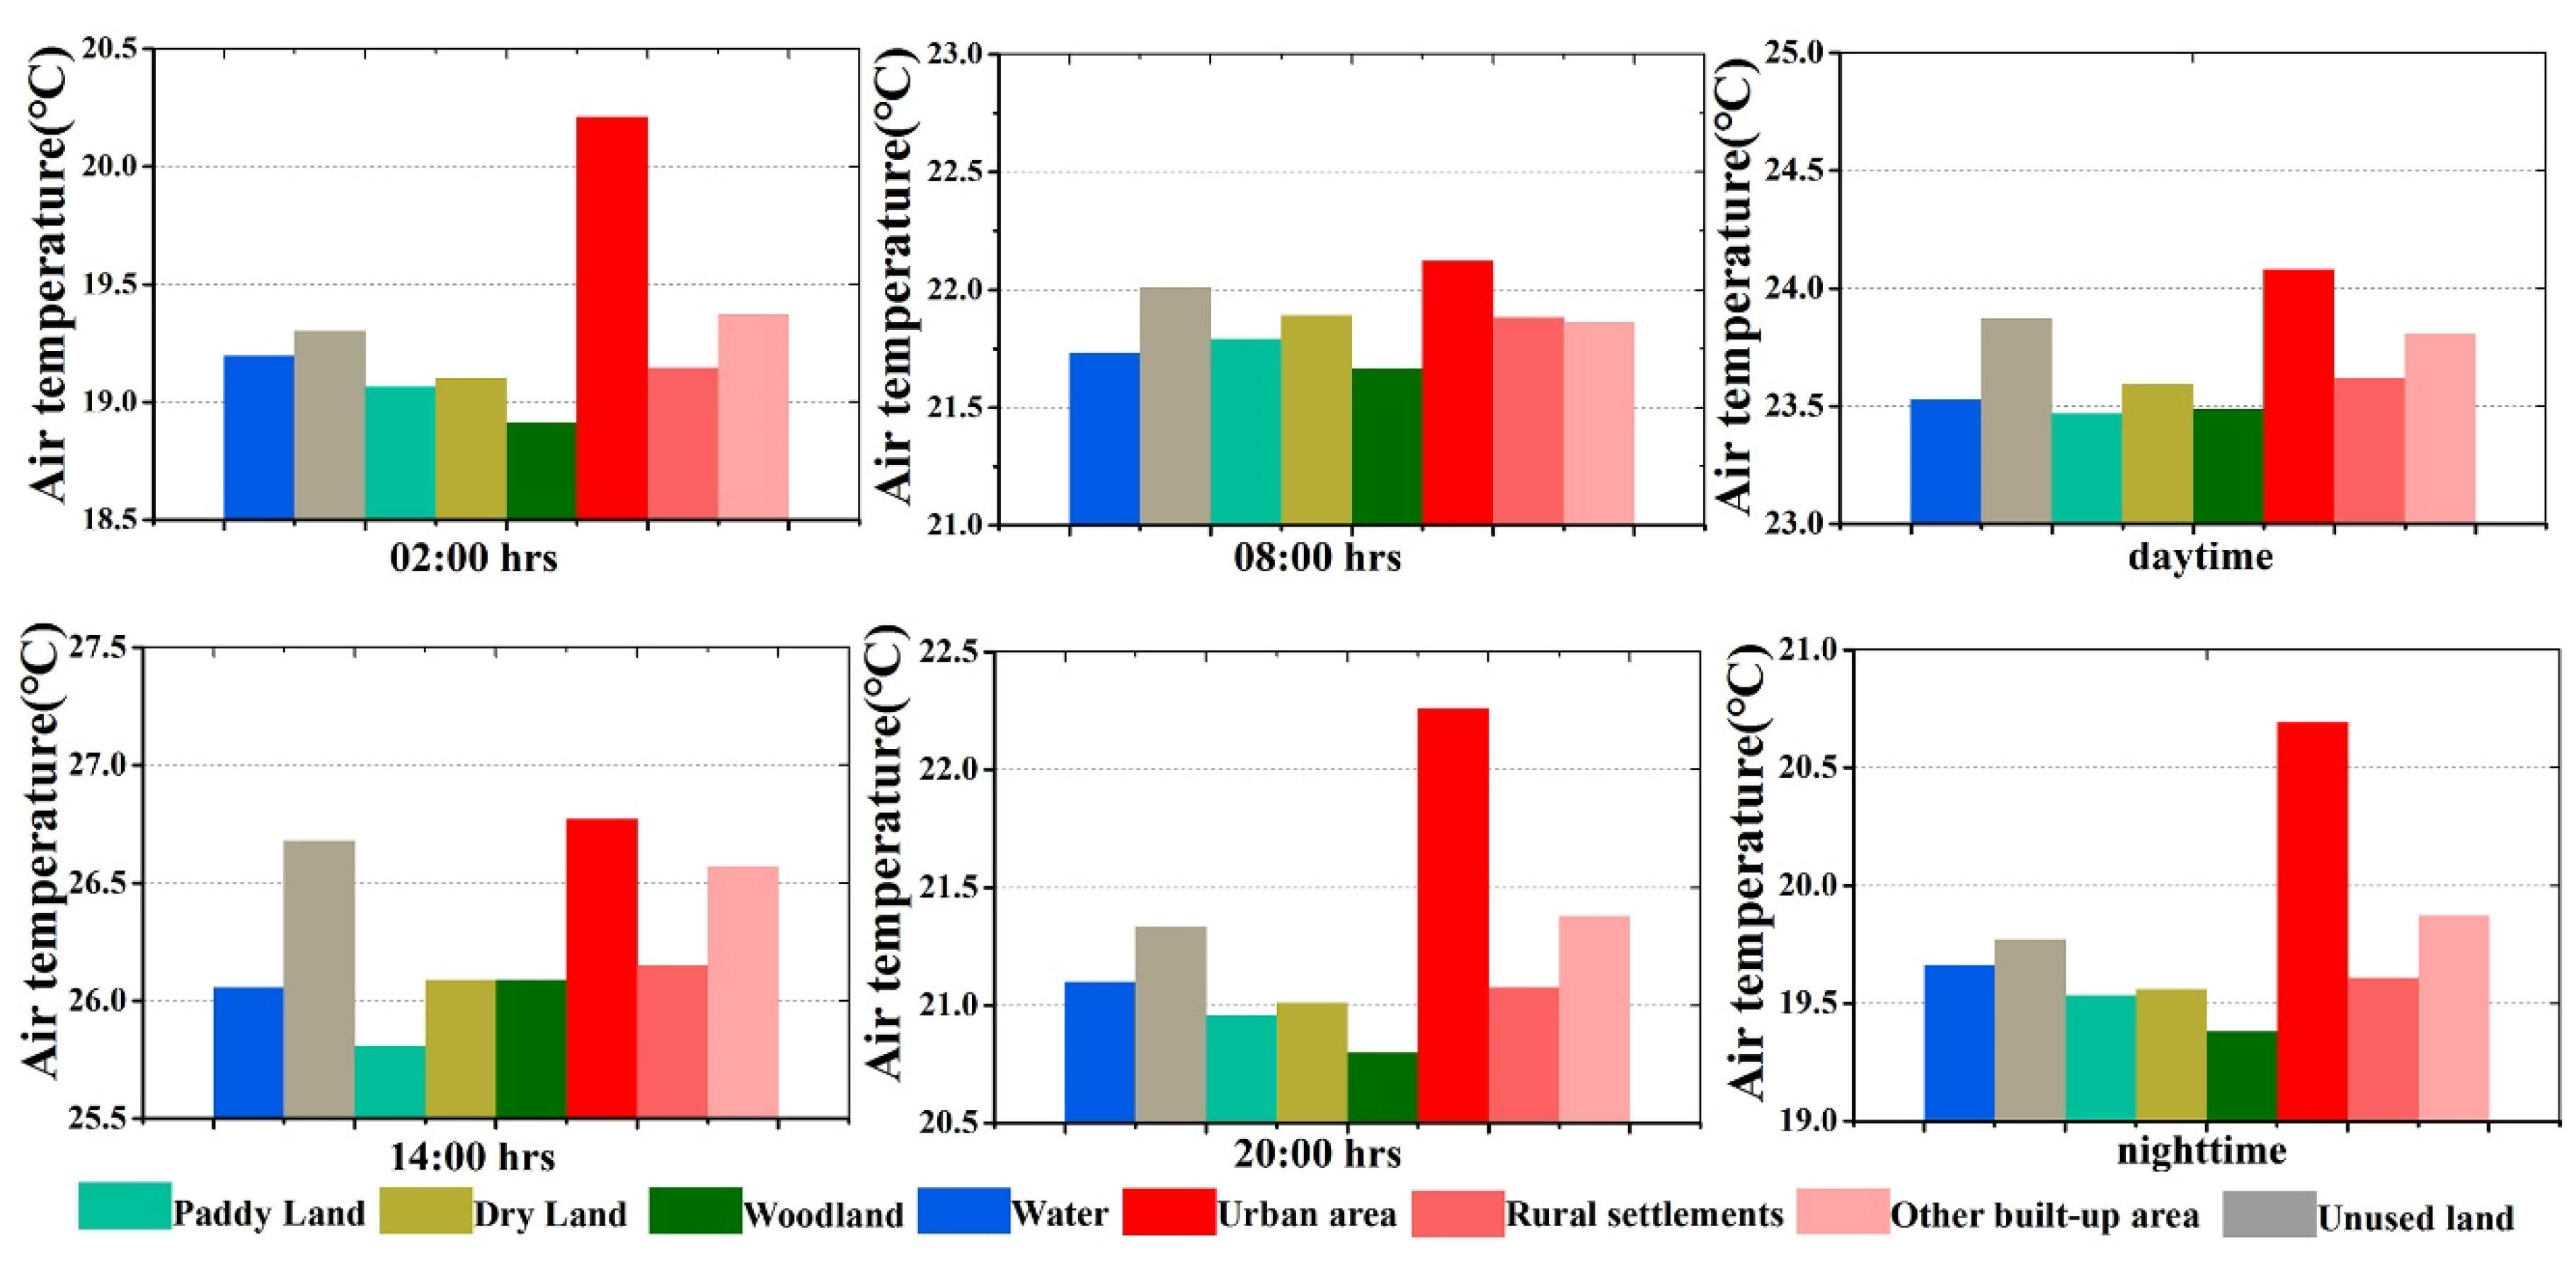
Different land use types usually have different thermal variations and heat capacities. As mentioned, the daytime UHI intensity was much weaker than that of the nighttime, and began to decline quickly after sunrise.
When we examined the warming rates around sunrise (05:00), as expected, the urban area had the smallest warming rate of 0.62 °C/h from 05:00 to 06:00. Meanwhile, the warming rate of rural land use at this time was greater than 0.74 °C/h with the largest value of 0.9 °C/h for unused land. In the next four hours (from 06:00 to 10:00), all the land use types had very high warming rates of over 1.20 °C/h. During this period, from highest to lowest, the warming rates of unused land, dry land, rural settlements, paddy, woodland, other built-up area and urban area were 1.39, 1.37, 1.37, 1.35, 1.35, 1.34, 1.33 and 1.22 °C/h, respectively. During this period, warming rates in the rural area were larger than those in the urban areas, thereby meaning that urban area was not the hottest zone. After 10:00, the urban area again had higher warming rates than rural areas until 15:00 when their temperatures became to decline. After sunset, the variations of cooling rates were different from warming rates. Although the cooling rates at both the urban and rural sites were greater around sunset than during other times, the cooling rates of the urban area was much smaller than those of the rural areas. As a result, the temperature of the rural areas declined sharply. In particular, the cooling rates of the woodland from 18:00 to 19:00 reached as high as −1.77 °C/h.
For the rural areas, the temperature declined quickly without energy input after sunset. For the urban area, owing to the large building heat capacity, heat emitted by vehicles, air conditioners, and the lack of vegetation, cities contained more heat and exhibited little latent heat of vaporization [
3]. As a result, the UHI intensity tended to be much stronger at nighttime. However, some studies showed that the daytime UHI intensity was greater by using LST to characterize the SUHI [
63]. In the daytime in our study, there were some unused land types consisting of bare soil and saline land in the northwest part, the high temperatures of which made the UHI intensity not that severe in the late morning to noon (from 08:00 to 12:00).
Figure 11 shows that the total land use TD presented negative correlations with both urban and rural temperatures. However, the influence of rural temperature on the total land use TD was stronger than that of the urban temperature. It seemed that with the increase in temperature, the temperature difference between land use types became smaller.
4.4. Limitations
It should be noted that there may have been some limitations in this study. Although there were enough weather stations in this study, the interpolation maps may have yielded some inaccurate results. There were no weather stations in or near the water area. As a result, the temperature of the water body may not have been accurately modelled or represented. There are many factors that can affect the thermal environment, and more factors should be considered in future studies, such as the differences among rainy days, cloudy days, and days with gale weather. In addition, more detailed urban information should be considered to determine the variation of UHI intensity, for example, the use of local climate zone could be a good choice. Therefore, traditional observations with new technology, such as high spatial resolution remote sensing and thermal infrared remote sensing may provide a more comprehensive understanding of the mechanism of the UHI effect with efforts from different fields.


