Spatiotemporal Variability and Influencing Factors of Aerosol Optical Depth over the Pan Yangtze River Delta during the 2014–2017 Period

 ,
,  ,
,  ,
,
Abstract
1. Introduction
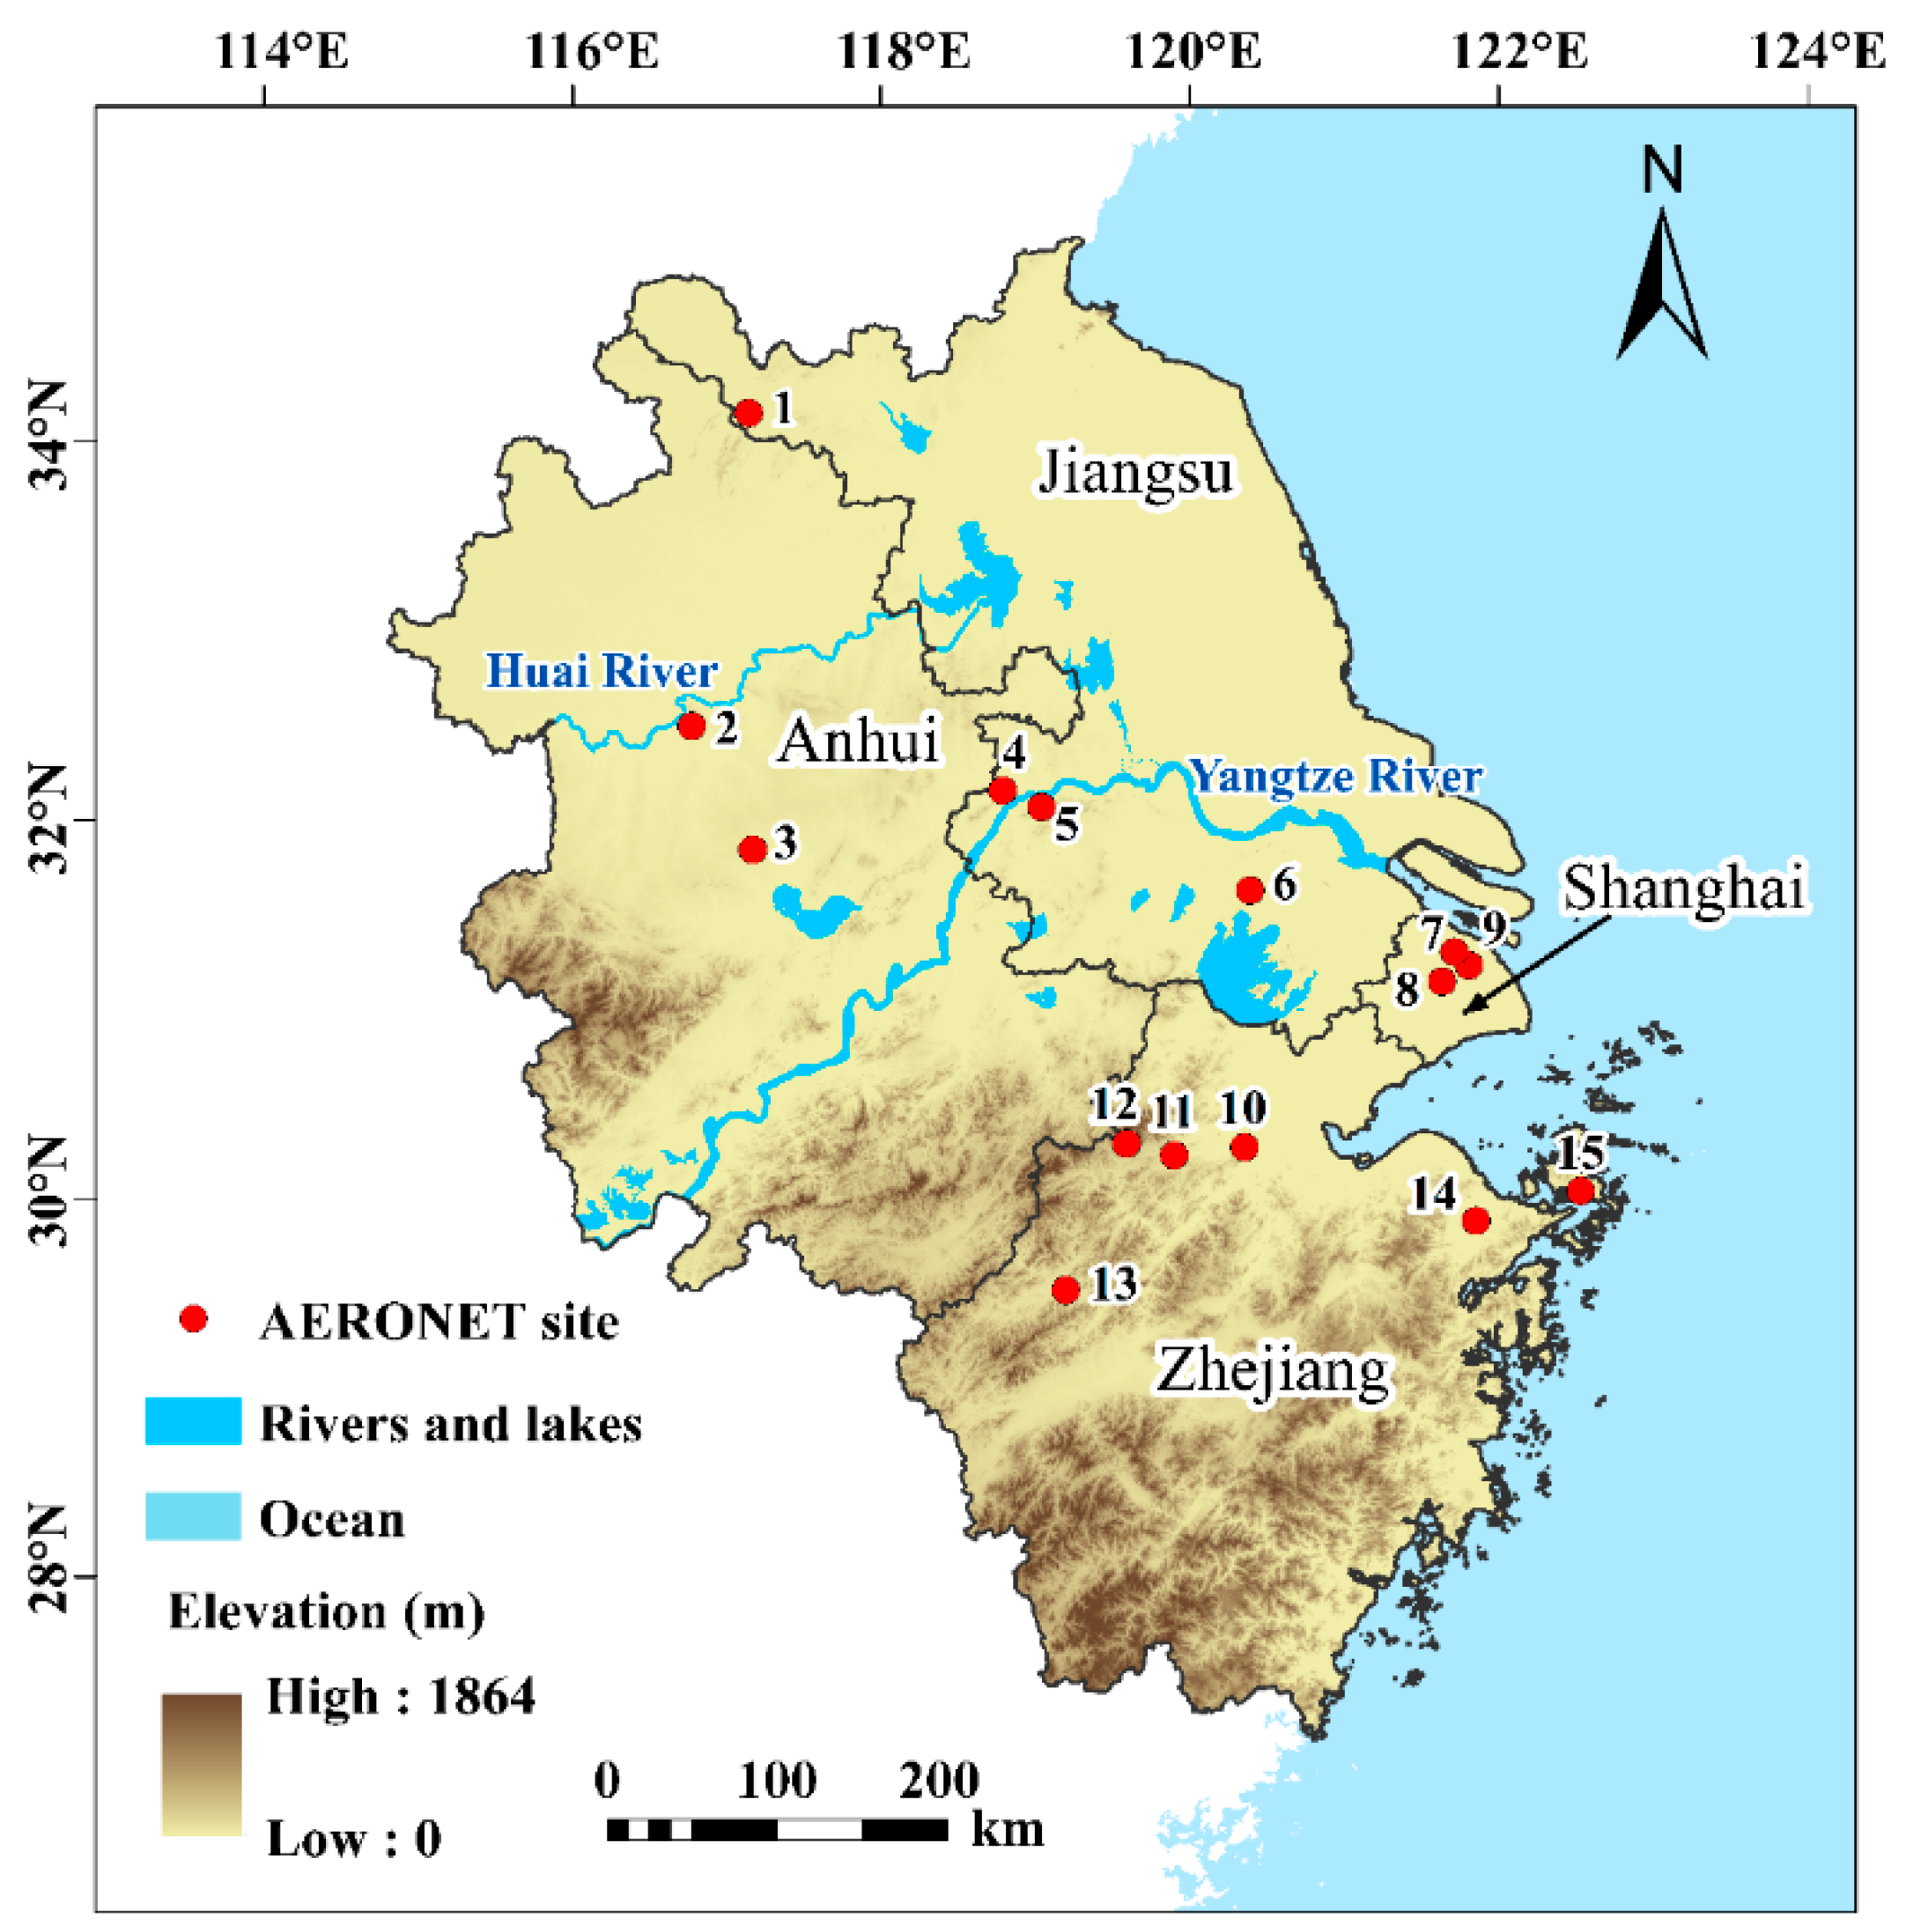
2. Study Area
3. Data and Methods
3.1. Data
3.1.1. MODIS AOD Data
3.1.2. AERONET AOD Data
3.1.3. Auxiliary Data
3.2. Methodology
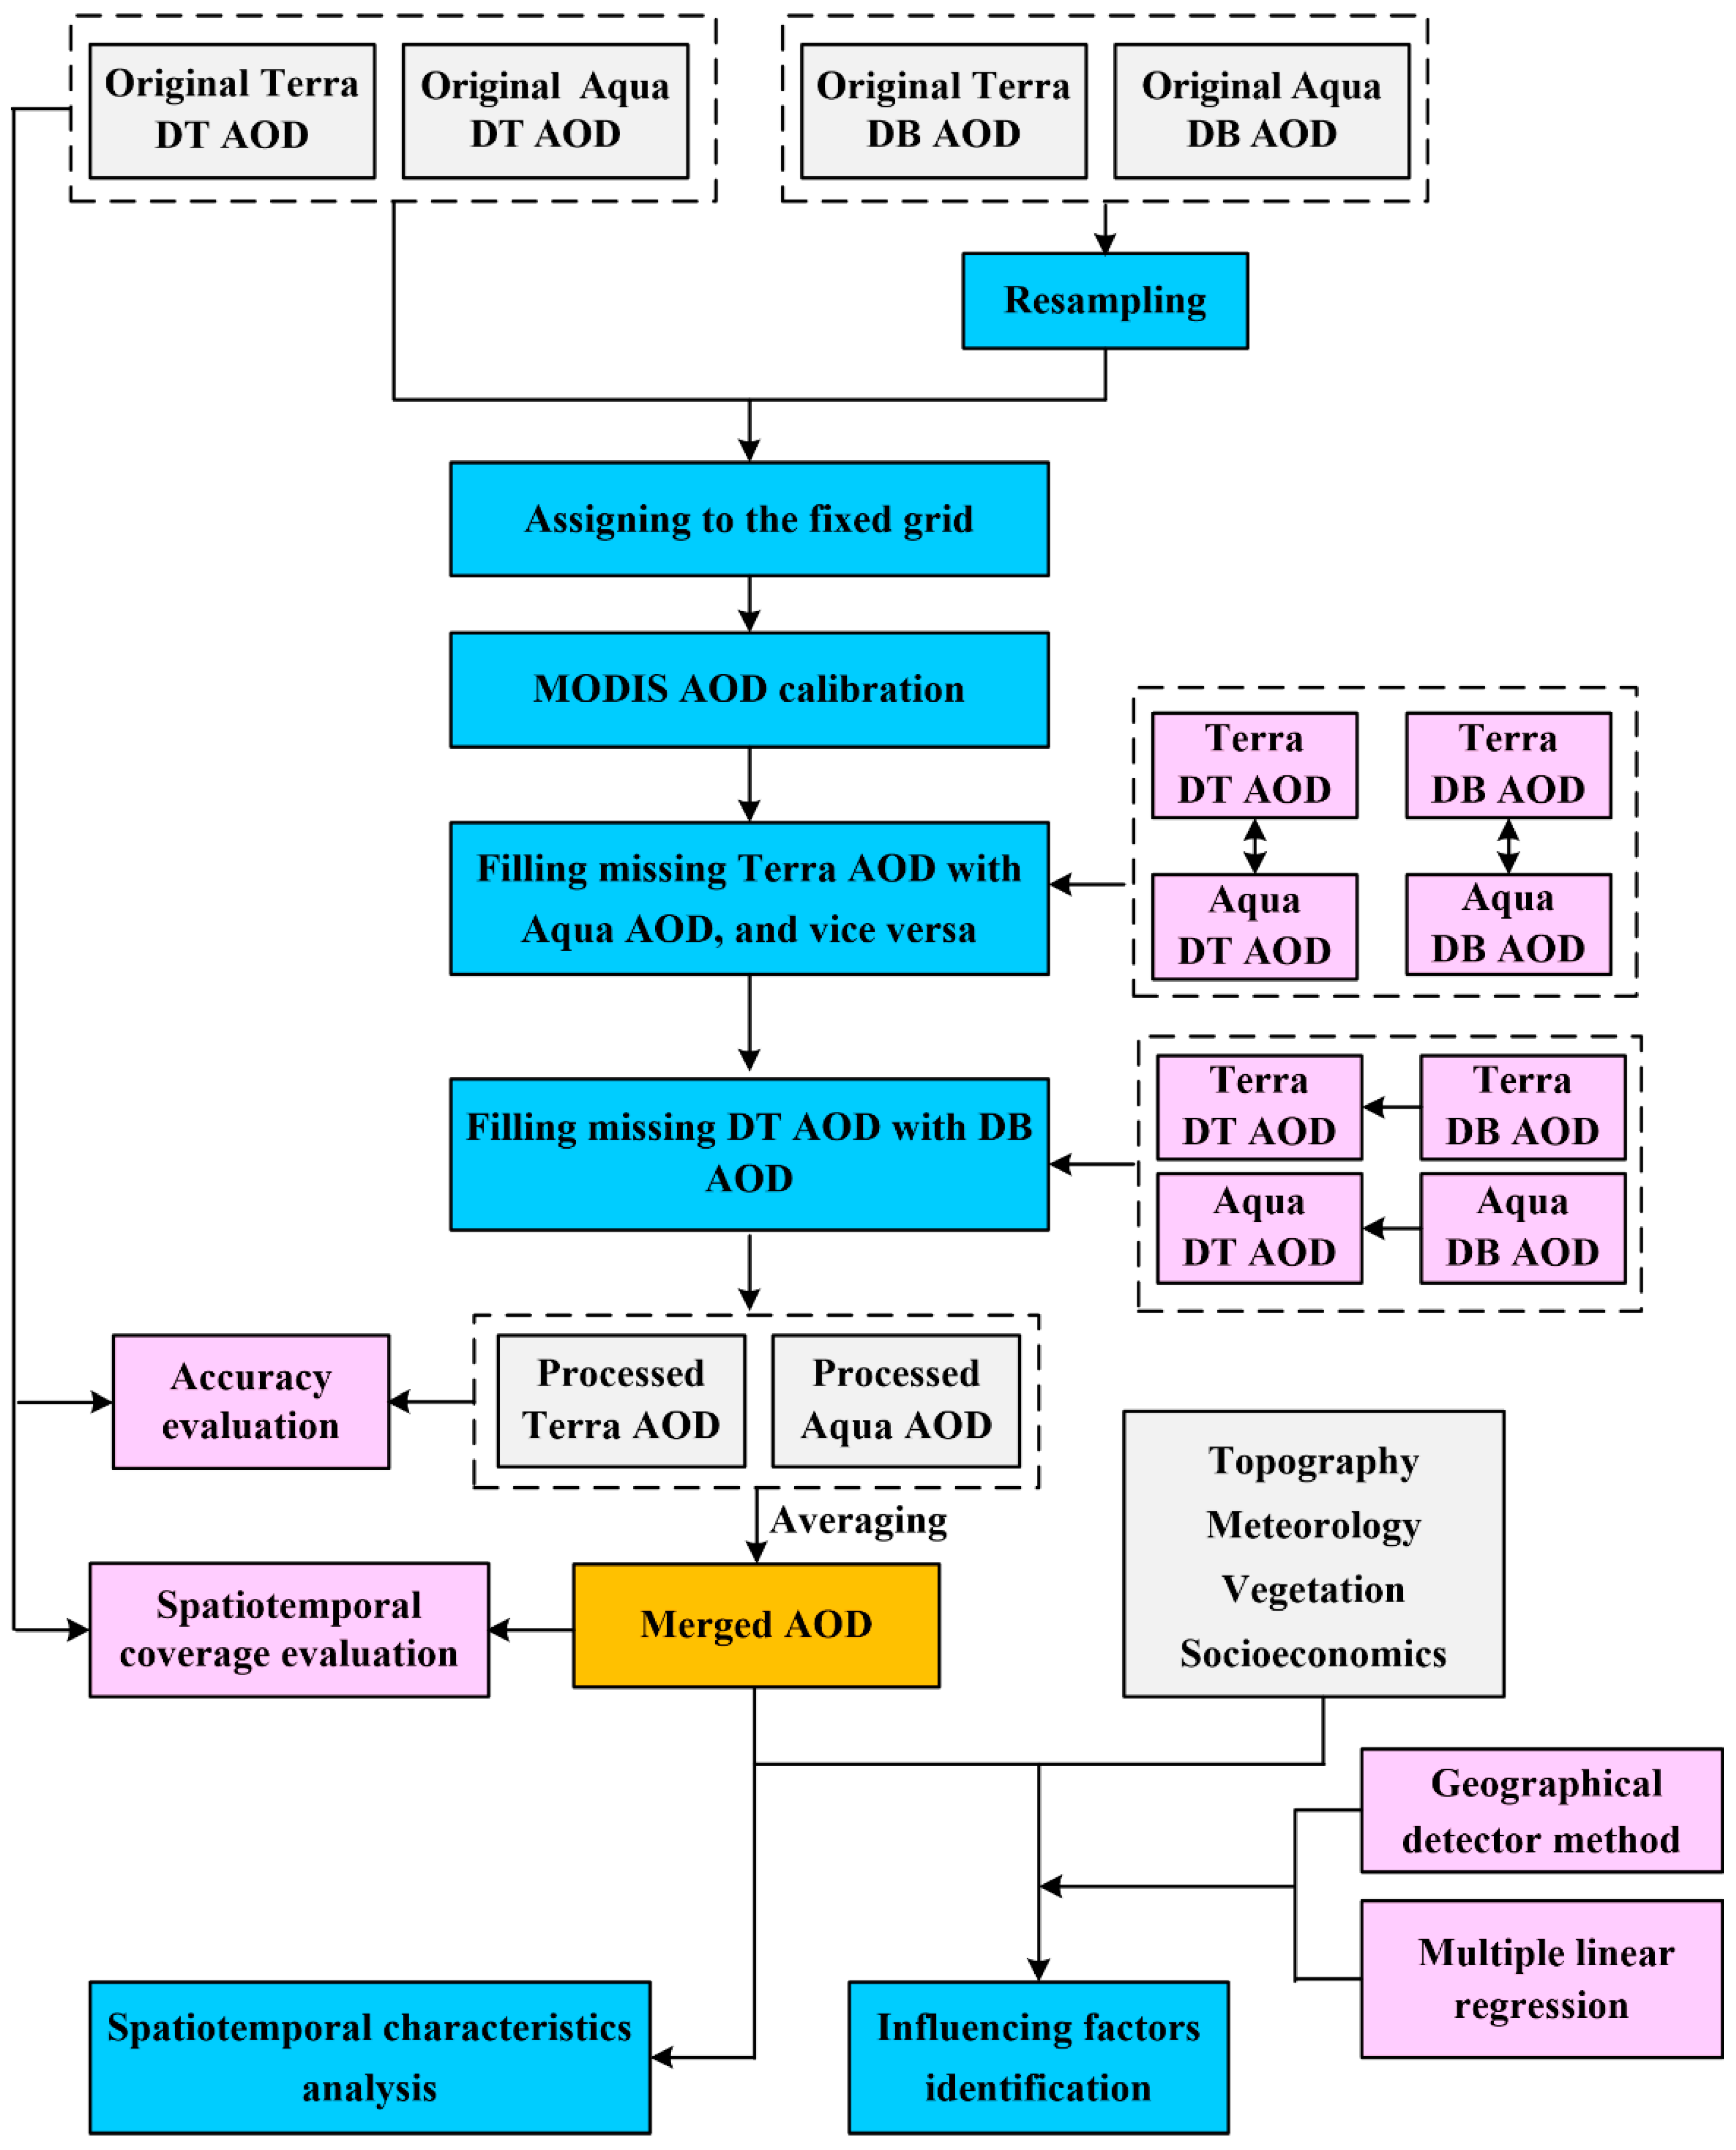
3.2.1. MODIS AOD Merging
3.2.2. Merged AOD Evaluation
3.2.3. Data Integration
3.2.4. Influencing Factors Identification
4. Results
4.1. Evaluation of the Merged AOD
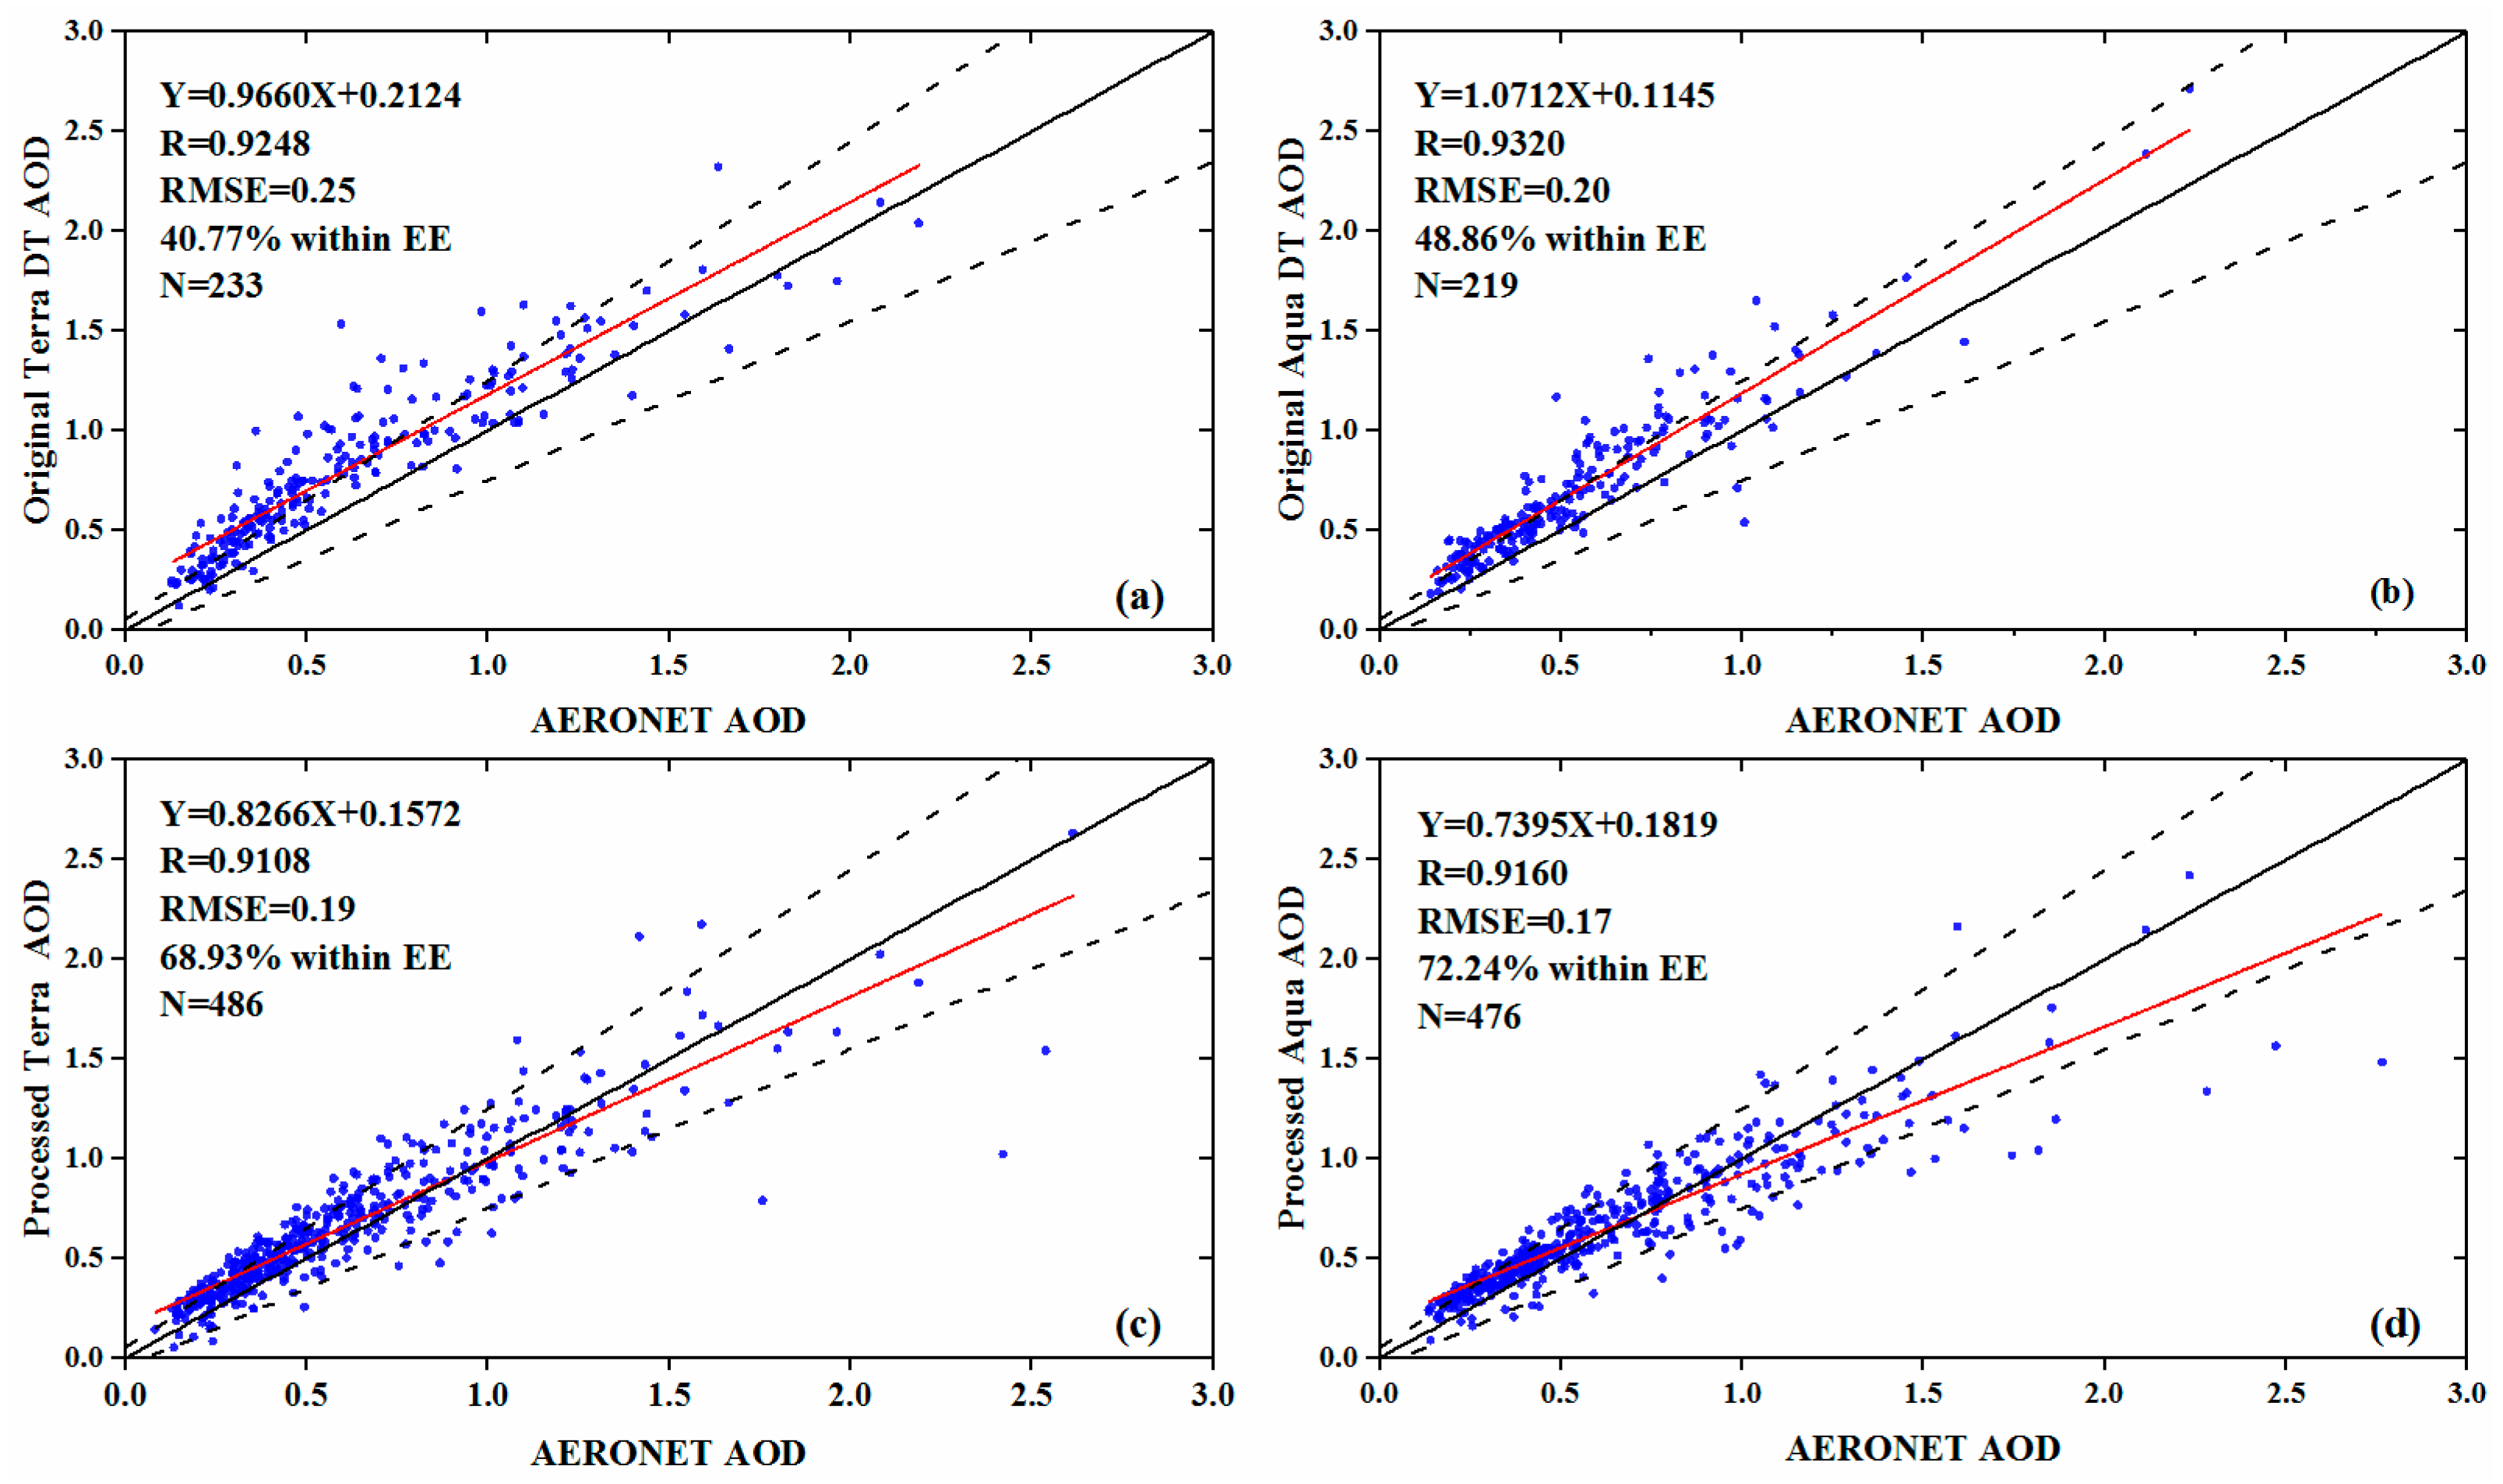
4.1.1. Validation of the Merged AOD
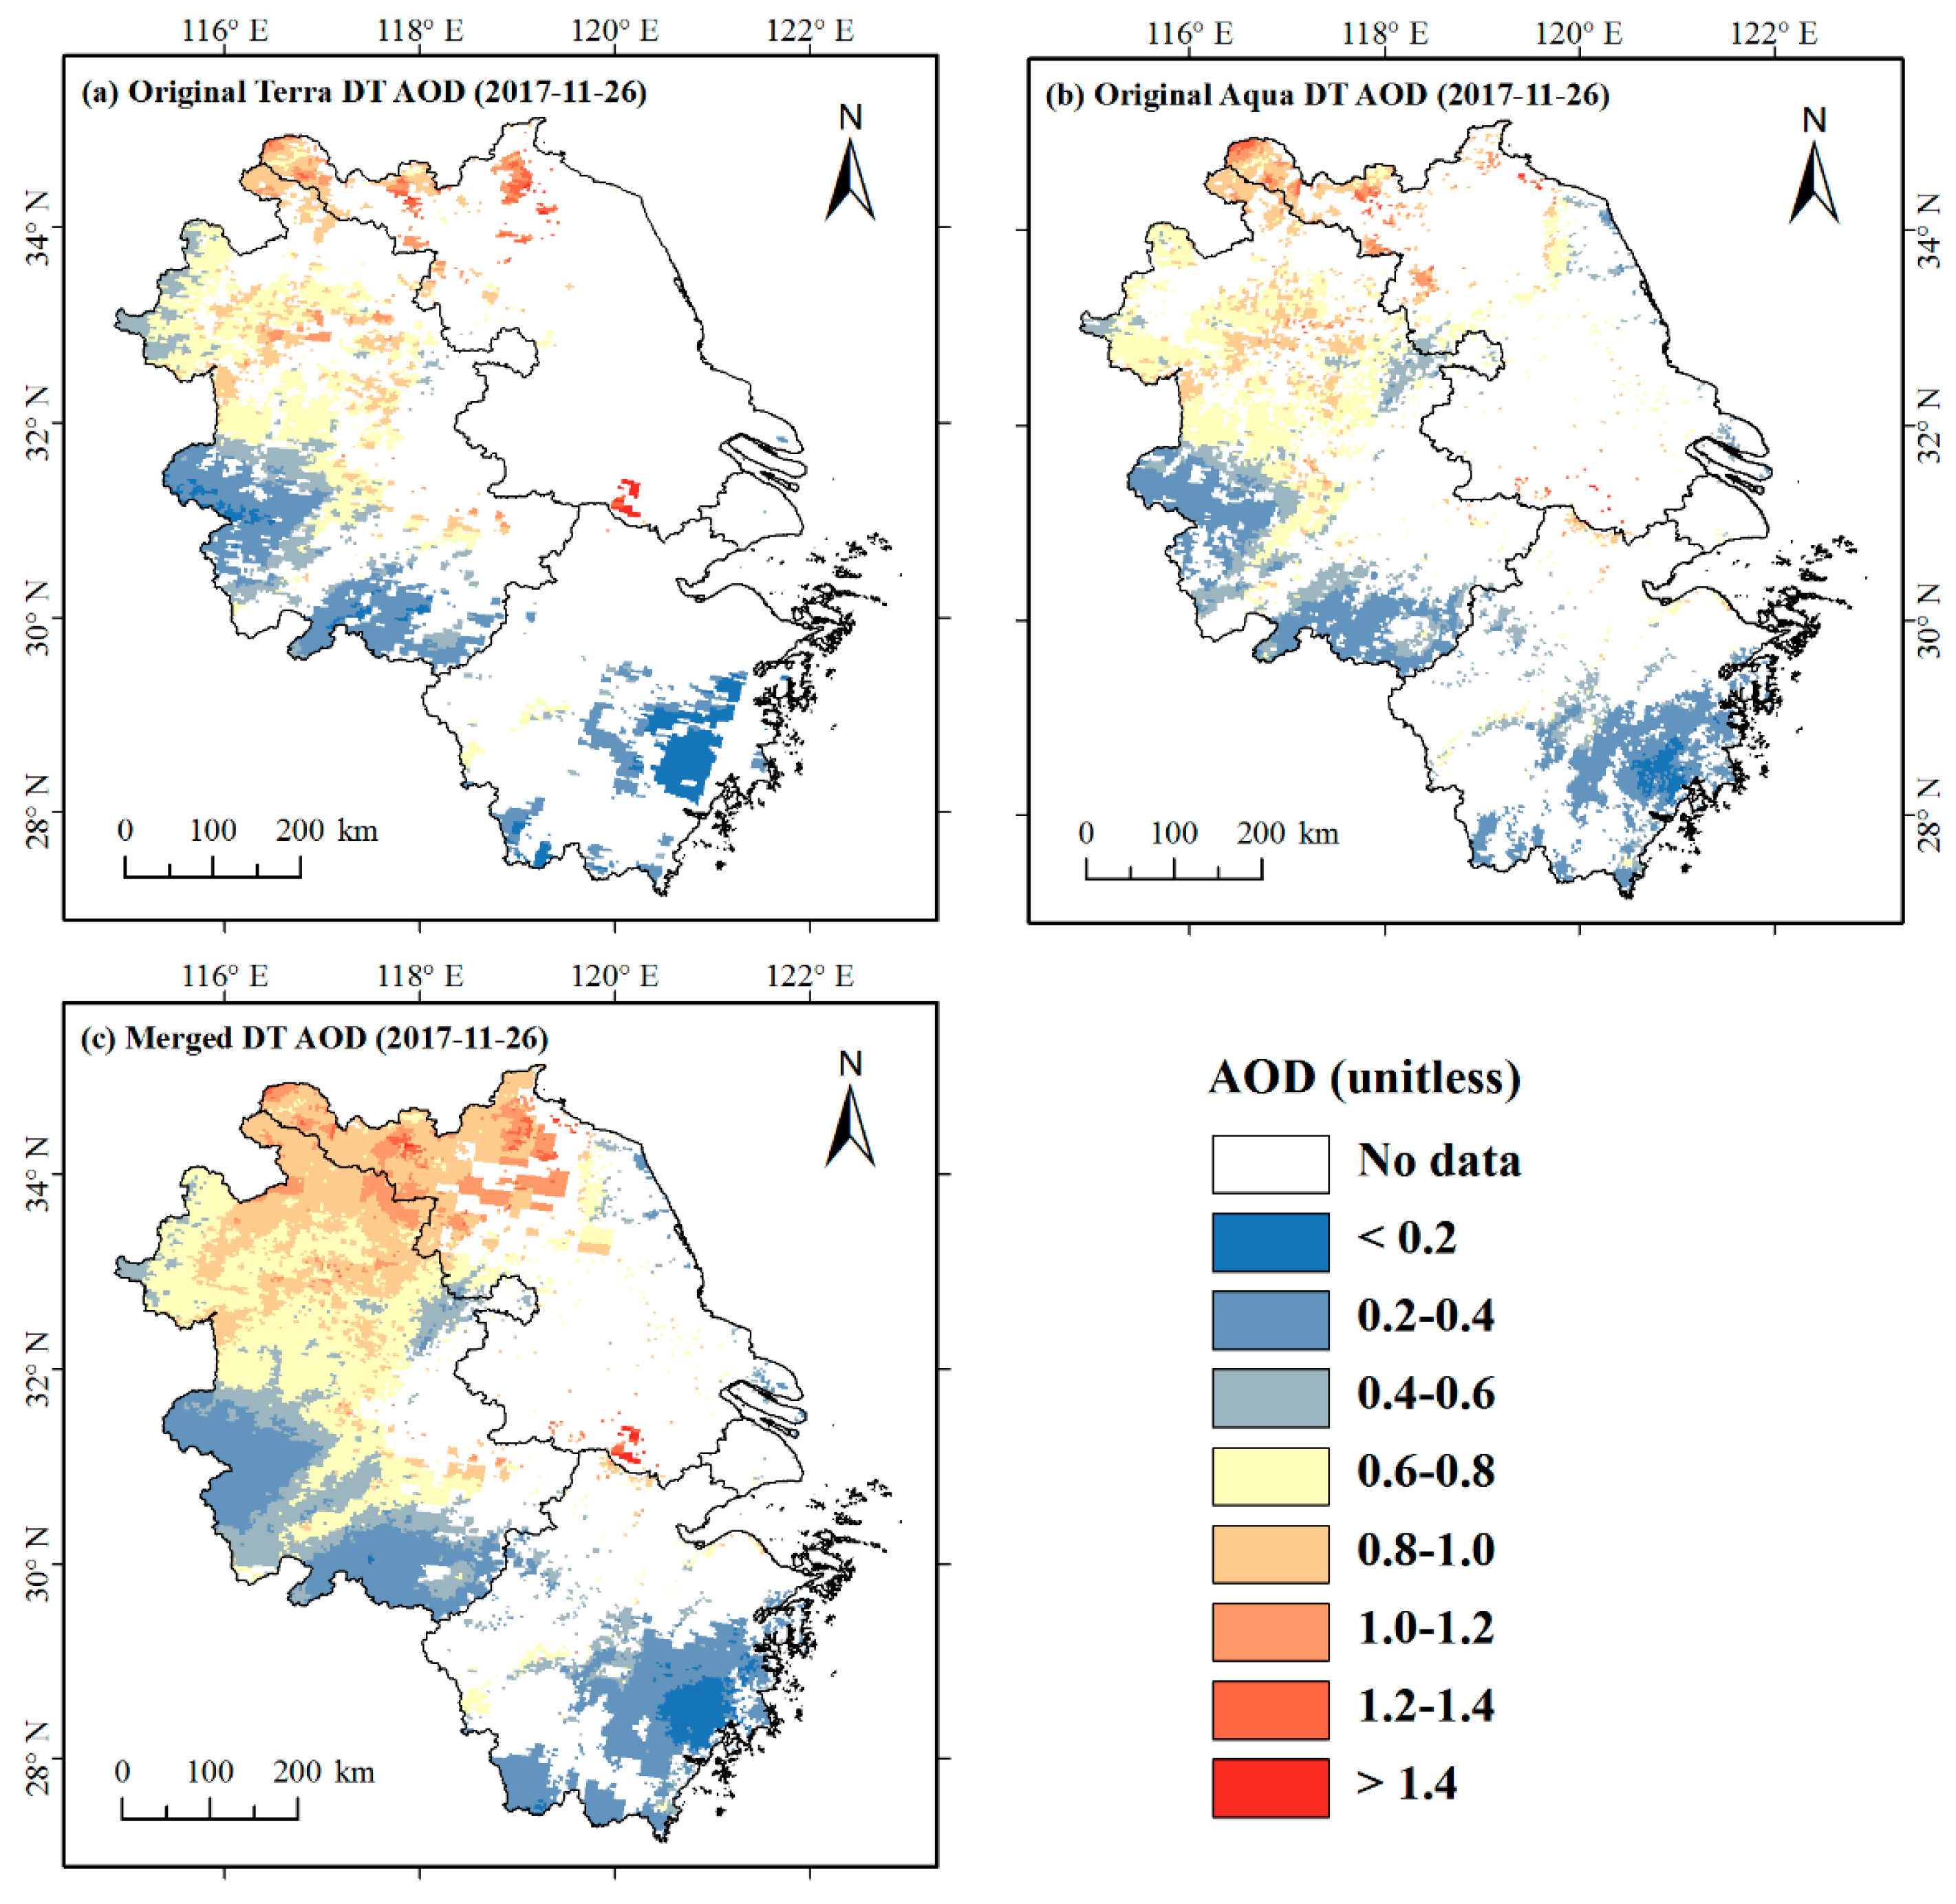
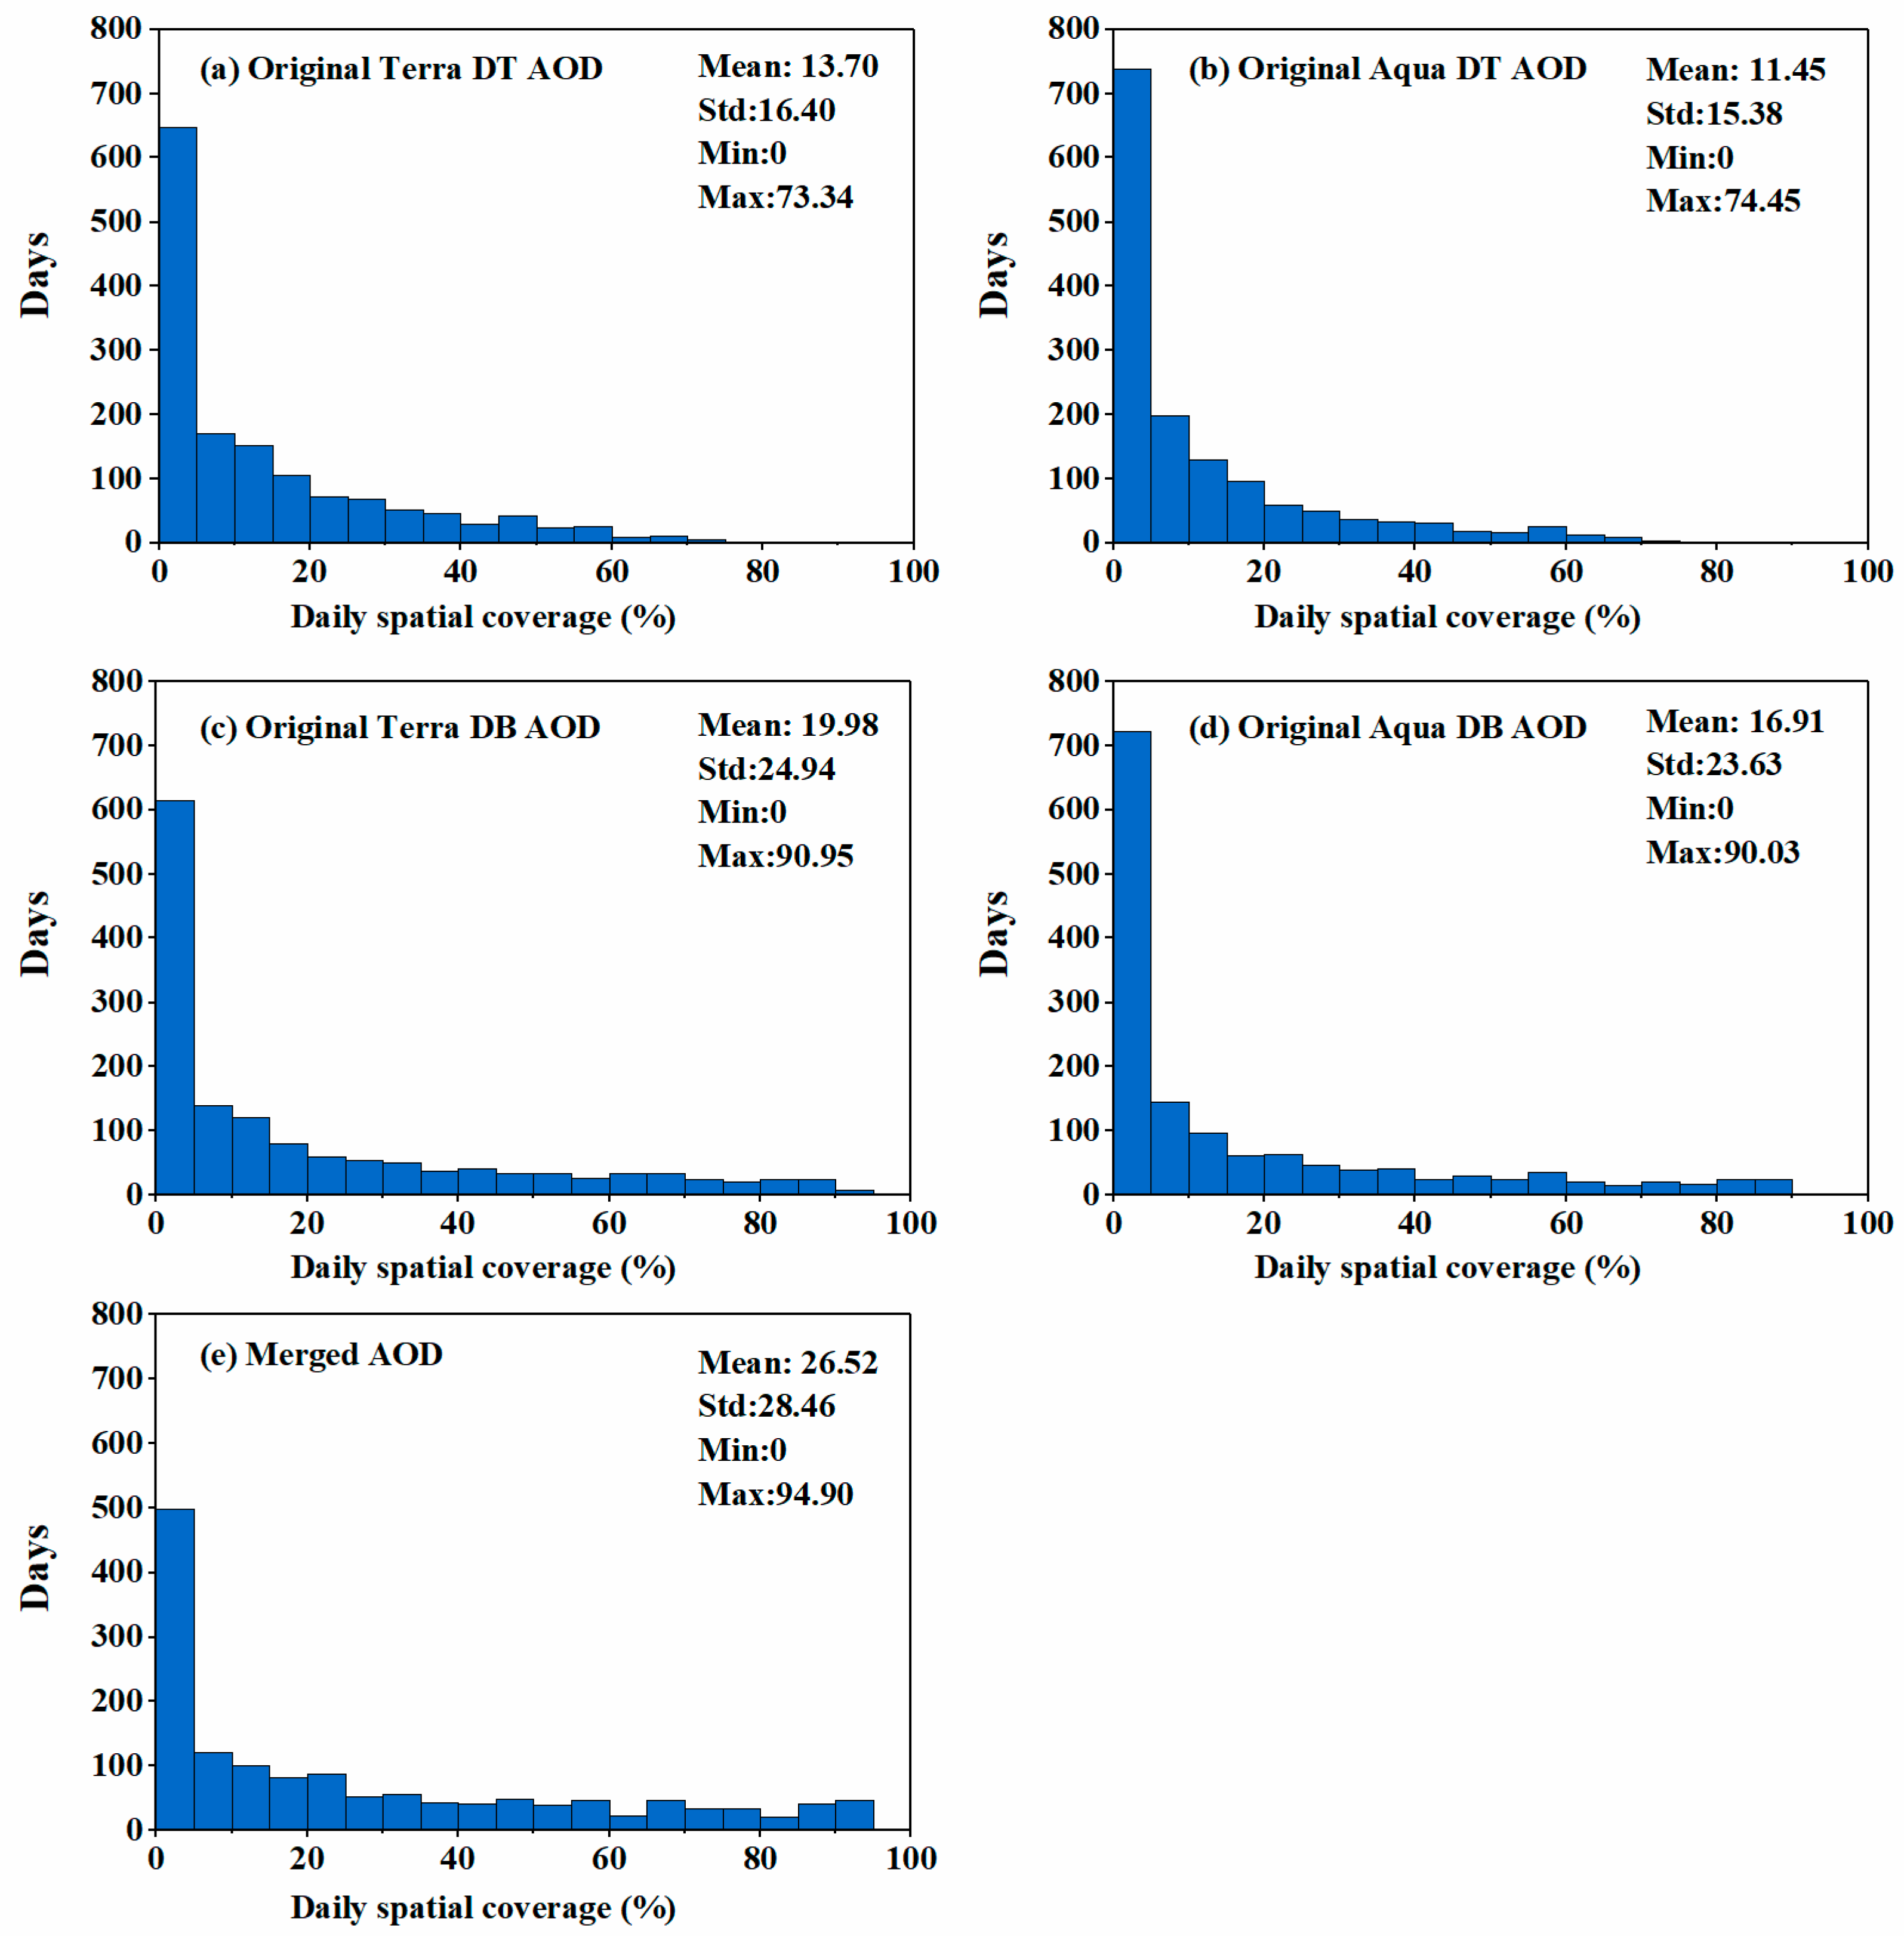
4.1.2. Assessment of the Spatiotemporal Coverage of the Merged AOD
4.2. Spatiotemporal Characteristics of AOD
4.2.1. Spatial Variations of AOD
4.2.2. Temporal Characteristics of AOD
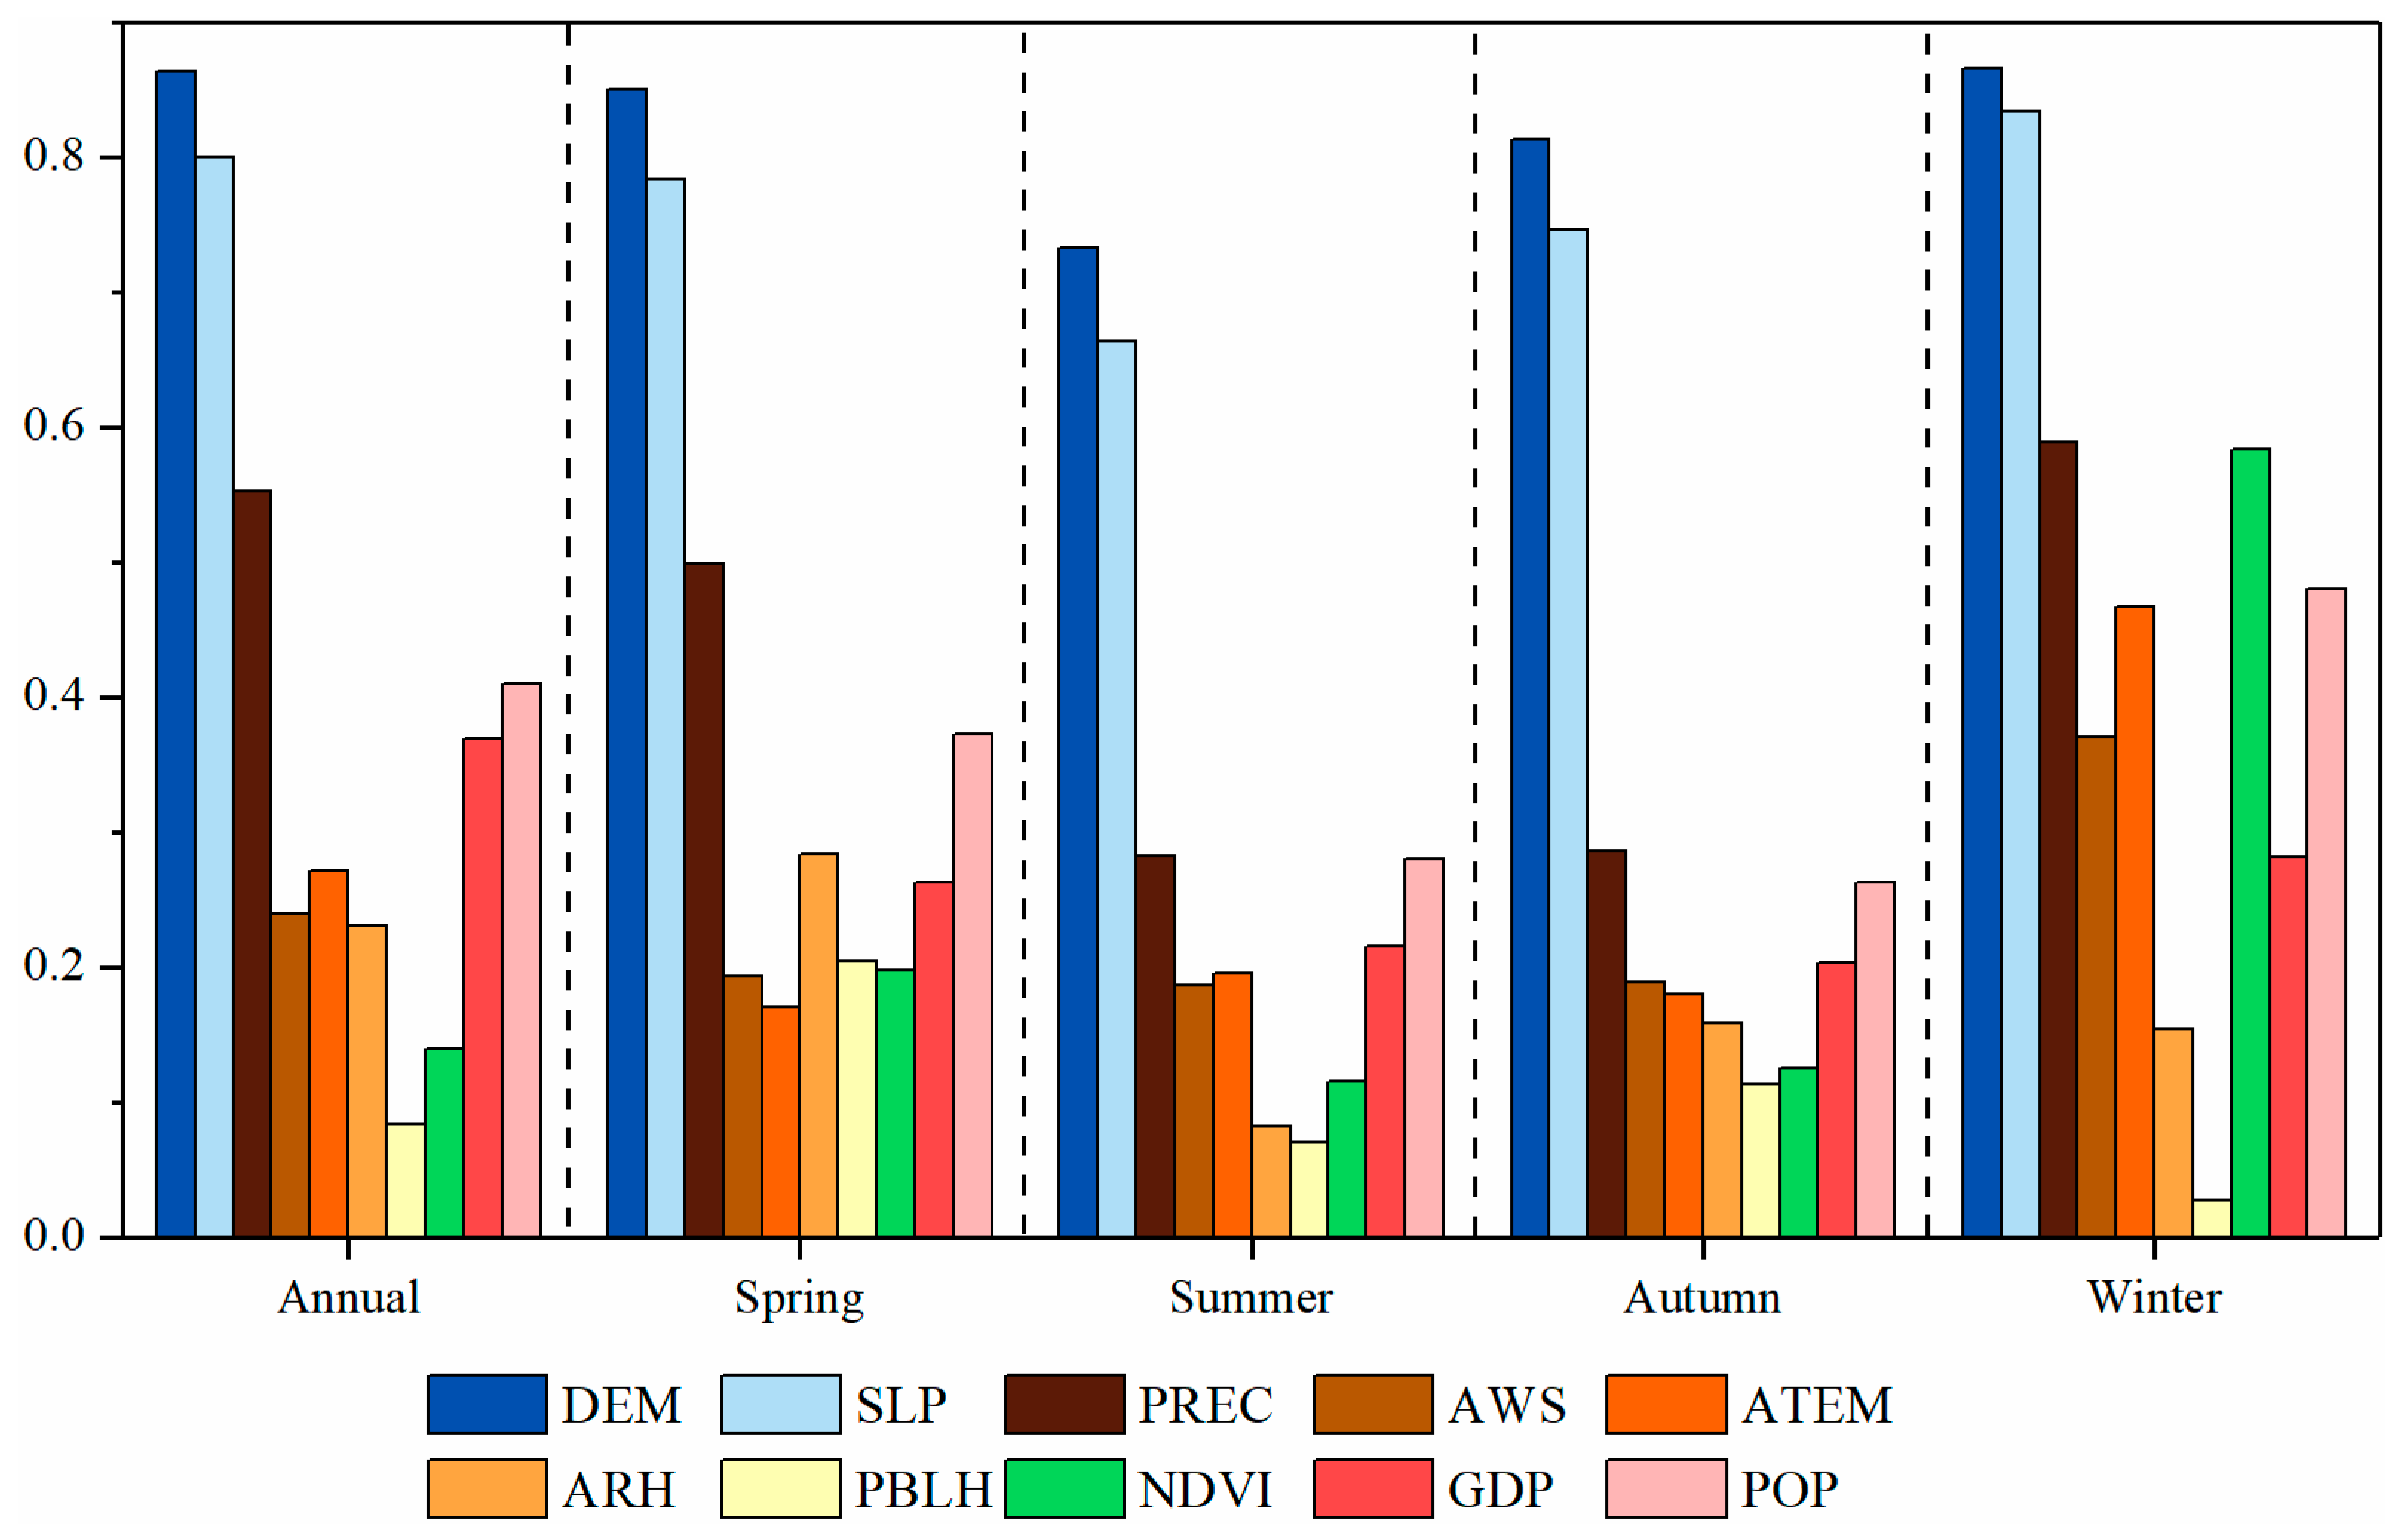
4.3. Contribution of Each Factor to AOD Distribution
5. Discussion
5.1. AOD Gap-Filling
5.2. The Impacts of Factors on the Spatial Variations of AOD
5.3. The Effect of Environmental Policy on the Temporal Variability of AOD
5.4. Limitations
6. Conclusions
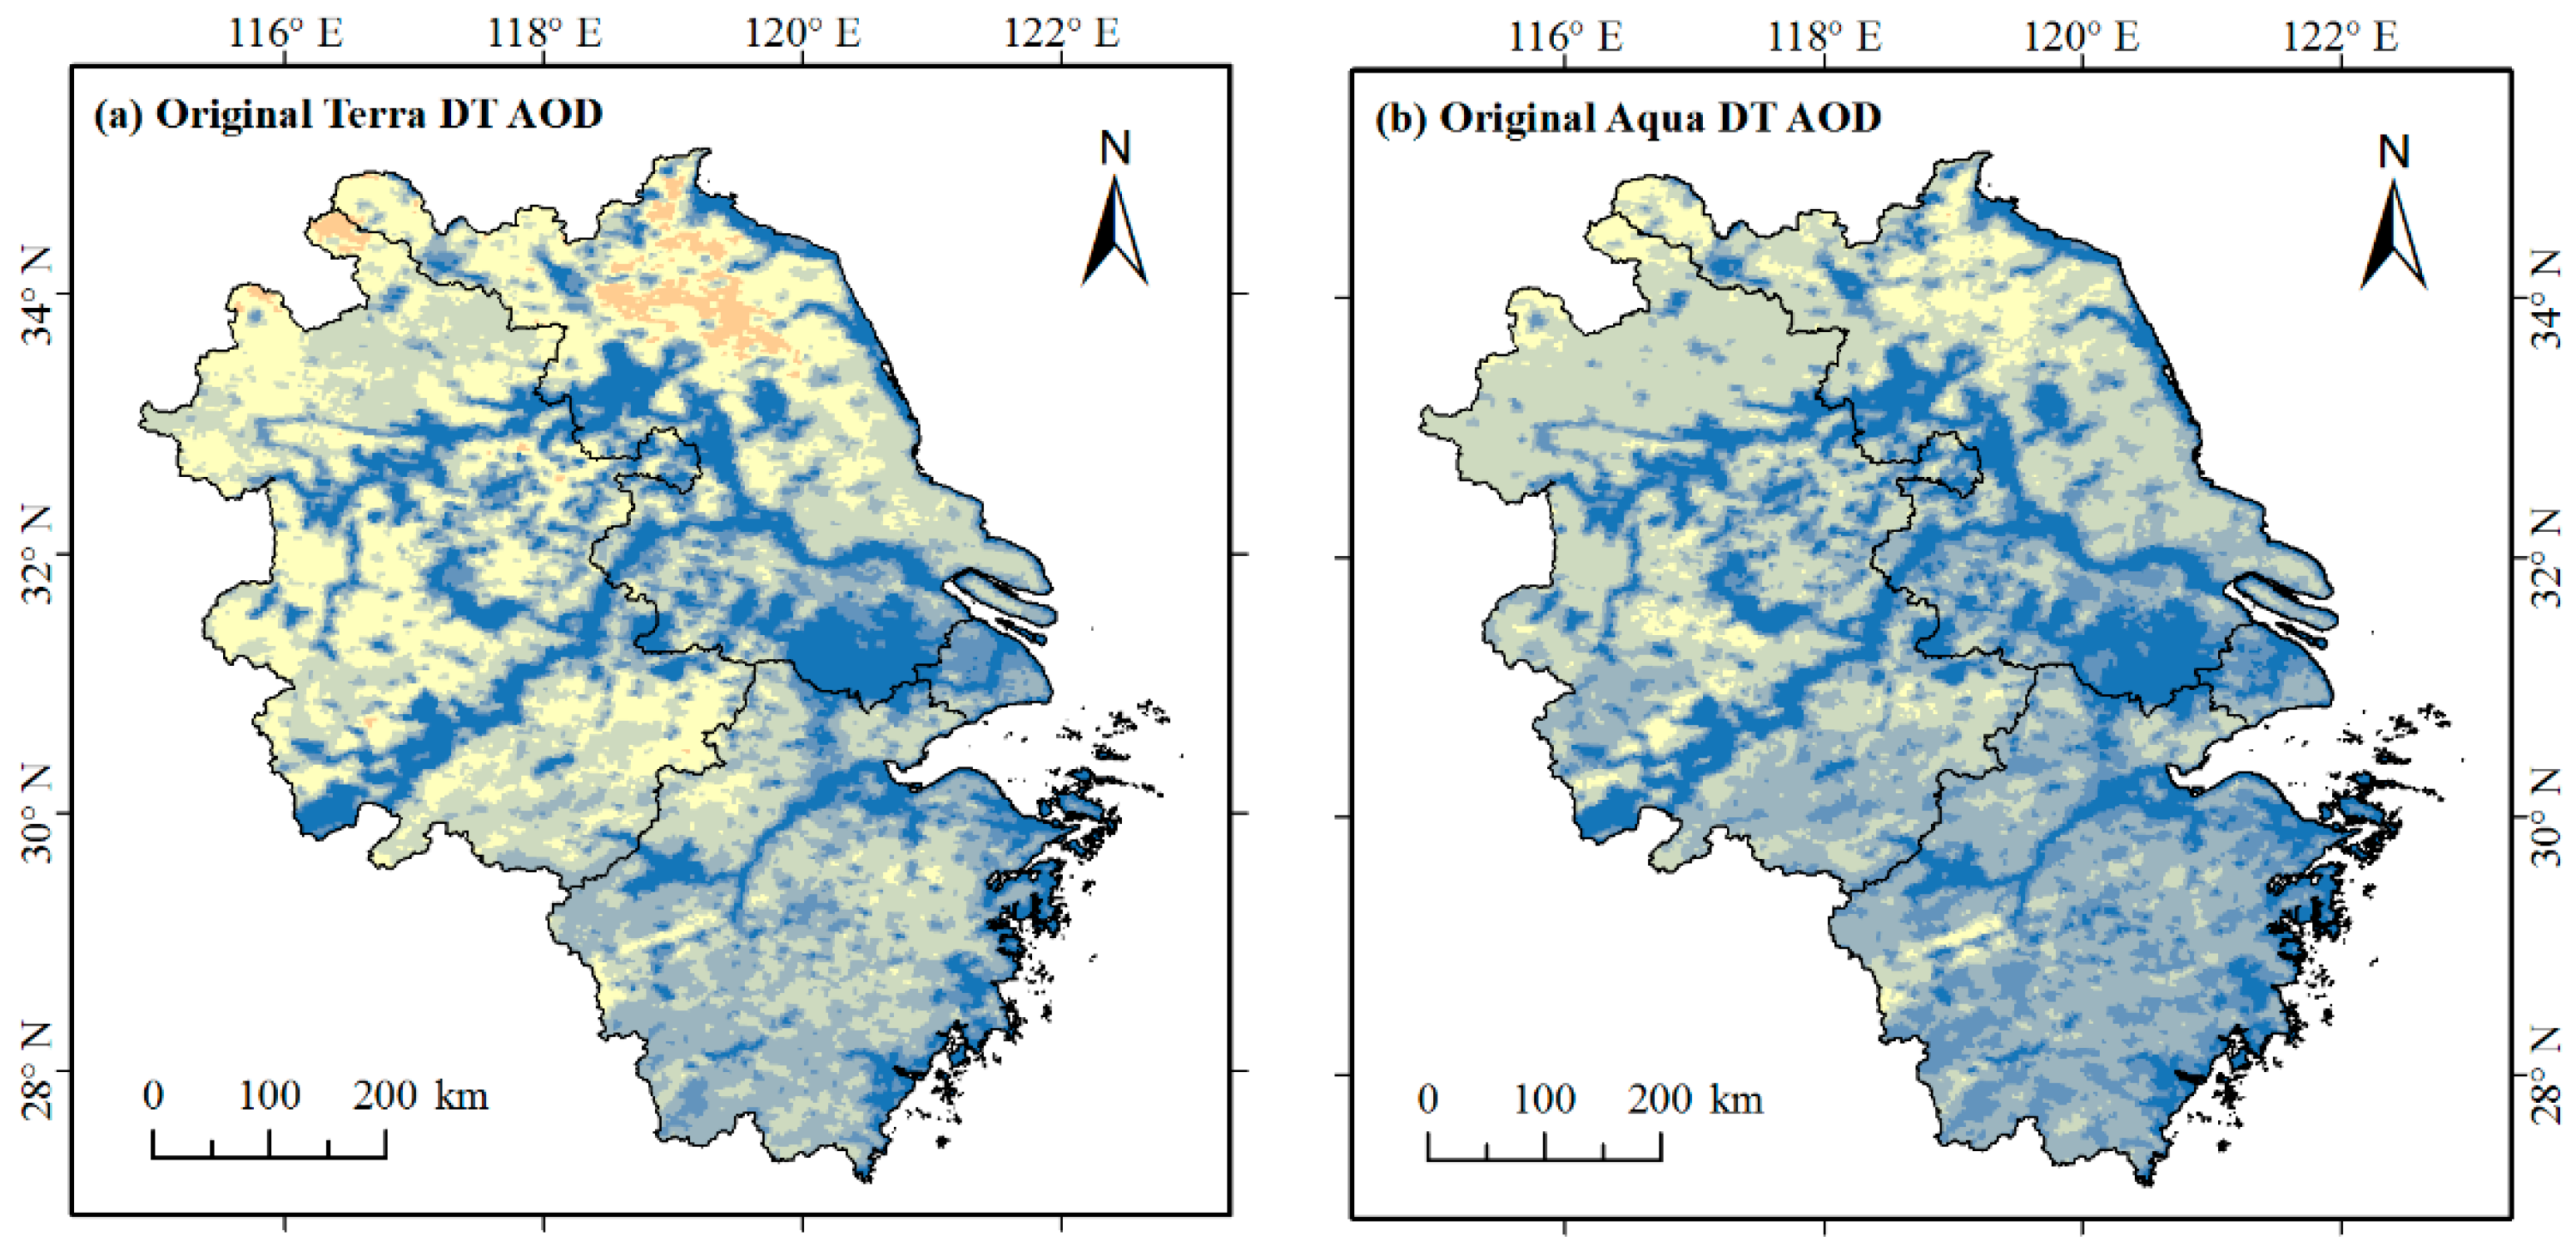
- The merged AOD are better than the original Terra/Aqua DT AOD, with the average spatial coverage increased by 94% and 132% respectively.
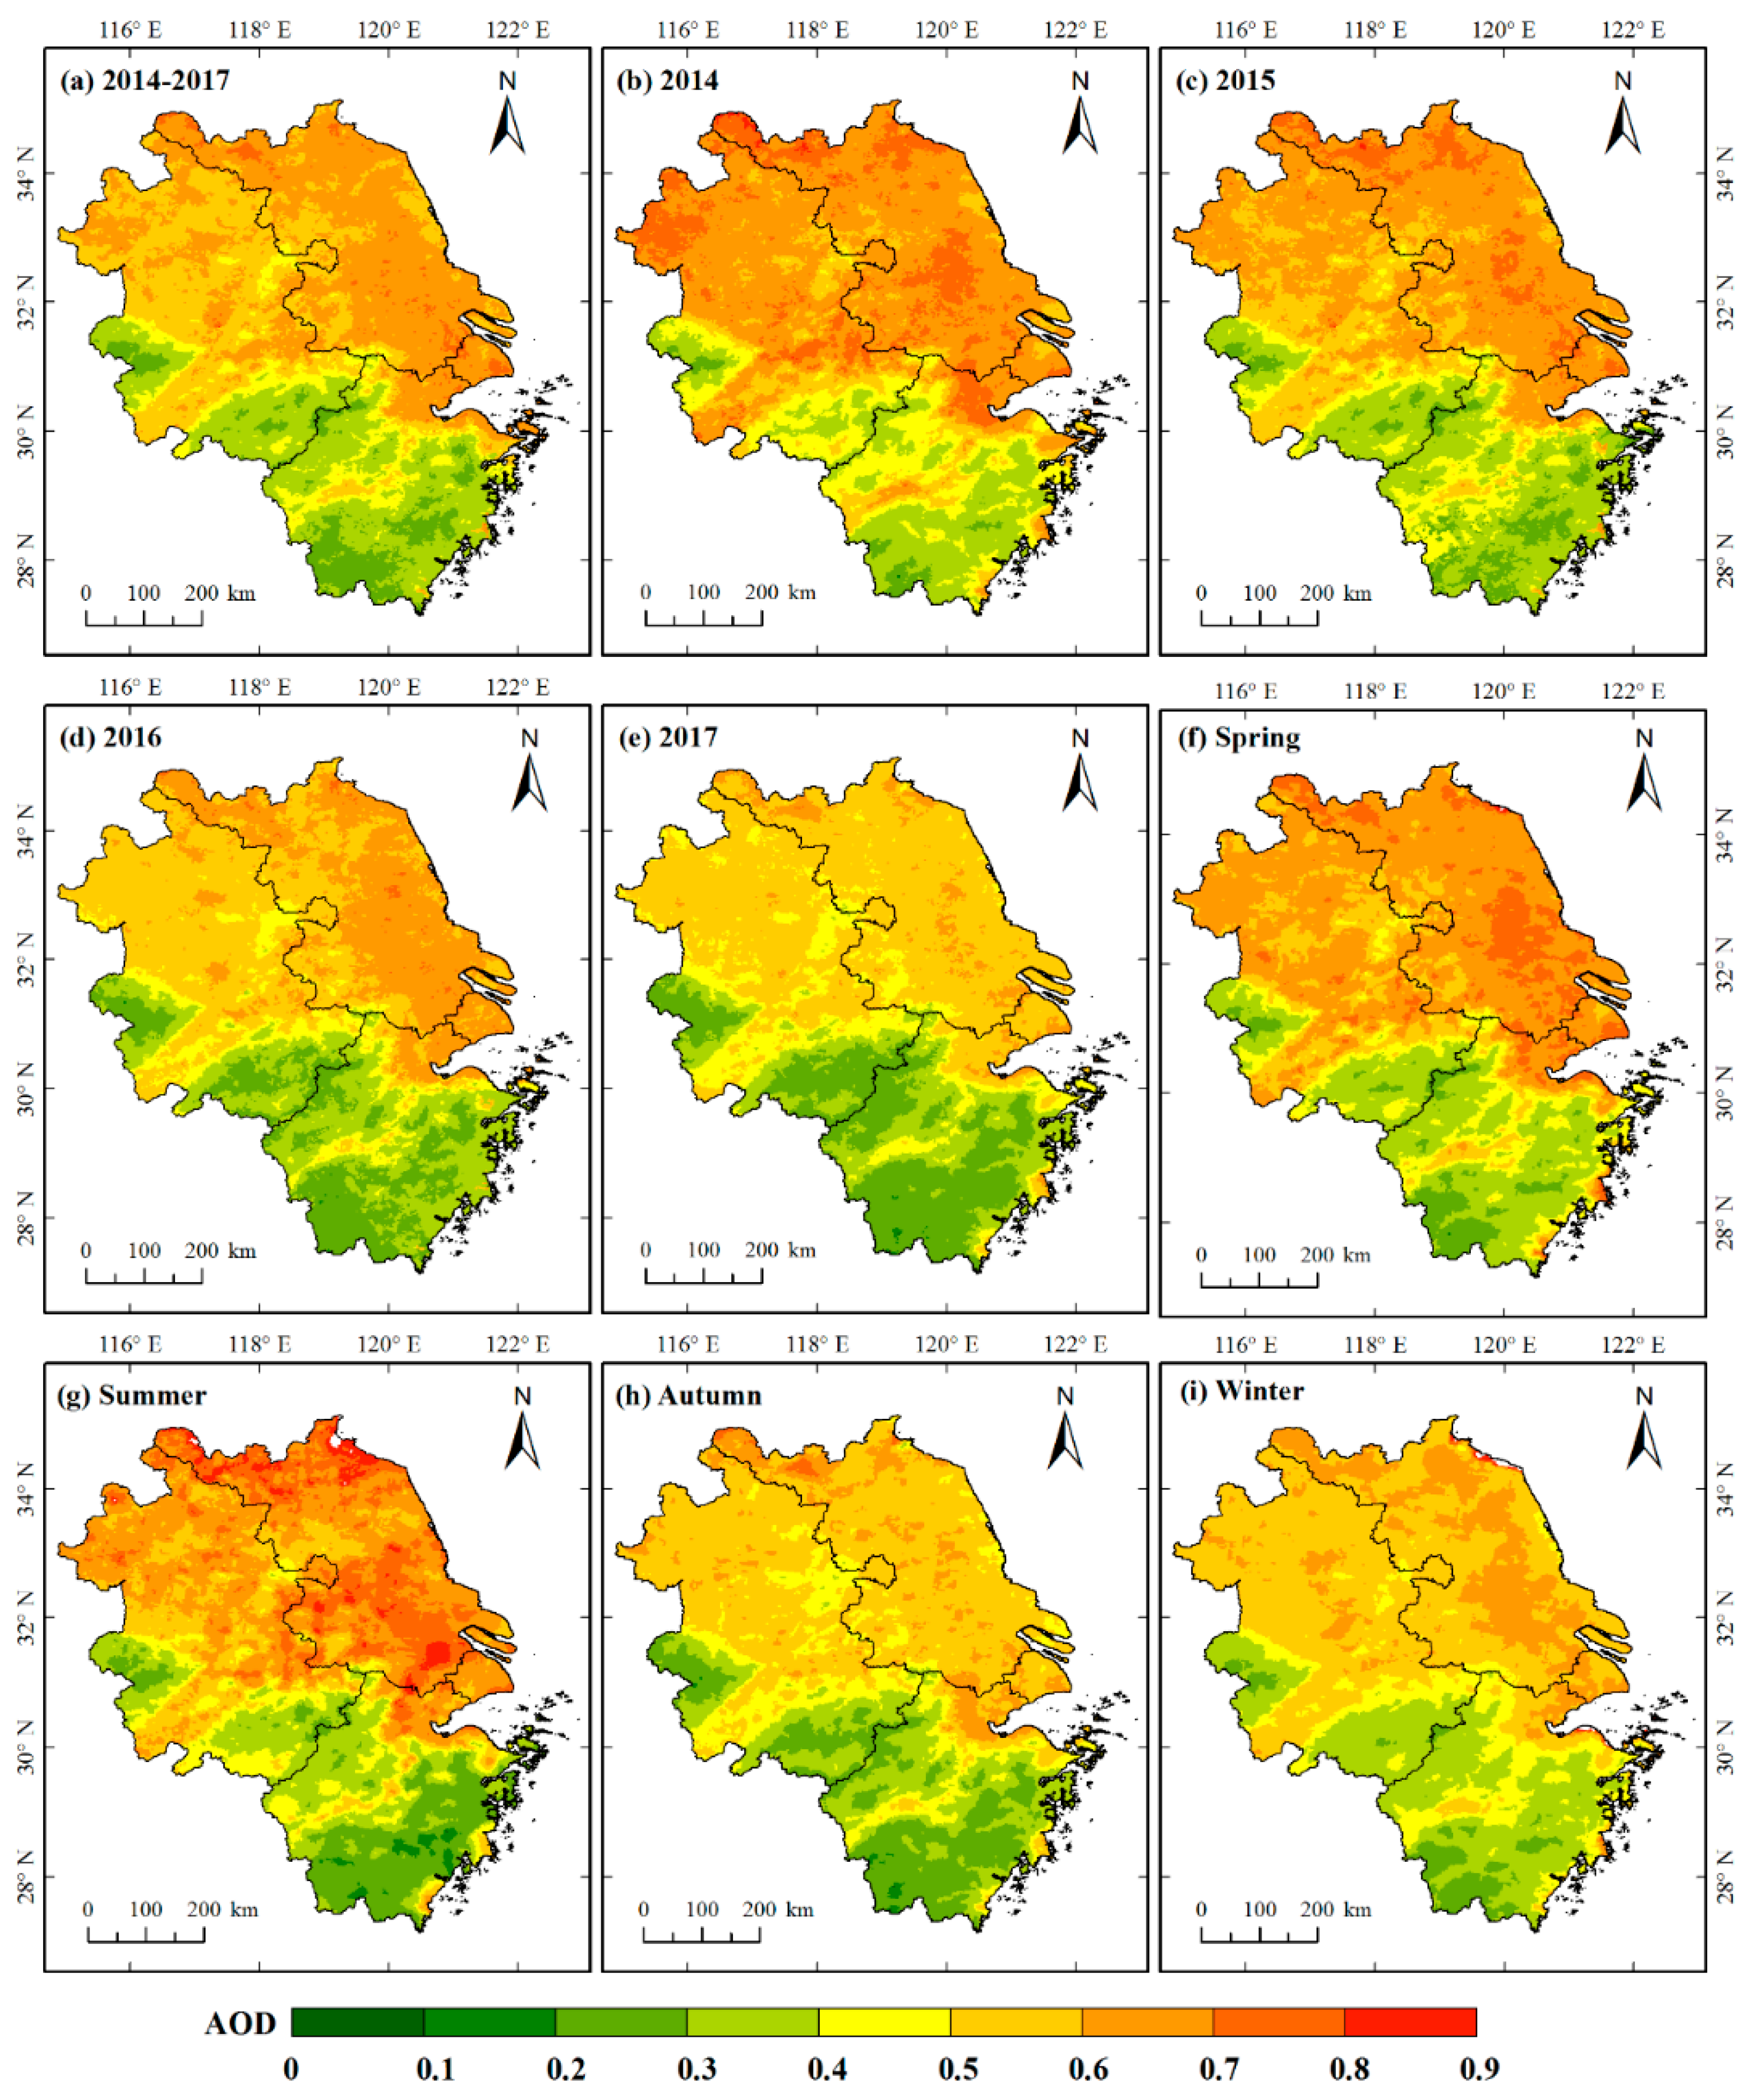
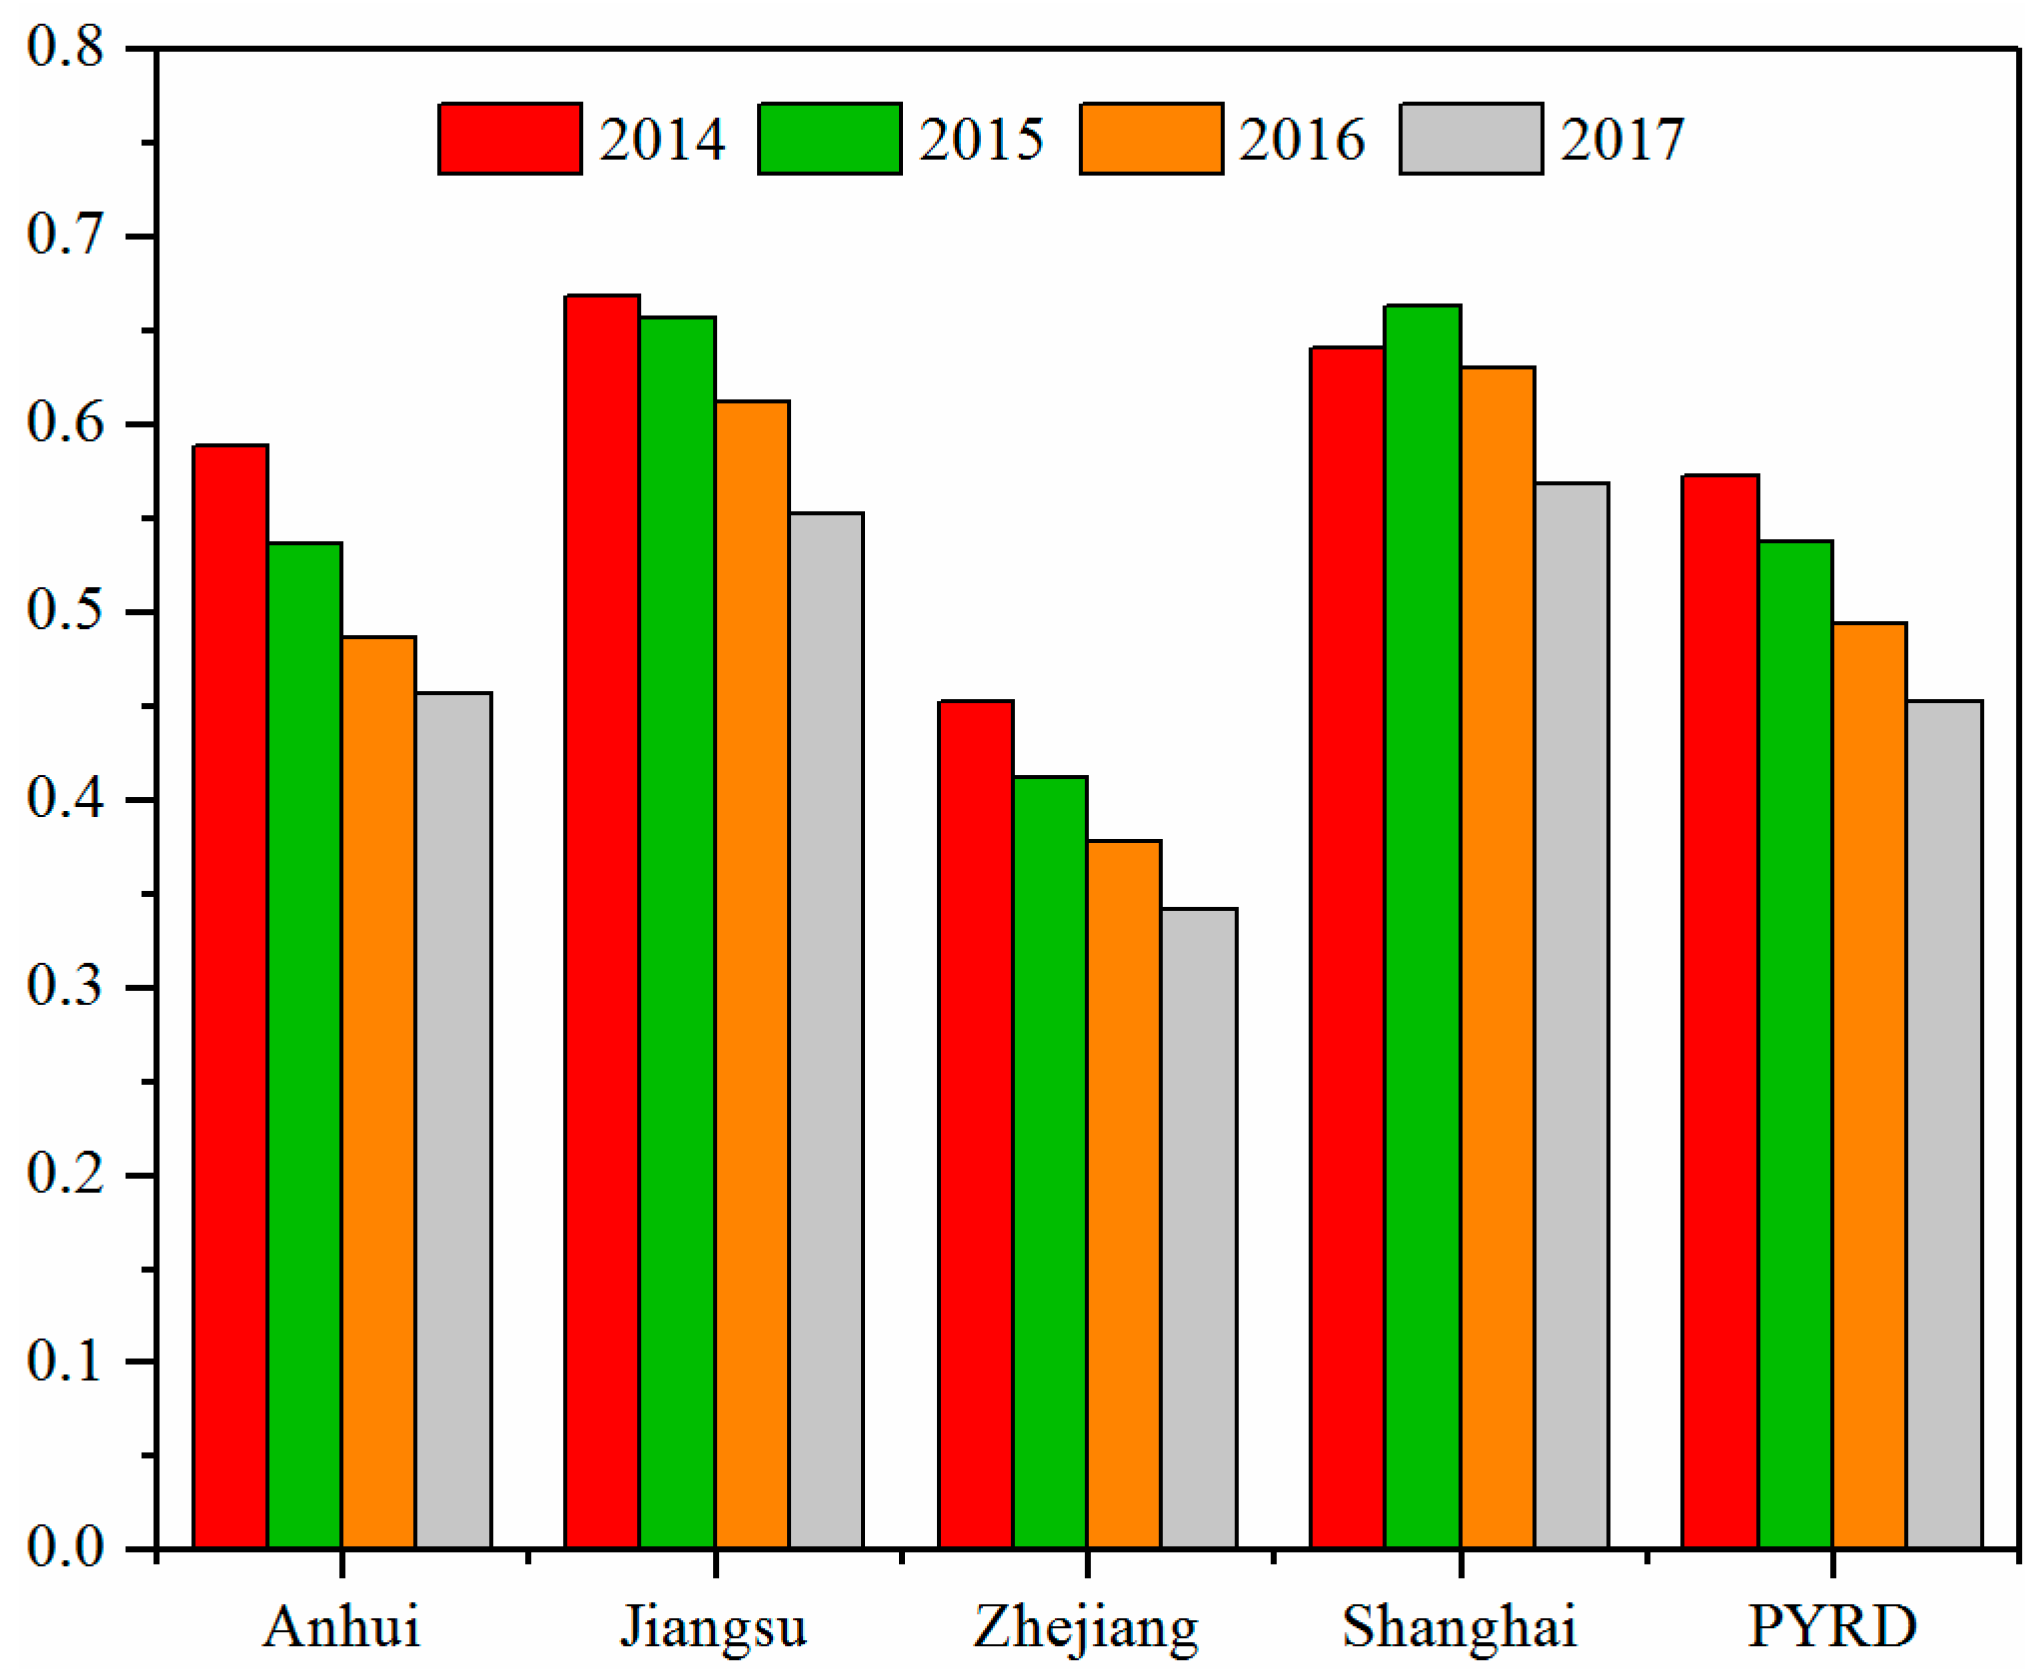
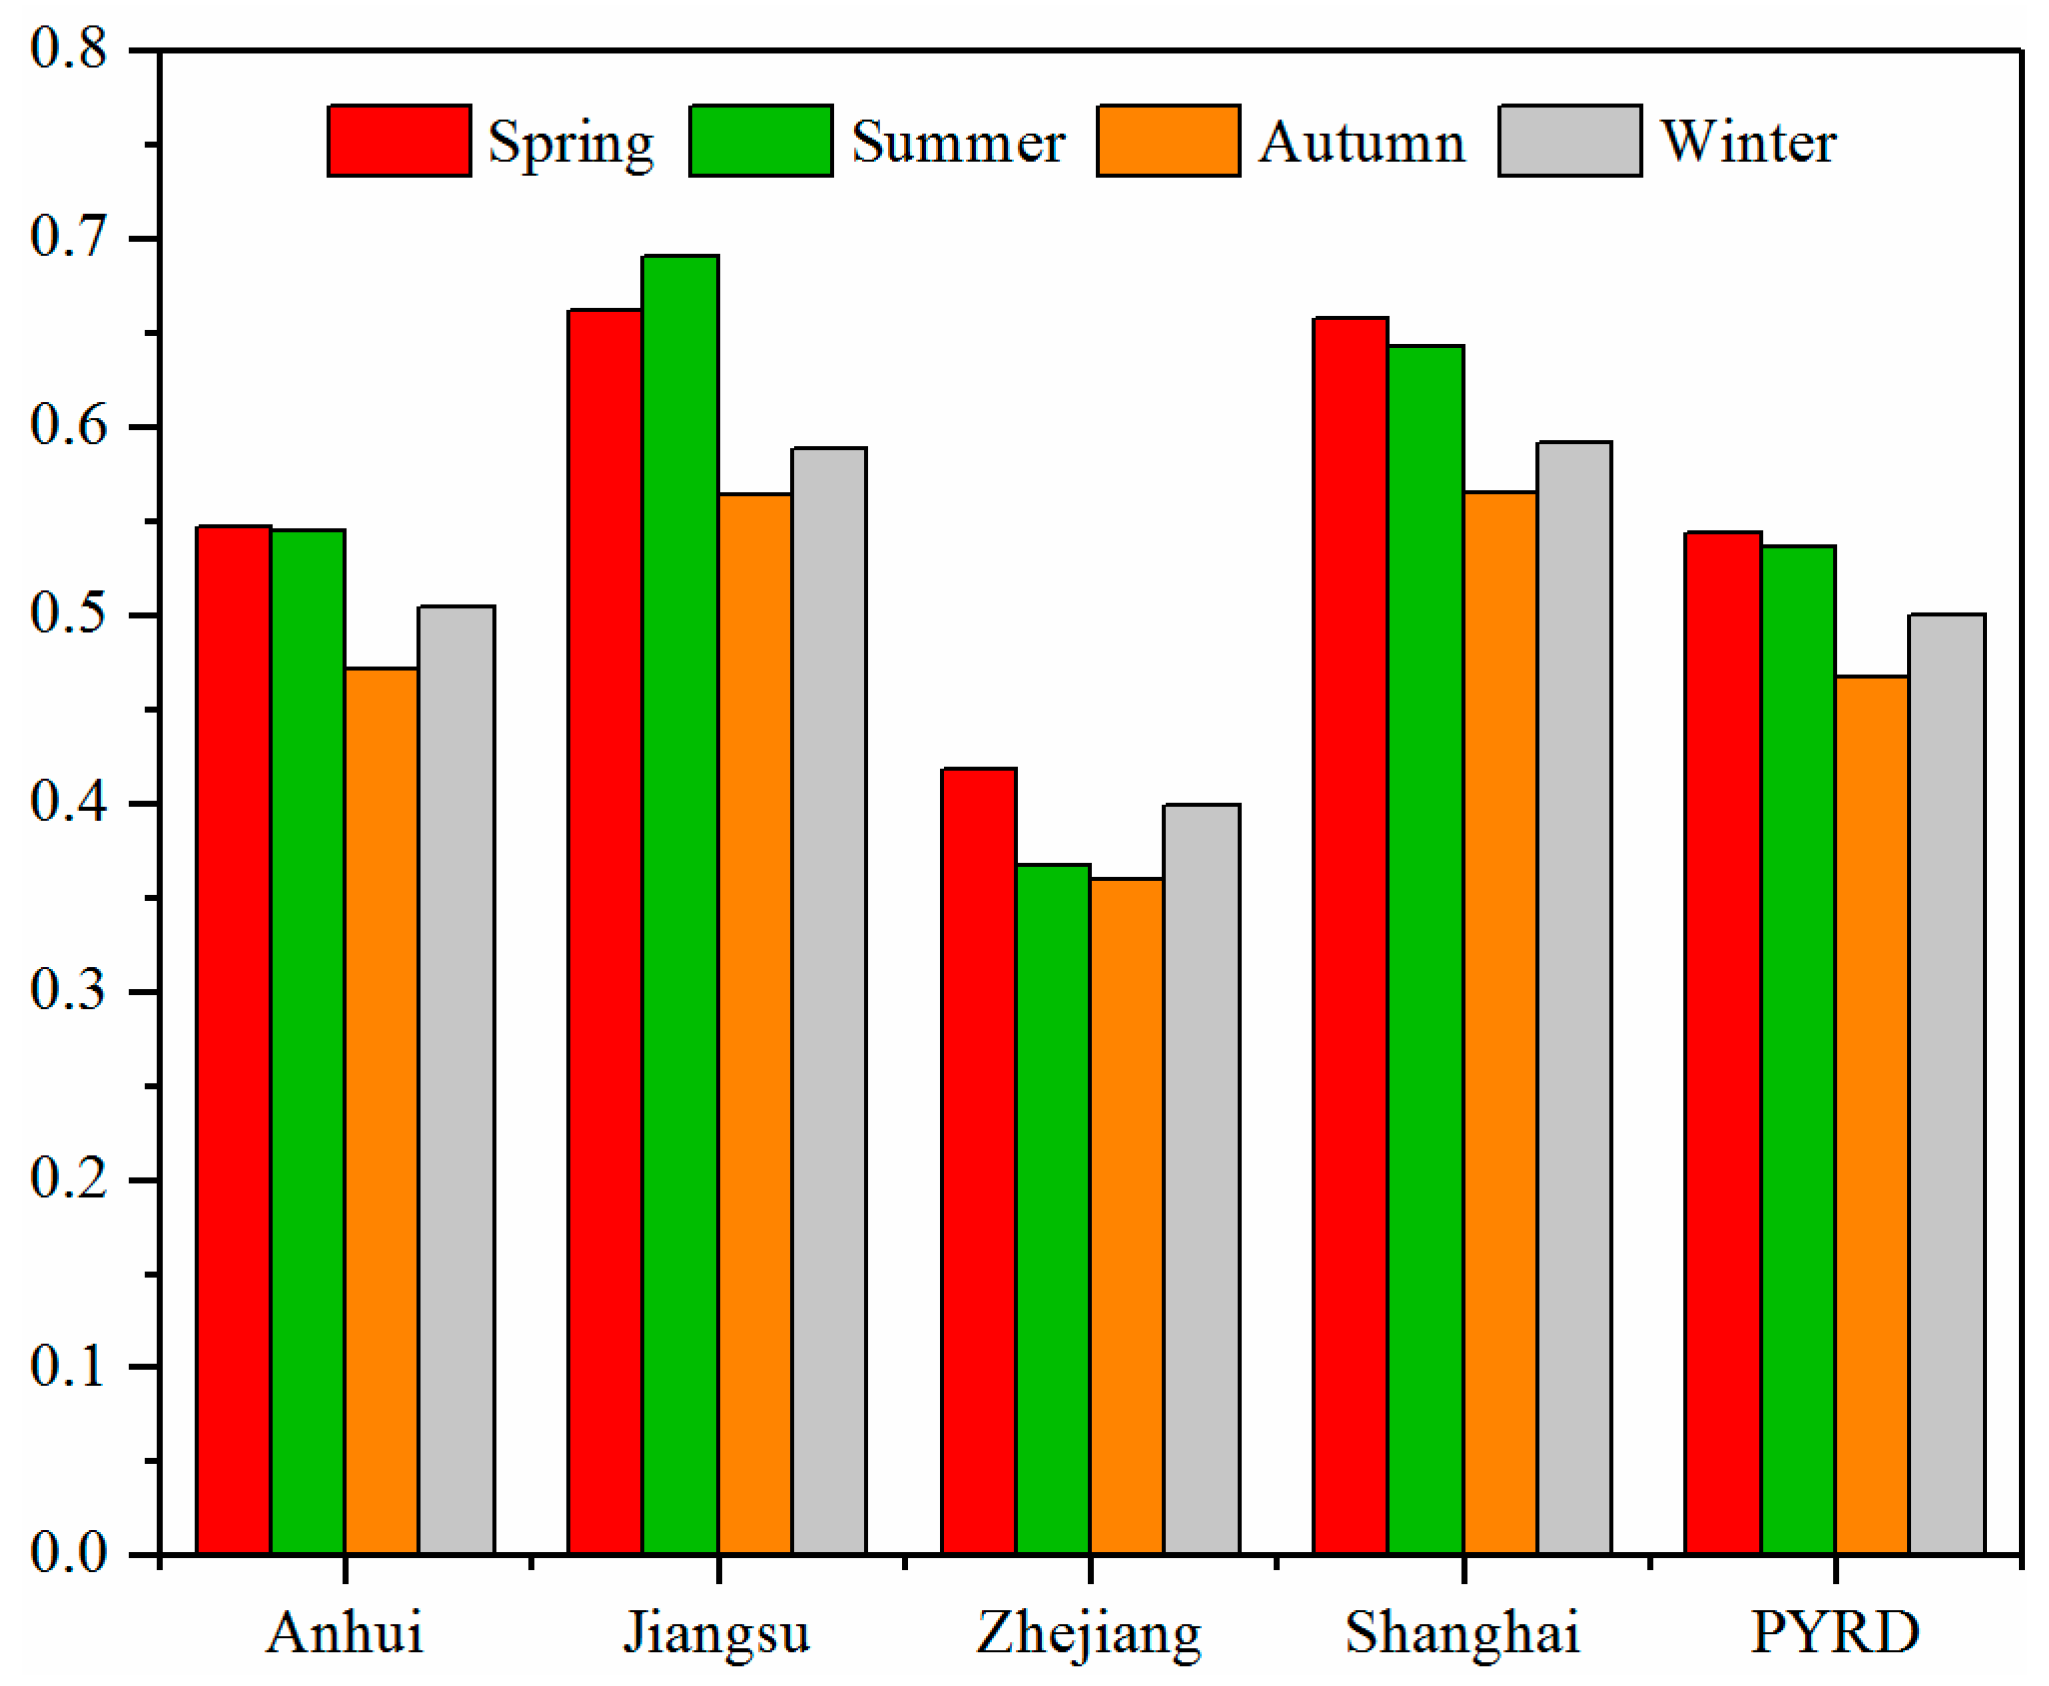
- The AOD over the PYRD were high in the northeast and low in the southwest and decreased from 2014 to 2017. Seasonal average AOD were relatively higher in spring and summer than in autumn and winter.
- Topographical factors contributed most to AOD, followed by precipitation and population density, while NDVI showed a relatively week impact on AOD.
Author Contributions
Funding
Acknowledgments
Conflicts of Interest
Abbreviations
Appendix A
Validation of the Resampled 3-km DB AOD Data

| AOD | Nearest Neighbor | Bilinear Interpolation | Cubic Convolution | |||
|---|---|---|---|---|---|---|
| Terra DB AOD | 0.78 | 0.16 | 0.77 | 0.17 | 0.77 | 0.17 |
| Aqua DB AOD | 0.82 | 0.17 | 0.81 | 0.18 | 0.78 | 0.20 |
The Calibration of AOD
| Seasons | Terra DT AOD | Aqua DT AOD | Terra DB AOD | Aqua DB AOD | ||||||||
|---|---|---|---|---|---|---|---|---|---|---|---|---|
| Spring | 0.01 | 0.75 | 0.82 | 0.03 | 0.77 | 0.78 | 0.19 | 0.85 | 0.83 | 0.17 | 0.90 | 0.77 |
| Summer | −0.12 | 1.0 | 0.89 | −0.08 | 0.93 | 0.80 | 0.17 | 0.95 | 0.89 | 0.14 | 0.95 | 0.86 |
| Autumn | 0.03 | 0.86 | 0.84 | 0.12 | 0.71 | 0.84 | 0.17 | 0.76 | 0.84 | 0.21 | 0.63 | 0.76 |
| Winter | 0.05 | 0.86 | 0.76 | 0.11 | 0.76 | 0.82 | 0.18 | 0.67 | 0.87 | 0.16 | 0.77 | 0.81 |
| Year | N | R |
|---|---|---|
| 2014 | 115 | 0.8462 |
| 2015 | 129 | 0.8734 |
| 2016 | 116 | 0.8324 |
| 2017 | 132 | 0.8267 |
| 2014–2017 | 492 | 0.8477 |
| Model | Year | ||||
|---|---|---|---|---|---|
| Predict Terra DT AOD with Aqua DT AOD | 2014 | 0.14 | 28.8 | 0.83 | 0.0054 |
| 2015 | 0.12 | 27.5 | 0.85 | 0.0017 | |
| 2016 | 0.12 | 29.6 | 0.83 | 0.0051 | |
| 2017 | 0.10 | 28.7 | 0.82 | 0.0064 | |
| 2014−2017 | 0.12 | 28.8 | 0.83 | 0.0110 | |
| Predict Aqua DT AOD with Terra DT AOD | 2014 | 0.13 | 26.3 | 0.82 | 0.0028 |
| 2015 | 0.11 | 24.8 | 0.85 | 0.0019 | |
| 2016 | 0.11 | 27.3 | 0.83 | 0.0032 | |
| 2017 | 0.10 | 24.7 | 0.83 | 0.0050 | |
| 2014−2017 | 0.11 | 25.9 | 0.83 | 0.0061 | |
| Predict Terra DB AOD with Aqua DB AOD | 2014 | 0.11 | 23.5 | 0.87 | 0.0024 |
| 2015 | 0.10 | 21.0 | 0.85 | 0.0015 | |
| 2016 | 0.10 | 21.2 | 0.86 | 0.0018 | |
| 2017 | 0.09 | 21.6 | 0.83 | 0.0013 | |
| 2014−2017 | 0.10 | 22.1 | 0.86 | 0.0028 | |
| Predict Aqua DB AOD with Terra DB AOD | 2014 | 0.12 | 23.6 | 0.88 | 0.0010 |
| 2015 | 0.10 | 20.8 | 0.85 | 0.0003 | |
| 2016 | 0.10 | 21.5 | 0.85 | 0.0034 | |
| 2017 | 0.09 | 21.2 | 0.84 | 0.0002 | |
| 2014−2017 | 0.10 | 22.0 | 0.86 | 0.0011 | |
| Predict Terra DT AOD with Terra DB AOD | 2014 | 0.12 | 23.7 | 0.86 | 0.0021 |
| 2015 | 0.12 | 23.0 | 0.85 | 0.0014 | |
| 2016 | 0.11 | 24.8 | 0.85 | 0.0030 | |
| 2017 | 0.10 | 25.4 | 0.84 | 0.0022 | |
| 2014−2017 | 0.12 | 24.2 | 0.86 | 0.0045 | |
| Predict Aqua DT AOD with Aqua DB AOD | 2014 | 0.11 | 21.9 | 0.86 | 0.0044 |
| 2015 | 0.11 | 21.2 | 0.85 | 0.0032 | |
| 2016 | 0.11 | 23.9 | 0.84 | 0.0023 | |
| 2017 | 0.10 | 22.5 | 0.83 | 0.0012 | |
| 2014−2017 | 0.11 | 22.4 | 0.85 | 0.0037 |

Multiple Linear Regression Models
| Model | Regression Function | Max VIF (Variable) | ||
|---|---|---|---|---|
| Annual | AOD = 2.492 × 10⁻¹⁵ 0.566 × DEM − 0.307 × PREC + 0.098 × AWS − 0.025 × PBLH − 0.076 × NDVI + 0.210 × POP | 0.792 | 0.792 | 2.365 (DEM) |
| Spring | AOD = −9.663 × 10⁻¹⁶ − 0.500 × DEM − 0.265 × PREC + 0.103 × AWS − 0.127 × PBLH − 0.118 × NDVI + 0.164 × POP | 0.806 | 0.806 | 2.817 (DEM) |
| Summer | AOD = 3.121 × 10⁻¹⁵ − 0.616 × DEM − 0.202 × PREC + 0.173 × AWS + 0.099 × ARH - 0.032 × PBLH − 0.102 × NDVI + 0.247 × POP | 0.677 | 0.677 | 2.061 (ARH) |
| Autumn | AOD = 1.445 × 10⁻¹⁵ − 0.639 × DEM − 0.348 × PREC + 0.188 × AWS + 0.081 × ARH − 0.068 × PBLH − 0.072 × NDVI + 0.324 × POP | 0.824 | 0.823 | 2.411 (PREC) |
| Winter | AOD = 4.822 × 10⁻¹⁶ − 0.523 × DEM − 0.250 × PREC + 0.110 × AWS − 0.090 × PBLH − 0.234 × NDVI + 0.228 × POP | 0.833 | 0.833 | 2.832 (DEM) |
References
- Hallquist, M.; Wenger, J.C.; Baltensperger, U.; Rudich, Y.; Simpson, D.; Claeys, M.; Dommen, J.; Donahue, N.M.; George, C.; Goldstein, A.H.; et al. The formation, properties and impact of secondary organic aerosol: Current and emerging issues. Atmos. Chem. Phys. 2009, 9, 3555–3762. [Google Scholar] [CrossRef]
- Viana, M.; Pey, J.; Querol, X.; Alastuey, A.; de Leeuw, F.; Lükewille, A. Natural sources of atmospheric aerosols influencing air quality across Europe. Sci. Total Environ. 2014, 472, 825–833. [Google Scholar] [CrossRef] [PubMed]
- Li, L.; Solana, C.; Canters, F.; Chan, J.; Kervyn, M. Impact of environmental factors on the spectral characteristics of lava surfaces: Field spectrometry of basaltic lava flows on Tenerife, Canary Islands, Spain. Remote Sens. 2015, 7, 16986–17012. [Google Scholar] [CrossRef]
- Calvo, A.I.; Alves, C.; Castro, A.; Pont, V.; Vicente, A.M.; Fraile, R. Research on aerosol sources and chemical composition: Past, current and emerging issues. Atmos. Res. 2013, 120–121, 1–28. [Google Scholar] [CrossRef]
- Andreae, M.O.; Rosenfeld, D. Aerosol-cloud-precipitation interactions. Part 1. The nature and sources of cloud-active aerosols. Earth-Sci. Rev. 2008, 89, 13–41. [Google Scholar] [CrossRef]
- Kaufman, Y.J.; Tanré, D.; Boucher, O. A satellite view of aerosols in the climate system. Nature 2002, 419, 215–223. [Google Scholar] [CrossRef]
- Obregón, M.A.; Serrano, A.; Cancillo, M.L.; Cachorro, V.E.; Toledano, C. Aerosol radiometric properties at Western Spain (Cáceres station). Int. J. Climatol. 2015, 35, 981–990. [Google Scholar] [CrossRef]
- Cheung, H.C.; Wang, T.; Baumann, K.; Guo, H. Influence of regional pollution outflow on the concentrations of fine particulate matter and visibility in the coastal area of Southern China. Atmos. Environ. 2005, 39, 6463–6474. [Google Scholar] [CrossRef]
- Park, R.J.; Jacob, D.J.; Kumar, N.; Yantosca, R.M. Regional visibility statistics in the United States: Natural and transboundary pollution influences, and implications for the Regional Haze Rule. Atmos. Environ. 2006, 40, 5405–5423. [Google Scholar] [CrossRef][Green Version]
- Bäumer, D.; Vogel, B.; Versick, S.; Rinke, R.; Möhler, O.; Schnaiter, M. Relationship of visibility, aerosol optical thickness and aerosol size distribution in an ageing air mass over South-West Germany. Atmos. Environ. 2008, 42, 989–998. [Google Scholar] [CrossRef]
- Yu, L.E.; Shulman, M.L.; Kopperud, R.; Hildemann, L.M. Characterization of organic compounds collected during Southeastern aerosol and visibility study: Water-soluble organic species. Environ. Sci. Technol. 2005, 39, 707–715. [Google Scholar] [CrossRef] [PubMed]
- Harrison, R.M.; Yin, J. Particulate matter in the atmosphere: Which particle properties are important for its effects on health? Sci. Total Environ. 2000, 249, 85–101. [Google Scholar] [CrossRef]
- Pope, C.A.; Dockery, D.W. Health effects of fine particulate air pollution: Lines that connect. J. Air Waste Manag. Assoc. 2006, 56, 709–742. [Google Scholar] [CrossRef] [PubMed]
- Dinoi, A.; Perrone, M.R.; Burlizzi, P. Application of MODIS products for air quality studies over Southeastern Italy. Remote Sens. 2010, 2, 1767–1796. [Google Scholar] [CrossRef]
- Seo, S.; Kim, J.; Lee, H.; Jeong, U.; Kim, W.; Holben, B.N.; Kim, S.W.; Song, C.H.; Lim, J.H. Estimation of PM10 concentrations over Seoul using multiple empirical models with AERONET and MODIS data collected during the DRAGON-Asia campaign. Atmos. Chem. Phys. 2015, 15, 319–334. [Google Scholar] [CrossRef]
- Liu, X.; Chen, Q.; Che, H.; Zhang, R.; Gui, K.; Zhang, H.; Zhao, T. Spatial distribution and temporal variation of aerosol optical depth in the Sichuan basin, China, the recent ten years. Atmos. Environ. 2016, 147, 434–445. [Google Scholar] [CrossRef]
- Estellés, V.; Campanelli, M.; Utrillas, M.P.; Expósito, F.; Martínez-Lozano, J.A. Comparison of AERONET and SKYRAD4.2 inversion products retrieved from a Cimel CE318 sunphotometer. Atmos. Meas. Tech. 2012, 5, 569–579. [Google Scholar] [CrossRef]
- Cesnulyte, V.; Lindfors, A.V.; Pitkänen, M.R.A.; Lehtinen, K.E.J.; Morcrette, J.-J.; Arola, A. Comparing ECMWF AOD with AERONET observations at visible and UV wavelengths. Atmos. Chem. Phys. 2014, 14, 593–608. [Google Scholar] [CrossRef]
- Aklesso, M.; Kumar, K.R.; Bu, L.; Boiyo, R. Analysis of spatial-temporal heterogeneity in remotely sensed aerosol properties observed during 2005–2015 over three countries along the Gulf of Guinea Coast in Southern West Africa. Atmos. Environ. 2018, 182, 313–324. [Google Scholar] [CrossRef]
- Nichol, J.; Bilal, M. Validation of MODIS 3 km resolution aerosol optical depth retrievals over Asia. Remote Sens. 2016, 8, 328. [Google Scholar] [CrossRef]
- Ma, Z.; Hu, X.; Huang, L.; Bi, J.; Liu, Y. Estimating ground-level PM2.5 in China using satellite remote sensing. Environ. Sci. Technol. 2014, 48, 7436–7444. [Google Scholar] [CrossRef] [PubMed]
- He, Q.; Huang, B. Satellite-based mapping of daily high-resolution ground PM2.5 in China via space-time regression modeling. Remote Sens. Environ. 2018, 206, 72–83. [Google Scholar] [CrossRef]
- Tao, M.; Chen, L.; Wang, Z.; Tao, J.; Che, H.; Wang, X.; Wang, Y. Comparison and evaluation of the MODIS Collection 6 aerosol data in China. J. Geophys. Res. Atmos. 2015, 120, 6992–7005. [Google Scholar] [CrossRef]
- Fan, A.; Chen, W.; Liang, L.; Sun, W.; Lin, Y.; Che, H.; Zhao, X. Evaluation and comparison of long-term MODIS C5.1 and C6 products against AERONET observations over China. Remote Sens. 2017, 9, 1269. [Google Scholar] [CrossRef]
- Bilal, M.; Qiu, Z.; Campbell, J.; Spak, S.; Shen, X.; Nazeer, M. A new MODIS C6 Dark Target and Deep Blue merged aerosol product on a 3 km spatial grid. Remote Sens. 2018, 10, 463. [Google Scholar] [CrossRef]
- Wei, J.; Li, Z.; Peng, Y.; Sun, L. MODIS Collection 6.1 aerosol optical depth products over land and ocean: Validation and comparison. Atmos. Environ. 2019, 201, 428–440. [Google Scholar] [CrossRef]
- Remer, L.A.; Mattoo, S.; Levy, R.C.; Munchak, L.A. MODIS 3 km aerosol product: Algorithm and global perspective. Atmos. Meas. Tech. 2013, 6, 1829–1844. [Google Scholar] [CrossRef]
- He, Q.; Zhang, M.; Huang, B.; Tong, X. MODIS 3 km and 10 km aerosol optical depth for China: Evaluation and comparison. Atmos. Environ. 2017, 153, 150–162. [Google Scholar] [CrossRef]
- Hsu, N.C.; Jeong, M.J.; Bettenhausen, C.; Sayer, A.M.; Hansell, R.; Seftor, C.S.; Huang, J.; Tsay, S.C. Enhanced Deep Blue aerosol retrieval algorithm: The second generation. J. Geophys. Res. Atmos. 2013, 118, 9296–9315. [Google Scholar] [CrossRef]
- Sayer, A.M.; Munchak, L.A.; Hsu, N.C.; Levy, R.C.; Bettenhausen, C.; Jeong, M.-J. MODIS Collection 6 aerosol products: Comparison between Aqua’s e-Deep Blue, Dark Target, and “merged” data sets, and usage recommendations. J. Geophys. Res. Atmos. 2014, 119, 13965–13989. [Google Scholar] [CrossRef]
- Lee, H.J.; Liu, Y.; Coull, B.A.; Schwartz, J.; Koutrakis, P. A novel calibration approach of MODIS AOD data to predict PM2.5 concentrations. Atmos. Chem. Phys. 2011, 11, 7991–8002. [Google Scholar] [CrossRef]
- Xiao, Q.; Wang, Y.; Chang, H.H.; Meng, X.; Geng, G.; Lyapustin, A.; Liu, Y. Full-coverage high-resolution daily PM2.5 estimation using MAIAC AOD in the Yangtze River Delta of China. Remote Sens. Environ. 2017, 199, 437–446. [Google Scholar] [CrossRef]
- Ruiz-Arias, J.A.; Dudhia, J.; Lara-Fanego, V.; Pozo-Vázquez, D. A geostatistical approach for producing daily Level-3 MODIS aerosol optical depth analyses. Atmos. Environ. 2013, 79, 395–405. [Google Scholar] [CrossRef]
- Yang, J.; Hu, M. Filling the missing data gaps of daily MODIS AOD using spatiotemporal interpolation. Sci. Total Environ. 2018, 633, 677–683. [Google Scholar] [CrossRef] [PubMed]
- Lv, B.; Hu, Y.; Chang, H.H.; Russell, A.G.; Cai, J.; Xu, B.; Bai, Y. Daily estimation of ground-level PM2.5 concentrations at 4 km resolution over Beijing-Tianjin-Hebei by fusing MODIS AOD and ground observations. Sci. Total Environ. 2017, 580, 235–244. [Google Scholar] [CrossRef] [PubMed]
- Nirala, M. Technical Note: Multi-sensor data fusion of aerosol optical thickness. Int. J. Remote Sens. 2008, 29, 2127–2136. [Google Scholar] [CrossRef]
- Xu, H.; Guang, J.; Xue, Y.; de Leeuw, G.; Che, Y.H.; Guo, J.; He, X.W.; Wang, T.K. A consistent aerosol optical depth (AOD) dataset over mainland China by integration of several AOD products. Atmos. Environ. 2015, 114, 48–56. [Google Scholar] [CrossRef]
- Ma, Z.; Hu, X.; Sayer, A.M.; Levy, R.; Zhang, Q.; Xue, Y.; Tong, S.; Bi, J.; Huang, L.; Liu, Y. Satellite-based spatiotemporal trends in PM2.5 concentrations: China, 2004–2013. Environ. Health Perspect. 2016, 124, 184–192. [Google Scholar] [CrossRef] [PubMed]
- Zheng, Y.; Zhang, Q.; Liu, Y.; Geng, G.; He, K. Estimating ground-level PM2.5 concentrations over three megalopolises in China using satellite-derived aerosol optical depth measurements. Atmos. Environ. 2016, 124, 232–242. [Google Scholar] [CrossRef]
- Qin, W.; Liu, Y.; Wang, L.; Lin, A.; Xia, X.; Che, H.; Bilal, M.; Zhang, M. Characteristic and driving factors of aerosol optical depth over Mainland China during 1980–2017. Remote Sens. 2018, 10, 1064. [Google Scholar] [CrossRef]
- Shi, H.; He, Q.; Zhang, W. Spatial factor analysis for aerosol optical depth in metropolises in China with regard to spatial heterogeneity. Atmosphere 2018, 9, 156. [Google Scholar] [CrossRef]
- He, Q.; Gu, Y.; Zhang, M. Spatiotemporal patterns of aerosol optical depth throughout China from 2003 to 2016. Sci. Total Environ. 2019, 653, 23–35. [Google Scholar] [CrossRef] [PubMed]
- Rezaei, M.; Farajzadeh, M.; Mielonen, T.; Ghavidel, Y. Analysis of spatio-temporal dust aerosol frequency over Iran based on satellite data. Atmos. Pollut. Res. 2019, 10, 508–519. [Google Scholar] [CrossRef]
- Guo, Y.; Hong, S.; Feng, N.; Zhuang, Y.; Zhang, L. Spatial distributions and temporal variations of atmospheric aerosols and the affecting factors: A case study for a region in Central China. Int. J. Remote Sens. 2012, 33, 3672–3692. [Google Scholar] [CrossRef]
- Shen, Y.; Zhang, L.; Fang, X.; Zhao, Z.; Li, X.; Wang, J.; Chai, Q. Long-term analysis of aerosol optical depth over the Huaihai Economic Region (HER): Possible causes and implications. Atmosphere 2018, 9, 93. [Google Scholar] [CrossRef]
- Papadimas, C.D.; Hatzianastassiou, N.; Mihalopoulos, N.; Querol, X.; Vardavas, I. Spatial and temporal variability in aerosol properties over the Mediterranean basin based on 6-year (2000–2006) MODIS data. J. Geophys. Res. 2008, 113, D11205. [Google Scholar] [CrossRef]
- Gunaseelan, I.; Bhaskar, B.V.; Muthuchelian, K. The effect of aerosol optical depth on rainfall with reference to meteorology over metro cities in India. Environ. Sci. Pollut. Res. 2014, 21, 8188–8197. [Google Scholar] [CrossRef]
- Soni, M.; Payra, S.; Verma, S. Particulate matter estimation over a semi arid region Jaipur, India using satellite AOD and meteorological parameters. Atmos. Pollut. Res. 2018, 9, 949–958. [Google Scholar] [CrossRef]
- Wang, P.; Ning, S.; Dai, J.; Sun, J.; Lv, M.; Song, Q.; Dai, X.; Zhao, J.; Yu, D. Trends and variability in aerosol optical depth over North China from MODIS C6 aerosol products during 2001–2016. Atmosphere 2017, 8, 223. [Google Scholar] [CrossRef]
- Li, L.; Wang, Y. What drives the aerosol distribution in Guangdong—The most developed province in Southern China? Sci. Rep. 2015, 4, 5972. [Google Scholar] [CrossRef]
- Che, H.; Zhang, X.; Alfraro, S.; Chatenet, B.; Gomes, L.; Zhao, J. Aerosol optical properties and its radiative forcing over Yulin, China in 2001 and 2002. Adv. Atmos. Sci. 2009, 26, 564–576. [Google Scholar] [CrossRef]
- Deng, X.; Shi, C.; Wu, B.; Chen, Z.; Nie, S.; He, D.; Zhang, H. Analysis of aerosol characteristics and their relationships with meteorological parameters over Anhui province in China. Atmos. Res. 2012, 109, 52–63. [Google Scholar] [CrossRef]
- Li, X.; Song, H.; Zhai, S.; Lu, S.; Kong, Y.; Xia, H.; Zhao, H. Particulate matter pollution in Chinese cities: Areal-temporal variations and their relationships with meteorological conditions (2015–2017). Environ. Pollut. 2019, 246, 11–18. [Google Scholar] [CrossRef] [PubMed]
- Lanzaco, B.L.; Olcese, L.E.; Palancar, G.G.; Toselli, B.M. A method to improve MODIS AOD values: Application to South America. Aerosol Air Qual. Res. 2016, 16, 1509–1522. [Google Scholar] [CrossRef]
- Comber, A.; Chi, K.; Huy, M.Q.; Nguyen, Q.; Lu, B.; Phe, H.H.; Harris, P. Distance metric choice can both reduce and induce collinearity in geographically weighted regression. Environ. Plan. B Urban Anal. City Sci. 2018. [Google Scholar] [CrossRef]
- Luo, L.; Mei, K.; Qu, L.; Zhang, C.; Chen, H.; Wang, S.; Di, D.; Huang, H.; Wang, Z.; Xia, F.; et al. Assessment of the geographical detector method for investigating heavy metal source apportionment in an urban watershed of Eastern China. Sci. Total Environ. 2019, 653, 714–722. [Google Scholar] [CrossRef] [PubMed]
- Wang, J.; Li, X.; Christakos, G.; Liao, Y.; Zhang, T.; Gu, X.; Zheng, X. Geographical detectors-based health risk assessment and its application in the neural tube defects study of the Heshun Region, China. Int. J. Geogr. Inf. Sci. 2010, 24, 107–127. [Google Scholar] [CrossRef]
- Cao, Z.; Liu, T.; Li, X.; Wang, J.; Lin, H.; Chen, L.; Wu, Z.; Ma, W. Individual and interactive effects of socio-ecological factors on dengue fever at fine spatial scale: A geographical detector-based analysis. Int. J. Environ. Res. Public Health 2017, 14, 795. [Google Scholar] [CrossRef] [PubMed]
- Zhou, C.; Chen, J.; Wang, S. Examining the effects of socioeconomic development on fine particulate matter (PM2.5) in China’s cities using spatial regression and the geographical detector technique. Sci. Total Environ. 2018, 619–620, 436–445. [Google Scholar] [CrossRef] [PubMed]
- Ding, Y.; Zhang, M.; Qian, X.; Li, C.; Chen, S.; Wang, W. Using the geographical detector technique to explore the impact of socioeconomic factors on PM2.5 concentrations in China. J. Clean. Prod. 2019, 211, 1480–1490. [Google Scholar] [CrossRef]
- Song, X.; Hao, Y.; Zhang, C.; Peng, J.; Zhu, X. Vehicular emission trends in the Pan-Yangtze River Delta in China between 1999 and 2013. J. Clean. Prod. 2016, 137, 1045–1054. [Google Scholar] [CrossRef]
- Wu, Y.; Zhu, X.; Gao, W.; Qian, F. The spatial characteristics of coupling relationship between urbanization and eco-environment in the Pan Yangtze River Delta. Energy Procedia 2018, 152, 1121–1126. [Google Scholar] [CrossRef]
- Cui, Y.; Li, L.; Chen, L.; Zhang, Y.; Cheng, L.; Zhou, X.; Yang, X. Land-use carbon emissions estimation for the Yangtze River Delta urban agglomeration using 1994–2016 Landsat image data. Remote Sens. 2018, 10, 1334. [Google Scholar] [CrossRef]
- Ma, Z.; Liu, Y.; Zhao, Q.; Liu, M.; Zhou, Y.; Bi, J. Satellite-derived high resolution PM2.5 concentrations in Yangtze River Delta Region of China using improved linear mixed effects model. Atmos. Environ. 2016, 133, 156–164. [Google Scholar] [CrossRef]
- Yun, G.; He, Y.; Jiang, Y.; Dou, P.; Dai, S. PM2.5 spatiotemporal evolution and drivers in the Yangtze River Delta between 2005 and 2015. Atmosphere 2019, 10, 55. [Google Scholar] [CrossRef]
- Wang, X.; Guo, Z.; Wang, Y.; Chen, Y.; Zheng, X.; Xu, X. Monitoring temporal–spatial variations of AOD over the Yangtze River Delta, China. Stoch. Environ. Res. Risk Assess. 2018, 32, 2619–2632. [Google Scholar] [CrossRef]
- Xia, H.; Wang, H.; Ji, G. Regional inequality and influencing factors of primary PM emissions in the Yangtze River Delta, China. Sustainability 2019, 11, 2269. [Google Scholar] [CrossRef]
- Xu, Y.; Xu, Y.; Wang, Y.; Wu, L.; Li, G.; Song, S. Spatial and temporal trends of reference crop evapotranspiration and its influential variables in Yangtze River Delta, eastern China. Theor. Appl. Climatol. 2017, 130, 945–958. [Google Scholar] [CrossRef]
- National Bureau of Statistics; Ministry of Environmental Protection of the People’s Republic of China. China Statistical Yearbook on Environment 2015; China Statistics Press: Beijing, China, 2015. (In Chinese) [Google Scholar]
- Ministry of Environmental Protection; General Administration of Quality Supervision, Inspection and Quarantine of the People’s Republic of China. Ambient Air Quality Standards (GB3095-2012); China Environmental Science Press: Beijing, China, 2012. (In Chinese) [Google Scholar]
- Jung, C.; Hwang, B.; Chen, W. Incorporating long-term satellite-based aerosol optical depth, localized land use data, and meteorological variables to estimate ground-level PM2.5 concentrations in Taiwan from 2005 to 2015. Environ. Pollut. 2018, 237, 1000–1010. [Google Scholar] [CrossRef]
- Level 1 and Atmosphere Archive and Distribution System. Available online: https://ladsweb.nascom.nasa.gov/ (accessed on 10 July 2018).
- Levy, R.C.; Mattoo, S.; Munchak, L.A.; Remer, L.A.; Sayer, A.M.; Patadia, F.; Hsu, N.C. The Collection 6 MODIS aerosol products over land and ocean. Atmos. Meas. Tech. 2013, 6, 2989–3034. [Google Scholar] [CrossRef]
- Aerosol Robotic Network. Available online: https://aeronet.gsfc.nasa.gov/ (accessed on 20 August 2018).
- Holben, B.N.; Eck, T.F.; Slutsker, I.; Tanré, D.; Buis, J.P.; Setzer, A.; Vermote, E.; Reagan, J.A.; Kaufman, Y.J.; Nakajima, T.; et al. AERONET—A federated instrument network and data archive for aerosol characterization. Remote Sens. Environ. 1998, 66, 1–16. [Google Scholar] [CrossRef]
- Holben, B.N.; Tanré, D.; Smirnov, A.; Eck, T.F.; Slutsker, I.; Abuhassan, N.; Newcomb, W.W.; Schafer, J.S.; Chatenet, B.; Lavenu, F.; et al. An emerging ground-based aerosol climatology: Aerosol optical depth from AERONET. J. Geophys. Res. Atmos. 2001, 106, 12067–12097. [Google Scholar] [CrossRef]
- Ichoku, C. A spatio-temporal approach for global validation and analysis of MODIS aerosol products. Geophys. Res. Lett. 2002, 29, 8006. [Google Scholar] [CrossRef]
- Prados, A.I.; Kondragunta, S.; Ciren, P.; Knapp, K.R. GOES Aerosol/Smoke Product (GASP) over North America: Comparisons to AERONET and MODIS observations. J. Geophys. Res. 2007, 112, D15201. [Google Scholar] [CrossRef]
- Ma, Y.; Li, Z.; Li, Z.; Xie, Y.; Fu, Q.; Li, D.; Zhang, Y.; Xu, H.; Li, K. Validation of MODIS aerosol optical depth retrieval over mountains in Central China based on a sun-sky radiometer site of SONET. Remote Sens. 2016, 8, 111. [Google Scholar] [CrossRef]
- Chu, D.A.; Kaufman, Y.J.; Ichoku, C. Validation of MODIS aerosol optical depth retrieval over land. Geophys. Res. Lett. 2002, 29, 1617. [Google Scholar] [CrossRef]
- Consultative Group for International Agriculture Research Consortium for Spatial Information. Available online: http://srtm.csi.cgiar.org/ (accessed on 1 March 2019).
- China Meteorological Data Service Center. Available online: http://data.cma.cn/en (accessed on 25 October 2018).
- European Center for Medium-Range Weather Forecasts. Available online: http://www.ecmwf.int/ (accessed on 19 August 2019).
- Data Center for Resources and Environmental Sciences, Chinese Academy of Sciences. Available online: http://www.resdc.cn/ (accessed on 11 February 2019).
- Tang, Q.; Bo, Y.; Zhu, Y. Spatiotemporal fusion of multiple-satellite aerosol optical depth (AOD) products using Bayesian maximum entropy method. J. Geophys. Res. Atmos. 2016, 121, 4034–4048. [Google Scholar] [CrossRef]
- Jinnagara Puttaswamy, S.; Nguyen, H.M.; Braverman, A.; Hu, X.; Liu, Y. Statistical data fusion of multi-sensor AOD over the Continental United States. Geocarto Int. 2014, 29, 48–64. [Google Scholar] [CrossRef]
- Zhang, R.; Di, B.; Luo, Y.; Deng, X.; Grieneisen, M.L.; Wang, Z.; Yao, G.; Zhan, Y. A nonparametric approach to filling gaps in satellite-retrieved aerosol optical depth for estimating ambient PM2.5 levels. Environ. Pollut. 2018, 243, 998–1007. [Google Scholar] [CrossRef]
- Wei, J.; Li, Z.; Peng, Y.; Sun, L.; Yan, X. A regionally robust high-spatial-resolution aerosol retrieval algorithm for MODIS images over Eastern China. IEEE Trans. Geosci. Remote Sens. 2019, 57, 4748–4757. [Google Scholar] [CrossRef]
- Meng, C.; Cheng, T.; Gu, X.; Shi, S.; Wang, W.; Wu, Y.; Bao, F. Contribution of meteorological factors to particulate pollution during winters in Beijing. Sci. Total Environ. 2019, 656, 977–985. [Google Scholar] [CrossRef] [PubMed]
- Meng, X.; Fu, Q.; Ma, Z.; Chen, L.; Zou, B.; Zhang, Y.; Xue, W.; Wang, J.; Wang, D.; Kan, H.; et al. Estimating ground-level PM10 in a Chinese city by combining satellite data, meteorological information and a land use regression model. Environ. Pollut. 2016, 208, 177–184. [Google Scholar] [CrossRef] [PubMed]
- Wang, J.; Zhang, T.; Fu, B. A measure of spatial stratified heterogeneity. Ecol. Indic. 2016, 67, 250–256. [Google Scholar] [CrossRef]
- Qiao, P.; Lei, M.; Guo, G.; Yang, J.; Zhou, X.; Chen, T. Quantitative analysis of the factors influencing soil heavymetal lateral migration in rainfalls based on geographical detector software: A case study in Huanjiang County, China. Sustainability 2017, 9, 1227. [Google Scholar] [CrossRef]
- Tang, C.; Yang, C.; Cai, R.S.; Ye, H.; Duan, L.; Zhang, Z.; Shi, Z.; Lin, K.; Song, J.; Huang, X.; et al. Analysis of the relationship between electromagnetic radiation characteristics and urban functions in highly populated urban areas. Sci. Total Environ. 2019, 654, 535–540. [Google Scholar] [CrossRef] [PubMed]
- He, Q.; Zhang, M.; Huang, B. Spatio-temporal variation and impact factors analysis of satellite-based aerosol optical depth over China from 2002 to 2015. Atmos. Environ. 2016, 129, 79–90. [Google Scholar] [CrossRef]
- Li, L.; Bakelants, L.; Solana, C.; Canters, F.; Kervyn, M. Dating lava flows of tropical volcanoes by means of spatial modeling of vegetation recovery. Earth Surf. Process. Landf. 2018, 43, 840–856. [Google Scholar] [CrossRef]
- Boiyo, R.; Kumar, K.R.; Zhao, T.; Bao, Y. Climatological analysis of aerosol optical properties over East Africa observed from space-borne sensors during 2001–2015. Atmos. Environ. 2017, 152, 298–313. [Google Scholar] [CrossRef]
- Goodale, C.; Aber, J.; Ollinger, S. Mapping monthly precipitation, temperature, and solar radiation for Ireland with polynomial regression and a digital elevation model. Clim. Res. 1998, 10, 35–49. [Google Scholar] [CrossRef]
- Li, R.; Wang, Z.; Cui, L.; Fu, H.; Zhang, L.; Kong, L.; Chen, W.; Chen, J. Air pollution characteristics in China during 2015–2016: Spatiotemporal variations and key meteorological factors. Sci. Total Environ. 2019, 648, 902–915. [Google Scholar] [CrossRef]
- Ng, D.H.L.; Li, R.; Raghavan, S.V.; Liong, S.-Y. Investigating the relationship between aerosol optical depth and precipitation over Southeast Asia with relative humidity as an influencing factor. Sci. Rep. 2017, 7, 13395. [Google Scholar] [CrossRef] [PubMed]


| AOD Data Products Types | Scientific Data Set (SDS) | Contents | Temporal Range | Use |
|---|---|---|---|---|
| Terra/Aqua 3-km DT AOD | Optical_Depth_Land_And_Ocean | DT AOD (QA = 3) | 2005.1.1–2013.12.31 | Calibration |
| 2014.1.1–2017.12.31 | Spatiotemporal characteristics and influencing factors analysis | |||
| Terra/Aqua 10-km DB AOD | Deep_Blue_Aerosol_Optical_Depth_550_Land_Best_Estimate | DB AOD (QA ≥ 2) | 2005.1.1–2013.12.31 | Calibration |
| 2014.1.1–2017.12.31 | Spatiotemporal characteristics and influencing factors analysis |
| Number | Site Name | Longitude (°N) | Latitude (°E) | Elevation (m) | Period of Available Data |
|---|---|---|---|---|---|
| 1 | XuZhou-CUMT | 117.1417 | 34.2167 | 59.7 | 2013–2017 |
| 2 | Shouxian | 116.7820 | 32.5584 | 22.7 | 2008 |
| 3 | Hefei | 117.1622 | 31.9047 | 36 | 2005–2008, 2016 |
| 4 | NUIST | 118.7172 | 32.2065 | 62 | 2007–2010 |
| 5 | SONET_Nanjing | 118.9570 | 32.1150 | 52 | 2016 |
| 6 | Taihu | 120.2153 | 31.4210 | 20 | 2005–2017 |
| 7 | SONET_Shanghai | 121.4810 | 31.2840 | 24 | 2016 |
| 8 | Shanghi_Minhang | 121.3973 | 31.1305 | 49 | 2008–2009 |
| 9 | Shanghi_Met | 121.5485 | 31.2214 | 5 | 2007 |
| 10 | Hangzhou_City | 120.1569 | 30.2896 | 30 | 2008–2009 |
| 11 | Hangzhou-ZFU | 119.7274 | 30.2572 | 42 | 2007–2009 |
| 12 | LA-TM | 119.4400 | 30.3240 | 439 | 2007–2009 |
| 13 | Qiandaohu | 119.0526 | 29.5557 | 133 | 2007–2008 |
| 14 | Ningbo | 121.5469 | 29.8599 | 37 | 2007–2008 |
| 15 | SONET_Zhoushan | 122.1880 | 29.9940 | 29 | 2016 |
© 2019 by the authors. Licensee MDPI, Basel, Switzerland. This article is an open access article distributed under the terms and conditions of the Creative Commons Attribution (CC BY) license (http://creativecommons.org/licenses/by/4.0/).
Share and Cite
Cheng, L.; Li, L.; Chen, L.; Hu, S.; Yuan, L.; Liu, Y.; Cui, Y.; Zhang, T. Spatiotemporal Variability and Influencing Factors of Aerosol Optical Depth over the Pan Yangtze River Delta during the 2014–2017 Period. Int. J. Environ. Res. Public Health 2019, 16, 3522. https://doi.org/10.3390/ijerph16193522
Cheng L, Li L, Chen L, Hu S, Yuan L, Liu Y, Cui Y, Zhang T. Spatiotemporal Variability and Influencing Factors of Aerosol Optical Depth over the Pan Yangtze River Delta during the 2014–2017 Period. International Journal of Environmental Research and Public Health. 2019; 16(19):3522. https://doi.org/10.3390/ijerph16193522
Chicago/Turabian StyleCheng, Liang, Long Li, Longqian Chen, Sai Hu, Lina Yuan, Yunqiang Liu, Yifan Cui, and Ting Zhang. 2019. "Spatiotemporal Variability and Influencing Factors of Aerosol Optical Depth over the Pan Yangtze River Delta during the 2014–2017 Period" International Journal of Environmental Research and Public Health 16, no. 19: 3522. https://doi.org/10.3390/ijerph16193522
APA StyleCheng, L., Li, L., Chen, L., Hu, S., Yuan, L., Liu, Y., Cui, Y., & Zhang, T. (2019). Spatiotemporal Variability and Influencing Factors of Aerosol Optical Depth over the Pan Yangtze River Delta during the 2014–2017 Period. International Journal of Environmental Research and Public Health, 16(19), 3522. https://doi.org/10.3390/ijerph16193522