Intersections and Non-Intersections: A Protocol for Identifying Pedestrian Crash Risk Locations in GIS


Abstract
:1. Introduction
2. Materials and Methods
2.1. Data
2.1.1. Pedestrian Crashes
- Type 1: At driveway within major intersection;
- Type 2: At intersection and not related;
- Type 3: At intersection and related;
- Type 4: Circulating roundabout;
- Type 5: Exiting roundabout;
- Type 6: At driveway;
- Type 7: Driveway related but not at driveway;
- Type 8: Intersection related but not at intersection;
- Type 9: Not at intersection and not related.
2.1.2. Roadway Lanes and Legal Speed Limits
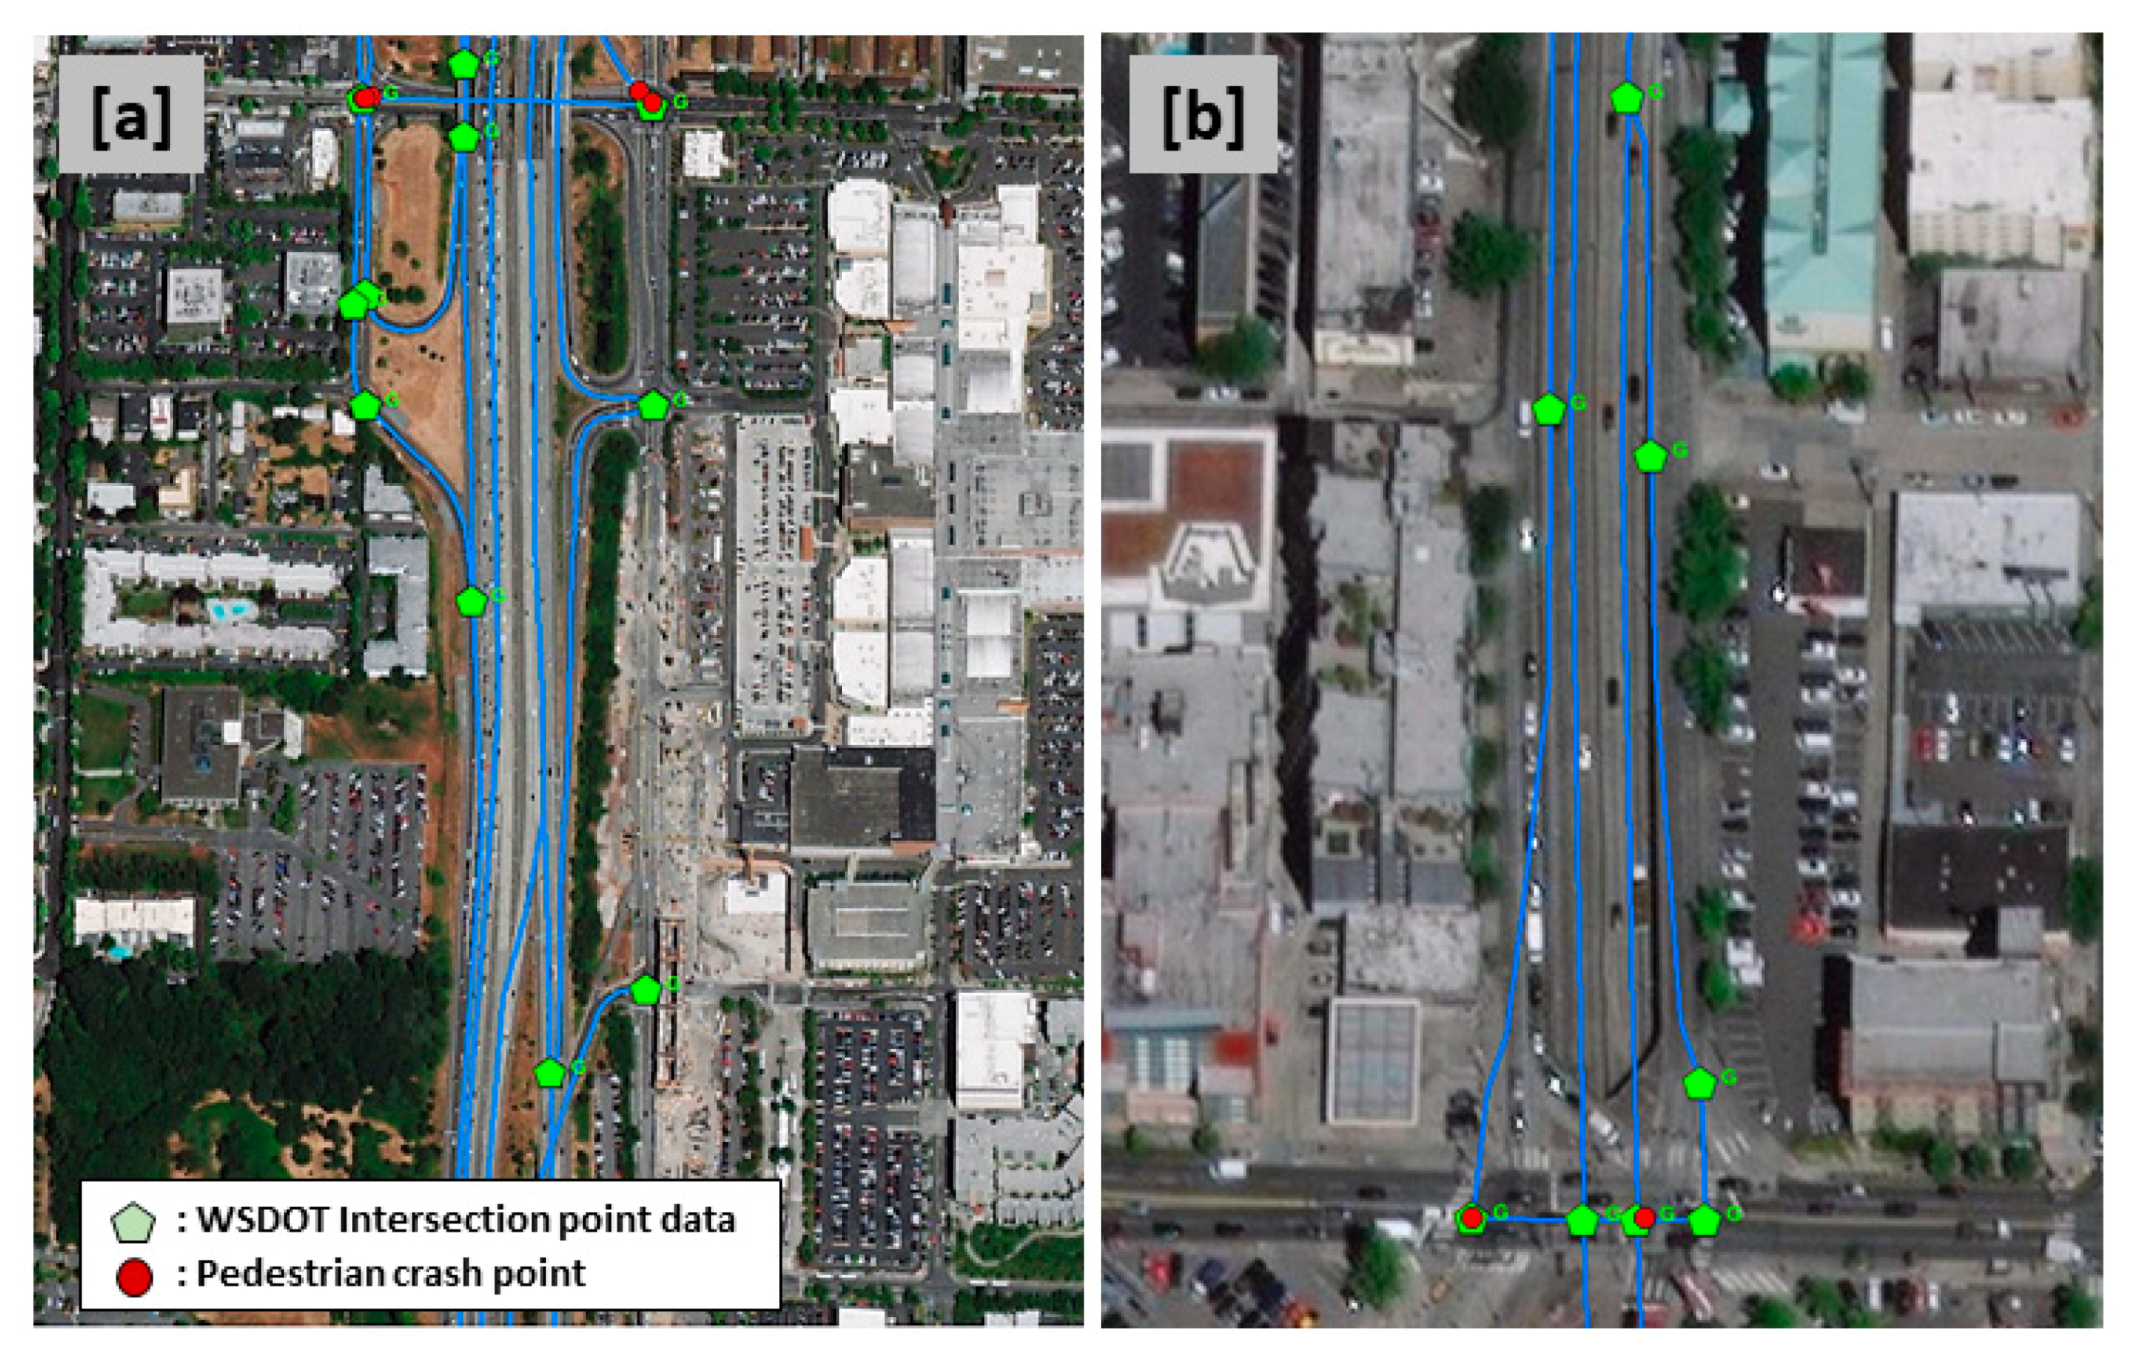
2.1.3. Investigating Intersection Point Data
- Type A: A lane becoming an on ramp to a limited access road;
- Type E: An off-ramp lane to a limited access road;
- Type G: An intersection where roadways are crossed at a common grade;
- Type N: An entrance lane to a limited access road;
- Type O: On and off ramp lanes to limited access roads.
- Type R: Roundabouts;
- Type T: An entrance or an exit lane to a limited access road;
- Type X: An exit lane from a limited access road;
- Type Y: A WYE (Y) connection where lanes formed three legs in the general form of a Y and the angle between 2 legs is less than 60 degrees.
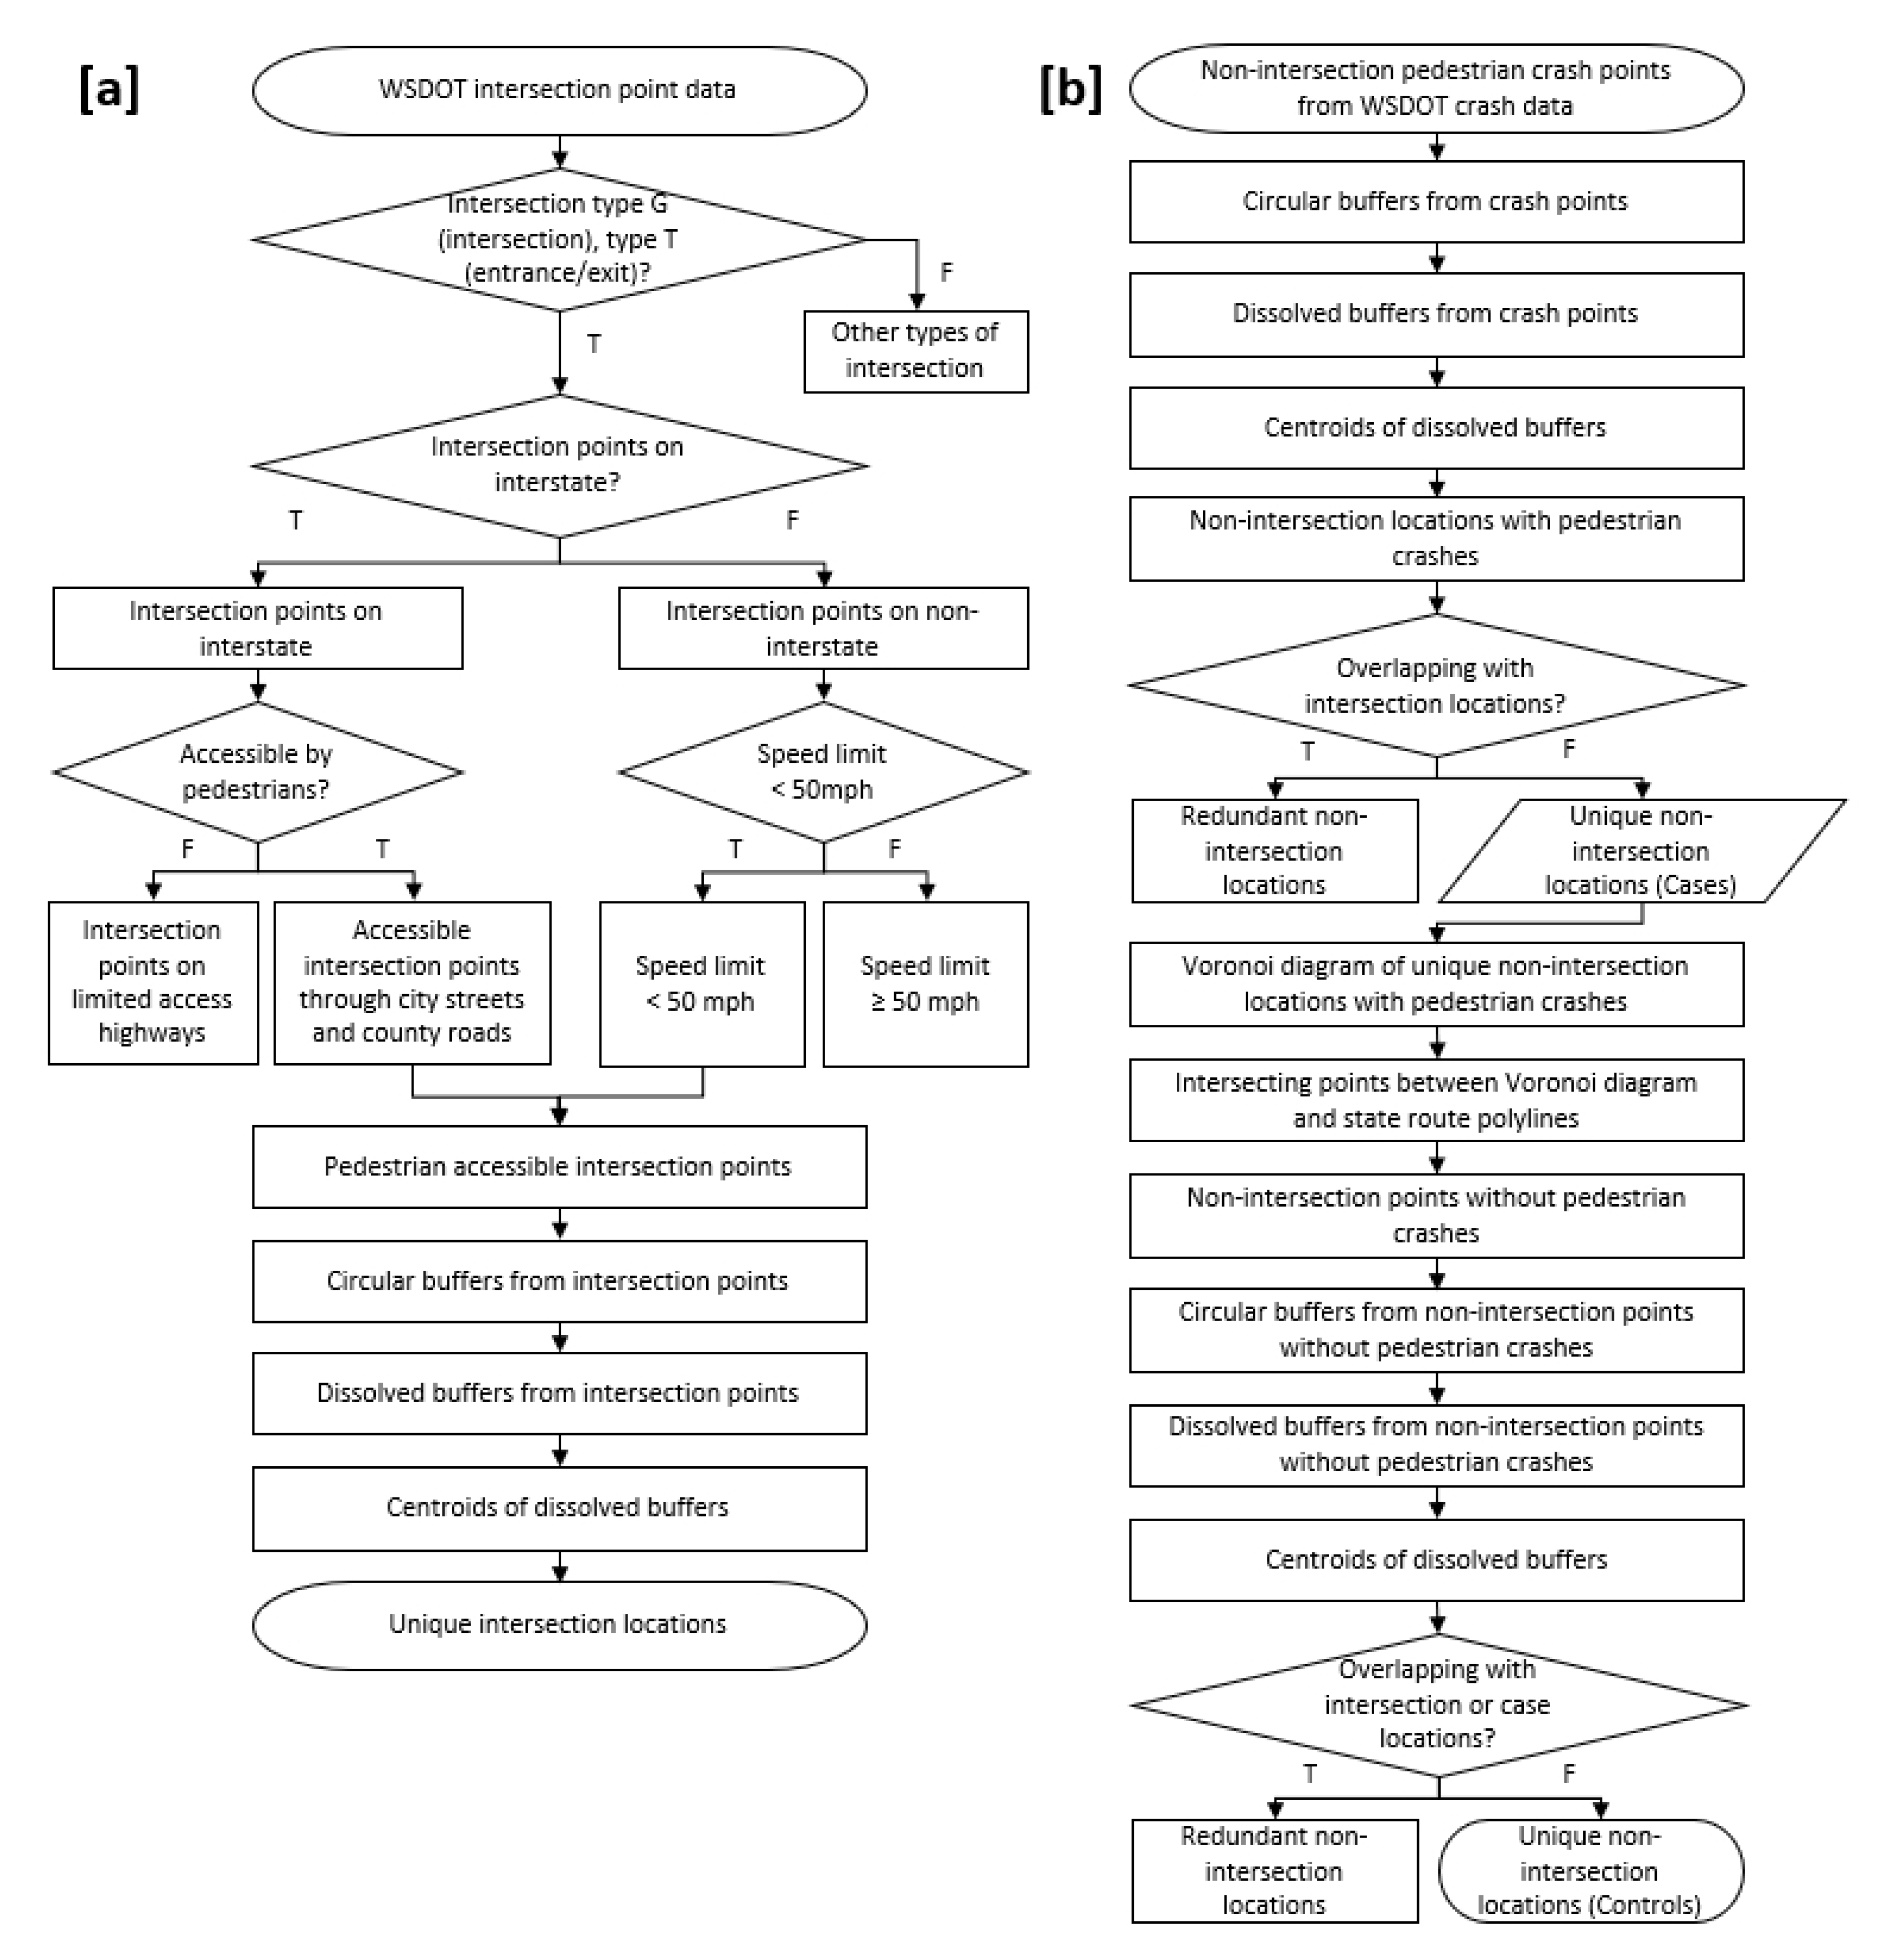
2.2. Decision Tree Algorithms
2.2.1. Intersection Points on Limited Access Roadways
2.2.2. Detecting Unique Intersection Locations
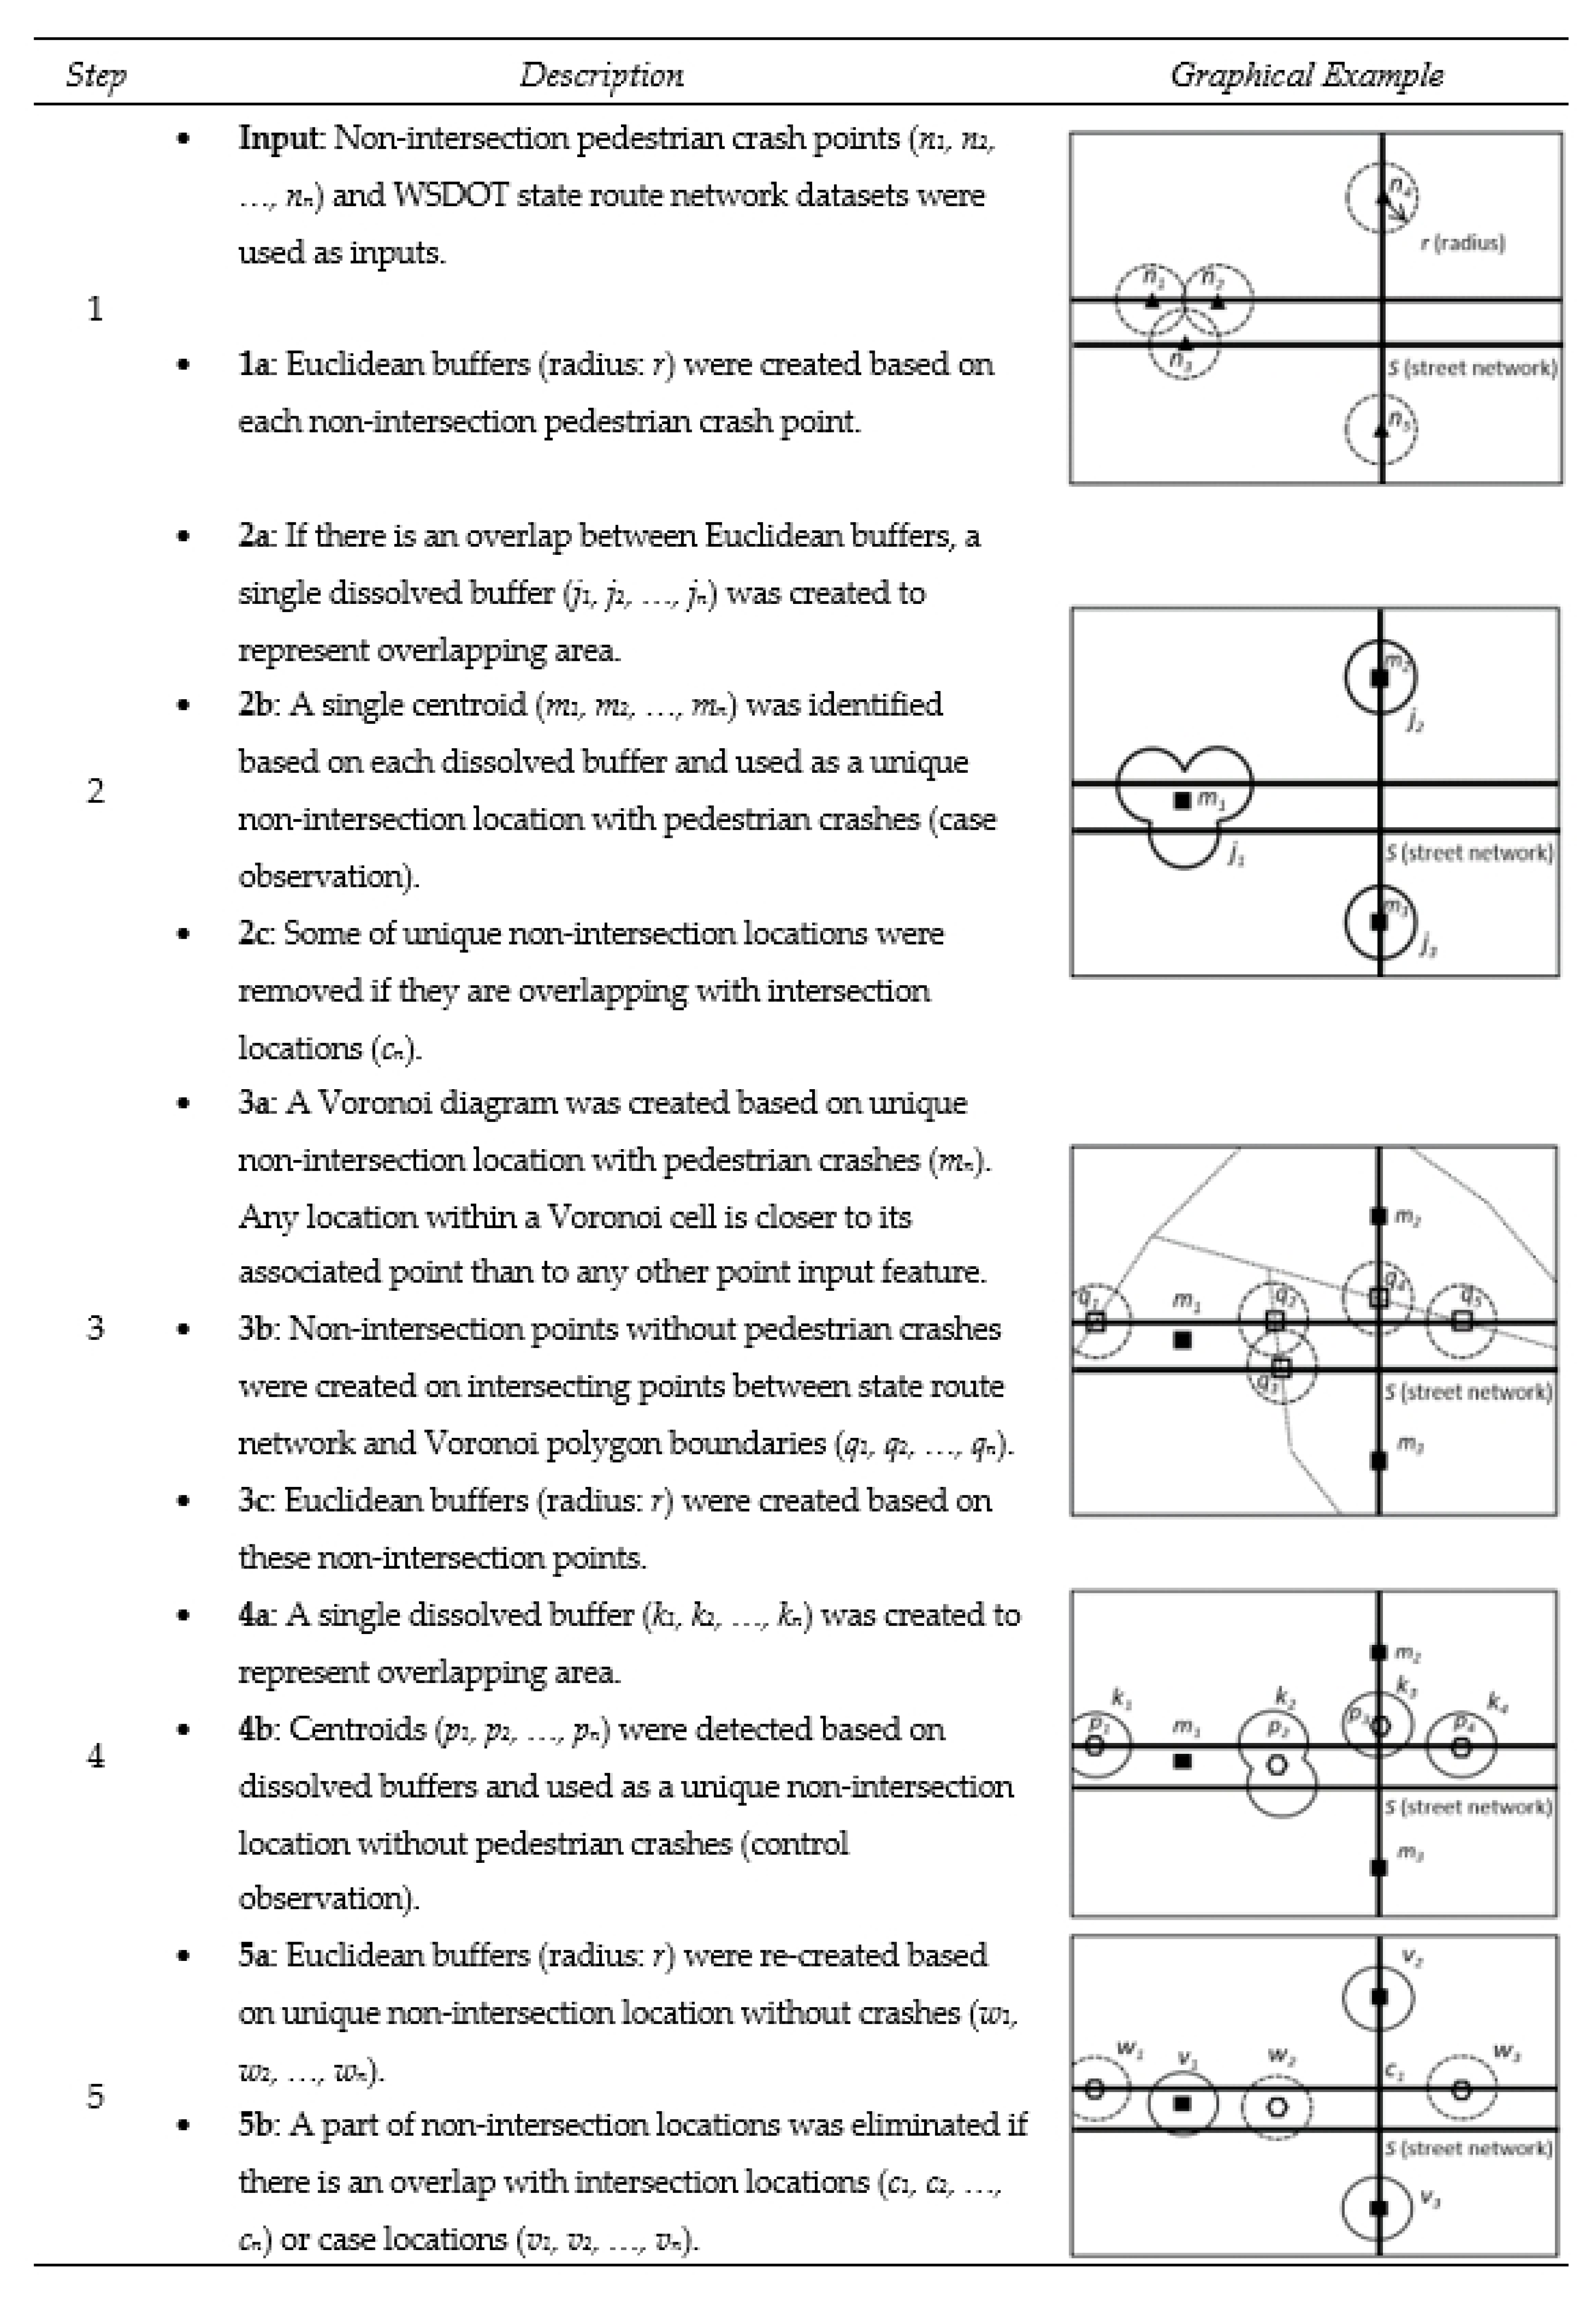
2.2.3. Detecting Unique Non-Intersection Locations
2.3. Parameter Setting and Assessment
3. Results
3.1. Effect of Buffer Size on the Number of Unique Crash-Risk Locations
3.2. Overall Performance of the Algorithms
3.3. Agreement between Algorithm Crash-risk Locations and Location Type in WSDOT Crash Data
4. Discussion
5. Conclusions
Author Contributions
Funding
Acknowledgments
Conflicts of Interest
References
- Millward, H.; Spinney, J.; Scott, D. Active-transport walking behavior: Destinations, durations, distances. J. Transp. Geogr. 2013, 28, 101–110. [Google Scholar] [CrossRef]
- Ogilvie, D.; Foster, C.E.; Rothnie, H.; Cavill, N.; Hamilton, V.; Fitzsimons, C.F.; Mutrie, N. Interventions to promote walking: Systematic review. BMJ 2007, 334, 1204. [Google Scholar] [CrossRef] [PubMed]
- Tight, M.; Timms, P.; Banister, D.; Bowmaker, J.; Copas, J.; Day, A.; Drinkwater, D.; Givoni, M.; Gühnemann, A.; Lawler, M.; et al. Visions for a walking and cycling focussed urban transport system. J. Transp. Geogr. 2011, 19, 1580–1589. [Google Scholar] [CrossRef]
- Pucher, J.; Dijkstra, L. Promoting Safe Walking and Cycling to Improve Public Health: Lessons from The Netherlands and Germany. Am. J. Public Health 2003, 93, 1509–1516. [Google Scholar] [CrossRef] [PubMed]
- Pedestrian Traffic Fatalities by State: 2017 Preliminary Data|GHSA. Available online: https://www.ghsa.org/resources/spotlight-pedestrians18 (accessed on 18 October 2018).
- Quistberg, D.A.; Howard, E.J.; Ebel, B.E.; Moudon, A.V.; Saelens, B.E.; Hurvitz, P.M.; Curtin, J.E.; Rivara, F.P. Multilevel models for evaluating the risk of pedestrian-motor vehicle collisions at intersections and mid-blocks. Accid. Anal. Prev. 2015, 84, 99–111. [Google Scholar] [CrossRef] [PubMed]
- Moudon, A.V.; Lin, L.; Jiao, J.; Hurvitz, P.; Reeves, P. The risk of pedestrian injury and fatality in collisions with motor vehicles, a social ecological study of state routes and city streets in King County, Washington. Accid. Anal. Prev. 2011, 43, 11–24. [Google Scholar] [CrossRef]
- Lee, C.; Abdel-Aty, M. Comprehensive analysis of vehicle–pedestrian crashes at intersections in Florida. Accid. Anal. Prev. 2005, 37, 775–786. [Google Scholar] [CrossRef] [PubMed]
- Pulugurtha, S.S.; Sambhara, V.R. Pedestrian crash estimation models for signalized intersections. Accid. Anal. Prev. 2011, 43, 439–446. [Google Scholar] [CrossRef] [PubMed]
- Schneider, R.J.; Diógenes, M.C.; Arnold, L.S.; Attaset, V.; Griswold, J.; Ragland, D.R. Association between Roadway Intersection Characteristics and Pedestrian Crash Risk in Alameda County, California. Transp. Res. Rec. J. Transp. Res. Board 2010, 2198, 41–51. [Google Scholar] [CrossRef] [Green Version]
- Yu, C.-Y. How Differences in Roadways Affect School Travel Safety. J. Am. Plan. Assoc. 2015, 81, 203–220. [Google Scholar] [CrossRef]
- Al-Ghamdi, A.S. Using logistic regression to estimate the influence of accident factors on accident severity. Accid. Anal. Prev. 2002, 34, 729–741. [Google Scholar] [CrossRef]
- Abdel-Aty, M. Analysis of driver injury severity levels at multiple locations using ordered probit models. J. Saf. Res. 2003, 34, 597–603. [Google Scholar] [CrossRef]
- Moore, D.N.; Schneider, W.H.; Savolainen, P.T.; Farzaneh, M. Mixed logit analysis of bicyclist injury severity resulting from motor vehicle crashes at intersection and non-intersection locations. Accid. Anal. Prev. 2011, 43, 621–630. [Google Scholar] [CrossRef] [PubMed]
- Milton, J.; Mannering, F. The relationship among highway geometrics, traffic-related elements and motor-vehicle accident frequencies. Transportation 1998, 25(4), 395–413. [Google Scholar] [CrossRef]
- Nie, K.; Wang, Z.; Du, Q.; Ren, F.; Tian, Q.; Nie, K.; Wang, Z.; Du, Q.; Ren, F.; Tian, Q. A Network-Constrained Integrated Method for Detecting Spatial Cluster and Risk Location of Traffic Crash: A Case Study from Wuhan, China. Sustainability 2015, 7, 2662–2677. [Google Scholar] [CrossRef] [Green Version]
- Huang, H.; Abdel-Aty, M.A.; Darwiche, A.L. County-Level Crash Risk Analysis in Florida: Bayesian Spatial Modeling. Transport Res. Rec. 2010, 2148, 27–37. [Google Scholar] [CrossRef]
- Wier, M.; Weintraub, J.; Humphreys, E.H.; Seto, E.; Bhatia, R. An area-level model of vehicle-pedestrian injury collisions with implications for land use and transportation planning. Accid. Ana. Prev. 2009, 41, 137–145. [Google Scholar] [CrossRef]
- Xie, K.; Ozbay, K.; Kurkcu, A.; Yang, H. Analysis of Traffic Crashes Involving Pedestrians Using Big Data: Investigation of Contributing Factors and Identification of Hotspots. Risk Anal. 2017, 37, 1459–1476. [Google Scholar] [CrossRef]
- Xie, Z.; Yan, J. Kernel Density Estimation of traffic accidents in a network space. Comput. Environ. Urban Syst. 2008, 32, 396–406. [Google Scholar] [CrossRef] [Green Version]
- Hancock, M.W.; Wright, B. A Policy on Geometric Design of Highways and Streets; American Association of State Highway and Transportation Officials: Washington, DC, USA, 2013. [Google Scholar]
- Wang, X.; Abdel-Aty, M.; Brady, P. Crash Estimation at Signalized Intersections: Significant Factors and Temporal Effect. Transp. Res. Rec. J. Transp. Res. Board 2006, 1953, 10–20. [Google Scholar] [CrossRef]
- Pietrucha, M.T.; Opiela, K.S. Safe accommodation of pedestrians at intersections. Transport Res. Rec. 1993, 1385, 12. [Google Scholar]
- Forsyth, A.; Van Riper, D.; Larson, N.; Wall, M.; Neumark-Sztainer, D. Creating a replicable, valid cross-platform buffering technique: The sausage network buffer for measuring food and physical activity built environments. Int. J. Health Geogr. 2012, 11, 14. [Google Scholar] [CrossRef] [PubMed]
- Mitra, S. Spatial Autocorrelation and Bayesian Spatial Statistical Method for Analyzing Intersections Prone to Injury Crashes. Transp. Res. Rec. J. Transp. Res. Board 2009, 2136, 92–100. [Google Scholar] [CrossRef]
- Poch, M.; Mannering, F. Negative Binomial Analysis of Intersection-Accident Frequencies. J. Transp. Eng. 1996, 122, 105–113. [Google Scholar] [CrossRef] [Green Version]
- Guo, F.; Wang, X.; Abdel-Aty, M.A. Modeling signalized intersection safety with corridor-level spatial correlations. Accid. Anal. Prev. 2010, 42, 84–92. [Google Scholar] [CrossRef]
- Forsyth, A.; Schmitz, K.H.; Oakes, M.; Zimmerman, J.; Koepp, J. Standards for Environmental Measurement Using GIS: Toward a Protocol for Protocols. J. Phys. Act. Health 2006, 3, S241–S257. [Google Scholar] [CrossRef] [Green Version]
- Shankar, V.N.; Ulfarsson, G.F.; Pendyala, R.M.; Nebergall, M.B. Modeling crashes involving pedestrians and motorized traffic. Saf. Sci. 2003, 41, 627–640. [Google Scholar] [CrossRef]
- Satria, R.; Castro, M. GIS Tools for Analyzing Accidents and Road Design: A Review. Transp. Res. Procedia 2016, 18, 242–247. [Google Scholar] [CrossRef]
- Ma, L.; Yan, X.; Qiao, W. A Quasi-Poisson Approach on Modeling Accident Hazard Index for Urban Road Segments. Discret. Dyn. Nat. Soc. 2014, 2014, 1–8. [Google Scholar] [CrossRef] [Green Version]
- Aguero-Valverde, J.; Jovanis, P.P. Spatial analysis of fatal and injury crashes in Pennsylvania. Accid. Anal. Prev. 2006, 38, 618–625. [Google Scholar] [CrossRef]
- Song, J.; Ghosh, M.; Miaou, S.; Mallick, B. Bayesian multivariate spatial models for roadway traffic crash mapping. J. Multivar. Anal. 2006, 97, 246–273. [Google Scholar] [CrossRef]
- Quddus, M.A. Modelling area-wide count outcomes with spatial correlation and heterogeneity: An analysis of London crash data. Accid. Anal. Prev. 2008, 40, 1486–1497. [Google Scholar] [CrossRef] [PubMed] [Green Version]


| Parameter | 20 m | 40 m | 60 m | 80 m | 100 m |
|---|---|---|---|---|---|
| Unique Intersection | |||||
| With recorded crash | 794 (10.6%) | 818 (12.3%) | 596 (12.8%) | 514 (13.8%) | 428 (14.2%) |
| With no recorded crash | 6728 (89.4%) | 5808 (87.7%) | 4056 (87.2%) | 3212 (86.2%) | 2591 (85.8%) |
| Total | 7522 | 6626 | 4652 | 3726 | 3019 |
| Unique Non-intersection | |||||
| With recorded crash | 567 (35.3%) | 455 (38.0%) | 419 (38.3%) | 374 (37.9%) | 370 (38.7%) |
| With no recorded crash | 1041 (64.7%) | 743 (62.0%) | 674 (61.7%) | 612 (62.1%) | 585 (61.3%) |
| Total | 1608 | 1198 | 1093 | 986 | 955 |
| Parameter | 20 m | 40 m | 60 m | 80 m | 100 m |
|---|---|---|---|---|---|
| Others (not captured by crash-risk locations) | 284 (12.8%) | 351 (15.8%) | 629 (28.3%) | 784 (35.3%) | 781 (39.2%) |
| Within intersection location buffers | 1324 (59.6%) | 1364 (61.4%) | 1063 (47.8%) | 928 (41.8%) | 793 (35.7%) |
| Within non-intersection location buffers | 614 (27.6%) | 507 (22.8%) | 530 (23.9%) | 510 (23.0%) | 558 (25.1%) |
| Total | 2222 | 2222 | 2222 | 2222 | 2222 |
| Buffer Radius (r) | Count of Pedestrian Crashes | |||
|---|---|---|---|---|
| All Algorithm Intersection Crash Locations | Location Type from WSDOT Crash Data | Agreement | ||
| Intersection | Non-Intersection | |||
| 20 m | 1,324 | 1246 | 78 | 94.1% |
| 40 m | 1,364 | 1202 | 162 | 88.1% |
| 60 m | 1,063 | 907 | 156 | 85.3% |
| 80 m | 928 | 761 | 167 | 82.0% |
| 100 m | 793 | 628 | 165 | 79.2% |
| Buffer Radius (r) | Count of Pedestrian Crashes | |||
|---|---|---|---|---|
| All Algorithm Non-Intersection Crash Locations | Location Type from WSDOT Crash Data | Agreement | ||
| Intersection | Non-Intersection | |||
| 20 m | 614 | 12 | 602 | 98.0% |
| 40 m | 507 | 11 | 496 | 97.8% |
| 60 m | 530 | 65 | 465 | 87.7% |
| 80 m | 510 | 86 | 424 | 83.1% |
| 100 m | 558 | 124 | 434 | 77.8% |
© 2019 by the authors. Licensee MDPI, Basel, Switzerland. This article is an open access article distributed under the terms and conditions of the Creative Commons Attribution (CC BY) license (http://creativecommons.org/licenses/by/4.0/).
Share and Cite
Kang, M.; Moudon, A.V.; Kim, H.; Boyle, L.N. Intersections and Non-Intersections: A Protocol for Identifying Pedestrian Crash Risk Locations in GIS. Int. J. Environ. Res. Public Health 2019, 16, 3565. https://doi.org/10.3390/ijerph16193565
Kang M, Moudon AV, Kim H, Boyle LN. Intersections and Non-Intersections: A Protocol for Identifying Pedestrian Crash Risk Locations in GIS. International Journal of Environmental Research and Public Health. 2019; 16(19):3565. https://doi.org/10.3390/ijerph16193565
Chicago/Turabian StyleKang, Mingyu, Anne Vernez Moudon, Haena Kim, and Linda Ng Boyle. 2019. "Intersections and Non-Intersections: A Protocol for Identifying Pedestrian Crash Risk Locations in GIS" International Journal of Environmental Research and Public Health 16, no. 19: 3565. https://doi.org/10.3390/ijerph16193565
APA StyleKang, M., Moudon, A. V., Kim, H., & Boyle, L. N. (2019). Intersections and Non-Intersections: A Protocol for Identifying Pedestrian Crash Risk Locations in GIS. International Journal of Environmental Research and Public Health, 16(19), 3565. https://doi.org/10.3390/ijerph16193565