Hypertension Diagnosis Index for Discrimination of High-Risk Hypertension ECG Signals Using Optimal Orthogonal Wavelet Filter Bank


Abstract
:1. Introduction
2. Dataset
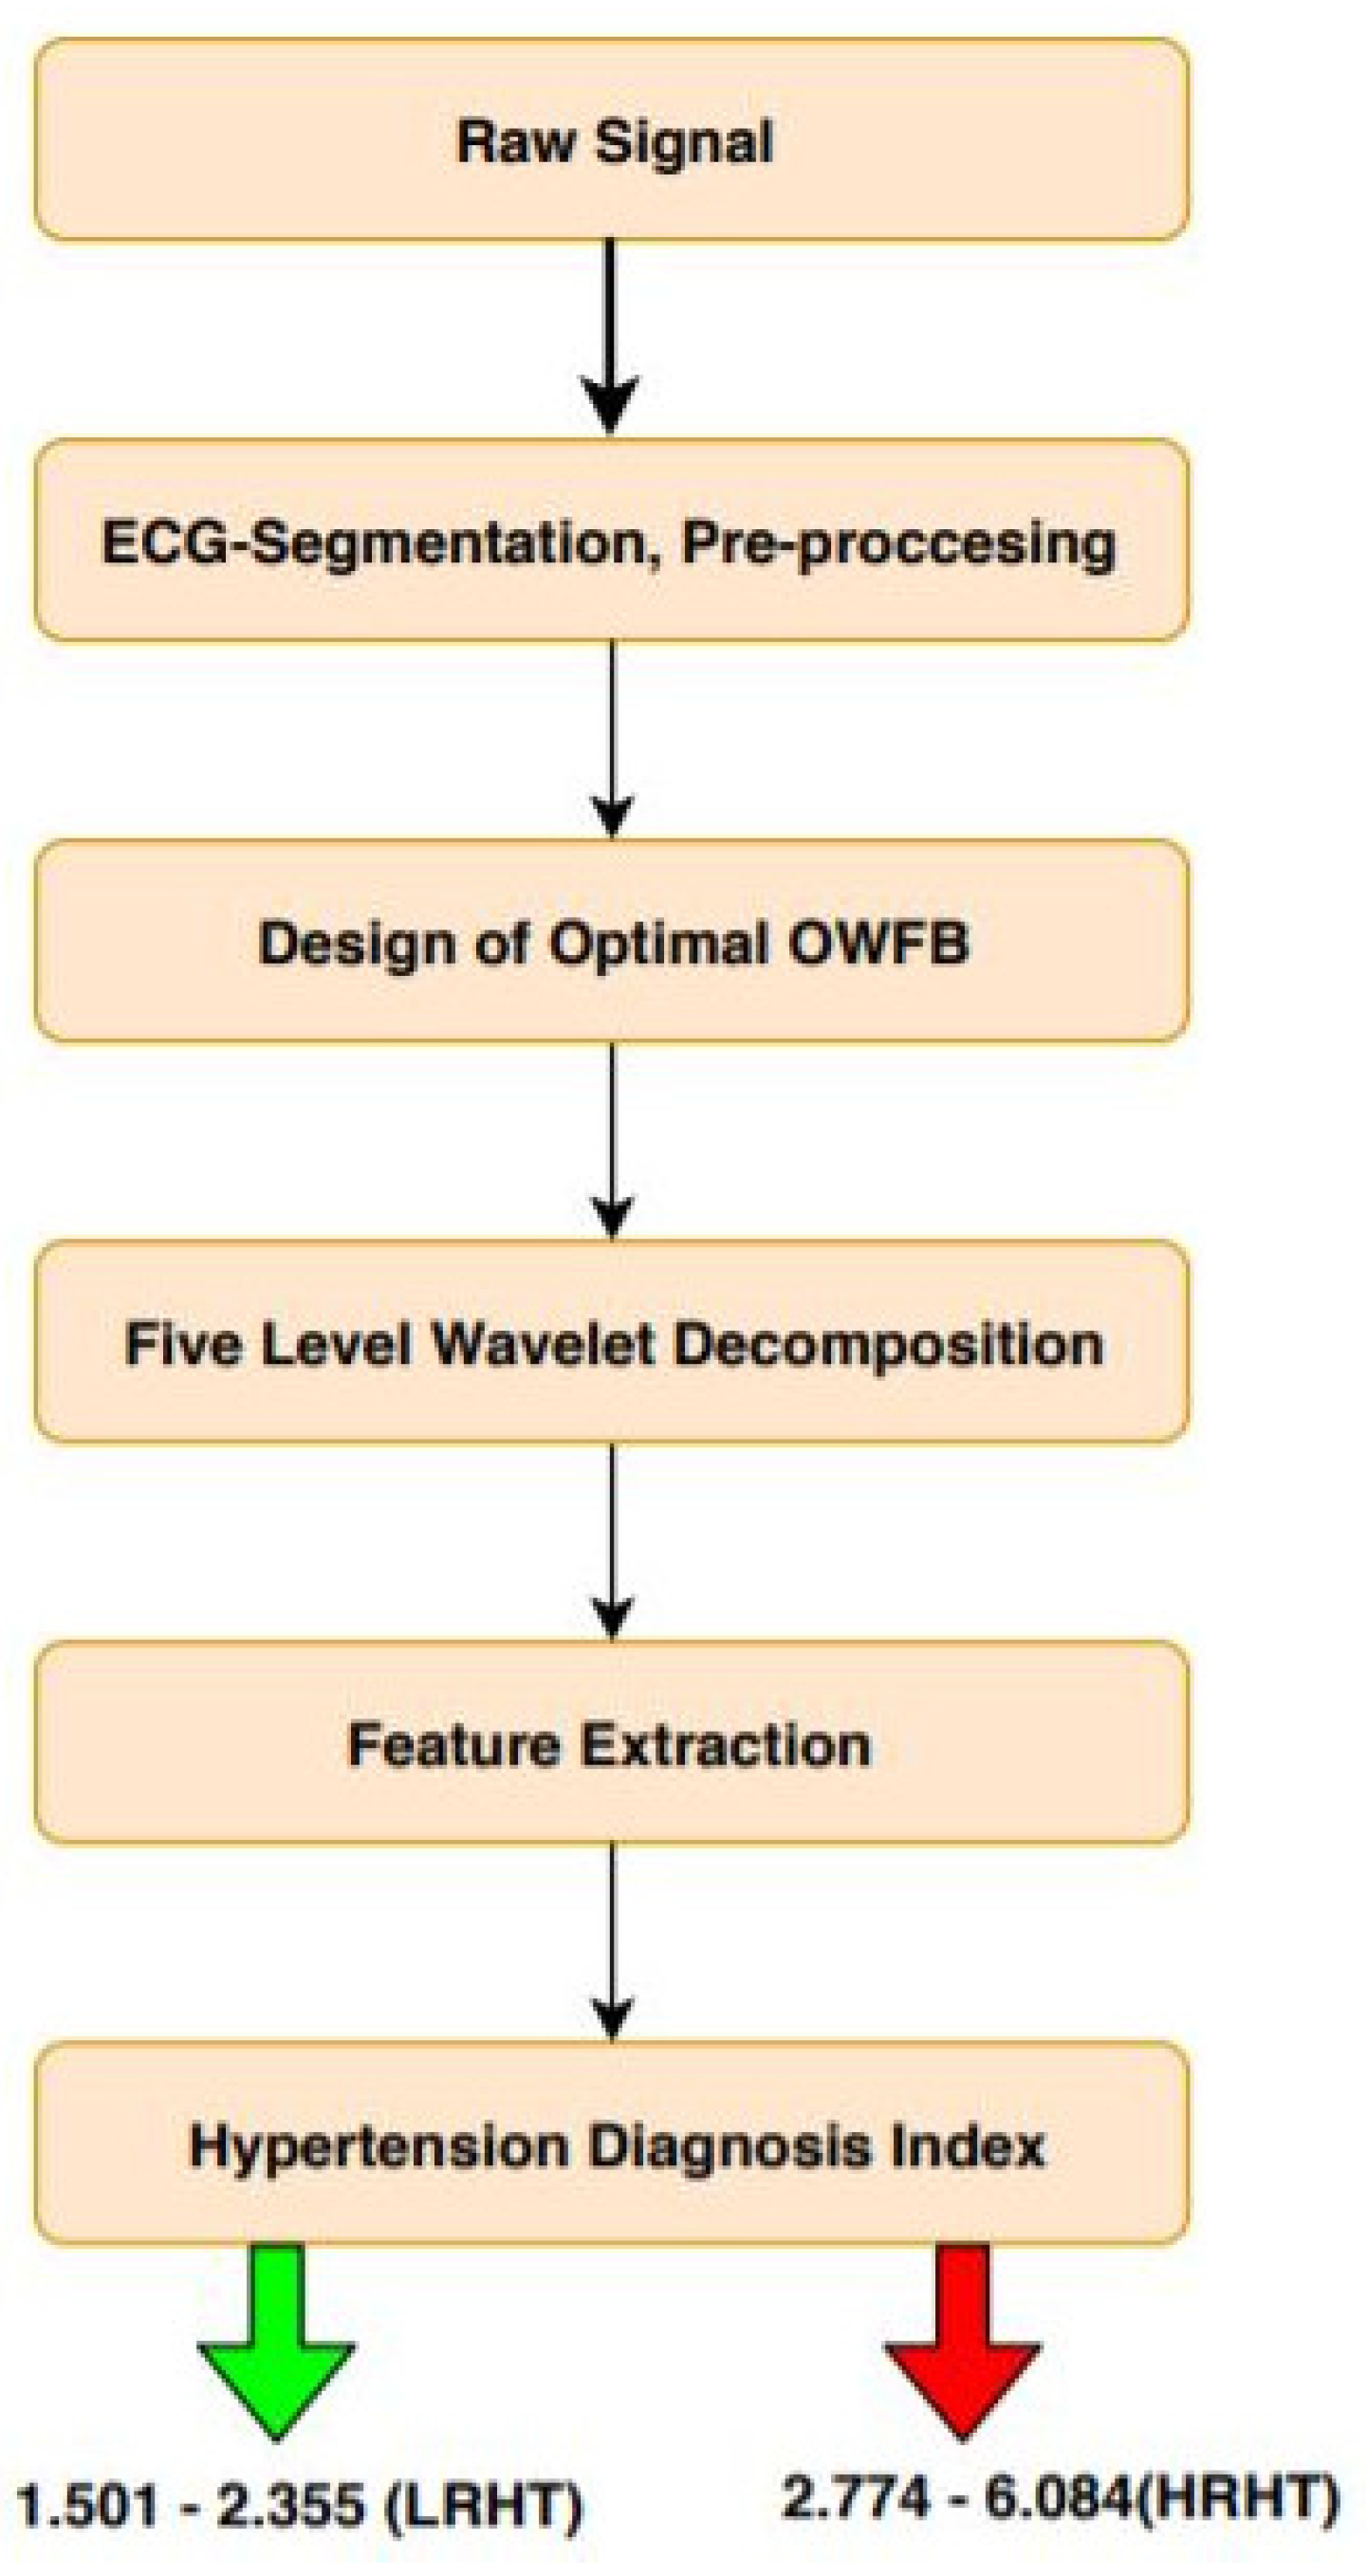
3. Methodology
3.1. ECG Segmentation
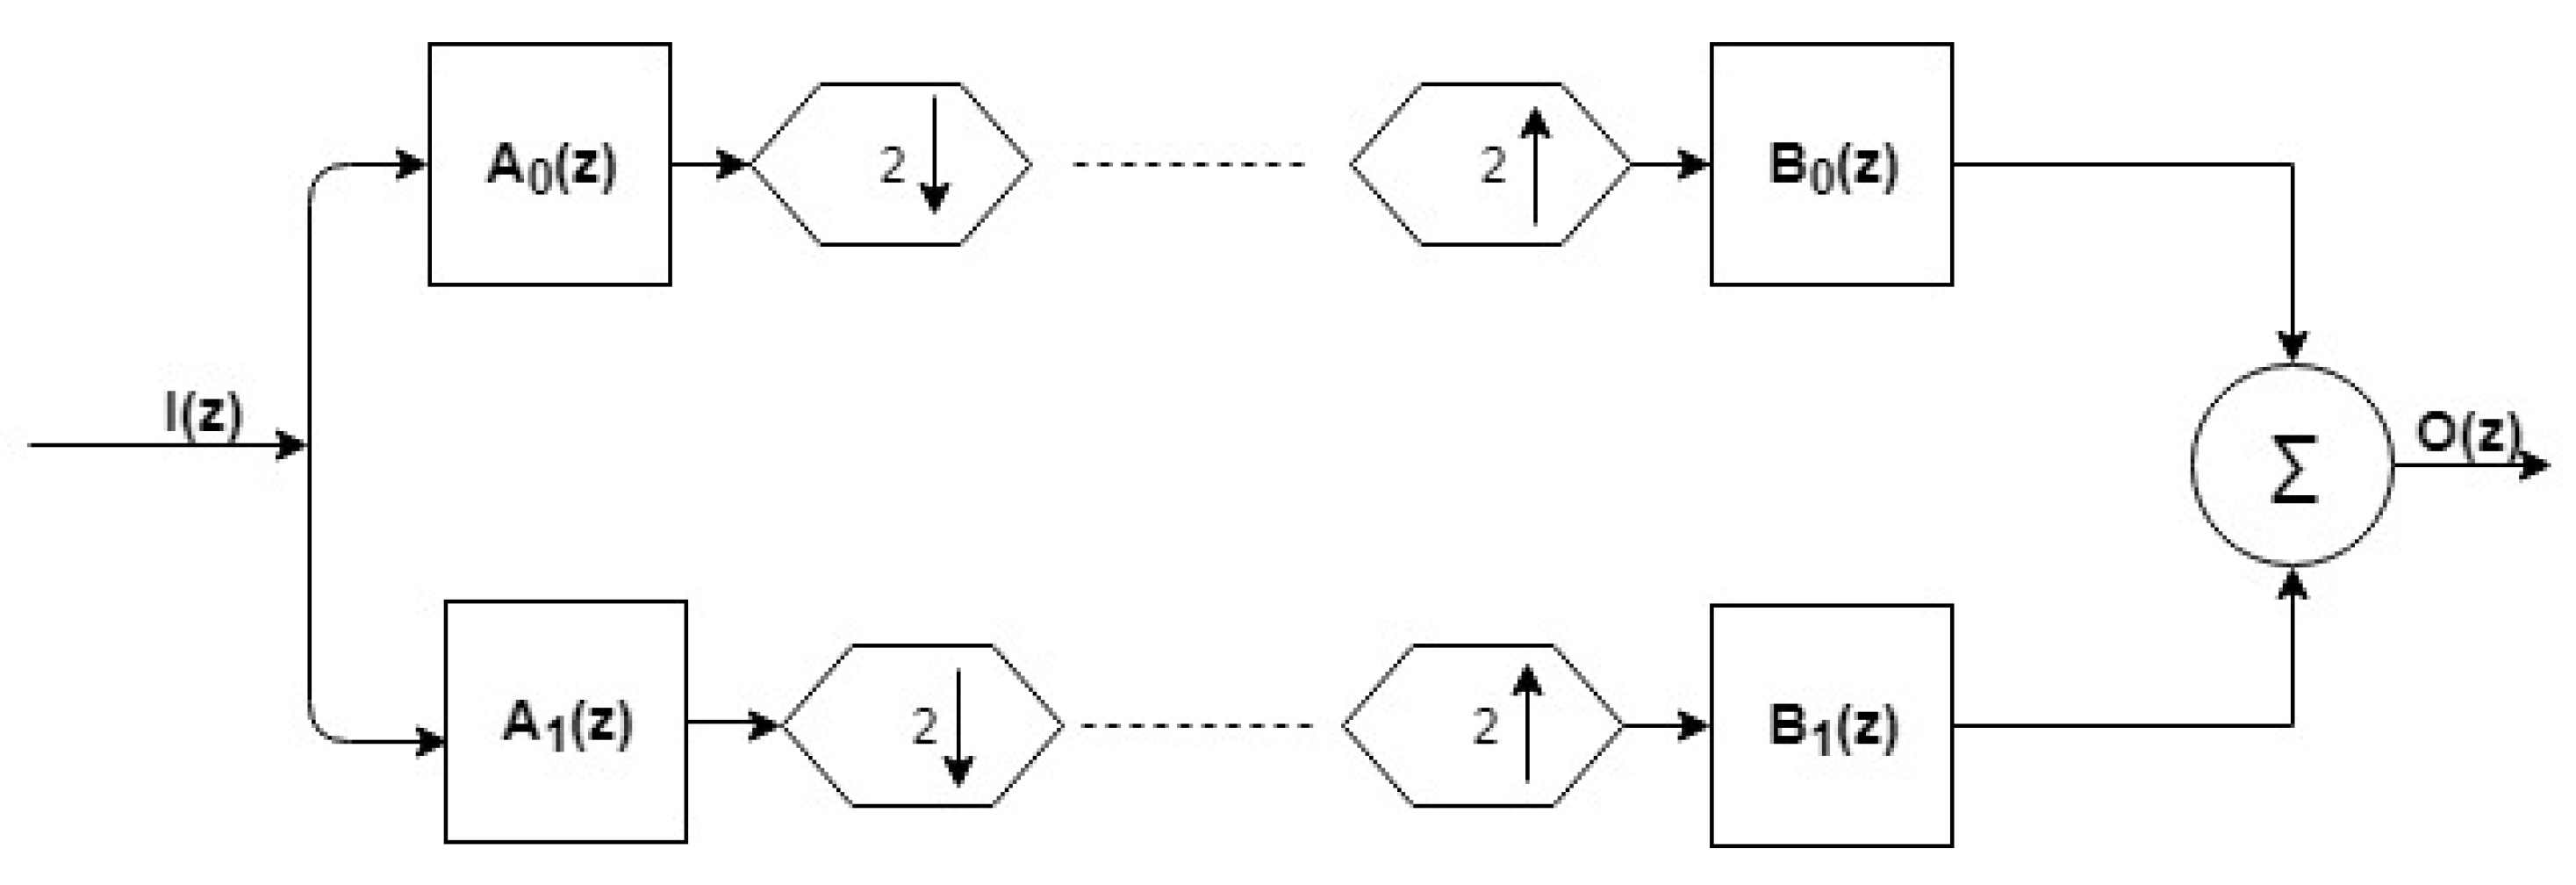
3.2. Design of Filter Bank
Constraint in the Time-Domain and Objective Function
3.3. Wavelet Decomposition
3.4. Features Used
3.5. Hypertension Diagnosis Index
4. Results
5. Discussion
- From Table 3, LOGE values of SB2–SB6 showed significant changes corresponding to LRHT and HRHT patients.
- SFD of SB2 for LRHT and HRHT obtained the highest mean value, while SB1 showed the lowest mean value. LOGE of SB1 yielded the highest mean value for LRHT, and SB2 for HRHT patients yielded the lowest mean value.
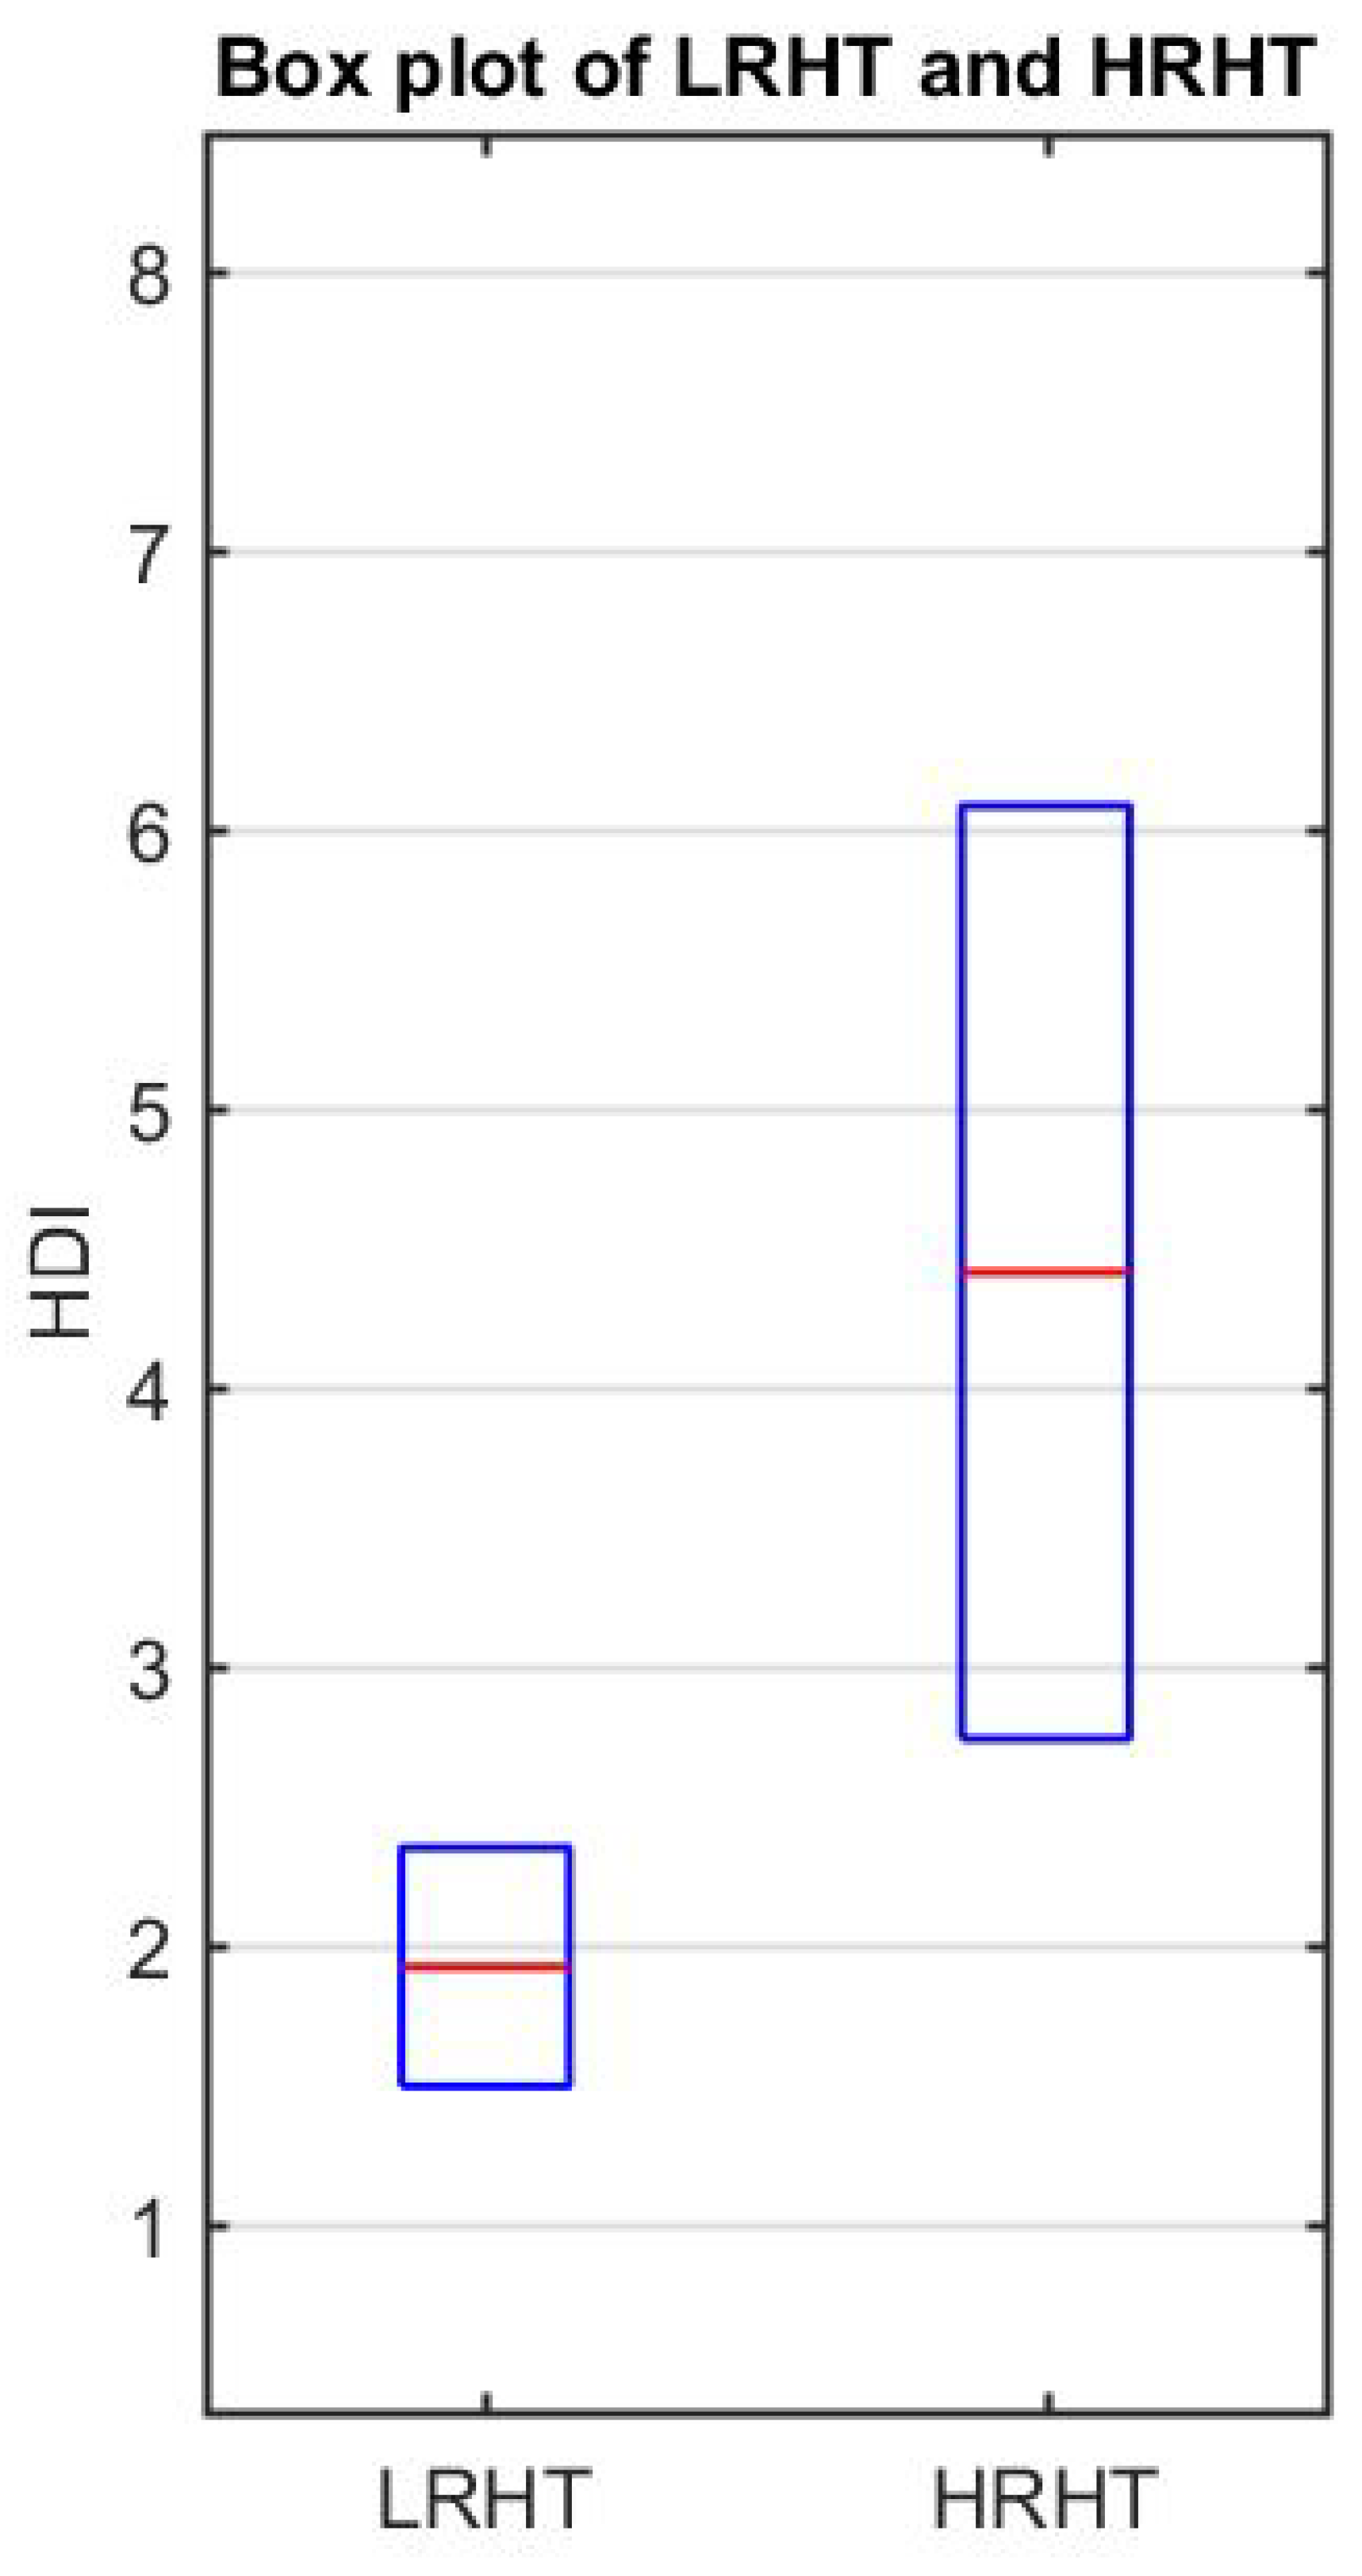
- The novelty of the proposed work was the development of HDI to discriminate between the two classes using a single value.
- Table 7 presents the range of HDI and shows a significant difference in the LRHT and HRHT by a numeric value.
- We did not need classifiers, which involve training and testing. It was fast and involved only the extraction of two feature sets.
- For better and fast computation, we used fewer features. The length of the ECG signal was 5 min. Hence, it was not computationally intensive and quicker in diagnosis.
- Using the same database, Melillo and Izzo used various machine learning algorithms (SVM, decision tree (DT), and convolution neural network (CNN)) and obtained the highest accuracy of 87.8% with HRV signals [16]. Recently, Ni and Wang [3] obtained an accuracy of 95% using heart rate variability (HRV) signals.
- Many studies have used HRV-based techniques to detect hypertension; we used wavelet-based features directly extracted from ECG. Our method was different from HRV-based methods and easy to use in the clinical environment [3].
- The performance of the system was found to be promising, and we expect that it can be employed in intensive care units to monitor the abrupt rise in blood pressure while screening the ECG signals, provided it is tested with an extensive independent database.
- The present research work was conducted using 139 ECG recordings segmented into 3614 (3172 as LRHT, 442 as HRHT (78 stroke, 78 syncope, and 286 myocardial infarction)) epochs of 5 min each comprised of CH1, CH2, and CH3. The ECG dataset was obtained from https://archive.physionet.org/pn6/shareedb/. Our whole experimental work was performed using MATLAB. Table 7 shows the results of the automated detection of LRHT and HRHT classes. In Table 8, we compare our proposed work with other methods. Using HDI, we can discriminate between the two classes by just the single numeric value with 100% accuracy.
6. Conclusions
Author Contributions
Funding
Conflicts of Interest
References
- WHO. A Global Brief on Hypertension; WHO/DCO/WHD/2013.2; WHO: Geneva, Switzerland, 2013; pp. 1–40. [Google Scholar]
- Kearney, P.M.; Whelton, M.; Reynolds, K.; Muntner, P.; Whelton, P.K.; He, J. Global burden of hypertension: Analysis of worldwide data. Lancet 2005, 365, 217–223. [Google Scholar] [CrossRef]
- Ni, H.; Wang, Y.; Xu, G.; Shao, Z.; Zhang, W.; Zhou, X. Multiscale Fine-Grained Heart Rate Variability Analysis for Recognizing the Severity of Hypertension. Comput. Math. Methods Med. 2019, 2019, 1–9. [Google Scholar] [CrossRef] [PubMed] [Green Version]
- Sharma, M.; Singh, S.; Kumar, A.; Tan, R.S.; Acharya, U.R. Automated detection of shockable and non-shockable arrhythmia using novel wavelet-based ECG features. Comput. Biol. Med. 2019, 103446. [Google Scholar] [CrossRef] [PubMed]
- Sharma, M.; Acharya, U.R. A new method to identify coronary artery disease with ECG signals and time-Frequency concentrated antisymmetric biorthogonal wavelet filter bank. Pattern Recognit. Lett. 2019, 125, 235–240. [Google Scholar] [CrossRef]
- Sharma, M.; Tan, R.S.; Acharya, U.R. Detection of shockable ventricular arrhythmia using optimal orthogonal wavelet filters. Neural Comput. Appl. 2019. [Google Scholar] [CrossRef]
- Sharma, M.; Tan, R.S.; Acharya, U.R. Automated heartbeat classification and detection of arrhythmia using optimal orthogonal wavelet filters. Inform. Med. Unlocked 2019, 100221. [Google Scholar] [CrossRef]
- Bhurane, A.A.; Sharma, M.; San-Tan, R.; Acharya, U.R. An efficient detection of congestive heart failure using frequency localized filter banks for the diagnosis with ECG signals. Cogn. Syst. Res. 2019. [Google Scholar] [CrossRef]
- Faust, O.; Acharya, R.; Krishnan, S.; Min, L.C. Analysis of cardiac signals using spatial filling index and time-frequency domain. Biomed. Eng. Online 2004, 3, 30. [Google Scholar] [CrossRef]
- Ni, H.; Cho, S.; Mankoff, J.; Yang, J.; Dey, A.k. Automated recognition of hypertension through overnight continuous HRV monitoring. J. Ambient. Intell. Humaniz. Comput. 2018, 9, 2011–2023. [Google Scholar] [CrossRef]
- Kwon, S.; Kang, S.; Lee, Y.; Yoo, C.; Park, K. Unobtrusive monitoring of ECG-derived features during daily smartphone use. In Proceedings of the 2014 36th Annual International Conference of the IEEE Engineering in Medicine and Biology Society, Chicago, IL, USA, 26–30 August 2014; pp. 4964–4967. [Google Scholar] [CrossRef]
- Ji Lee, H.; Hwang, S.; Yoon, H.; Kyu Lee, W.; Park, K. Heart Rate Variability Monitoring during Sleep Based on Capacitively Coupled Textile Electrodes on a Bed. Sensors 2015, 15, 11295–11311. [Google Scholar] [CrossRef]
- Voss, A.; Baumert, M.; Baier, V.; Stepan, H.; Walther, T.; Faber, R. Autonomic Cardiovascular Control in Pregnancies With Abnormal Uterine Perfusion. Am. J. Hypertens. 2006, 19, 306–312. [Google Scholar] [CrossRef] [PubMed]
- Poddar, M.; Birajdar, A.C.; Virmani, J. Kriti. Chapter 5—Automated Classification of Hypertension and Coronary Artery Disease Patients by PNN, KNN, and SVM Classifiers Using HRV Analysis; Academic Press: Cambridge, MA, USA, 2019; pp. 99–125. [Google Scholar] [CrossRef]
- Natarajan, N.; Balakrishnan, A.K.; Ukkirapandian, K. A study on analysis of Heart Rate Variability in hypertensive individuals. Int. J. Biomed. Adv. Res. 2014, 5, 109–111. [Google Scholar] [CrossRef]
- Melillo, P.; Izzo, R.; Orrico, A.; Scala, P.; Attanasio, M.; Mirra, M.; Luca, N.; Pecchia, L. Automatic Prediction of Cardiovascular and Cerebrovascular Events Using HRV Analysis. PLoS ONE 2015, 10, e0118504. [Google Scholar] [CrossRef] [PubMed]
- Song, Y.; Ni, H.; Zhou, X.; Zhao, W.; Wang, T. Extracting Features for Cardiovascular Disease Classification Based on Ballistocardiography. In Proceedings of the 2015 IEEE 12th Intl Conf on Ubiquitous Intelligence and Computing and 2015 IEEE 12th Intl Conf on Autonomic and Trusted Computing and 2015 IEEE 15th Intl Conf on Scalable Computing and Communications and Its Associated Workshops (UIC-ATC-ScalCom), Beijing, China, 10–14 August 2015; pp. 1230–1235. [Google Scholar] [CrossRef]
- Yue, W.w.; Yin, J.; Chen, B.; Zhang, X.; Wang, G.; Li, H.; Chen, H.; Jia, R.y. Analysis of Heart Rate Variability in Masked Hypertension. Cell Biochem. Biophys. 2014, 70, 201–204. [Google Scholar] [CrossRef]
- Mussalo, H.; Vanninen, E.; Ikaheimo, R.; Laitinen, T.; Laakso, M.; Lansimies, E.; Hartikainen, J. Heart rate variability and its determinants in patients with severe or mild essential hypertension. Clin. Physiol. 2001, 21, 594–604. [Google Scholar] [CrossRef]
- Sharma, M.; Bhurane, A.A.; Acharya, U.R. MMSFL-OWFB: A novel class of orthogonal wavelet filters for epileptic seizure detection. Knowl. Based Syst. 2018, 160, 265–277. [Google Scholar] [CrossRef]
- Sharma, M.; Tan, R.S.; Acharya, U.R. A novel automated diagnostic system for classification of myocardial infarction ECG signals using an optimal biorthogonal filter bank. Comput. Biol. Med. 2018. [Google Scholar] [CrossRef]
- Zala, J.; Sharma, M.; Bhalerao, R. Tunable Q - wavelet transform based features for automated screening of knee-joint vibroarthrographic signals. In Proceedings of the 2018 International Conference on Signal Processing and Integrated Networks (SPIN), Noida, India, 22–23 February 2018. [Google Scholar]
- Sharma, M.; Agarwal, S.; Acharya, U.R. Application of an optimal class of antisymmetric wavelet filter banks for obstructive sleep apnea diagnosis using ECG signals. Comput. Biol. Med. 2018, 100, 100–113. [Google Scholar] [CrossRef]
- Sharma, M.; Dhere, A.; Pachori, R.B.; Acharya, U.R. An automatic detection of focal EEG signals using new class of time–frequency localized orthogonal wavelet filter banks. Knowl.-Based Syst. 2017, 118, 217–227. [Google Scholar] [CrossRef]
- Sharma, M.; Raval, M.; Acharya, U.R. A new approach to identify obstructive sleep apnea using an optimal orthogonal wavelet filter bank with ECG signals. Informatics Med. Unlocked 2019, 16, 100170. [Google Scholar] [CrossRef]
- Sharma, M.; Dhere, A.; Pachori, R.B.; Gadre, V.M. Optimal duration-bandwidth localized antisymmetric biorthogonal wavelet filters. Signal Process. 2017, 134, 87–99. [Google Scholar] [CrossRef]
- Sharma, M.; Acharya, U.R. Analysis of knee-joint vibroarthographic signals using bandwidth-duration localized three-channel filter bank. Comput. Electr. Eng. 2018, 72, 191–202. [Google Scholar] [CrossRef]
- Sharma, M.; Achuth, P.; Deb, D.; Puthankattil, S.D.; Acharya, U.R. An Automated Diagnosis of Depression Using Three-Channel Bandwidth-Duration Localized Wavelet Filter Bank with EEG Signals. Cogn. Syst. Res. 2018, 52, 508–520. [Google Scholar] [CrossRef]
- SHARMA, M.; SHAH, S. A novel approach for epilepsy detection using time–frequency localized bi-orthogonal wavelet filter. J. Mech. Med. Biol. 2019, 19, 1940007. [Google Scholar] [CrossRef]
- Sharma, M.; Achuth, P.V.; Pachori, R.B.; Gadre, V.M. A parametrization technique to design joint time–frequency optimized discrete-time biorthogonal wavelet bases. Signal Process. 2017, 135, 107–120. [Google Scholar] [CrossRef]
- Sharma, M.; Bhati, D.; Pillai, S.; Pachori, R.B.; Gadre, V.M. Design of Time–Frequency Localized Filter Banks: Transforming Non-convex Problem into Convex Via Semidefinite Relaxation Technique. Circuits Syst. Signal Process. 2016, 35, 3716–3733. [Google Scholar] [CrossRef]
- Bhati, D.; Sharma, M.; Pachori, R.B.; Gadre, V.M. Time-frequency localized three-band biorthogonal wavelet filter bank using semidefinite relaxation and nonlinear least squares with epileptic seizure EEG signal classification. Digit. Signal Process. 2017, 62, 259–273. [Google Scholar] [CrossRef]
- Bhati, D.; Sharma, M.; Pachori, R.B.; Nair, S.S.; Gadre, V.M. Design of Time–Frequency Optimal Three-Band Wavelet Filter Banks with Unit Sobolev Regularity Using Frequency Domain Sampling. Circuits Syst. Signal Process. 2016, 35, 4501–4531. [Google Scholar] [CrossRef]
- Sharma, M.; Gadre, V.M.; Porwal, S. An Eigenfilter-Based Approach to the Design of Time-Frequency Localization Optimized Two-Channel Linear Phase Biorthogonal Filter Banks. Circ. Syst. Signal Process. 2015, 34, 931–959. [Google Scholar] [CrossRef]
- Sharma, M.; Deb, D.; Acharya, U.R. A novel three-band orthogonal wavelet filter bank method for an automated identification of alcoholic EEG signals. Appl. Intell. 2018, 48, 1368–1378. [Google Scholar] [CrossRef]
- Sharma, M.; Pachori, R.B.; Acharya, U.R. A new approach to characterize epileptic seizures using analytic time-frequency flexible wavelet transform and fractal dimension. Pattern Recognit. Lett. 2017, 94, 172–179. [Google Scholar] [CrossRef]
- Vetterli, M.; Herley, C. Wavelets and filter banks: Theory and design. IEEE Trans. Signal Process. 1992, 40, 2207–2232. [Google Scholar] [CrossRef]
- Daubechies, I. Ten Lectures on Wavelets. Siam Rev. 1992, 61, 2207–2232. [Google Scholar]
- Sharma, M.; Goyal, D.; Achuth, P.; Acharya, U.R. An accurate sleep stages classification system using a new class of optimally time-frequency localized three-band wavelet filter bank. Comput. Biol. Med. 2018, 98, 58–75. [Google Scholar] [CrossRef]
- Shah, S.; Sharma, M.; Deb, D.; Pachori, R.B. An automated alcoholism detection using orthogonal wavelet filter bank. In Machine Intelligence and Signal Analysis; Springer: Singapore, 2019; Volume 748, pp. 473–483. [Google Scholar] [CrossRef]
- Sharma, M.; Sharma, P.; Pachori, R.B.; Gadre, V.M. Double density dual-tree complex wavelet transform based features for automated screening of knee-joint vibroarthrographic signals. In Machine Intelligence and Signal Analysis; Advances in Intelligent Systems and Computing; Springer: Singapore, 2019; Volume 748, pp. 279–290. [Google Scholar]
- Sharma, M.; Pachori, R.B. A novel approach to detect epileptic seizures using a combination of tunable-Q wavelet transform and fractal dimension. J. Mech. Med. Biol. 2017, 17, 1740003. [Google Scholar] [CrossRef]
- Sharma, M.; Sharma, P.; Pachori, R.B.; Acharya, U.R. Dual-tree complex wavelet transform-based features for automated alcoholism identification. Int. J. Fuzzy Syst. 2018, 20, 1297–1308. [Google Scholar] [CrossRef]
- Sharma, M.; Singh, T.; Bhati, D.; Gadre, V. Design of two-channel linear phase biorthogonal wavelet filter banks via convex optimization. In Proceedings of the 2014 international conference on signal processing and communications (SPCOM), Bangalore, India, 22–25 July 2014; pp. 1–6. [Google Scholar] [CrossRef]
- Ishii, R.; Furukawa, K. The uncertainty principle in discrete signals. IEEE Trans. Circuits Syst. 1986, 33, 1032–1034. [Google Scholar] [CrossRef]
- Moulin, P.; Anitescu, M.; Kortanek, K.O.; Potra, F.A. The role of linear semi-infinite programming in signal-adapted QMF bank design. IEEE Trans. Signal Process. 1997, 45, 2160–2174. [Google Scholar] [CrossRef]
- Bhattacharyya, A.; Sharma, M.; Pachori, R.B.; Sircar, P.; Acharya, U.R. A novel approach for automated detection of focal EEG signals using empirical wavelet transform. Neural Comput. Appl. 2018, 29, 47–57. [Google Scholar] [CrossRef]
- Dumitrescu, B.; Tabus, I.; Stoica, P. On the parameterization of positive real sequences and ma parameter estimation. IEEE Trans. Signal Process. 2001, 49, 2630–2639. [Google Scholar] [CrossRef]
- Grant, M.; Boyd, S.P. CVX: MATLAB Software for Disciplined Convex Programming; CVX Research: Austin, TX, USA, 2014. [Google Scholar]
- Sharma, M.; Vanmali, A.V.; Gadre, V.M. Construction of Wavelets: Principles and Practices in Wavelets and fractals in earth system sciences. In Wavelets and Fractals in Earth System Sciences; Chandrasekhar, E.E., Dimri, V.P.E., Gadre, V.M.E., Eds.; CRC Press: Boca Raton, FL, USA; Taylor and Francis Group: Abingdon, UK, November 2013. [Google Scholar]
- Sharma, M.; Kolte, R.; Patwardhan, P.; Gadre, V. Time-frequency localization optimized biorthogonal wavelets. In Proceedings of the 2010 International Conference on Signal Processing and Communications (SPCOM), Bangalore, India, 18–21 July 2010; pp. 1–5. [Google Scholar]
- Acharya, U.R.; K Sudarshan, V.; Adeli, H.; Santhosh, J.; Koh, J.E.W.; D Puthankatti, S.; Adeli, A. A Novel Depression Diagnosis Index Using Nonlinear Features in EEG Signals. Eur. Neurol. 2015, 74, 79–83. [Google Scholar] [CrossRef] [PubMed]
- Acharya, U.R.; Faust, O.; Subbhuraam, V.S.; Molinari, F.; Garberoglio, R.; Suri, J. Cost-Effective and Non-Invasive Automated Benign & Malignant Thyroid Lesion Classification in 3D Contrast-Enhanced Ultrasound Using Combination of Wavelets and Textures: A Class of ThyroScan™ Algorithms. Technol. Cancer Res. Treat. 2011, 10, 371–380. [Google Scholar] [CrossRef] [PubMed]
- Acharya, U.R.; Fujita, H.; K Sudarshan, V.; Subbhuraam, V.S.; Wei Jie Eugene, L.; Ghista, D.; Tan, R.S. An Integrated Index for Detection of Sudden Cardiac Death Using Discrete Wavelet Transform and Nonlinear Features. Knowl. Based Syst. 2015, 83, 149–158. [Google Scholar] [CrossRef]
- RAJAMANICKAM, Y.; Acharya, U.R.; Hagiwara, Y. A novel Parkinson’s Disease Diagnosis Index using higher-order spectra features in EEG signals. Neural Comput. Appl. 2016. [Google Scholar] [CrossRef]
- Acharya, U.R.; Fujita, H.; Oh, S.L.; Raghavendra, U.; Tan, J.H.; Adam, M.; Gertych, A.; Hagiwara, Y. Automated identification of shockable and non-shockable life-threatening ventricular arrhythmias using convolutional neural network. Future Gener. Comput. Syst. 2018, 79, 952–959. [Google Scholar] [CrossRef]
- Yıldırım, Z.; Pławiak, P.; Tan, R.S.; Acharya, U.R. Arrhythmia Detection Using Deep Convolutional Neural Network With Long Duration ECG Signals. Comput. Biol. Med. 2018, 102, 411–420. [Google Scholar] [CrossRef]
- Tan, J.H.; Hagiwara, Y.; Pang, W.; Lim, I.; Oh, S.L.; Adam, M.; Tan, R.S.; Chen, M.; Acharya, U.R. Application of stacked convolutional and long short-term memory network for accurate identification of CAD ECG signals. Comput. Biol. Med. 2018, 94, 19–26. [Google Scholar] [CrossRef]
- Oh, S.L.; Ng, E.Y.; Tan, R.S.; Acharya, U.R. Automated diagnosis of arrhythmia using combination of CNN and LSTM techniques with variable length heart beats. Comput. Biol. Med. 2018, 102, 278–287. [Google Scholar] [CrossRef]
- Faust, O.; Hagiwara, Y.; Hong, T.J.; Lih, O.S.; Acharya, U.R. Deep learning for healthcare applications based on physiological signals: A review. Comput. Methods Programs Biomed. 2018, 161, 1–13. [Google Scholar] [CrossRef]
- Simjanoska, M.; Gjoreski, M.; Madevska Bogdanova, A.; Koteska, B.; Gams, M.; Tasic, J. ECG-Derived Blood Pressure Classification Using Complexity Analysis-Based Machine Learning; SCITEPRESS: Setúbal, Portugal, 2018; pp. 282–292. [Google Scholar] [CrossRef]
- Sau, A.; Bhakta, I. Screening of anxiety and depression among the seafarers using machine learning technology. Informatics Med. Unlocked 2018. [Google Scholar] [CrossRef]
- Seidler, T.; Hellenkamp, K.; Unsoeld, B.; Mushemi-Blake, S.; Shah, A.; Hasenfuss, G.; Leha, A. A machine learning approach for the prediction of pulmonary hypertension. J. Am. Coll. Cardiol. 2019, 73, 1589, ACC.19: The American College of Cardiology 68th Annual Scientific Sessions. [Google Scholar] [CrossRef]
- Brown, T.; Cueto, M.; Fee, E. The World Health Organization and the Transition From “International” to “Global” Public Health. Am. J. Public Health 2006, 96, 62–72. [Google Scholar] [CrossRef] [PubMed]


| Blood Pressure Category | Systolic (mmHg) | Disystolic (mm Hg) |
|---|---|---|
| Normal BP | less than 120 | less than 80 |
| Elevated, Normal Hypertension | 120–129 | less than 80 |
| Stage 1 | 130–139 | 80–89 |
| High-risk Hypertension | ||
| Stage 2 | greater than 140 | greater than 90 |
| High-risk Hypertension | ||
| Stage 3 | greater than 180 | greater than 120 |
| High-risk Hypertension |
| S.no | Parameters | LRHT Class | HRHT Class | ||
|---|---|---|---|---|---|
| Mean | Standard Deviation | Mean | Standard Deviation | ||
| 1 | DBP | 76.31 | 9.1 | 73.5 | 8.4 |
| 2 | SBP | 136.6 | 19.5 | 141.7 | 23.5 |
| 3 | BMI | 27.6 | 3.9 | 27.9 | 4.9 |
| 4 | LVMi | 130 | 26.1 | 140.2 | 25.1 |
| 5 | Age in years | 71.4 | 7 | 74.1 | 6.5 |
| Sub Bands | SFD | LOGE | ||||||
|---|---|---|---|---|---|---|---|---|
| LRHT | HRHT | LRHT | HRHT | |||||
| Mean ± Std | Mean ± Std | Mean ± Std | Mean ± Std | |||||
| SB1 | 1.016 | 0.0032 | 1.016 | 0.0031 | 20.263 | 0.009 | 20.263 | 0.0053 |
| SB2 | 2.011 | 0.0217 | 2.017 | 0.0252 | 11.983 | 0.915 | 11.711 | 0.7576 |
| SB3 | 1.892 | 0.0217 | 1.899 | 0.0260 | 12.481 | 0.991 | 12.128 | 0.8576 |
| SB4 | 1.621 | 0.0328 | 1.626 | 0.0395 | 13.096 | 0.981 | 12.746 | 1.0144 |
| SB5 | 1.214 | 0.0210 | 1.213 | 0.0211 | 12.943 | 1.003 | 12.602 | 1.0966 |
| SB6 | 1.059 | 0.0077 | 1.056 | 0.007 | 12.821 | 1.089 | 12.565 | 1.2976 |
| Sub Bands | SFD | LOGE | ||||||
|---|---|---|---|---|---|---|---|---|
| LRHT | HRHT | LRHT | HRHT | |||||
| Mean ± Std | Mean ± Std | Mean ± Std | Mean ± Std | |||||
| SB1 | 1.024 | 0.0025 | 1.025 | 0.0029 | 20.263 | 0.005 | 20.263 | 0.0052 |
| SB2 | 2.012 | 0.0231 | 2.020 | 0.0272 | 12.278 | 0.713 | 12.122 | 0.7550 |
| SB3 | 1.898 | 0.0212 | 1.901 | 0.0223 | 12.564 | 0.858 | 12.298 | 0.7611 |
| SB4 | 1.634 | 0.0348 | 1.641 | 0.0288 | 13.172 | 0.796 | 12.912 | 0.7564 |
| SB5 | 1.212 | 0.017 | 1.213 | 0.0179 | 13.057 | 0.838 | 12.794 | 0.8087 |
| SB6 | 1.065 | 0.0039 | 1.064 | 0.0035 | 12.857 | 0.911 | 12.673 | 1.0303 |
| Sub Bands | SFD | LOGE | ||||||
|---|---|---|---|---|---|---|---|---|
| LRHT | HRHT | LRHT | HRHT | |||||
| Mean ± Std | Mean ± Std | Mean ± Std | Mean ± Std | |||||
| SB1 | 20.26 | 0.0146 | 20.26 | 0.0106 | 1.0241 | 0.003 | 1.0243 | 0.0024 |
| SB2 | 11.99 | 0.9122 | 11.76 | 0.8488 | 2.0213 | 0.024 | 2.0256 | 0.0291 |
| SB3 | 12.05 | 0.9504 | 11.77 | 1.0436 | 1.9083 | 0.024 | 1.9121 | 0.023 |
| SB4 | 12.64 | 1.1322 | 12.55 | 1.2271 | 1.6456 | 0.037 | 1.6261 | 0.0348 |
| SB5 | 12.47 | 1.2679 | 12.61 | 1.250 | 1.2095 | 0.017 | 1.2119 | 0.0144 |
| SB6 | 12.34 | 1.305 | 12.46 | 1.2807 | 1.0644 | 0.004 | 1.0643 | 0.0037 |
| Rank | Feature | t-Value | p-Value |
|---|---|---|---|
| 1 | SFD SB6 | 8.854 | 9.47 |
| 2 | LOGE SB3 | 7.943 | 9.35 |
| 3 | LOGE SB2 | 6.878 | 1.45 |
| 4 | LOGE SB4 | 6.829 | 2.22 |
| 5 | LOGE SB5 | 6.196 | 1.14 |
| 6 | SFD SB2 | 5.744 | 1.54 |
| 7 | SFD SB3 | 4.982 | 8.59 |
| 8 | LOGE SB6 | 3.952 | 8.79 |
| 9 | SFD SB4 | 2.691 | 0.007341 |
| 10 | SFD SB5 | 1.261 | 0.207762 |
| 11 | LOGE SB1 | 1.009 | 0.313201 |
| 12 | SFD SB1 | 0.958 | 0.338084 |
| Index | LRHT | HRHT | p-value |
|---|---|---|---|
| HDI | 1.501–2.355 | 2.774–6.084 | <0.01 |
| Authors (Year) | Features and Classifier | Classification (in %) |
|---|---|---|
| Simjanoska et al. [61] (2018) | ECG-based Features Extracted: | |
| • SFD, Entropy | ACC: 96.8% | |
| Classifiers: | ||
| • SVM | ||
| • KNN | ||
| Sau et al. [62] (2018) | Features: | |
| • BMI, Age, Job | ACC: 82.4% | |
| Classifiers: | Spec: 81.5% | |
| • Random Forest | ||
| • Tree Based | Pres: 84.6% | |
| Seidler et al. [63] (2019) | Features Extracted: | AUC: 0.87% |
| • Pulmonary Artery Pressure | ACC: 95% | |
| Classifiers: | ||
| • SVM | ||
| • Tree Based | ||
| • Logistic Regression | ||
| Poddar et al. [14] (2019) | Features Extracted: | ACC: 96.7% |
| • HRV Linear and Nonlinear | ||
| Classification Method: | ||
| • Support Vector Machine | ||
| Song et al. [17] (2015) | Features Extracted: | ACC: 92.3% |
| • HRV in Time Domain | ||
| • HRV in Frequency Domain | ||
| • HRV Nonlinear Analysis | ||
| Classification Method: | ||
| • Naive Bayesian | ||
| Lee et al. [64] (2015) | Features Extracted: | ACC: 90% |
| • Linear and Nonlinear Features of HRV | ||
| Classification Method: | ||
| • Support Vector Machine | ||
| Melillo et al. [16] (2015) | Features Extracted: | |
| • HRV Linear | Spec: 71.4% | |
| • HRV Nonlinear | Sen: 87.8% | |
| Classification Method: | ||
| • SVM | ||
| • Tree-based Algorithm | ||
| • Artificial Neural Network | ||
| Ni et al. [3] (2019) | Features Extracted: | Precision: 95.1% |
| • HRV in Time Domain | ||
| • HRV in Frequency Domain | ||
| • HRV Nonlinear Analysis | ||
| Method: | ||
| • Fine-grained Analysis Method | ||
| Presented Work | Features Extracted of ECG Signal: | CH3: |
| • Signal Fractal Dimension | LRHT: 1.501 − 2.355 | |
| • Log-Energy | HRHT: 2.774 − 6.084 | |
| Method: | ||
| • HDI | Proposed Unique Ranges for LRHT and HRHT 100% Separation between Two Classes |
© 2019 by the authors. Licensee MDPI, Basel, Switzerland. This article is an open access article distributed under the terms and conditions of the Creative Commons Attribution (CC BY) license (http://creativecommons.org/licenses/by/4.0/).
Share and Cite
Rajput, J.S.; Sharma, M.; Acharya, U.R. Hypertension Diagnosis Index for Discrimination of High-Risk Hypertension ECG Signals Using Optimal Orthogonal Wavelet Filter Bank. Int. J. Environ. Res. Public Health 2019, 16, 4068. https://doi.org/10.3390/ijerph16214068
Rajput JS, Sharma M, Acharya UR. Hypertension Diagnosis Index for Discrimination of High-Risk Hypertension ECG Signals Using Optimal Orthogonal Wavelet Filter Bank. International Journal of Environmental Research and Public Health. 2019; 16(21):4068. https://doi.org/10.3390/ijerph16214068
Chicago/Turabian StyleRajput, Jaypal Singh, Manish Sharma, and U. Rajendra Acharya. 2019. "Hypertension Diagnosis Index for Discrimination of High-Risk Hypertension ECG Signals Using Optimal Orthogonal Wavelet Filter Bank" International Journal of Environmental Research and Public Health 16, no. 21: 4068. https://doi.org/10.3390/ijerph16214068
APA StyleRajput, J. S., Sharma, M., & Acharya, U. R. (2019). Hypertension Diagnosis Index for Discrimination of High-Risk Hypertension ECG Signals Using Optimal Orthogonal Wavelet Filter Bank. International Journal of Environmental Research and Public Health, 16(21), 4068. https://doi.org/10.3390/ijerph16214068