Abstract
This meta-analysis of overweight and obesity (ow/ob) among children and adolescents in China from 1991 to 2015 provides a reference for promoting the healthy development of children and adolescents. The studies were retrieved from the China National Knowledge Infrastructure, Wanfang, and PubMed databases for the period from January 1991 to January 2018. The data were combined and analyzed, and the combined effect magnitude odds ratio and the 95% confidence interval were calculated. Publication bias was determined using Stata/SE12.0. We found that (1) the prevalence of ow/ob increased from 5.0% and 1.7% in 1991–1995 to 11.7% and 6.8% in 2011–2015, respectively, and the overweight rate was the greatest in 2006–2010; (2) from 1991 to 2015, the prevalence of ow/ob was greater in urban areas than in rural areas; (3) compared with girls, boys were more likely to be ow/ob; and (4) the prevalence rates of ow and ob were greater in infancy than in other growth stages, with values of 11.7% and 7.0%, respectively. The prevalence of ow/ob among Chinese children and adolescents showed significant differences based on region, sex, and age. An overall upward trend was observed that decreased slightly from 2011 to 2015.
1. Introduction
The global overweight and obesity rates in childhood and adolescence continue to increase [1]. In China, the rapid development of the economy, the improvement in living standards, and changes in lifestyle, physical inactivity, sedentary behavior, and excessive energy intake have all resulted in a rapid increase in overweight and obesity rates among children and adolescents [2,3,4].
The prevalence rates of overweight and obesity in Chinese children continuously increased from 1985 to 2014, and the annual mean increase rate of obesity was the highest in 2010–2014 [5]. The obesity rate of urban children increased rapidly in 1995–2005, with a mean annual increase of 6.9% [6]. The obesity rate in rural areas increased from 0.71% in 1990 to 1.21% in 2006 [7,8]. Most of these obese adolescents have shown varying degrees of decline in self-esteem, accompanied by related mental health problems, such as anxiety, stress, loneliness, and high-risk behavior [9,10]. Of obese adolescents, 75%–80% are still obese after adulthood, during which obesity continues to facilitate the development of other diseases and reduce life expectancy [11,12]. Overweight and obesity, as important factors affecting the physical and mental health of children and adolescents in China, have attracted considerable attention from many fields.
The research on the prevalence rate of overweight and obesity in children and adolescents in China is mostly regional or restricted to certain age groups or specific years. Summaries about different genders, regions, and ages are lacking in the research on prevalence trends of overweight and obesity among Chinese children and adolescents in the last 25 years. These conditions are disadvantageous to the healthy development of the physique of children and adolescents. Therefore, a meta-analysis of overweight and obese children and adolescents in China from 1991 to 2015 can accurately reflect the current situation as well as changes to promote the healthy development of children and adolescents and to provide a reference.
2. Materials and Methods
2.1. Literature Retrieval Strategy
Our meta-analysis was conducted in accordance with Preferred Reporting Items for Systematic Reviews and Meta-Analyses (PRISMA) guidelines (File S1). The relevant literature on overweight and obesity in Chinese children and adolescents was retrieved from the China National Knowledge Infrastructure (CNKI), Wanfang database, Wip Chinese sci-tech journal full-text database (VIP), and PubMed for the period from January 1991 to January 2018. The database search strategy was formulated around terms “China OR Chinese” AND “infant OR childhood OR children OR toddler OR adolescence OR adolescents OR youth OR teen OR teenager” AND “obesity OR overweight OR body mass index OR BMI OR weight gain” AND “incidence OR frequency OR prevalence OR epidemiology”.
2.2. Documentation Inclusion and Exclusion Criteria
2.2.1. Literature Inclusion Criteria
The inclusion criteria were (1) samples with children and adolescents aged 0–18 in China, (2) the number or detection rate of overweight and obesity in the original literature, and (3) the study type was cohort or cross-sectional. Some of the literature used body mass index (BMI = weight/height2 (kg/m2)) to determine overweight and obesity, including the criteria of the Working Group for Obesity in China (WGOC) [13], World Health Organization (WHO/NCHS) [14], International Obesity Task Force (IOTF) [15], and Centers for Disease Control and Prevention (CDC, USA) [16]. We also included studies that classified overweight and obesity on the basis of ideal weight deviations. The ratio of body weight (W) to ideal weight (IW) was calculated, with W/IW > 1.1 defined as overweight and W/IW > 1.2 defined as obesity [17].
2.2.2. Literature Exclusion Criteria
We excluded articles that contained one of the following characteristics: (1) study of non-overweight and non-obese, (2) study on a population selected on the basis of specific diseases, (3) repeated publication and study of a region or population in the same year, (4) a sample size below 1000, and (5) low quality (Figure 1).
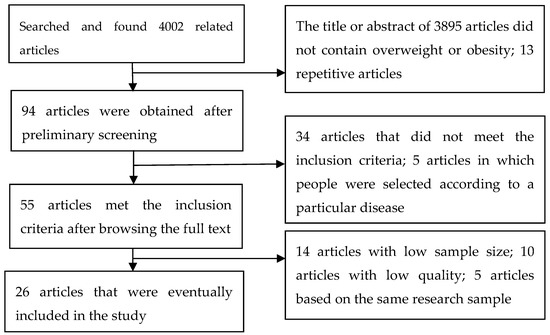
Figure 1.
Flowchart of article screening and selection process.
2.3. Data Extraction
The two researchers independently screened and analyzed the literature according to the inclusion and exclusion criteria, and any differences in opinion were resolved through third-party consultation. The information extracted from the literature mainly included the author, publication year, survey time, research design, representation of the target population, sample selection, sample size, response rate, reasons for non-selection, data sources, data collection, personal and demographic characteristics (obesity, overweight, sex, age, and urban and rural descriptions), epidemic recall period, study objectives, criteria for overweight/obesity, and data collection. The quality assessment extraction form (Table S1) reported by Yu et al. [18] was used to evaluate the quality of the included documents. A score above 14 (the highest is 19 points) is high-quality literature, a score of 11–14 indicates medium-quality literature, and a score below 11 is low-quality literature. Articles with less than 11 points that were classified as low quality, were excluded.
2.4. Statistical Analysis
The literature was divided into five periods according to the year of investigation (1991–1995, 1996–2000, 2001–2005, 2006–2010, and 2011–2015) and compared and analyzed according to sex, age, and place of residence (urban and rural). Open-Meta (Agency for Healthcare Research & Quality, Rockville, MD, USA) was used to calculate the positive rate of overweight or obesity by time, sex, age, and residence and the 95% confidence interval (CI). The data were analyzed using Review Manager 5.1.4 (Nordic Cochrane Center, Copenhagen, Denmark), and the combined effect odds ratio (OR) value and 95% CI were calculated. For the heterogeneity test, the test level was α = 0.05. If there was no statistical heterogeneity, the fixed effects model was used; otherwise, the random effects model was used [19]. Sensitivity analysis was used to determine sample size, study quality, diagnostic criteria, geographic distribution, and whether the type of survey affected the research findings. Publication bias was assessed by inspecting funnel plots, and formal testing for funnel plot asymmetry was performed using the Begg and Egger tests, which were conducted using Stata/SE12.0 (Stata Corp., College Station, TX, USA) [20].
3. Results
3.1. Included Document Characteristics
3.1.1. Literature Search Results
A total of 4002 related studies were found by searching four databases. We included 26 articles (41 studies), of which 14 were from national surveys and 12 were from regional surveys (18 in Chinese and 8 in English).
3.1.2. General Situation and Quality Evaluation of the Literature
In the quality evaluation of the 26 articles, we found 9 high-quality and 17 medium-quality documents (Table 1).

Table 1.
General information and quality ratings included in the literature from 1991 to 2015.
3.2. Meta-Analysis Results
3.2.1. Prevalence of Overweight in Children and Adolescents
Sex Differences
Irrespective of sex, overweight rates showed an overall upward trend over time, with a slight decline in 2011–2015 (Table S2). Overall, the overweight rate increased from 5.0% in 1991–1995 to 13.2% in 2006–2010, and it dropped to 11.7% in 2011–2015. In 1991–1995, the overweight rates of boys and girls were 5.7% and 4.3%, respectively. The rate peaked in 2006–2010, rising to 16.0% for boys and 10.3% for girls. Between 2011 and 2015, the rates for boys and girls fell to 14.4% and 9.1%, respectively. In the same period, the rate of overweight boys was higher than that of overweight girls.
An absolute comparison of overweight boys and girls (OR) was performed, and a forest map was drawn. Overall, the difference in the prevalence of overweight was statistically significant (p < 0.05); that is, the overweight rate was related to sex, and the sex difference in the detection rate of overweight was increasing each year (Figure 2).
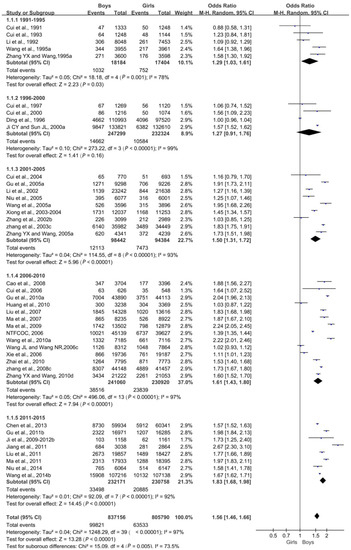
Figure 2.
Forest plot of overweight in boys compared with girls aged 0–18 years in China.
Urban and Rural Differences
Overall, both urban and rural overweight rates showed an upward trend over time, with a slight decline in 2011–2015 (Table S3). Among them, the overweight rate of urban children and adolescents reached a peak of 16.1% in 2001–2005 and then decreased. The overweight rate of children and adolescents in rural areas reached a peak of 12.3% in 2006–2010, 3.7 times higher than the peak rate of 3.3% in 1991–1995. In the same period, the detection rate of overweight in urban areas was higher than that in rural areas.
Overall, the difference in the overweight detection rate between urban and rural areas was statistically significant (p < 0.05), meaning that a correlation existed between the overweight rate and residence, and the difference between urban and rural areas became smaller (Figure 3).
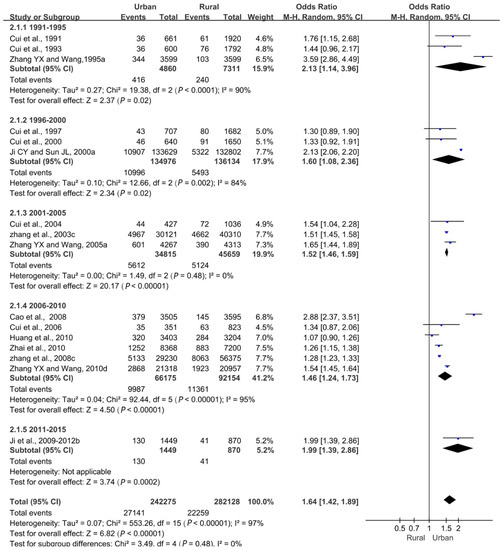
Figure 3.
Forest plot of overweight in urban children and adolescents compared with rural children and adolescents aged 0–18 years.
Differences in Growth and Development Stages
The overweight prevalence showed an increasing trend each year in different growth and development stages. In 1996–2000, the overweight detection rates in infants, early childhood, and preschool children were 4.7%, 1.4%, and 1.9%, respectively. Between 2006 and 2010, the overweight rates increased to 19.4%, 17.6%, and 11.0%, respectively. In 1991–1995, the rates of overweight among school-aged children and adolescents were 4.2% and 3.3%, respectively. In 2011–2015, the overweight rates rose to 12.8% and 10.2%, respectively. The detection rate of overweight in different growth and development stages was 11.7% in infancy, followed by 9.7% in school age, 5.6% in preschool age, and 8.2% in adolescence (Table 2).
Table 2.
Subgroup analysis by development stage of the prevalence of overweight in Chinese children and adolescents aged 0–18 years (%).
3.2.2. Prevalence Rate of Obesity in Children and Adolescents
Sex Differences
In general, obesity rates were increasing each year for both boys and girls. Overall, the obesity rate increased from 1.7% in 1991–1995 to 6.8% in 2011–2015 (Table S4). In 1991–1995, the obesity rates of boys and girls were 2.0% and 1.3%, respectively; in 2011–2015, it increased to 8.8% and 4.8%, respectively, which represent 4.4-fold and 3.7-fold increases, respectively. In the same period, the obesity rate of boys was higher than that of girls.
Overall, the difference in the obesity detection rate between boys and girls was statistically significant (p < 0.05). The obesity rate was correlated with sex, and the difference between boys and girls was increasingly significant (Figure 4).
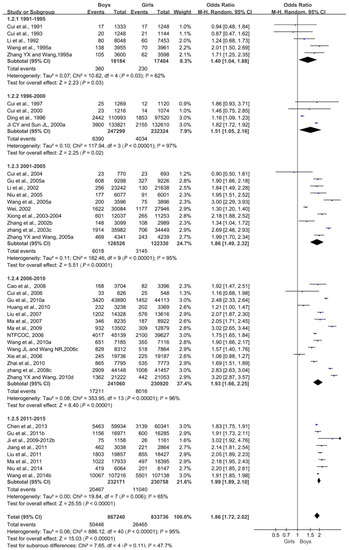
Figure 4.
Forest plot of obesity in boys compared with girls aged 0–18 years.
Urban and Rural Differences
Urban and rural obesity rates generally increased over time, with a slight decline between 2011 and 2015 (Table S5). In 1991–1995, the detection rates of obesity in urban and rural children and adolescents were 3.6% and 0.9%, respectively; in 2006–2010, they reached 7% and 4.5%, respectively; and in 2011–2015, they fell to 5.1% and 3.1%, respectively. Simultaneously, the detection rate of urban obesity was higher than that in rural areas.
Overall, we found a statistically significant difference in the detection rate of obesity between urban and rural areas (p < 0.05). The obesity rate was correlated with the place of residence, and the difference in the detection rate of obesity between urban and rural areas decreased (Figure 5).
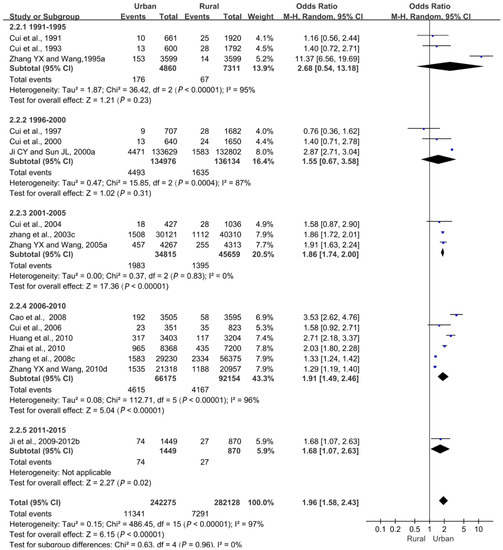
Figure 5.
Forest plot of obesity in urban children and adolescents compared with rural children and adolescents aged 0–18 years.
Differences in Growth and Development Stages
The obesity rate for all growth stages other than infancy showed an increasing trend each year. The infancy obesity rate fell from 8.3% in 1996–2000 to 6.3% in 2006–2010; in toddlers and preschool children, it increased from 4.2% and 3.1% in 1996–2000 to 5.0% and 5.3% in 2006–2010, respectively. Between 1991 and 1995, the obesity rates of school-aged children and adolescents were 1.7% and 0.3%, respectively, and they increased to 8.9% and 3.9% in 2011–2015, respectively. The comparison of obesity detection rates at different growth and development stages revealed a value of 7.0% in infancy, followed by 5.5% during school age and 2.8% in adolescence (Table 3).
Table 3.
Subgroup analysis by development stage of the prevalence of obesity in Chinese children and adolescents aged 0–18 years (%).
3.3. Heterogeneity Test and Publication Bias
In this study, the heterogeneity (I2 > 50%) of the pooled prevalence was high. Sensitivity analysis is an indirect method for analyzing heterogeneity. It mainly re-examines the combined effect by removing certain types of literature and compares the new combined results with the combined results before the exclusion. Sensitivity analysis of the sample size, study quality, diagnostic criteria, geographic distribution, and survey type showed these were important factors in research heterogeneity (Table S6).
According to the included studies, Begg’s funnel plots were drawn. The Begg’s test and Egger’s test further showed that there was no publication bias in overweight (Figure 6a, Begg’s test, p = 0.328, and Egger’s test, p = 0.892; Figure 6c, Begg’s test, p = 0.392, and Egger’s test, p = 0.947) and obesity (Figure 6b, Begg’s test, p = 0.159, and Egger’s test, p = 0.976; Figure 6d, Begg’s test, p = 0.192, and Egger’s test, p = 0.930).
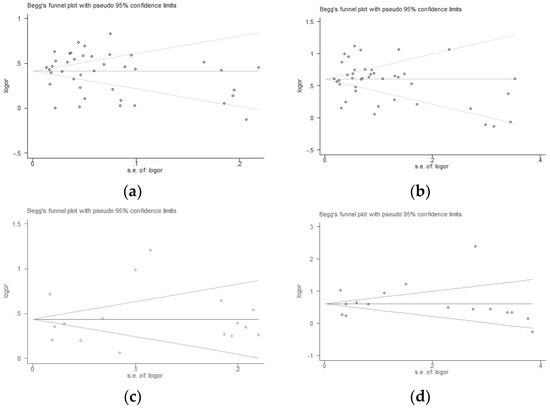
Figure 6.
Publication bias in overweight and obesity.
4. Discussion
From 1991 to 2015, the prevalence rate of overweight and obesity among Chinese children and adolescents increased, but it decreased slightly from 2011 to 2015. In 1991–2000, the overweight and obesity rates increased steadily, and sex differences were not obvious. This may be related to the gradual improvement in living standards and the improved nutrition of children in China after the reform and opening-up at the end of the 1970s. The decrease in the detection rate of overweight and obesity from 2010 to 2015 may be closely related to a series of important sports policies and regulations promulgated by Chinese government agencies. Since the reform and opening-up, the level of nutrition and morphological development of adolescents have continuously improved, and these trends have considerably improved the health of the people as a whole. However, the government departments of our country are aware that the unilateral pursuit of the rate of enrollment has led to schoolwork that is too heavy a burden on students, and rest and exercise time are seriously insufficient. Insufficient sports facilities and conditions create barriers to students’ physical education and sports activities. Physical fitness monitoring showed that physical fitness indicators, such as endurance, strength, and speed, continued to decline in young people; additionally, the rate of poor eyesight was high, and the proportion of urban overweight and obese adolescents increased significantly. The nutritional status of some rural adolescents needs to be improved. Therefore, the government department implemented the Opinions of the Central Committee of the Communist Party of China on Strengthening Youth Sports to Enhance the Physical Fitness of Young People in 2007 [45] while emphasizing the reduction of students’ schoolwork burden, ensuring an hour of exercise every day, and extensively implementing the National Million Students Sunshine Sports. The relevant survey results show that because of the promulgation and implementation of the opinions in 2007, China carried out all-round sunshine sports activities, with 95.3% of the primary school group and 85.7% of children in the middle-school group achieving passing grades for the National Student Physical Health Standard. The effect of sunshine sports is remarkable [46]. The State Sports General Administration formulated the 12th Five-Year Plan according to the overall arrangement of the CPC Central Committee and the State Council, as well as the new situation, new tasks, and new requirements faced by sports development in our country during the 12th Five-Year Plan period. Among them, the recommendation for children and adolescents was to implement the Youth Sports Promotion Program to improve the health quality of adolescents [47].
The detection rates of overweight and obesity in boys were higher than those in girls, and the gender difference increased every year, which is consistent with the results reported by Xue et al. in 2014 [48]. This may be related to cognition and dietary and physical activity behavior. For example, the tendency of parents to recognize the differences in the physical development of boys and girls may lead to feeding differences, which mainly manifest in the overfeeding of boys, thereby increasing the rate of overweight and obesity in boys compared with that in girls [49,50]. Girls and boys have different perceptions of weight and diet [51]: girls feel more pressure to be thin and suffer lower self-evaluation [52]; even if their weight is normal, they think that they need to lose weight [53]. Conversely, boys rarely think that they need to lose weight, even if they are overweight. Girls, especially adolescent girls, in pursuit of a slim figure, consciously control their diet and may have unhealthy eating behaviors, such as partial eating, picky eating, and blind dieting [54]. The 2005 risk behavior monitoring report for adolescents noted that 29.1% of boys play computer games for more than two hours a day, 2.0 times higher than girls [55].
The prevalence rates of overweight and obesity in urban children and adolescents were higher than in rural areas, but the difference between urban and rural areas decreased every year, which is consistent with the results reported by Song et al. [56]. In China, more overweight and obese children and adolescents come from economically wealthy families and have parents with higher education, and the role of socioeconomic status (SES) is opposite to that in developed countries [57,58,59,60,61]. This may be the result of higher SES requirements for children, whose weekly intake of meat or fish, eggs, dairy products, beans, and fruits and vegetables in urban areas is significantly higher than that of children in rural areas, resulting in overweight urban children and adolescents. The prevalence of obesity in urban areas was much higher than that in rural areas [62]. Second, the lack of physical activity time and the increase in the stationary behavior of urban children and adolescents may also lead to overweight urban children and adolescents [2]. Finally, exposure to high concentrations of air pollution was positively correlated with overweight and obesity in 2–13-year-old children [63]. Therefore, air pollution is a potential factor of the higher rate of overweight and obese children and adolescents in urban areas compared with those in rural areas. Zhang et al. [64] pointed out that between 1985 and 2014, the prevalence of overweight and obesity among rural children in Shandong province increased rapidly, and the problem of overweight and obesity in rural areas cannot be ignored. Simultaneously, China’s annual growth rate of urbanization increased from 0.53% in 1991 to 1.61% in 2010 [65], consistent with the increasing trend of the rate of overweight and obese children and adolescents. This increase in urbanization may be the main factor of the gradually decreasing difference between urban and rural areas.
Overall, compared with other growth and development stages, the prevalence of overweight and obesity was the highest in infants, which is consistent with the results of Chen et al. [66]. This may be related to the rapid proliferation of adipose tissue in infants and young children in the d [67]. High energy intake in the third trimester of pregnancy and passive feeding might also have led to the highest prevalence of overweight and obesity occurring in infants [68]. In China, many parents prefer to compare the weight of their children with those of other infants, mistakenly believing that heavier children are healthier [69]. On a global scale, the rate of overweight and obesity among children under five years of age increased sharply during the period of 1990–2010, and it increased the most in low- and middle-income countries [70]. In the Iranian region, children over the age of 2–6 and 7–11 years have a higher overweight trend than the older group [71]. This is consistent with the relatively low rate of overweight and obesity in adolescence in this study. With the rapid development of the economy, parents are more likely than in the past to purchase high-fat, high-energy food, and such diets can cause children’s rapid weight gain. The high obesity rate of school-aged children may be related to their poor self-control, parents’ fear of providing insufficient food and thus overfeeding, and less exercise. The reason for the decline in the detection rate during adolescence may be that with the increase in age, the health consciousness of adolescents and that of their parents strengthens, the demands of body shape improve, and the regulation of exercise and diet tightens [72]. The birth cohort of preschool children in 2001–2005 has highest through ages of 4-18 years (preschool to adolescence), but it has a prevalence rate smaller than other birth cohorts when they were infants or toddlers. It may be caused from a publication bias, or use of different definition.
The key to preventing adolescent and even adult obesity is the first year of life [36]. Foreign and domestic studies have shown that breastfeeding can reduce the risk of obesity in children [73,74]. Therefore, health education should be improved to reduce the prevalence of overweight and obesity in infants. We should simultaneously strengthen primary and middle-school children’s awareness of the risk of becoming overweight and obese, continue to implement and improve relevant policies, and increase the level of physical activity of children and adolescents to effectively reduce the detection rate of overweight and obesity among children and adolescents. Studies have shown that interventions targeting healthy eating in children may have a greater impact if healthful foods are made available and easily accessible in the home and if these healthful foods are also consumed by mothers or other family members in the household [75]. Therefore, parents should receive nutrition education to help young children develop healthy eating habits and thus improve the overall growth and development of children while preventing obesity.
Sensitivity analysis found that differences in sample size, study quality, diagnostic criteria, geographic distribution, and survey type were the reasons for the heterogeneity between studies. The Begg test results were not significant and the funnel plot did not show significant publication bias effects. However, because the included studies may be based on one or two of the three classes of gender, region and age, we are unable to obtain all levels of relevant data in the same sample, which gives us the inconvenience of conducting nine levels of research in the same sample. Therefore, this study investigated the prevalence of overweight and obesity by gender, region and age, respectively, which may introduce a bias.
5. Study Limitations
To date, the criteria for dividing overweight and obesity have not been unified. Therefore, during data collection, we classified overweight and obesity according to the division method in the literature, so some errors occurred that did not affect the general trend. However, we hope that all regions and organizations will be able to unify standards when conducting research so that they can be accurately compared.
Regional differences exist in overweight and obesity among children and adolescents in China. We did not divide the results by region. In the future, follow-up studies should be conducted on the rates of overweight and obesity in different regions. Different regions vary in terms of dimensions, elevation, living habits, eating habits, and economic conditions.
In a sensitivity analysis, the sample size, study quality, diagnostic criteria, geographic distribution, and type of survey are all important factors that contribute to research heterogeneity. For example, the size of the sample will affect the weight of the overweight and obesity detection rate; the quality of the study will affect the reliability of the detection rate of overweight and obesity; the difference in diagnostic criteria will lead to differences in the detection rate of overweight and obesity. These factors may lead to the underestimation or overestimation of the problem of overweight and obesity in Chinese children.
6. Conclusions
The meta-analysis of overweight and obesity among Chinese children and adolescents for the period from 1991 to 2015 showed significant differences in the prevalence of overweight and obesity based on region, sex, and age. The overall trend was upward, but it decreased slightly from 2011 to 2015.
According to the actual situation of local children and adolescents, each region should formulate corresponding prevention and control strategies and pay special attention to high-risk groups.
Supplementary Materials
The following are available online at https://www.mdpi.com/1660-4601/16/23/4656/s1, Table S1: Summary of studies reporting the prevalence of overweight in Chinese children and adolescents aged 0–18 years; Table S2: Summary of studies and the reported prevalence of being overweight in urban and rural children and adolescents age 0-18 years; Table S3: Summary of studies reporting the prevalence of obesity in Chinese children and adolescents aged 0–18 years; Table S4: Summary of studies and their reported prevalence of obesity in urban/rural children and adolescents aged 0–18 years; Table S5: Summary of studies and their reported prevalence of obesity in urban/rural children and adolescents age 0–18 years; Table S6: Sensitivity analysis of the studies on the prevalence of overweight/obesity in children and adolescents; File S1: PRISMA 2009 checklist.doc.
Author Contributions
Y.G. screened and analyzed the literature according to the inclusion and exclusion criteria, equally contributed to the writing of the manuscript, and analyzed the data; X.Y. conceived and monitored the study quality as the corresponding author; H.W. screened and analyzed the literature according to the inclusion and exclusion criteria and equally contributed to the writing of the manuscript; X.C. screened and analyzed the literature according to the inclusion and exclusion criteria and equally contributed to the writing of the manuscript; X.Y. contributed to the writing of the manuscript.
Funding
This research received no external funding.
Acknowledgments
All coauthors contributed to the study and approved the final version.
Conflicts of Interest
The authors declare that they have no conflict of interest.
References
- Wang, Y.; Lobstein, T. Worldwide trends in childhood overweight and obesity. Int. J. Pediatr. Obes. 2006, 1, 11–25. [Google Scholar] [CrossRef] [PubMed]
- Ma, J.; Wu, S.S.; Li, B.H.; Wang, H.J.; Zhang, S.W.; Zhang, B. Investigation on Physical Activity Among Children and Adolescents with Different Nutritional Status in Five Cities in China. Chin. J. Sch. Health 2009, 30, 214–217. [Google Scholar]
- Ma, J.; Wu, S.S. Trend Analysis of the Prevalence of Obesity and Overweight Among School-age Children and Adolescents in China. Chin. J. Sch. Health 2009, 30, 195–197. [Google Scholar]
- Ma, J.; Cai, C.H.; Wang, H.J.; Dong, B.; Song, Y.; Hu, P.J.; Zhang, B. The trend analysis of overweight and obesity in Chinese students during 1985–2010. Chin. J. Prev. Med. 2012, 46, 776–780. [Google Scholar]
- Wang, S.; Dong, Y.H.; Wang, Z.H.; Zou, Z.Y.; Ma, J. Trends in overweight and obesity among Chinese children of 7–18 years old during 1985–2014. Chin. J. Prev. Med. 2017, 51, 300–305. [Google Scholar]
- The people’s Republic of China Ministry of health of maternal and child health care and Community health department. The Nattional Growth Survey of Children Under 7 Years in the Nine Cities of China; People’s Medical Publishing House (PMPH): Beijing, China, 2008; pp. 188–190.
- Wang, W.Q.; Zhao, Z.P.; Ma, Y.; Zhu, Y.; Hou, R.L.; Gao, X.Y. Nutritional Status of Village Students in Chang’an County, 1990–1999. Chin. J. Sch. Health 2003, 24, 39–40. [Google Scholar]
- Xie, S.N.; Wang, J.M.; Li, N.; Jiang, W.W.; Yang, S.B.; Li, X.; Ling, Z.Y.; Zhang, J. Survey on overweight and obesity of preschool children in rural areas from ten provinces of China. Chin. J. Epidemiol. 2014, 35, 425–428. [Google Scholar]
- Paradise, A.W.; Kernis, M.H. Self-esteem and psychological well-being: Implications of fragile self-esteem. J. Soc. Clin. Psychol. 2002, 21, 345–361. [Google Scholar] [CrossRef]
- Wang, F.; Wild, T.C.; Kipp, W.; Kuhle, S.; Veugelers, P.J. The influence of childhood obesity on the development of self-esteem. Health Rep. 2009, 20, 21–27. [Google Scholar]
- Peeters, A.; Barendregt, J.J.; Willekens, F.; Mackenbach, J.P.; Al Mamun, A.; Bonneux, L. Obesity in adulthood and its consequences for, life expectancy: A life-table analysis. Ann. Intern. Med. 2003, 138, 24–32. [Google Scholar] [CrossRef]
- Wu, Z.J.; Wang, Z.Y.; SongYan, L.Q. Meta-Analysis of Chinese Obese Adolescents Weight-losing Effect by Exercise. J. Shenyang Sport Univ. 2017, 36, 67–75. [Google Scholar]
- Group of China Obesity Task Force. Body mass index reference norm for screening overweight and obesity in Chinese children and adolescents. Chin. J. Epidemiol. 2004, 25, 97–102. [Google Scholar]
- Word Health Organization. Physical status: The use and interpretation of anthropometry. Report of a WHO Expert Committee. World Health Org. Tech. Rep. Ser. 1995, 854, 1–452. [Google Scholar]
- Cole, T.J.; Bellizzi, M.C.; Flegal, K.M.; Dietz, W.H. Establishing a standard definition for child overweight and obesity worldwide: International survey. Br. Med. J. 2000, 320, 1240–1243. [Google Scholar] [CrossRef] [PubMed]
- Kuczmarski, R.J.; Ogden, C.L.; Guo, S.S.; Grummer-Strawn, L.M.; Flegal, K.M.; Mei, Z.; Wei, R.; Curtin, L.R.; Roche, A.F.; Johnson, C.L. 2000 CDC Growth Charts for the United States: Methods and Development; Vital and Health Statistics. Series 11; National Health Survey: Hyattsville, MA, USA, 2002; pp. 1–190.
- Tzamaloukas, A.H.; Murata, G.H.; Hoffman, R.M.; Schmidt, D.W.; Hill, J.E.; Leger, A.; Macdonald, L.; Caswell, C.; Janis, L.; White, R.E. Classification of the degree of obesity by body mass index or by deviation from ideal weight. JPEN Parenter. Enter. Nutr. 2003, 27, 340–348. [Google Scholar] [CrossRef]
- Yu, Z.B.; Han, S.P.; Chu, J.H.; Xu, Z.Y.; Zhu, C.; Guo, X.R. Trends in Overweight and Obesity among Children and Adolescents in China from 1981 to 2010: A Meta-Analysis. PLoS ONE 2012, 7. [Google Scholar] [CrossRef]
- Higgins, J.; Thompson, S.G. Quantifying heterogeneity in a meta-analysis. Stat. Med. 2002, 21, 1539–1558. [Google Scholar] [CrossRef]
- Begg, C.B.; Mazumdar, M. Operating characteristics of a rank correlation test for publication bias. Biometrics 1994, 50, 1088–1101. [Google Scholar] [CrossRef]
- Ding, Z.Y.; He, Q.; Fan, Z.H.; Du, L.R.; Jiang, J.X.; Lu, X.Y.; Zheng, D.Y.; Zheng, H.L.; Yao, K.N.; Xie, P.; et al. National epidemiological study on obesity of children aged 0–7 years in china 1996. Natl. Med. J. China 1998, 78, 121–123. [Google Scholar]
- The National Task Force on Childhood Obesity and National Center for Women’s and Children’s Health. National epidemiological survey on childhood obesity, 2006. Chin. J. Pediatr. 2008, 46, 179–184. [Google Scholar]
- Cao, X.H.; Wang, H.J.; Yu, G.W. Prevalence of overweight and obesity of Lanzhou in 2008. Chin. J. Sch. Health 2011, 32, 695–696. [Google Scholar]
- Chen, Y.S.; Zhang, Y.M.; Kong, Z.X.; Yu, J.J.; Sun, T.T.; Zhang, H.Y. The prevalence of overweight and obesity in children and adolescents in China. Chin. J. Dis. Control Prev. 2017, 21, 866–869. [Google Scholar]
- Cui, Z.H.; Huxley, R.; Wu, Y.F.; Dibley, M.J. Temporal trends in overweight and obesity of children and adolescents from nine Provinces in China from 1991–2006. Int. J. Pediatr. Obes. 2010, 5, 365–374. [Google Scholar] [CrossRef] [PubMed]
- Li, Y.; Schouten, E.G.; Hu, X.; Cui, Z.; Luan, D.; Ma, G. Obesity prevalence and time trend among youngsters in China, 1982–2002. Asia Pac. J. Clin. Nutr. 2008, 17, 131–137. [Google Scholar]
- Wang, X.J.; Yang, Y.; Wu, Y.Q.; Peng, N.N. Study on epidemiological trend of overweight and obesity school-age children and adolescents over the past 29 years (1985–2014) in Shanghai, China. Chin. J. Evid. Based Pediatr. 2017, 12, 126–130. [Google Scholar]
- Gu, D.W.; Yang, B.C.; Ma, P. Trend analysis of overweight and obesity among children and adolescents in Jiangsu Province during 2005–2015. Chin. J. Sch. Health 2017, 38, 1540–1542. [Google Scholar]
- Huang, Z.Y.; BuRen, B.T.; HaSen, G.W.; Lin, Z.; Li, Y.S.; Zhang, Z.W.; Tong, W.J. Trends of overweight and obesity in aged 7 to 18 Mongolian ethnic children and adolescents from 1985–2010. Chin. J. Epidemiol. 2012, 33, 201–206. [Google Scholar]
- Ji, C.Y.; Sun, J.L. Prevalence of overweight and Obesity in Chinese students and its trend in the past 15 years. J. Peking Univ. 2004, 36, 194–197. [Google Scholar]
- Zhang, Y.X.; Wang, S.R. Distribution of body mass index and the prevalence changes of overweight and obesity among adolescents in Shandong, China from 1985 to 2005. Ann. Hum. Biol. 2008, 35, 547–555. [Google Scholar]
- Zhai, L.L.; Dong, Y.D.; Bai, Y.L.; Wei, W.; Jia, L.H. Trends in obesity, overweight, and malnutrition among children and adolescents in Shenyang, China in 2010 and 2014: A multiple cross-sectional study. BMC Public Health 2017, 17, 151. [Google Scholar] [CrossRef]
- Zhang, J.M.; Wang, J.; Zhu, J.F. Prevalence of obesity in 1–7-year-old children in Pudong New area of Shanghai. Anthol. Med. 2003, 22, 41–42. [Google Scholar]
- Wei, M. Epidemiological baseline survey of simple obesity among 6-year-old children in Shanghai in 2002. Shanghai J. Prev. Med. 2007, 19, 349–351. [Google Scholar]
- Xiong, F.; Zeng, Y.; Long, C.L.; Wang, D.G.; Zhu, M.; Luo, Y.H.; Luo, S.Q.; Lei, P.Y.; Deng, L.L.; Jiang, Y.C.; et al. Epidemiological survey of obesity and its related diseases in children and adolescents aged 3 to 18 years in Chongqing urban areas. Chongqing Med. 2005, 34, 1838–1840. [Google Scholar]
- Wang, J.L.; Wang, N.R. National epidemiological study on obesity children aged 0–18 years in Chongqing urban area. Chin. J. Child Health Care 2008, 16, 55–57. [Google Scholar]
- Zhang, M.Y.; Guo, F.X.; Tu, Y.Z.; Kiess, W.; Sun, C.J.; Li, X.; Lu, W.; Luo, F.H. Further increase of obesity prevalence in Chinese children and adolescents—Cross-sectional data of two consecutive samples from the city of Shanghai from 2003 to 2008. Pediatr. Diabetes 2012, 13, 572–577. [Google Scholar] [CrossRef] [PubMed]
- Niu, X.L.; Xu, H.X.; Zhao, S.T. Analysis of prevalence trend of overweight and obesity among children and adolescents of Hui Han nationality in Ningxia. Chin. J. Sch. Health 2016, 37, 1910–1912. [Google Scholar]
- Liu, B.Y.; Jing, J.; Mai, J.C.; Chen, Y.J.; Xu, G.F.; Bao, P.; Yu, M.Q.; Zhang, W.; Peng, Y.H. Secular trends of overweight and obesity prevalence between 2007 and 2011 in children and adolescents in Guangzhou. Chin. J. Prev. Med. 2014, 48, 312–317. [Google Scholar]
- Ji, G.Y.; Dun, Z.J.; Jiang, Q.; Wen, J.; Wang, P.; Huang, R.; Chen, Z.H.; Li, Z.H.; Ma, W.J.; Zhang, Y.H. Prevalence and trend of overweight and obesity in children and adolescents in Guangdong province, 2002–2012. Chin. J. Epidemiol. 2016, 37, 1242–1247. [Google Scholar]
- Gu, F.; Zhang, R.H.; Fang, Y.Q.; Hu, H.F.; Li, N. Prevalence of overweight and obesity among children and adolescents in Zhejiang Province. Chin. J. Sch. Health 2013, 34, 838–840. [Google Scholar]
- Jiang, X.X.; Hardy, L.L.; Baur, L.A.; Ding, D.; Wang, L.; Shi, H.J. High prevalence of overweight and obesity among inner city Chinese children in Shanghai, 2011. Ann. Hum. Biol. 2014, 41, 469–472. [Google Scholar] [CrossRef]
- Ma, L.; Mai, J.; Jing, J.; Liu, Z.; Zhu, Y.; Jin, Y.; Chen, Y. Empirical change in the prevalence of overweight and obesity in adolescents from 2007 to 2011 in Guangzhou, China. Eur. J. Pediatr. 2014, 173, 787–791. [Google Scholar] [CrossRef] [PubMed]
- Zhang, Y.X.; Wang, S.R. Prevalence and regional distribution of childhood overweight and obesity in Shandong Province, China. World J. Pediatr. 2013, 9, 135–139. [Google Scholar] [CrossRef] [PubMed]
- CPC Central Committee and Council. Views of the State Council of the CPC Central Committee on Strengthening the Physical Fitness of Adolescents. Available online: http://www.gov.cn/jrzg/2007-05/24/content_625090.htm (accessed on 5 November 2018).
- Lu, Y.Y.; Huang, Y.F. A Study on Typical Samples of Implement Achievements of Sunshine Athletic Sports. Zhejiang Sport Sci. 2011, 33, 63–66. [Google Scholar]
- General Administration of Sport of China. The Twelfth Five-Year Plan for the Development of Physical Education. Available online: http://www.sport.gov.cn/n16/n1077/n1467/n1843577/1843747.html (accessed on 5 November 2018).
- Xue, H.M.; Liu, Y.; Duan, R.N.; Zhou, X.; Cheng, G. Prevalence trend of overweight and Obesity in Chinese Children and adolescents and related influencing factors. Chin. J. Sch. Health 2014, 35, 1258–1262. [Google Scholar]
- Zhang, X. Status of obesity and its influencing factors among pupils in Changning District, Shanghai. Chin. J. Sch. Dr. 2012, 26, 189–190. [Google Scholar]
- Zhao, G.L.; Li, W.; Wang, W.Y. Study on Comprehensive Intervention for Obesity among Preschool Children. Chin. J. Soc. Med. 2014, 31, 204–206. [Google Scholar]
- O’Dea, J.A.; Caputi, P. Association between socioeconomic status, weight, age and gender, and the body image and weight control practices of 6-to 19-year-old children and adolescents. Health Educ. Res. 2001, 16, 521–532. [Google Scholar] [CrossRef]
- Mak, K.K.; Pang, J.S.; Lai, C.M.; Ho, R.C. Body esteem in Chinese adolescents: Effect of gender, age, and weight. J. Health Psychol. 2013, 18, 46–54. [Google Scholar] [CrossRef]
- Shi, Z.M.; Lien, N.N.; Kumar, B.N.; Holmboe-Ottesen, G. Perceptions of weight and associated factors of adolescents in Jiangsu Province, China. Public Health Nutr. 2007, 10, 298–305. [Google Scholar] [CrossRef]
- Ye, W.X. Investigation of nutritional status of students in elementary and middle school in Heyuan city. Chin. J. Dis. Control Prev. 2006, 10, 317–318. [Google Scholar]
- Ji, C.Y. A Comprehensive Survey of Health-Related Risk Behaviors among Adolescents in China 2005; Peking University Medical Press: Beijing, China, 2007. [Google Scholar]
- Song, Y.; Ma, J.; Wang, H.J.; Wang, Z.Q.; Hu, P.J.; Zhang, B.; Agard, A. Secular Trends of Obesity Prevalence in Chinese Children from 1985 to 2010: Urban-Rural Disparity. Obesity 2015, 23, 448–453. [Google Scholar] [CrossRef] [PubMed]
- Bovet, P.; Chiolero, A.; Shamlaye, C.; Paccaud, F. Prevalence of overweight in the Seychelles: 15 year trends and association with socio-economic status. Obes. Rev. 2008, 9, 511–517. [Google Scholar] [CrossRef] [PubMed]
- Cheng, T.O. Fast food, automobiles, television and obesity epidemic in Chinese children. Int. J. Cardiol. 2005, 98, 173–174. [Google Scholar] [CrossRef] [PubMed]
- Davis, A.M.; Bennett, K.J.; Befort, C.; Nollen, N. Obesity and Related Health Behaviors Among Urban and Rural Children in the United States: Data from the National Health and Nutrition Examination Survey 2003–2004 and 2005–2006. J. Pediatr. Psychol. 2011, 36, 669–676. [Google Scholar] [CrossRef] [PubMed]
- Sjoberg, A.; Moraeus, L.; Yngve, A.; Poortvliet, E.; Al-Ansari, U.; Lissner, L. Overweight and obesity in a representative sample of schoolchildren—Exploring the urban-rural gradient in Sweden. Obes. Rev. 2011, 12, 305–314. [Google Scholar] [CrossRef] [PubMed]
- Zhang, X.Y.; van der Lans, I.; Dagevos, H. Impacts of fast food and the food retail environment on overweight and obesity in China: A multilevel latent class cluster approach. Public Health Nutr. 2012, 15, 88–96. [Google Scholar] [CrossRef]
- Yin, X.J.; Jia, L.Q.; Gao, X.D.; Guo, Q. Comparative Study of Physical Fitness between Migrant Workers’ School Children and Those of the Shanghai Natives. J. Chengdu Sport Univ. 2011, 37, 66–69. [Google Scholar]
- Dong, G.H.; Qian, Z.M.; Liu, M.M.; Wang, D.; Ren, W.H.; Flick, L.H.; Fu, J.; Wang, J.; Chen, W.; Simckes, M.; et al. Ambient Air Pollution and the Prevalence of Obesity in Chinese Children: The Seven Northeastern Cities Study. Obesity 2014, 22, 795–800. [Google Scholar] [CrossRef]
- Zhang, Y.X.; Wang, Z.X.; Zhao, J.S.; Chu, Z.H. Trends in overweight and obesity among rural children and adolescents from 1985 to 2014 in Shandong, China. Eur. J. Prev. Cardiol. 2016, 23, 1314–1320. [Google Scholar] [CrossRef]
- Chen, M.X.; Liu, W.D.; Tao, X.L. Evolution and assessment on China’s urbanization 1960–2010: Under-urbanization or over-urbanization? Habitat Int. 2013, 38, 25–33. [Google Scholar] [CrossRef]
- Chen, Y.H.; Mao, H.F. Analysis of overweight and Obesity in 0–2-year-old infants in Yinzhou District and its influencing factors. Chin. J. Prev. Control Chronic Dis. 2018, 26, 31–33. [Google Scholar]
- Wang, N.R.; Huang, J.; Li, K.P.; Zhao, Y.; Wen, J.; Ye, Y.; Fan, X. Prevalence and risk factors of overweight and obesity among infants in Chongqing urban area. Chin. J. Contemp. Pediatr. 2013, 15, 207–211. [Google Scholar]
- Yu, H.; Chen, X.X.; Liu, D. Influencing factors and epidemic status of overweight and obesity of infants under 3 years of age in Shaoxing. Chin. J. Child Health Care 2012, 20, 749–750. [Google Scholar]
- Levine, J.A. Obesity in China: Causes and solutions. Chin. Med. J. Peaking 2008, 121, 1043–1050. [Google Scholar] [CrossRef]
- De Onis, M.; Blössner, M.; Borghi, E. Global prevalence and trends of overweight and obesity among preschool children. Am. J. Clin. Nutr. 2010, 92, 1257–1264. [Google Scholar] [CrossRef]
- Kelishadi, R.; Haghdoost, A.; Sadeghirad, B.; Khajehkazemi, R. Trend in the prevalence of obesity and overweight among Iranian children and adolescents: A systematic review and meta-analysis. Nutrition 2014, 30, 393–400. [Google Scholar] [CrossRef]
- Tang, Q.; Chen, S.K.; Luo, J.S.; Fan, X.; Feng, Y. Epidemiologic status and influencing factors of obesity in children and adolescents. Chin. J. Child Health Care 2011, 19, 1014–1017. [Google Scholar]
- Yan, J.; Liu, L.; Zhu, Y.; Huang, G.W.; Wang, P.P. The association between breastfeeding and childhood obesity: A meta-analysis. BMC Public Health 2014, 14, 1267. [Google Scholar] [CrossRef]
- Gong, Q.H.; Zhang, X.H. Meta-analysis of the association between breastfeeding and children’s obesity. Chin. J. Child Health Care 2009, 17, 38–40. [Google Scholar]
- Kral, T.V.E.; Rauh, E.M. Eating behaviors of children in the context of their family environment. Physiol. Behav. 2010, 100, 567–573. [Google Scholar] [CrossRef]


© 2019 by the authors. Licensee MDPI, Basel, Switzerland. This article is an open access article distributed under the terms and conditions of the Creative Commons Attribution (CC BY) license (http://creativecommons.org/licenses/by/4.0/).