Article

Risk Profiling from the European Statistics on Accidents at Work (ESAW) Accidents′ Databases: A Case Study in Construction Sites

Department of Chemical Engineering Materials Environment (DICMA), Sapienza-University of Rome, via Eudossiana 18, 00184 Rome, Italy
*
Author to whom correspondence should be addressed.
Int. J. Environ. Res. Public Health 2019, 16(23), 4748; https://doi.org/10.3390/ijerph16234748
Submission received: 7 November 2019 / Revised: 22 November 2019 / Accepted: 25 November 2019 / Published: 27 November 2019
(This article belongs to the Special Issue Occupational Safety and Risks in Construction)

Abstract

:
The number of accidents and victims in the construction sector has not decreased significantly despite the increasingly stricter laws and regulations. The analysis of accidents, as well as their root causes and determinants can certainly contribute to the development of more effective preventive interventions. The present study proposes a methodology for the analysis and synthesis of data provided by accidents statistics with the goal of defining specific risk profiles based on the accidents determinants, their variables, and how they interact with one another in influencing the occurrence of an accident. For this purpose, a procedure capable of extracting this type of information from the European Statistics on Accidents at Work (ESAW) database was developed. In particular, data processing and aggregation are performed by means of the synergic use of the Matrix of Descriptors (MoD) and cluster analysis. To validate such a procedure, the analysis of fatalities due to electrical shocks was carried out. The results achieved allowed us to elicit valuable information for both safety managers and decision makers. The proposed methodology can facilitate a systemic analysis of accidents databases reducing the difficulties in managing reports and accident statistics.

1. Introduction

The high rate of occupational accidents in the construction industry represents a major concern in many countries (as outlined by numerous studies and statistics, e.g., in [1,2,3,4,5,6,7]), despite the efforts made by governments and public bodies to reduce it [8,9,10,11,12]. One of the main issues to deal with such a phenomenon consists in performing a proper occupational risk assessment (ORA) [13] in order to provide effective safety management measures since the project level [14,15,16]. However, the analysis of the accident causality and the definition of the related safety measures represent a complex task [17,18,19]. Traditional tools for occupational safety management at the engineer′s disposal are based on the legislation requirements, technical standards, safety guidelines, investigation reports and accident statistics [20]. The analysis of the latter can provide essential information to designers, project and safety managers for the implementation of adequate preventive measures [21,22,23]. In literature, numerous studies fostering such a cue discuss the quality of data provided by official accidents reports [24,25]. In particular, with reference to the European Statistics on Accidents at Work (ESAW) system of the European Union (EU), Molinero-Ruiz et al. [26] analyzed the reliability and validity of the ESAW variables′ coding system. They argued that further studies are needed to augment the quality of this database as it represents the basis for decision-making aimed at improving occupational safety. Salguero-Caparros et al. [27] reviewed numerous empirical studies on the way investigation reports on occupational accidents are carried out, considering the usability of ESAW variables to support the definition of preventive measures. This study brought to light the difficulties of inspectors in providing information regarding accidents adequately, consequently reducing the effectiveness of this type of databases. The problems related to accidents reporting were highlighted also by Schenk and Öberg [28], who stated that some difficulties with identifying chemical accidents even when the coder is guided by an ESAW compatible reporting form. Similarly, other studies have reported the limitations of ESAW system in providing an accident scenario in the agricultural field [29], analyzing the associated accident reports to reduce such flaws [30]. Palamara et al. [31] proposed the joint use of the Self Organizing Map (SOM) artificial neural network as a supportive tool for the k-means clustering algorithm to filter ESAW data on accidents occurred in the wood processing industry. An augmentation of this approach to deal with accidents′ variables more effectively was proposed by Comberti et al. [32], who also provided a review of studies of ESAW data treatment models to support risk assessment.
Considering the construction sector, Carrillo-Castrillo et al. [33] examined the accident investigation by public authorities and how this affects the identification and prioritization of preventive activities. Reviewing the accident models proposed in literature, the Authors emphasized the lack of specific studies making the usability of accidents′ statistics variables and coding, proposing a procedure based on ESAW variables that aims at establishing a correlation between accident causation and workers′ characteristics. On the one hand, the results achieved show how human factors can influence the accident causes identified in official investigations. On the other hand, this study also highlights the problem of identifying multiple factors that influence the mode of occurrence of an event positively or negatively (i.e., the so called “modulators”).
Moreover, the quality of the information extracted from accidents reports is also based on the ability of the analysts in using them [34], and more research needs to be carried out to deal with this potential bias [35,36]. Some methods for accidents classification and analysis do not rely on the same taxonomy of contributing factors, allowing the analysts a certain degree of freedom that reduces the reliability of the results [37]. As noticed by Hola et al. [38], the analysis of accidents should be carried out in a standardized manner in order to allow the comparison of results of different studies. For these reasons, they proposed a methodology for the classification of the causes of occupational accidents involving construction scaffolding into generic groups that include technical, organizational, and human causes. In this way, the information collected from the database can be used for prioritizing and developing preventive measures.
Such a “predictive” role played by the analyses of accidents databases is referred to the capability of exploring accident patterns to put forward recommendations for accident prevention [39,40,41,42]. In fact, the analysis of accidents can support safety engineers in better understanding the factors generating them, providing useful information on the characteristics of some recurring critical elements, especially those induced by errors and/or procedural omissions [43]. Ayhan and Tokdemir [44] have recently provided a literature review of studies focusing on the extraction of information on accidents based on databases, as they represent a fundamental means for determining accidents′ causes as well as developing better safety systems and preventive measures. Consequently, they developed a methodology for incident analysis (i.e., considering both accidents and near-misses) based on data collected at the construction site. On the one hand, such an approach resulted in being more effective than previous studies as it is based on real data collected at various construction sites. On the other hand, the quality of the output depends on the experience of the analysts and data collection activities can be very time- and resource-consuming. Alternatively, several Authors have suggested the use of compensation authorities′ databases for gathering information on accidents to be used to depict safety indicators [45,46,47].
However, as recently observed by Love et al. [48], the use of this type of data might lead to an underestimation of the phenomena, consequently reducing the quality of the captured information. In fact, these types of analyses provide indications at a general level, which need further processing to take into account the complexity arising from the combination of multiple factors that can lead to an accident [23]. In such a context, the cindynic approach [49] addressing the analysis of systemic sources and drivers of risk should be applied to extract more consistent information.
Based on these considerations, it is deemed that the use of accidents statistics represents one of the most powerful approaches to capture information able to improve safety issues in construction projects. However, difficulties in dealing with these data properly have emerged, shedding light on the need of further studies on tools capable of providing practical and specific results efficiently.
The present study aims at contributing to the latter issue, proposing a methodology based on the k-means cluster analysis [50,51] for eliciting safety information from ESAW accidents reports in a systemic manner. Such a tool is largely used in exploratory data analysis due to its simplicity and easiness of use [52]. It allows the analysts to identify groups of similar objects (clusters) from a sample population: in particular, the method uses a centroid-based approach to minimize within-cluster variations, while different clusters have to differ from one another to the highest degree possible [53]. Accordingly, k-means clustering can allows the individuation of clusters of accidents with common characteristics.
More in detail, the accidents reports considered in this study are the ones provided by the database Infor.MO [54] by the Italian Compensation Authority (INAIL), where occupational fatalities and accidents leading to serious injuries are registered and classified. Differently from the general database on occupational accidents, Infor.MO is a database based on the ESAW latest protocol that makes additional information on the registered accidents available. In fact, it provides a brief description of the accident, a record card showing the details of the injury factor, as well as the determinant or the determinants when one or more factors have contributed to the accident′s occurrence [55]. The use of ESAW databases can allow the reduction of the drawbacks related to the limited information of traditional statistics on occupational accidents [23]. Actually, this permits the definition of a set of accidents descriptors as a base for further characterization analysis of the data considering multiple variables. In this ambit, clustering tools can lead to a stratification of the results providing useful information on the relationship between the accidents occurred in a specific sector and the related descriptors, i.e., the variables of integration characterizing the phenomenon. For this purpose, based on a systemic classification of these accident descriptors, data collected are translated into Boolean variables and then analyzed through a k-means cluster analysis [56,57].

2. Materials and Methods

2.1. The Infor.MO Database

As mentioned earlier, the database Infor.MO [54] provides not only traditional statistics on the number of occupational accidents, but also additional data describing each accident. As observed by Lombardi and Rossi [56], the information that can be collected by the Infor.MO database consists in the following data:
  • Type of accident: e.g., fatality, serious injury, or disabling accident.
  • Data related to the event: e.g., date, hour, no. of people involved, type of working activity carried out when the accident occurred, type of company, economic sector of the company, etc.
  • Description of the accident: a synthetic description of the accident is provided based on the reports of the authorities.
  • Type of energy transfer: energy exchange, energy release, and improper use of energy.
  • ESAW variables: following the ESAW rules, data such as deviation, material agent, contact type, etc. are codified.
  • Information on the victim: age, sex, nationality, working experience, type of lesion/injury, part of the body injured, etc.
In Figure 1 data sheets extracted from the Infor.MO database regarding a fatal accident in the construction sector are shown [58].

2.2. Cluster Analysis for Occupational Safety

Cluster analysis is a well-known statistical method for classification [59], grouping together objects whose patterns of scores on certain variables are similar [60]. In literature, numerous applications of cluster analysis tools in the field of occupational safety can be found, which are aimed at putting forward predictive information on safety issues [61]. For instance, Arocena and Nunez [62] used the Euclidean distance between vectors of the standardized values of 12 variables in order to classify Occupational Health and Safety (OHS) management systems among manufacturing companies, providing a relationship between the different types of the classified OHS systems and the number of accidents. Similarly, Champoux and Brun [63] applied a hierarchical cluster analysis to describe the employers′ representations of OHS safety problems and hindrances to improve prevention within the company.
In addition, cluster analysis was also used to extract and categorize data from statistics: in fact, several studies focused on the analysis of specific risks based on statistics concerning incidents. For example, Engkvist et al. [64] applied the cluster analysis for the statistical treatment of data collected among nursing personnel in order to bring to light the relationship between the risk of back injuries and the risk factors or protective factors associated to these working activities. Differently, Raviv et. al. [65] applied cluster analysis to statistics on near-misses in the use of cranes in the construction sector. More in detail, this research project was articulated into three different main phases, concerning: data collection; cluster analysis; and the identification of the incident′s total risk potential by means of the Analytic Hierarchy Process (AHP) method. As already underlined, other studies applied the Kohonen′s Self-Organizing Map (SOM) and the k-means clustering algorithm to identify the most critical groups of occupational accidents from ESAW data [31,32]. Therefore, on the one hand, the benefits emerging from the use of cluster analysis and its extensions for the elicitation of safety information from incidents statistics to be used also in a predictive manner are clearly deemed. On the other hand, although the remarkable results achieved by these studies, their usability at a practical level appears limited due to the difficulties that might arise in data collection and their proper manipulation to establish a relationship between them and the working activities.

2.3. Systemic Approach

As mentioned above, when dealing with critical factors resulting from complex activities a systemic approach for risk analysis is needed. In this ambit, the theoretical framework provided by the cindynic theory [66] foresees the synergy between statistics (data), modelling (methods), goals (finalities), rules (laws), and values in the so-called “cindynic hyperspace” (Figure 2).
In detail, on the one side, the combination between statistics and modelling (the epistemic-mnesic space) allows the definition of the characteristics of the system′s risk profile (safety targets). On the other side, a regulatory action supported by ethical criteria (the ethical-axiological space) defines the legal responsibility profile by setting safety criteria. Between these two spaces, the teleological plan can be identified, allowing the control of the compliance through the comparison between the acceptability criteria (i.e., safety criteria) and safety targets (i.e., mandatory requirements), providing information on the thorough profile of risks. Such a holistic representation of the level of danger highlights the role of the knowledge that can be acquired by accidents statistics on the proper definition of a risk profile (epistemic-mnesic dimensions), while the behavior of operators and supervisors is characterized by the ethical-axiological dimensions [67].
The translation of such an approach in the practical analysis of an accident can be carried out by means of the Reason′s Swiss Cheese Model (SCM), according to which an accident can be ascertained to one or more of four failure domains: organizational factors, supervision, preconditions and specific acts [68]. In other words, when the holes of the SCM defensive layers (representing technical, operational, and organizational barriers) are lined up, an existing hazard can cause an accident [69].
Therefore, the above mentioned domains need to be represented by accident descriptors tailored on the main areas of relevance used to describe the occurrence of an accident in official reports. For this purpose, the following four descriptors were selected following the accident report schemes provided by the International Labour Office (ILO) guideline on the official reporting requirements of occupational accidents [70]: hazards (representing the hazards in the working environment); hazardous events (i.e., the contact—mode of injury); responsibilities (describing the responsibilities of the worker/entrepreneur in both the cold phase (i.e., planning) and in the hot phase (i.e., during the working activity); and compliance (indicating whether, when the accident occurred, the compliance with safety requirements was fulfilled or not). To summarize, the analysis of the accident descriptors allows the evaluation of the failure domains providing information on risk sources and drivers, and consequently on which actions are needed to reduce the occurrence of the same type of accident.

2.4. Research Approach

Based on the above considerations, the aim of the present study consists in providing a methodology tailored for using data from already existing databases, such as Infor.MO, which is capable of providing codified information to build up a set of variables describing the way an accident occurs. More in detail, such a methodology, summarized in Figure 3, consists of the following main phases:
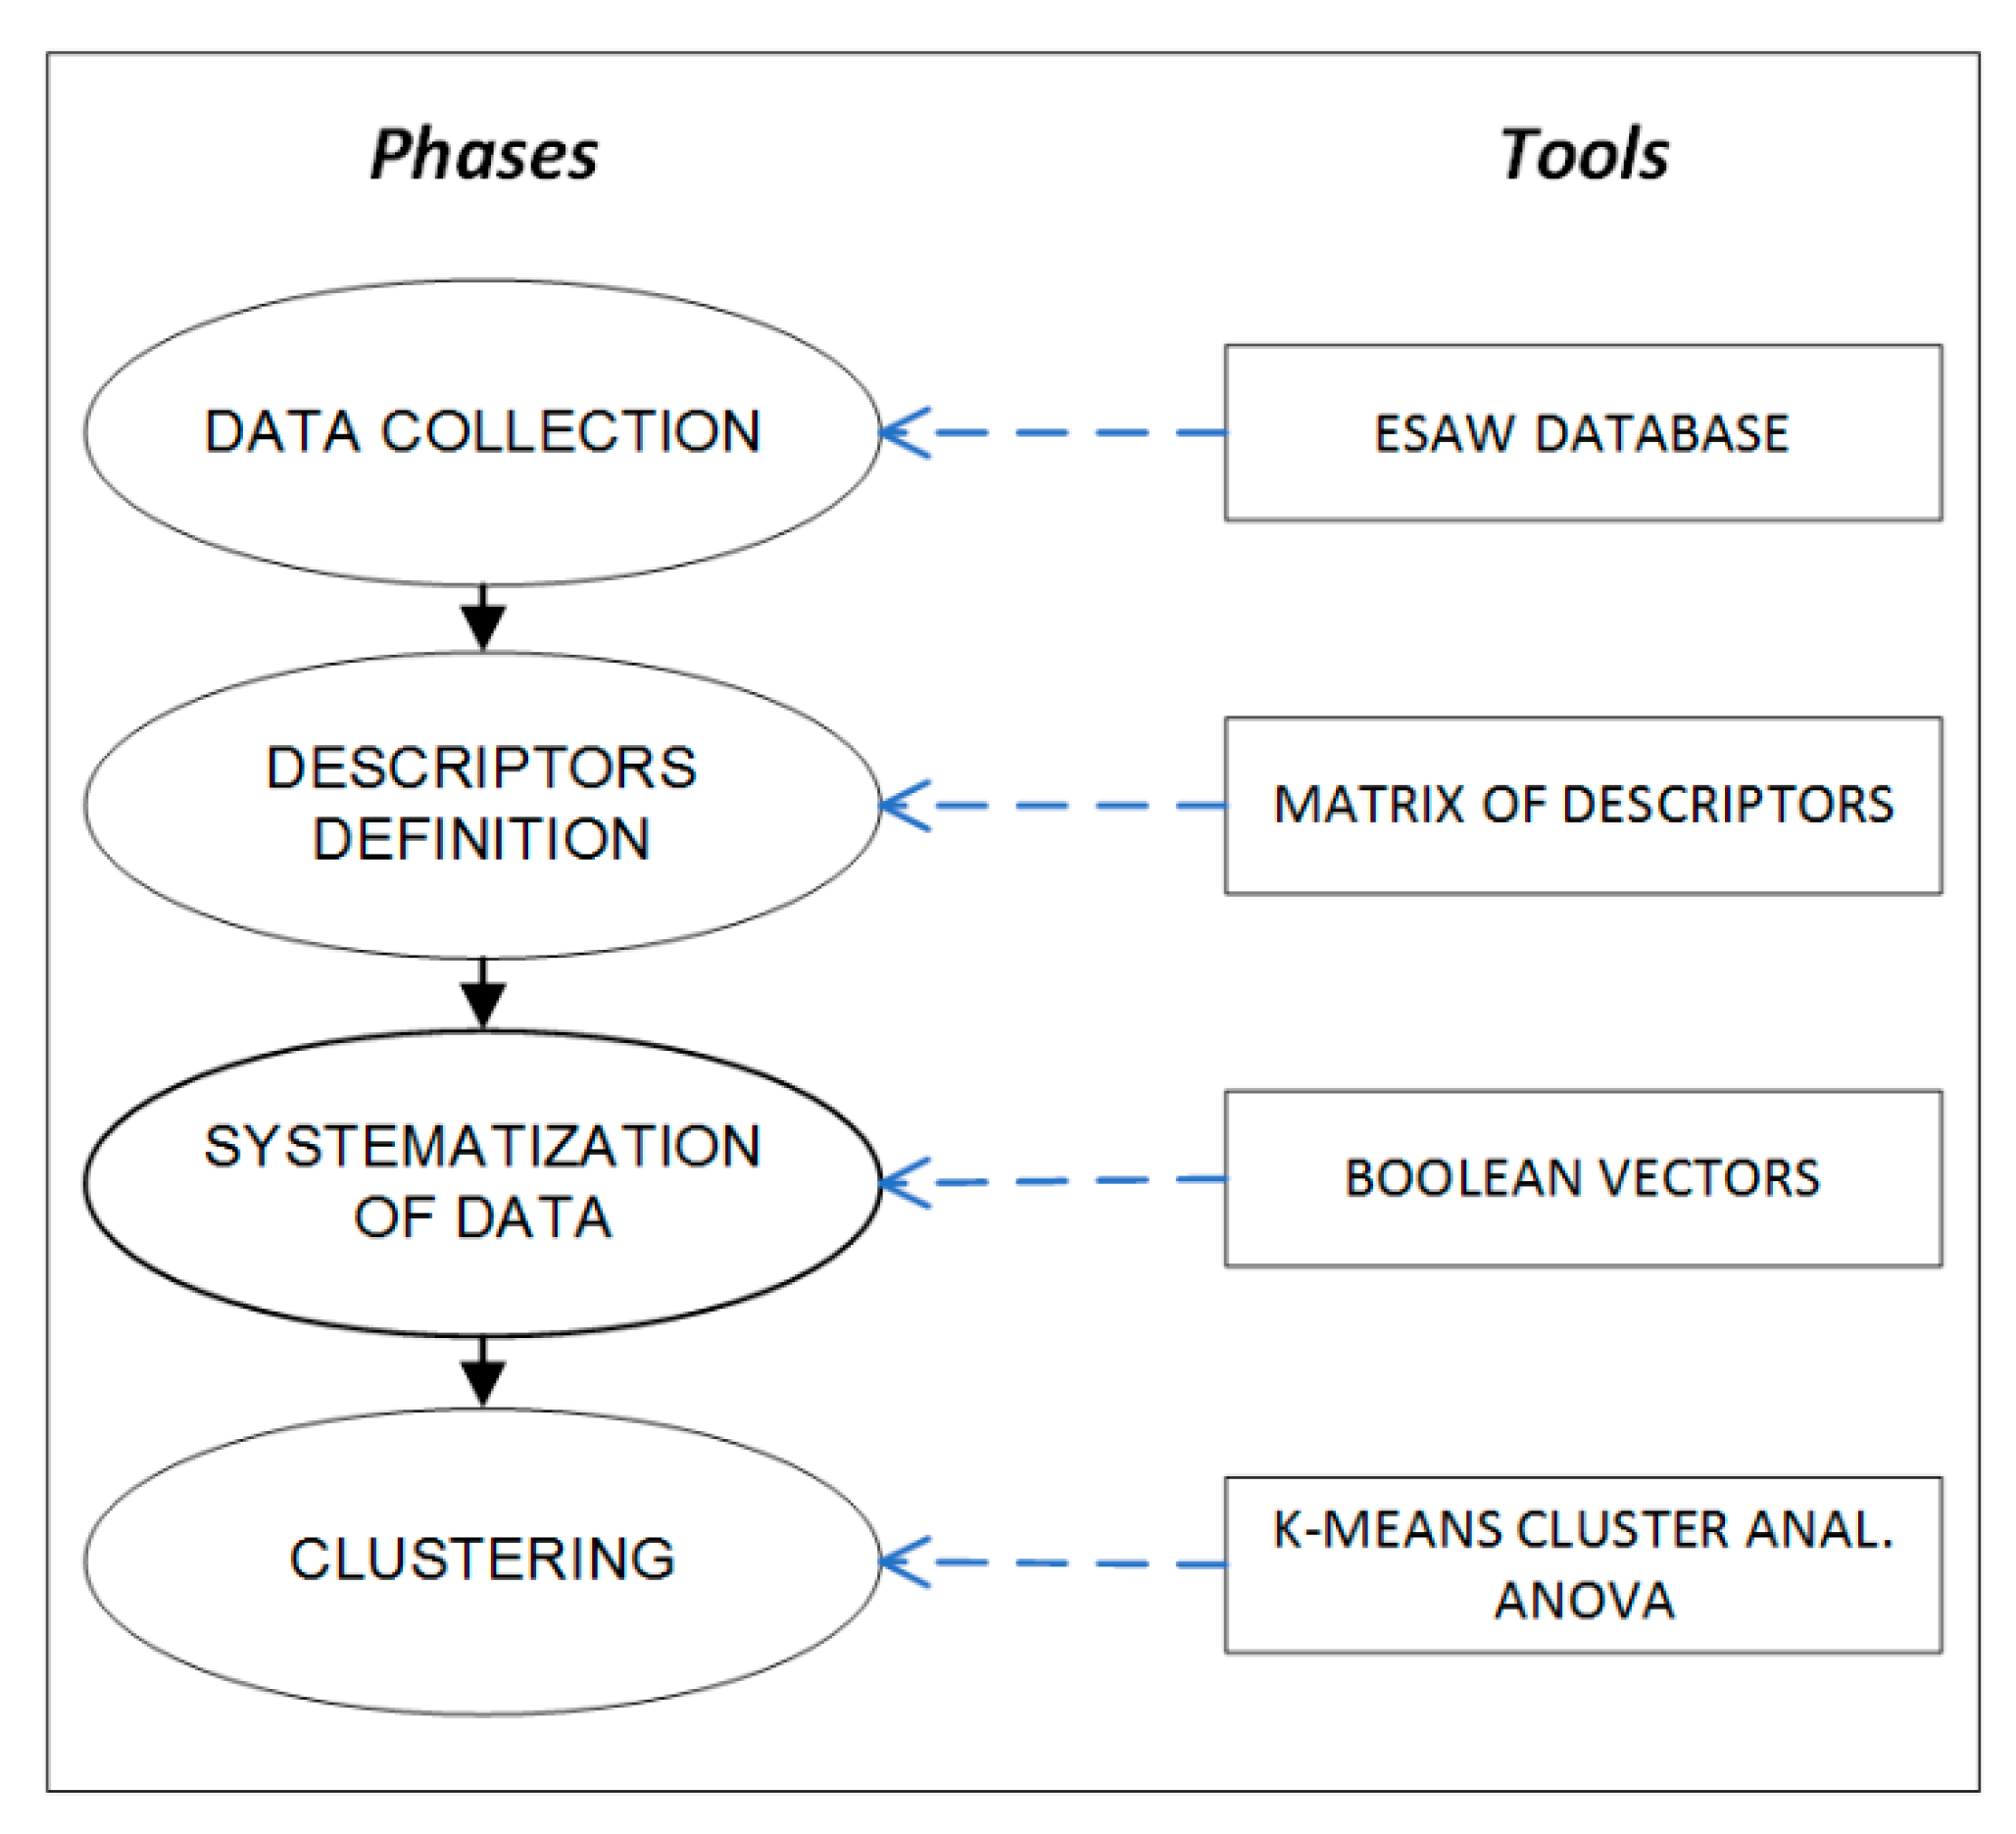
  • Data collection: data related to a specific type of accidents (e.g., accidents due to electric shock in the construction sector) are extracted from the Infor.MO database.
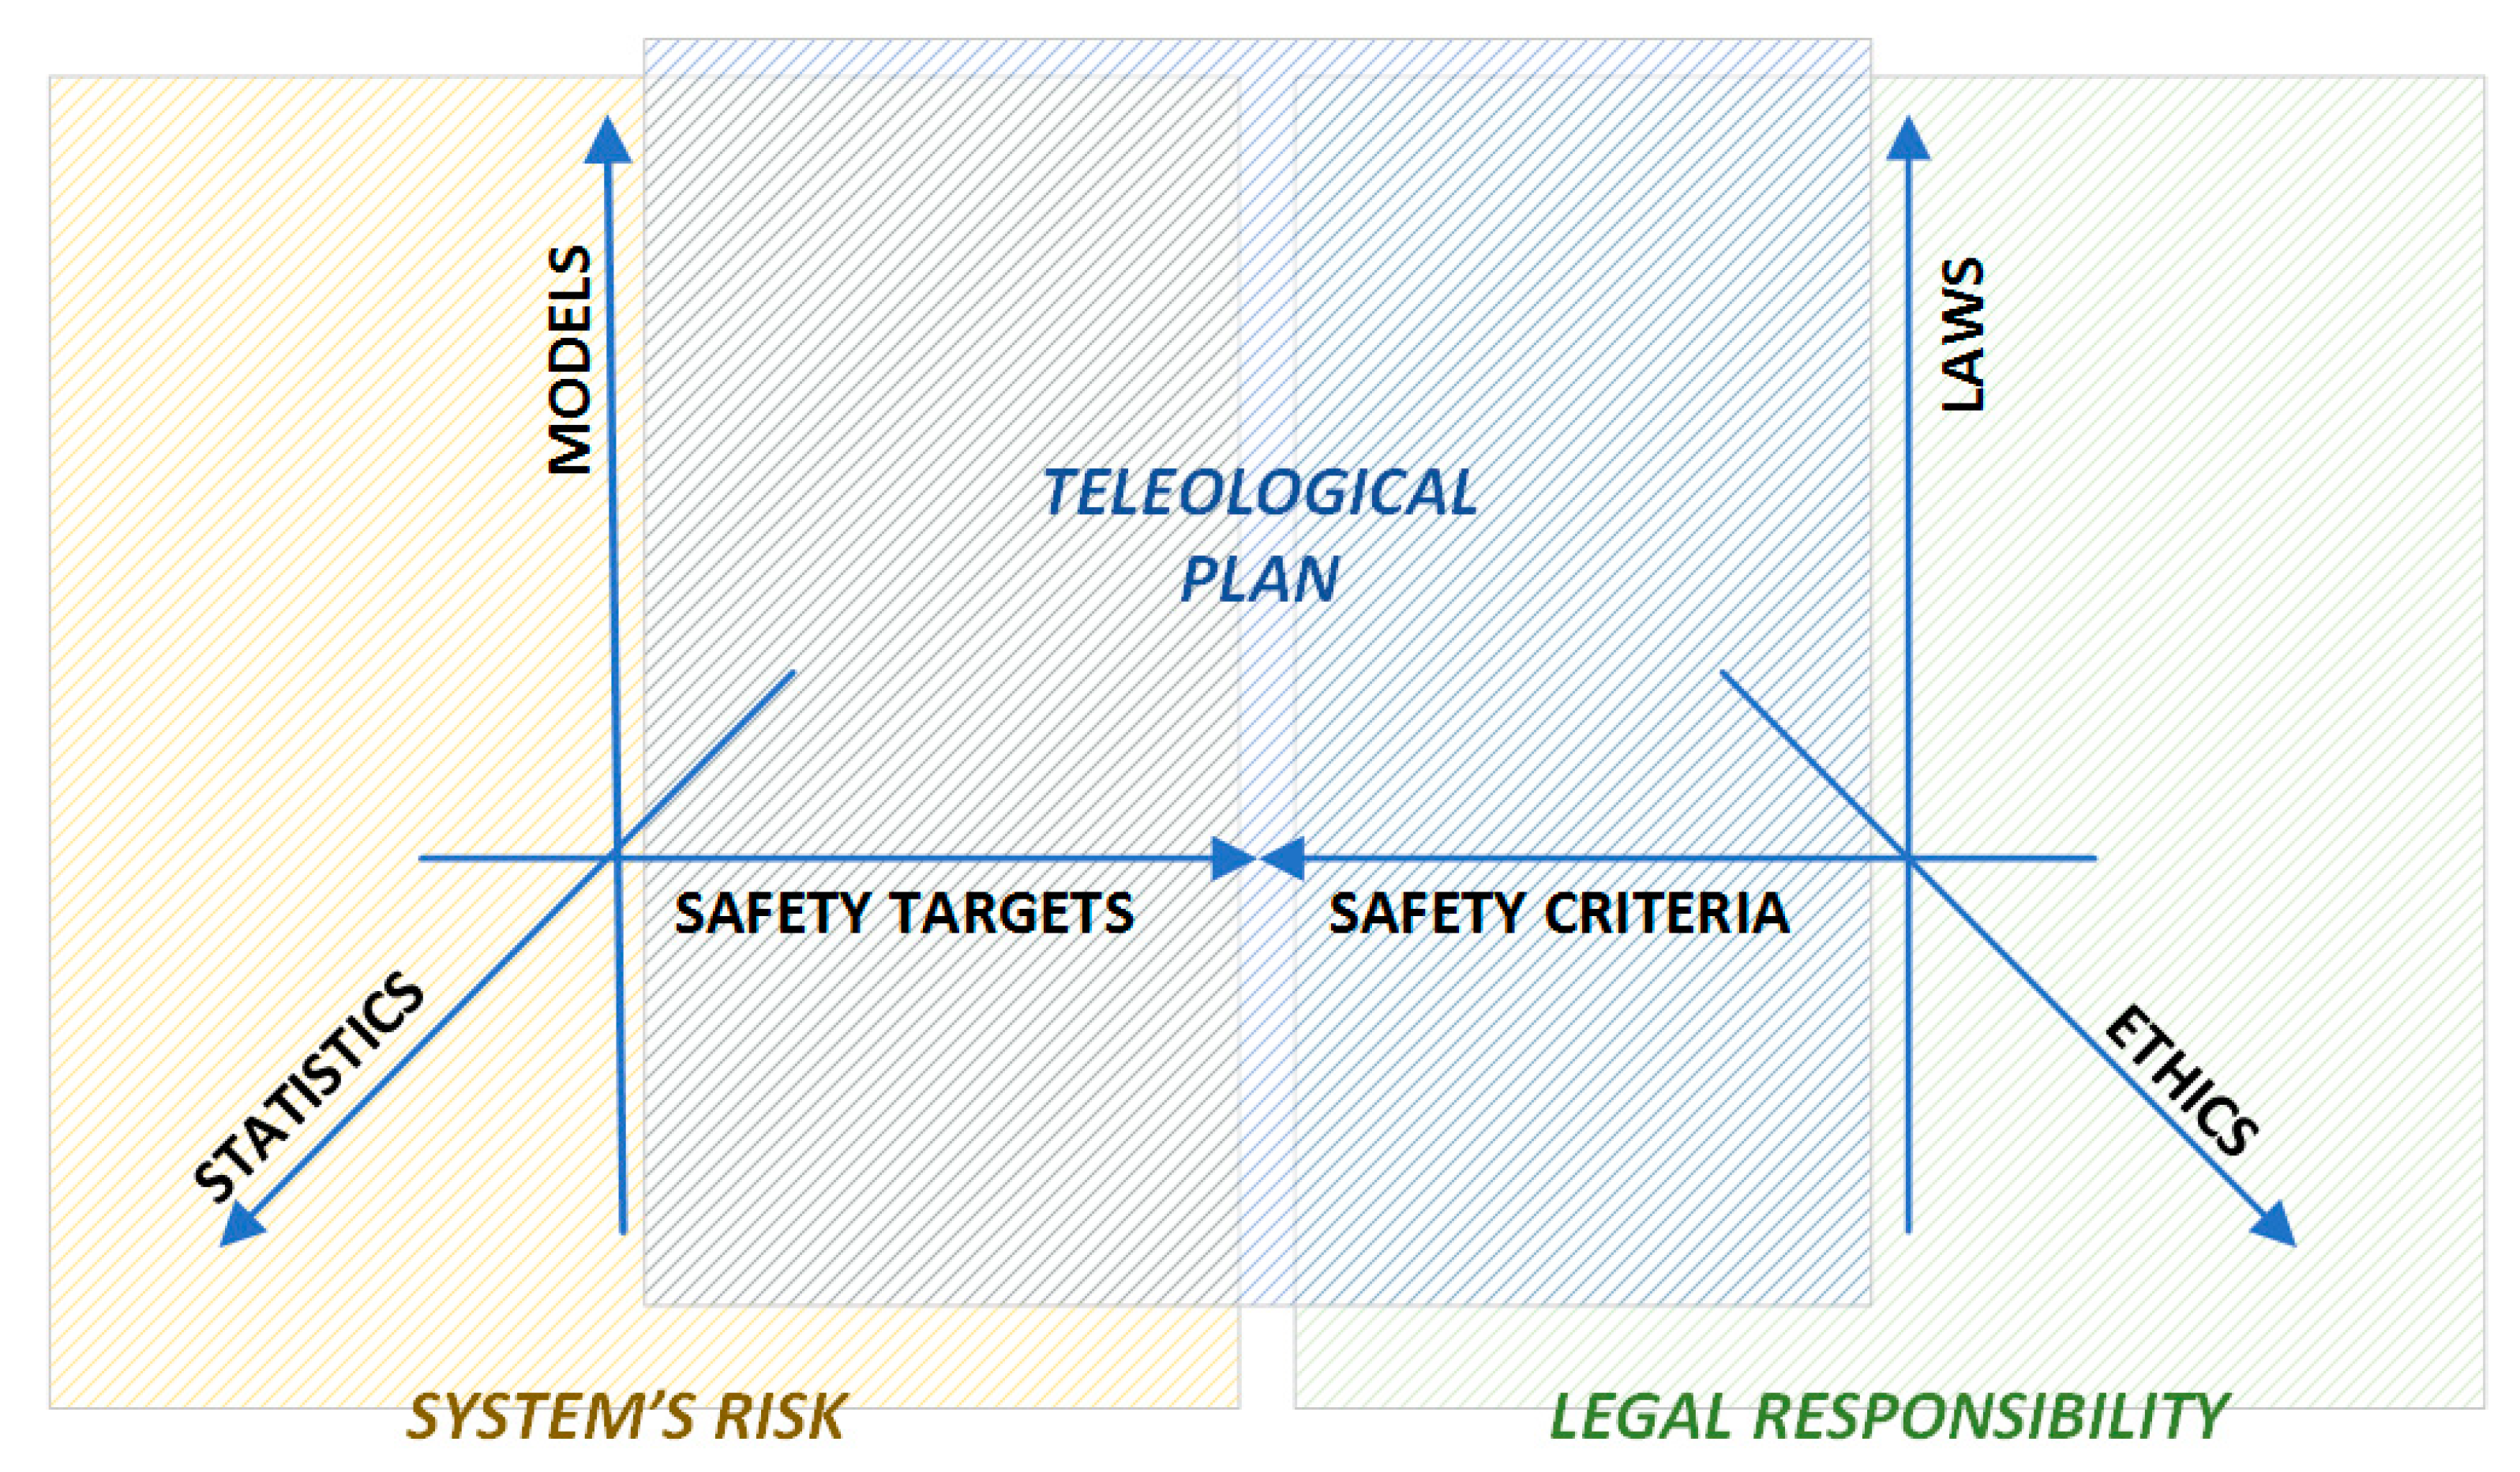
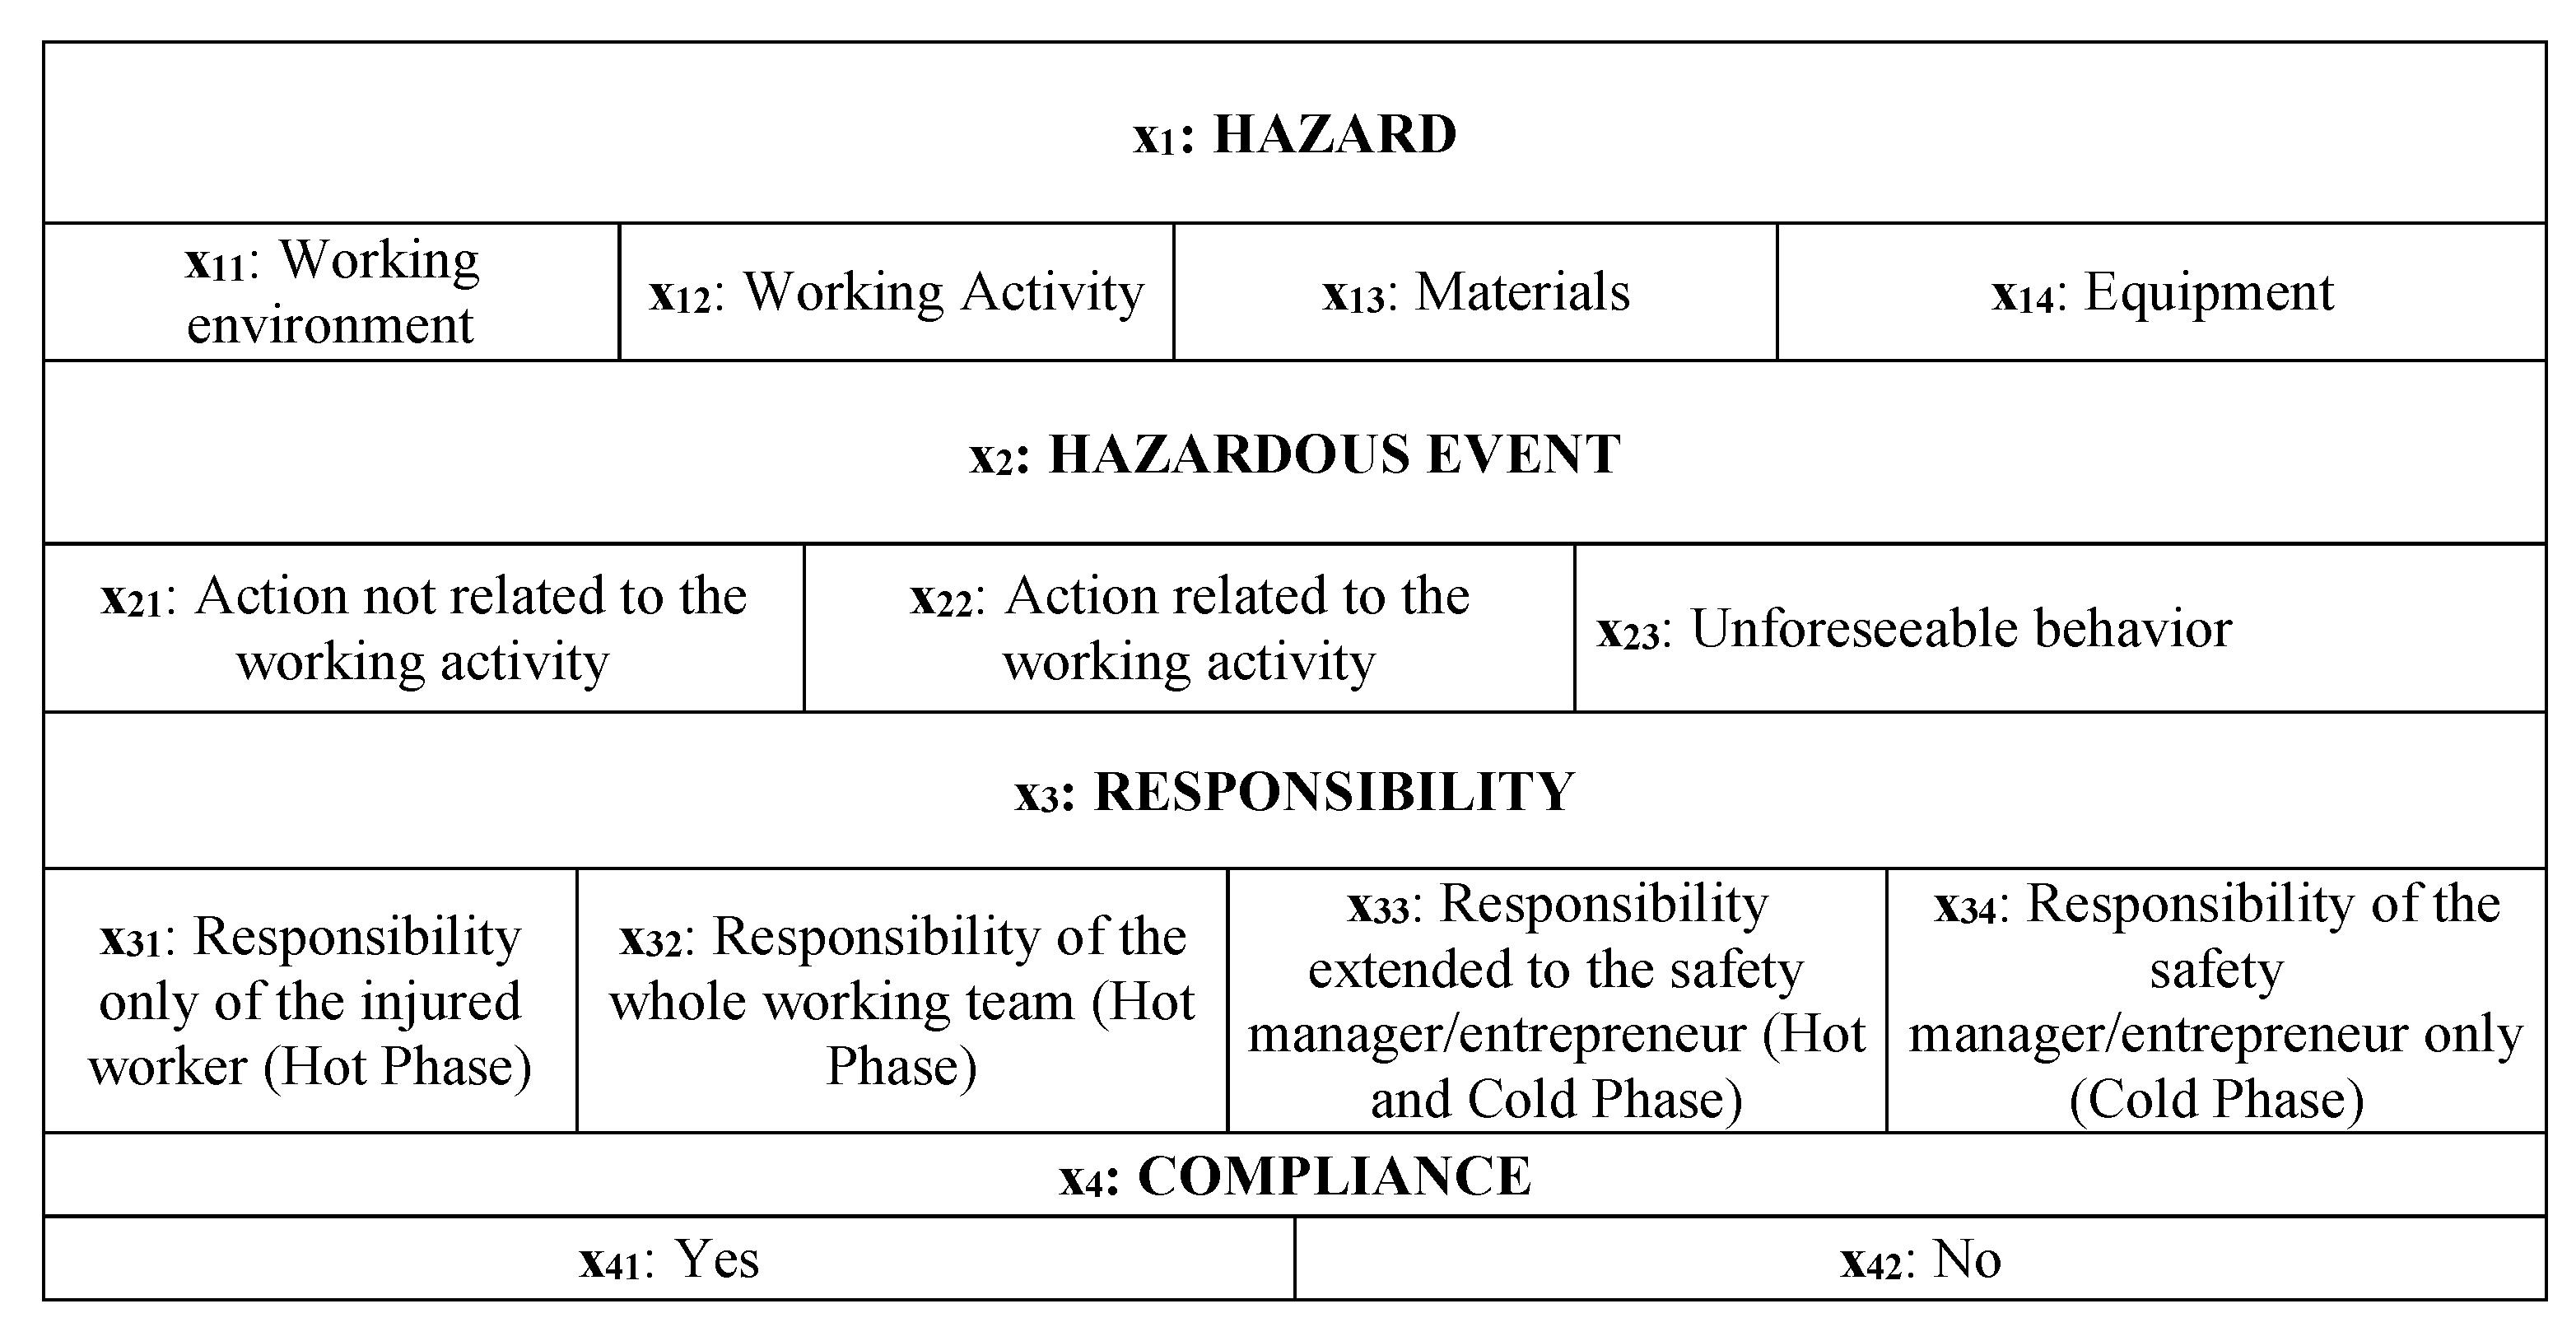
  • Identification of the descriptive variables of accidents: information provided in each accident report is analyzed in order to depict the sub-descriptors of the system, which are translated into the n variables into the related k types of the reference areas (i.e., the descriptors). In practice, the general scheme of such a classification consists in relating the four different types of descriptors (hazard, hazardous event, responsibility, and compliance) with the xi variables, where i = 1, … 4 (maximum number of areas of relevance) indicates the number of the descriptors, while j = 1, … m represents the number of the different sub-descriptors for each descriptor. The output of such a process consists in the definition of the “Matrix of Descriptors” (MoD) depicted in Figure 4, where each descriptor is composed by different sub-descriptors, representing the descriptive variables of the system that can be extracted from the ESAW accident reports. It has to be noted that in this way the logical disjunction of the xij variables is guaranteed. In total, 13 variables were identified (n = 13).
    The Matrix of Descriptors allows us to merge the characteristics of the epistemic-mnesic and ethical-axiological spaces of the cindynic approach, representing a tool aimed at “filtering” accidents data in order to elicit their main features in terms of safety targets and safety criteria. Accordingly, the selection of descriptors and sub-descriptors was made taking into account both the system′s risk features and legal responsibilities issues related to an accident, consistently with the variables suggested by the ESAW system and the ILO guidelines [70].
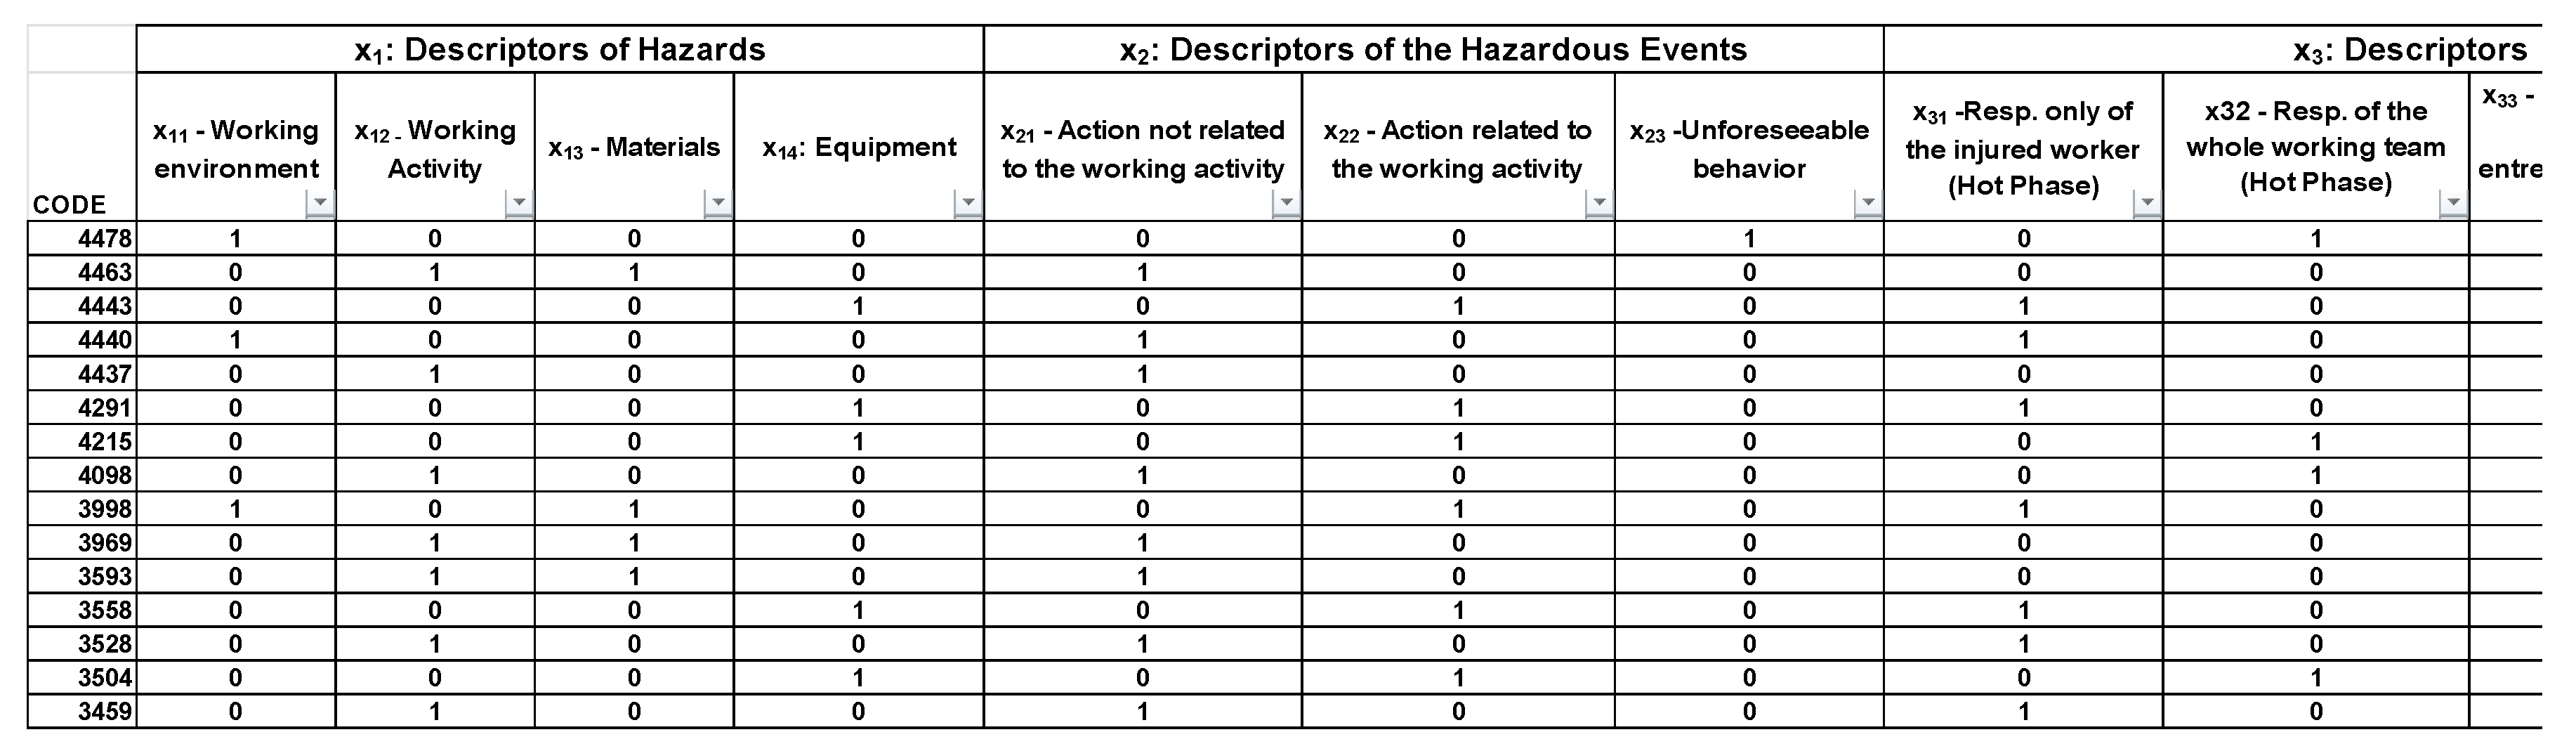
  • Systematization of data extracted from the accidents database by means of Boolean coordinates: categorical information is translated into dichotomous variables. In other words, the xij variables that describe an accident are translated into an algebraic vector by means of the Boolean n-tuple of coordinates in the space Rn. For this purpose the MoD is used, filling it with Boolean values (i.e., “0” when the accident is not affected by a certain variable; or “1” when the accident is affected by a certain variable). In Figure 5 an example of the MoD application is shown (the code number used is the one reported in the Infor.MO database).
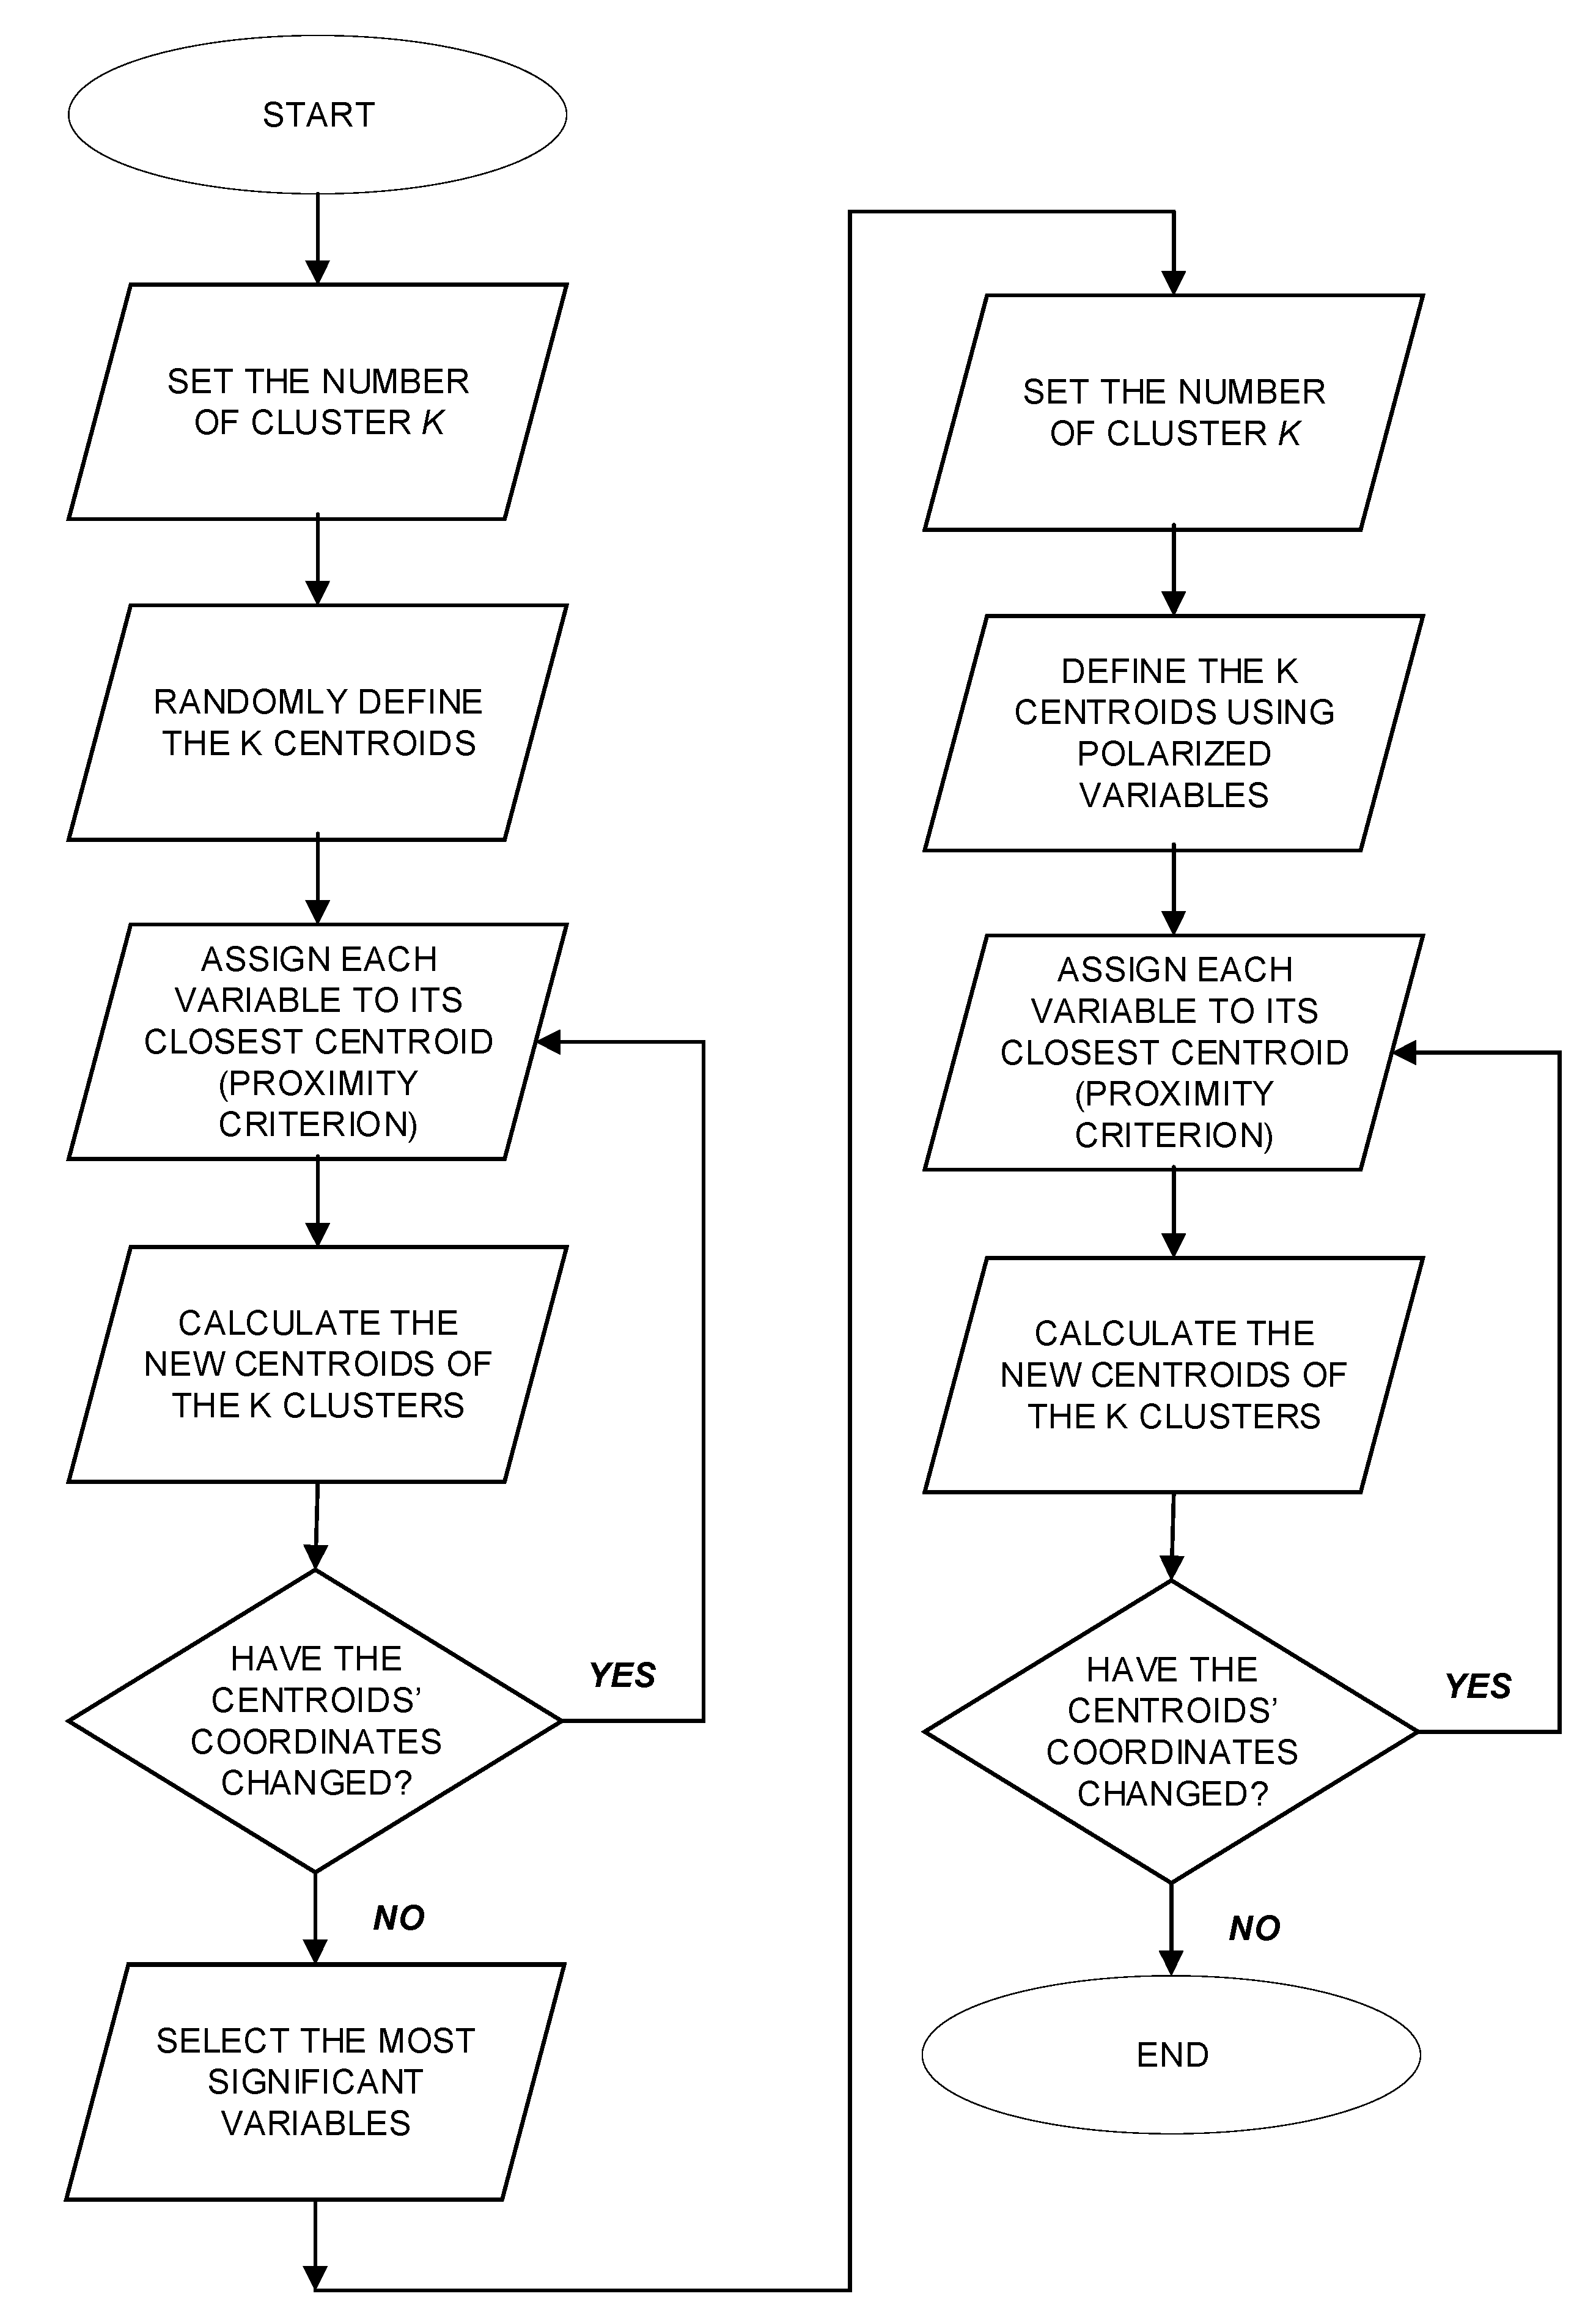
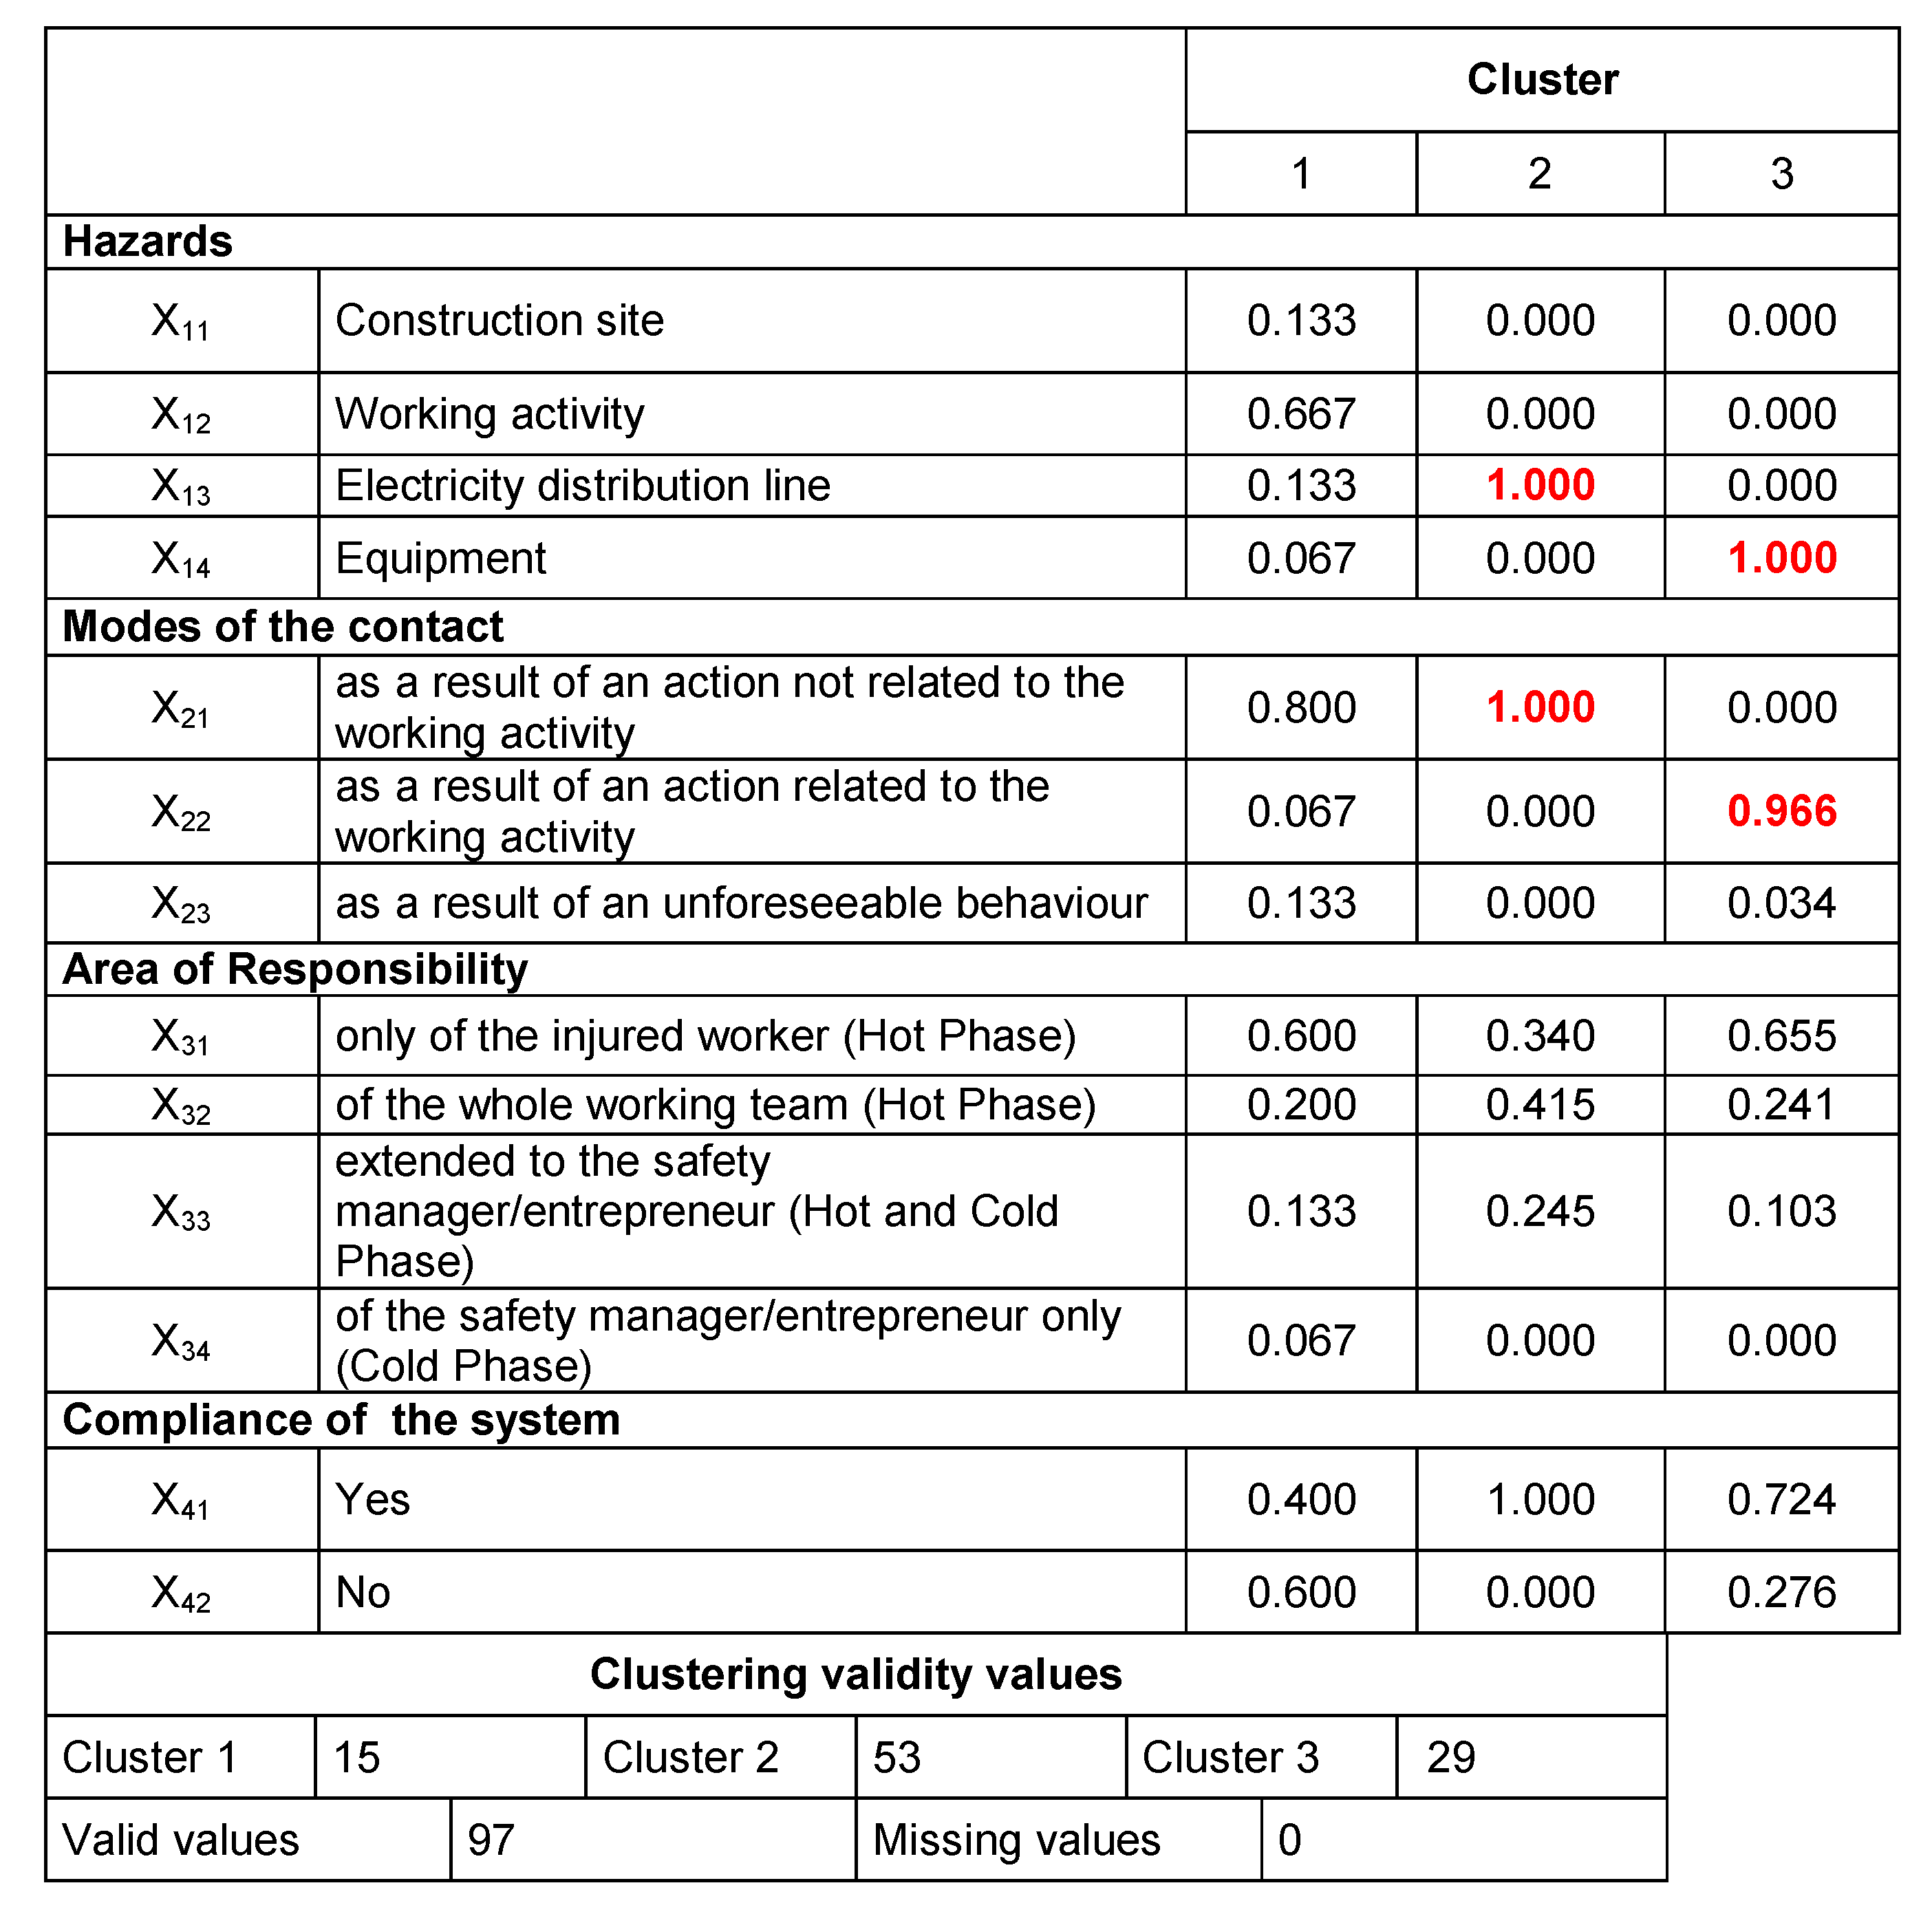
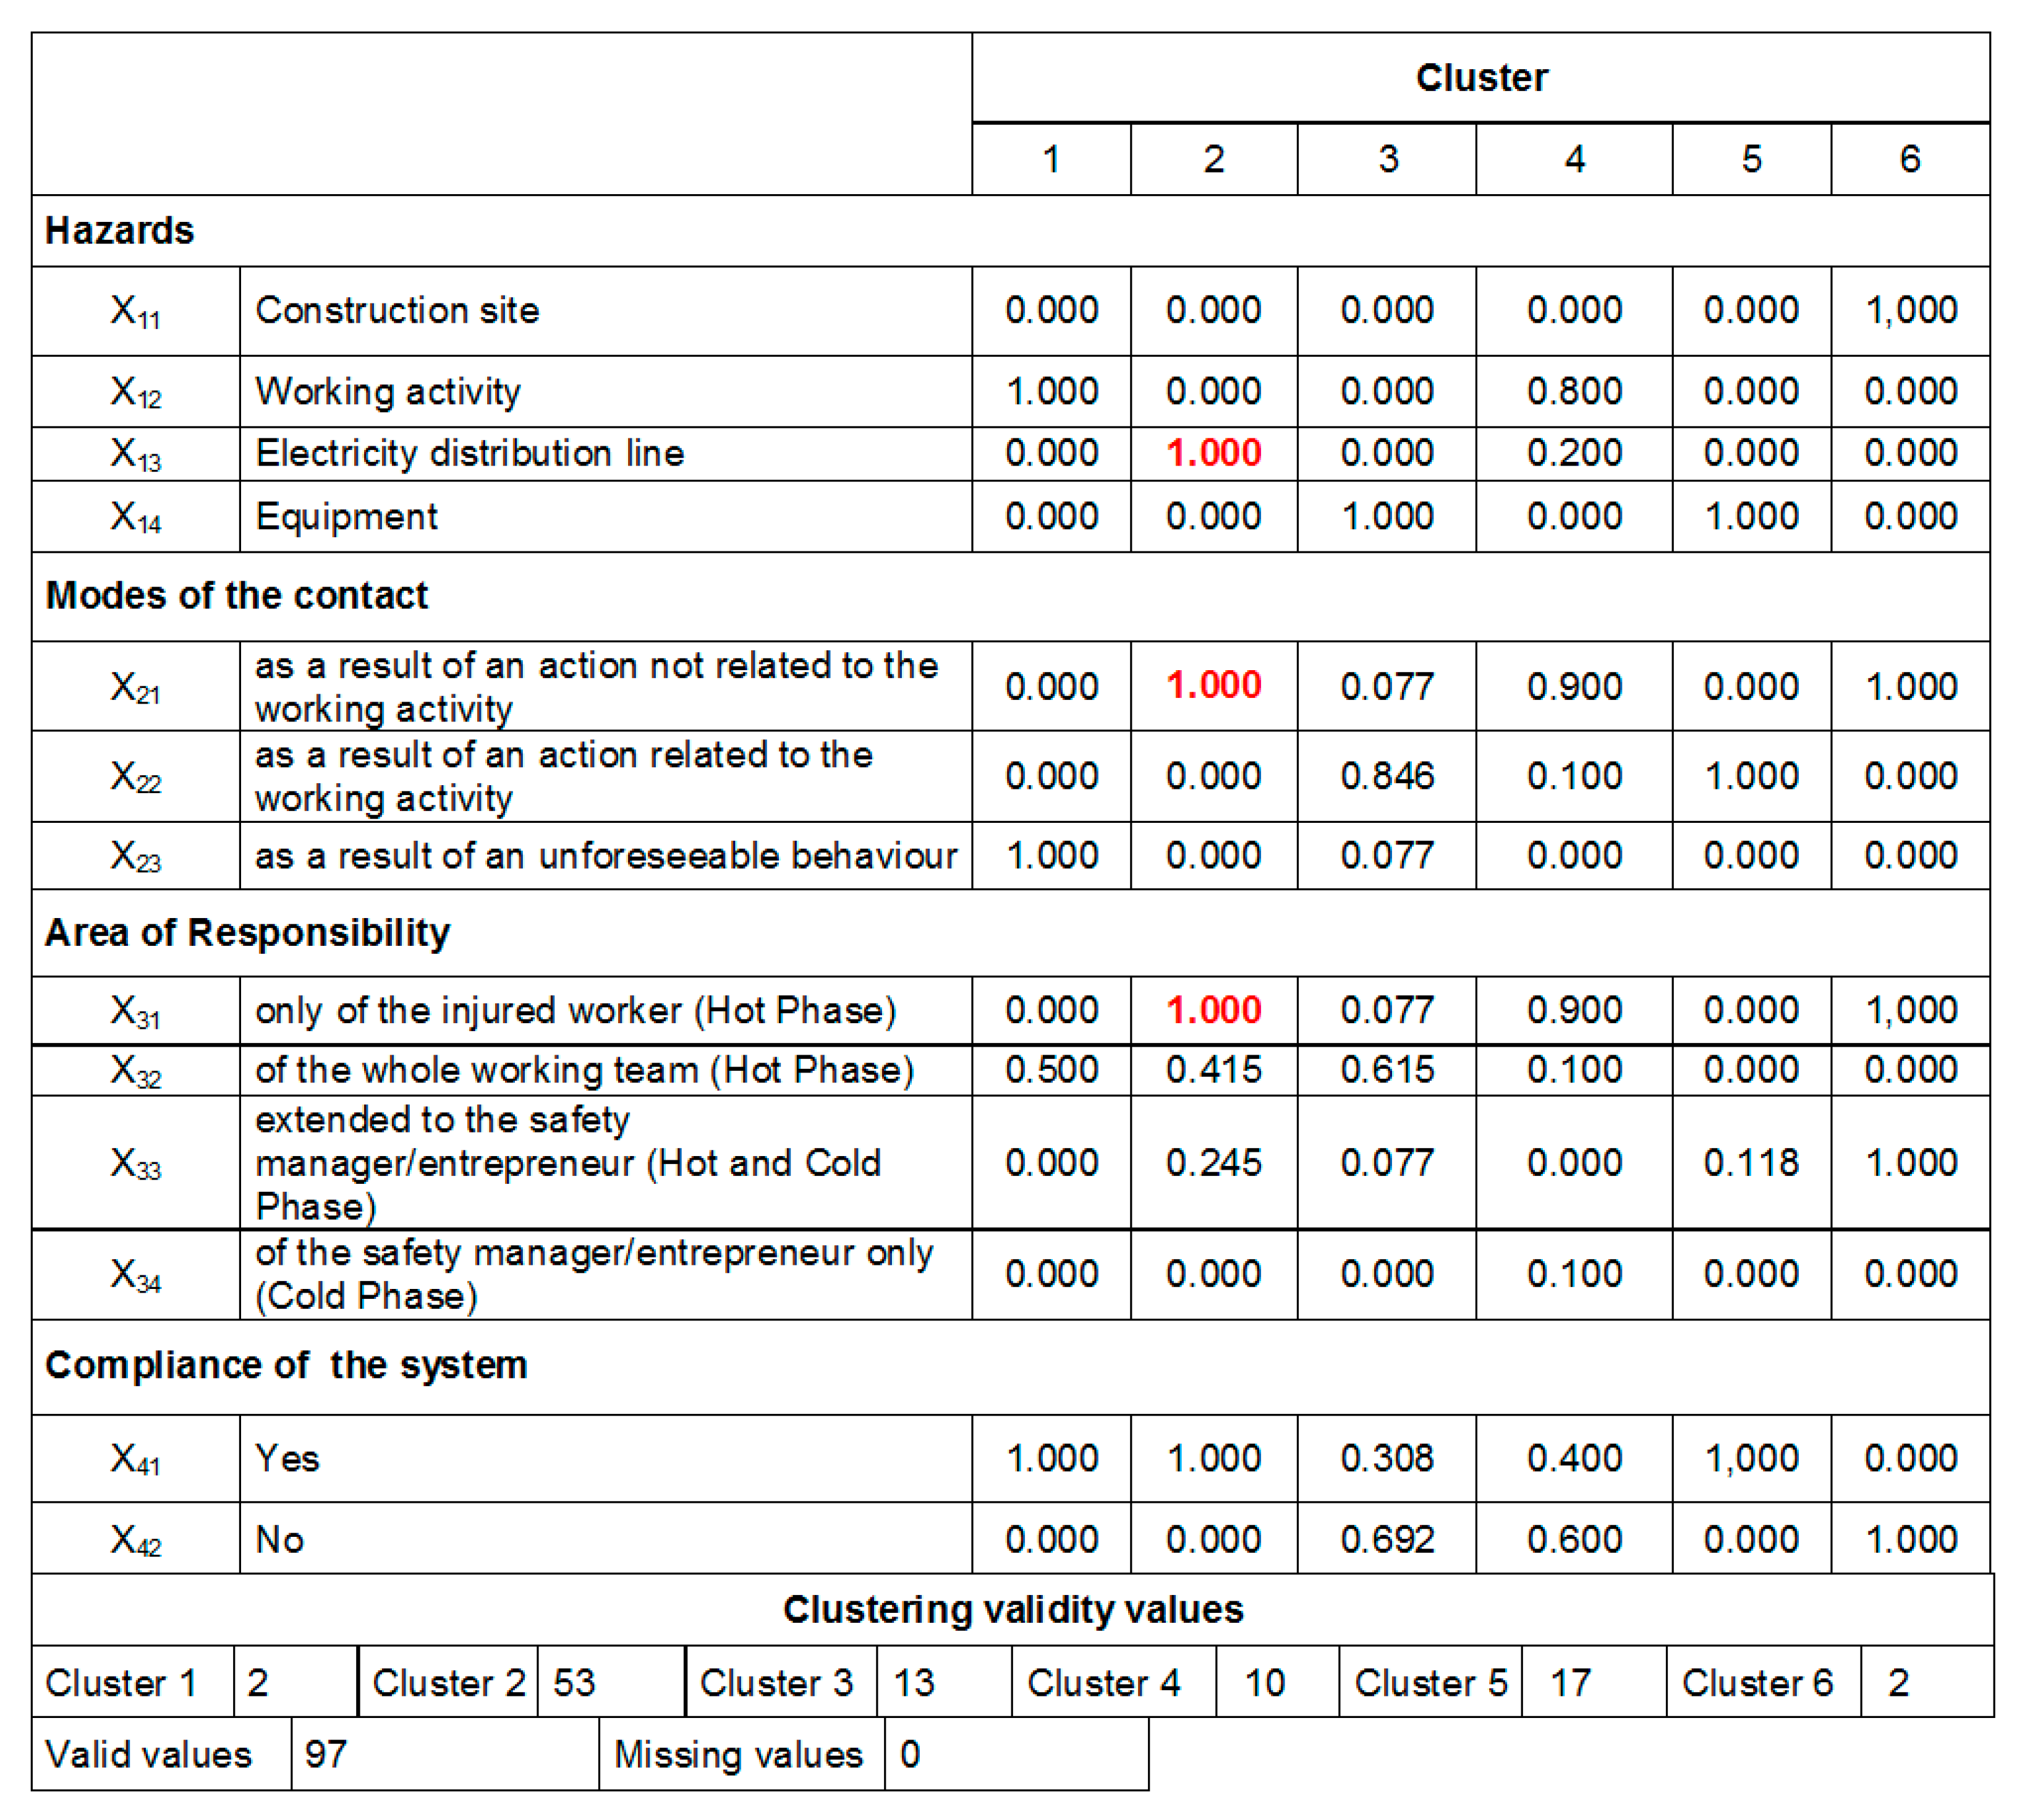
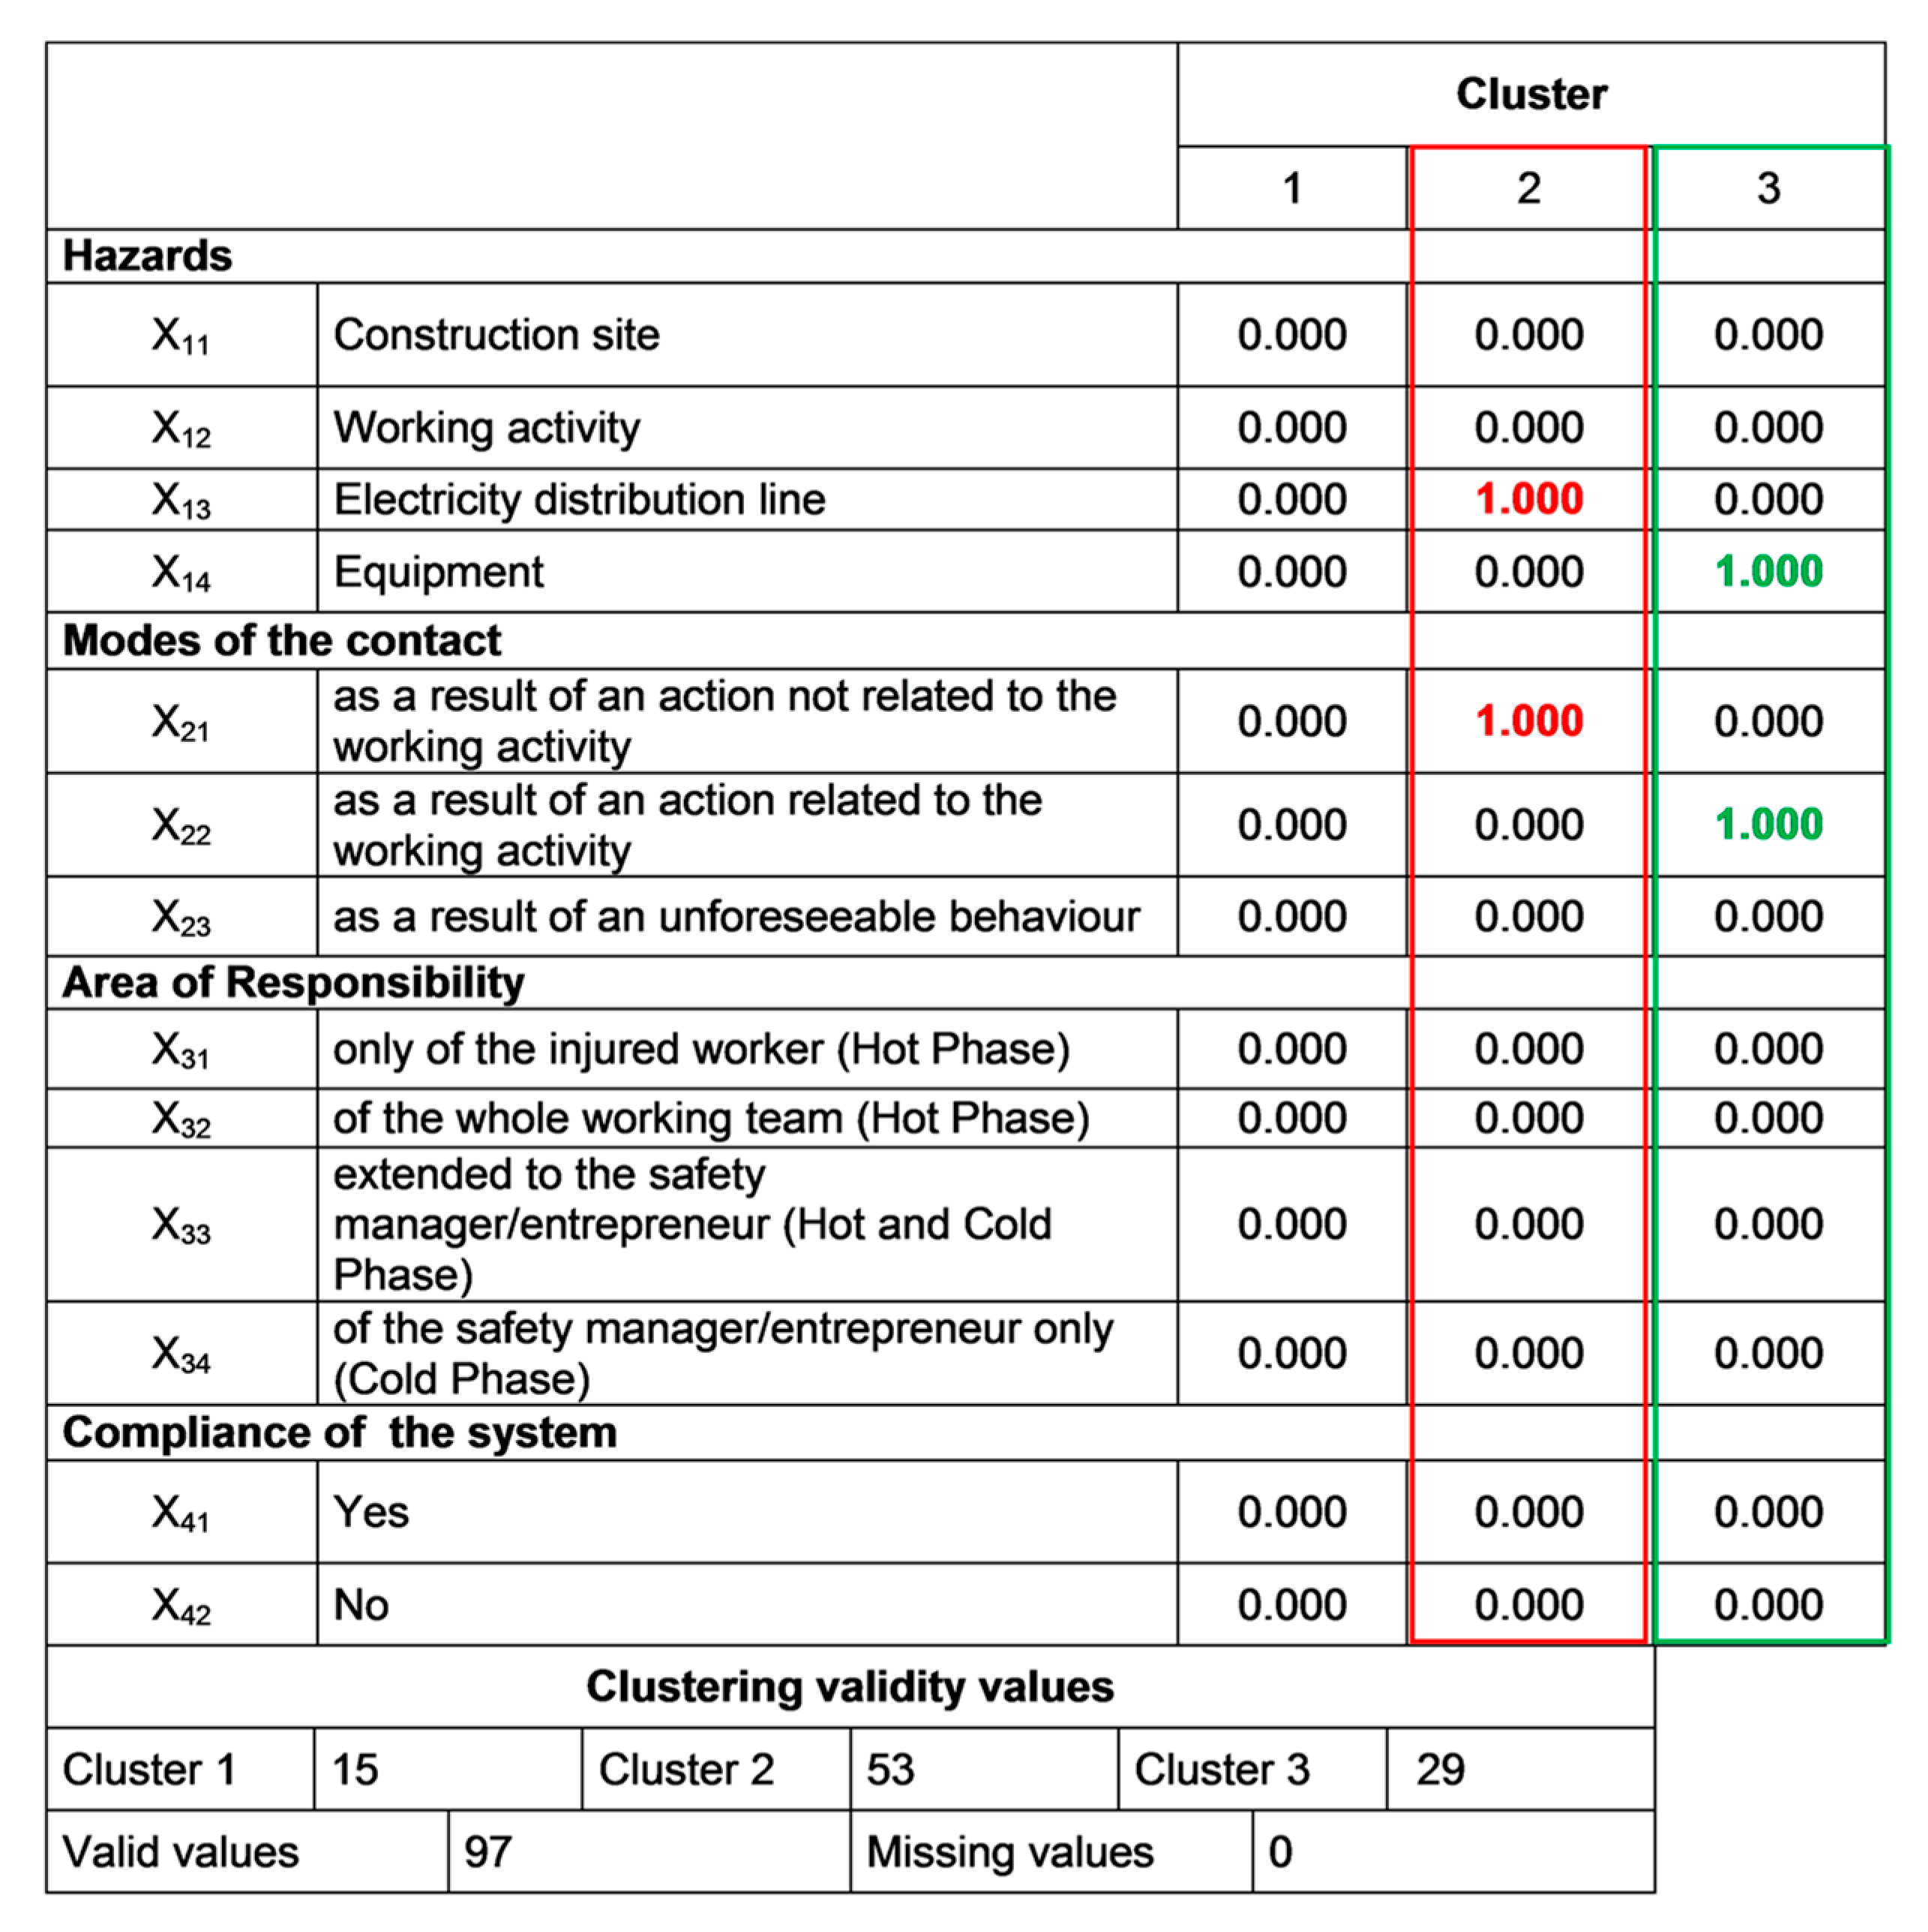
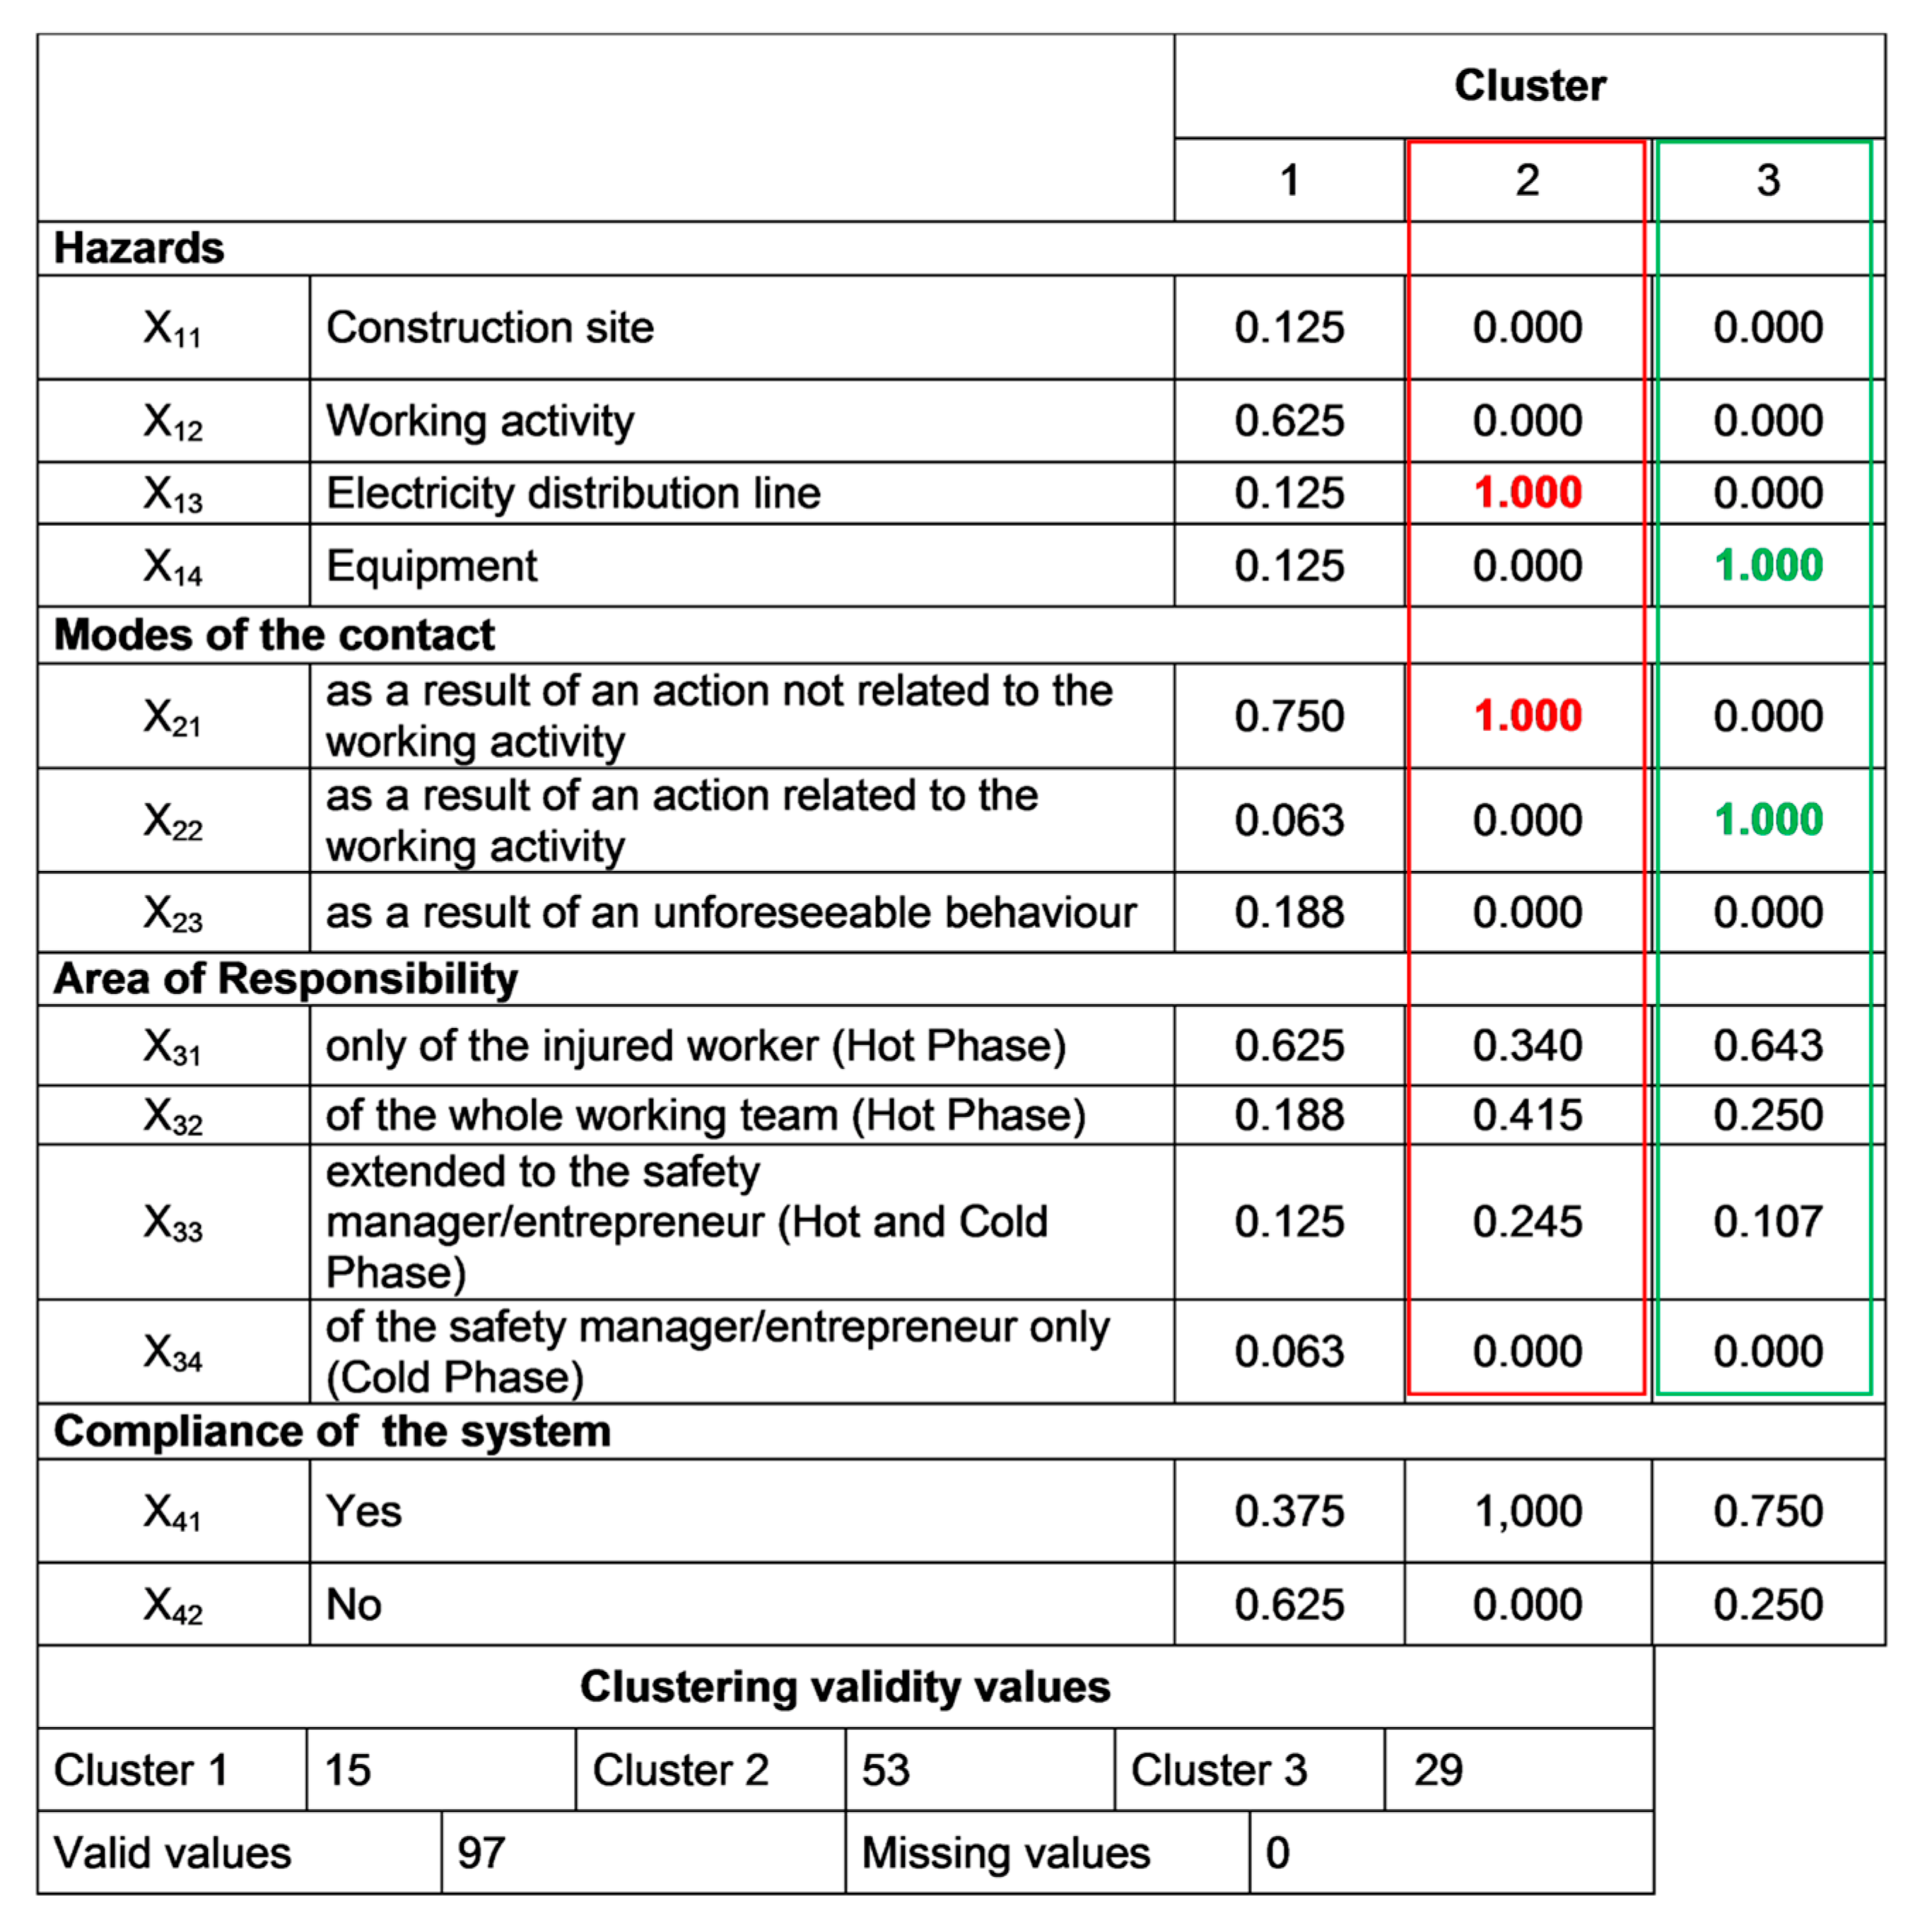
  • Cluster analysis application aimed at identifying homogenous groups of accident cases based on the xij variables systematized in the previous phase. In other words, the set of observations is represented by the algebraic vectors defined above (corresponding to the n variables) with the goal of partitioning them into k (≤ n) sets (i.e., the clusters), where the algebraic vectors are assigned to a specific cluster following the criterion of “proximity” to the initial centroid. Based on this, in our context the use of the k-means clustering approach [59,60] is foreseen twice (Figure 6): the first time the application is aimed at defining the most relevant variables characterizing the type of accidents analyzed (which we called “polarized” variables), while the second application is focused on verifying the significance of this output, refining the mutual relationships among the variables to better understand the accident scenario. More in detail, the first series of iterations is carried without assigning the centroids in advance: the coordinates of centroids are randomly assigned by the software (in this study the IBM SPSS® version 5.0 software (Armonk, NY, USA) [71] was used). The results obtained allows the definition of most relevant cluster solutions and the related coordinates of the centroids. These coordinates are used for further iterations, which end when the new centroids′ coordinates do not change [53]. The validation of the results is carried out by means of the Analysis of Variance (ANOVA) test [72]. The result of this first clustering process consists in the individuation of the most relevant variables, i.e., those representing the most impacting accidents′ determinants (the “polarized” variables). Afterwards, as illustrated in Figure 6, the whole procedure is repeated using these “polarized” variables as the input coordinates of initial k centroids. For this purpose, a new transformation into dichotomous variables (the value “1” is assigned to the “polarized” variables, while “0” is assigned to the other variables) was carried out to initialize the second clustering process.
Such an approach allows us both to verify the relevance of the selected variables, as well as to better evaluate the relationships among the different variables and how they interact with one another in influencing the occurrence of an accident (e.g., which is the most probable combination of determinants leading to an accident). It has to be noted that to select the maximum number z of clusters to analyze, in this study the criterion z = n / 2 is used and then the obtained clusters are evaluated comparing the number of cases in each cluster [73].

3. Case Study

The proposed methodology was used to investigate the accidents due to electric shock in the construction sector, which occurred in Italy in the period 2002–2015. As mentioned earlier, the construction industry has been recognized as one of the most dangerous activities worldwide and the accidents involving electricity are of major concern especially in large construction sites [74,75,76]. Actually, the presence of workers belonging to different sub-contractors simultaneously, as well as the fact that most of them are not specifically trained and equipped against direct or indirect contacts with electrical parts make the occurrence of this type of accident in the construction industry higher than in the other sectors [77]. In Italy, analyzing data extracted from the Infor.MO database, the construction industry results in being the most affected sector by this type of accidents (Figure 7).
Based on the above considerations, the factors determining electrical accidents in construction sites are multiple and interwoven with one another. Therefore, filtering accidents data by means of their descriptors can shed light on these relationships, augmenting knowledge on their occurrence modes. Accordingly, following the procedure described in the previous section, the first step of the analysis consisted in collecting data related to electrical injury that occurred in the period 2002–2015 in the construction sector. A sample of 116 fatal accidents was extracted and analyzed to depict the characteristics of descriptors and sub-descriptors of each one of them. The results of this first analysis brought to light three main categories of accidents that can be elicited from the database:
A. The accidents occurred during generic activities, i.e., works where the use of specific personal protective equipment (PPE) against electric shock is not required. The injuries are due to the contact with high or medium voltage power lines.
B. The accidents occurred during maintenance activity of electrical equipment or devices. In these cases, the operator is usually skilled and trained for operating with electrical parts. Moreover, the use of specific PPE is foreseen.
C. The accidents occurred when dealing with machinery, equipment or devices that are not in compliance with mandatory safety requirements. In this case, the responsibility of the safety manager/entrepreneur in the “cold phase” is recognized.
Moreover, it has to be noted that in the area of hazards, the variable x11 related to “working environment” refers to the “construction site”, while the variable x13 related to “materials” was explicated as “electricity distribution line”. Similarly, the area of the “Hazardous events” in this context refers to the “modes of contact” with the electricity line. The next step consisted in the systematization of data: as shown in the excerpt in Figure 8, for each case the accident′s variables were translated into an algebraic vector by means of Boolean coordinates. Among the 116 cases extracted from the database, 19 could not be used mainly due to the lack of some information. Consequently, 97 cases of fatal accidents were processed.
This transformation allowed us to apply the k-means cluster analysis through several iterations corroborated by ANOVA tests [72]. For this purpose, the IBM SPSS® software was used (Quick Cluster procedure of IBM SPSS Statistics) [71], through which the statistical analysis of variables was performed (Table 1), as well as the condition of diagnostic features of the 13 dichotomous variables was verified to initialize the clustering (the Lance and Williams “distances matrix” was used).
Then, a solution including 2 clusters without a centroid was selected in order to preliminarily screen the impact of the variables on the accidents′ determinants. In particular, the first cluster included the type A and B cases, while the second cluster contains data related to the type C cases. The output of this first iteration is shown in Figure 9 and Figure 10. In detail, in the former a comparison between the Euclidean distances from the centroid of the examined accidents is reported. More precisely, each point in the figure represents an accident case and the “x” axis represents the centroid axis.
In the latter figure (Figure 9), the comparison between the values of each variable of the two clusters is provided. The results of this analysis revealed that the two clusters are disjointed since they are polarized on different variables: as in Figure 9, cluster 1 is polarized on the variables x13 and x21 (values in green); cluster 2 is polarized on the variables x14 and x22 (values in red).
As explained in the previous section, to select the maximum number z of clusters to analyze, in this study the criterion z = n / 2 was used [73]: i.e., since n = 97, the optimal number of clusters is 6 (z < 7). The results of the iterations related to the 3-clusters solutions are summarized in Figure 11 (showing the Euclidean distances from the centroid axis) and Figure 12 (reporting the variables′ values, where the most significant values are underlined in red).
Similarly, in Figure 13 the output of the iterations related to the 6-clusters solutions is shown. These iterations revealed the relevance of cluster 2 (representing 53 cases), which resulted in being the same in both the latter solutions.
Afterwards, the obtained clusters were evaluated comparing the number of cases in each cluster [73]: in our case, a consistent number of cases was considered n > 10. Accordingly, with reference to the 6-clusters solution (Figure 13), cluster 1, 4 and 6 were considered not relevant.
Overall, reading through the numbers, the results obtained showed that most of accidents present the following characteristics: the contacts happened circumstantially, due to the interference between the working equipment/machinery used by the worker and the electric line (variables x13 and x14), both when carrying out an action not related to the specific working activity (variable x21) and when this action is related to the specific task of the worker (variable x22). These results were used as input for the second application of the k-means cluster analysis using the above-mentioned variables as “polarized” variables.
Due to space limitations only the results concerning the 3-clusters solution are shown. Additional data related to the other iterations can be provided upon request to the authors. In detail, in Figure 14 the 3-clusters matrix used for the centroids′ setting is shown, while the final results of the 3-clusters solution are reported in Figure 15.
Consistently with the output of the preliminary iterations, the final results shed light on the most influencing variables on the dynamics of the accidents: namely, x13 and x21 for cluster 2 (values in red); x14 and x22 for cluster 3 (values in green). Thus, with regard to the accident determinants in the work place, the electricity distribution line and working equipment are the most important variables. Instead, actions related to the working activity (cluster 3) and those not related the working activity (cluster 2) represent the mode of contact in the two risk profiles.

4. Discussion

4.1. Case Study Results

The results of data aggregation brought to light two main clusters (recurring patterns) both in 6- and 3-clusters iterations that consequently were considered consistent and representative of the phenomenon:
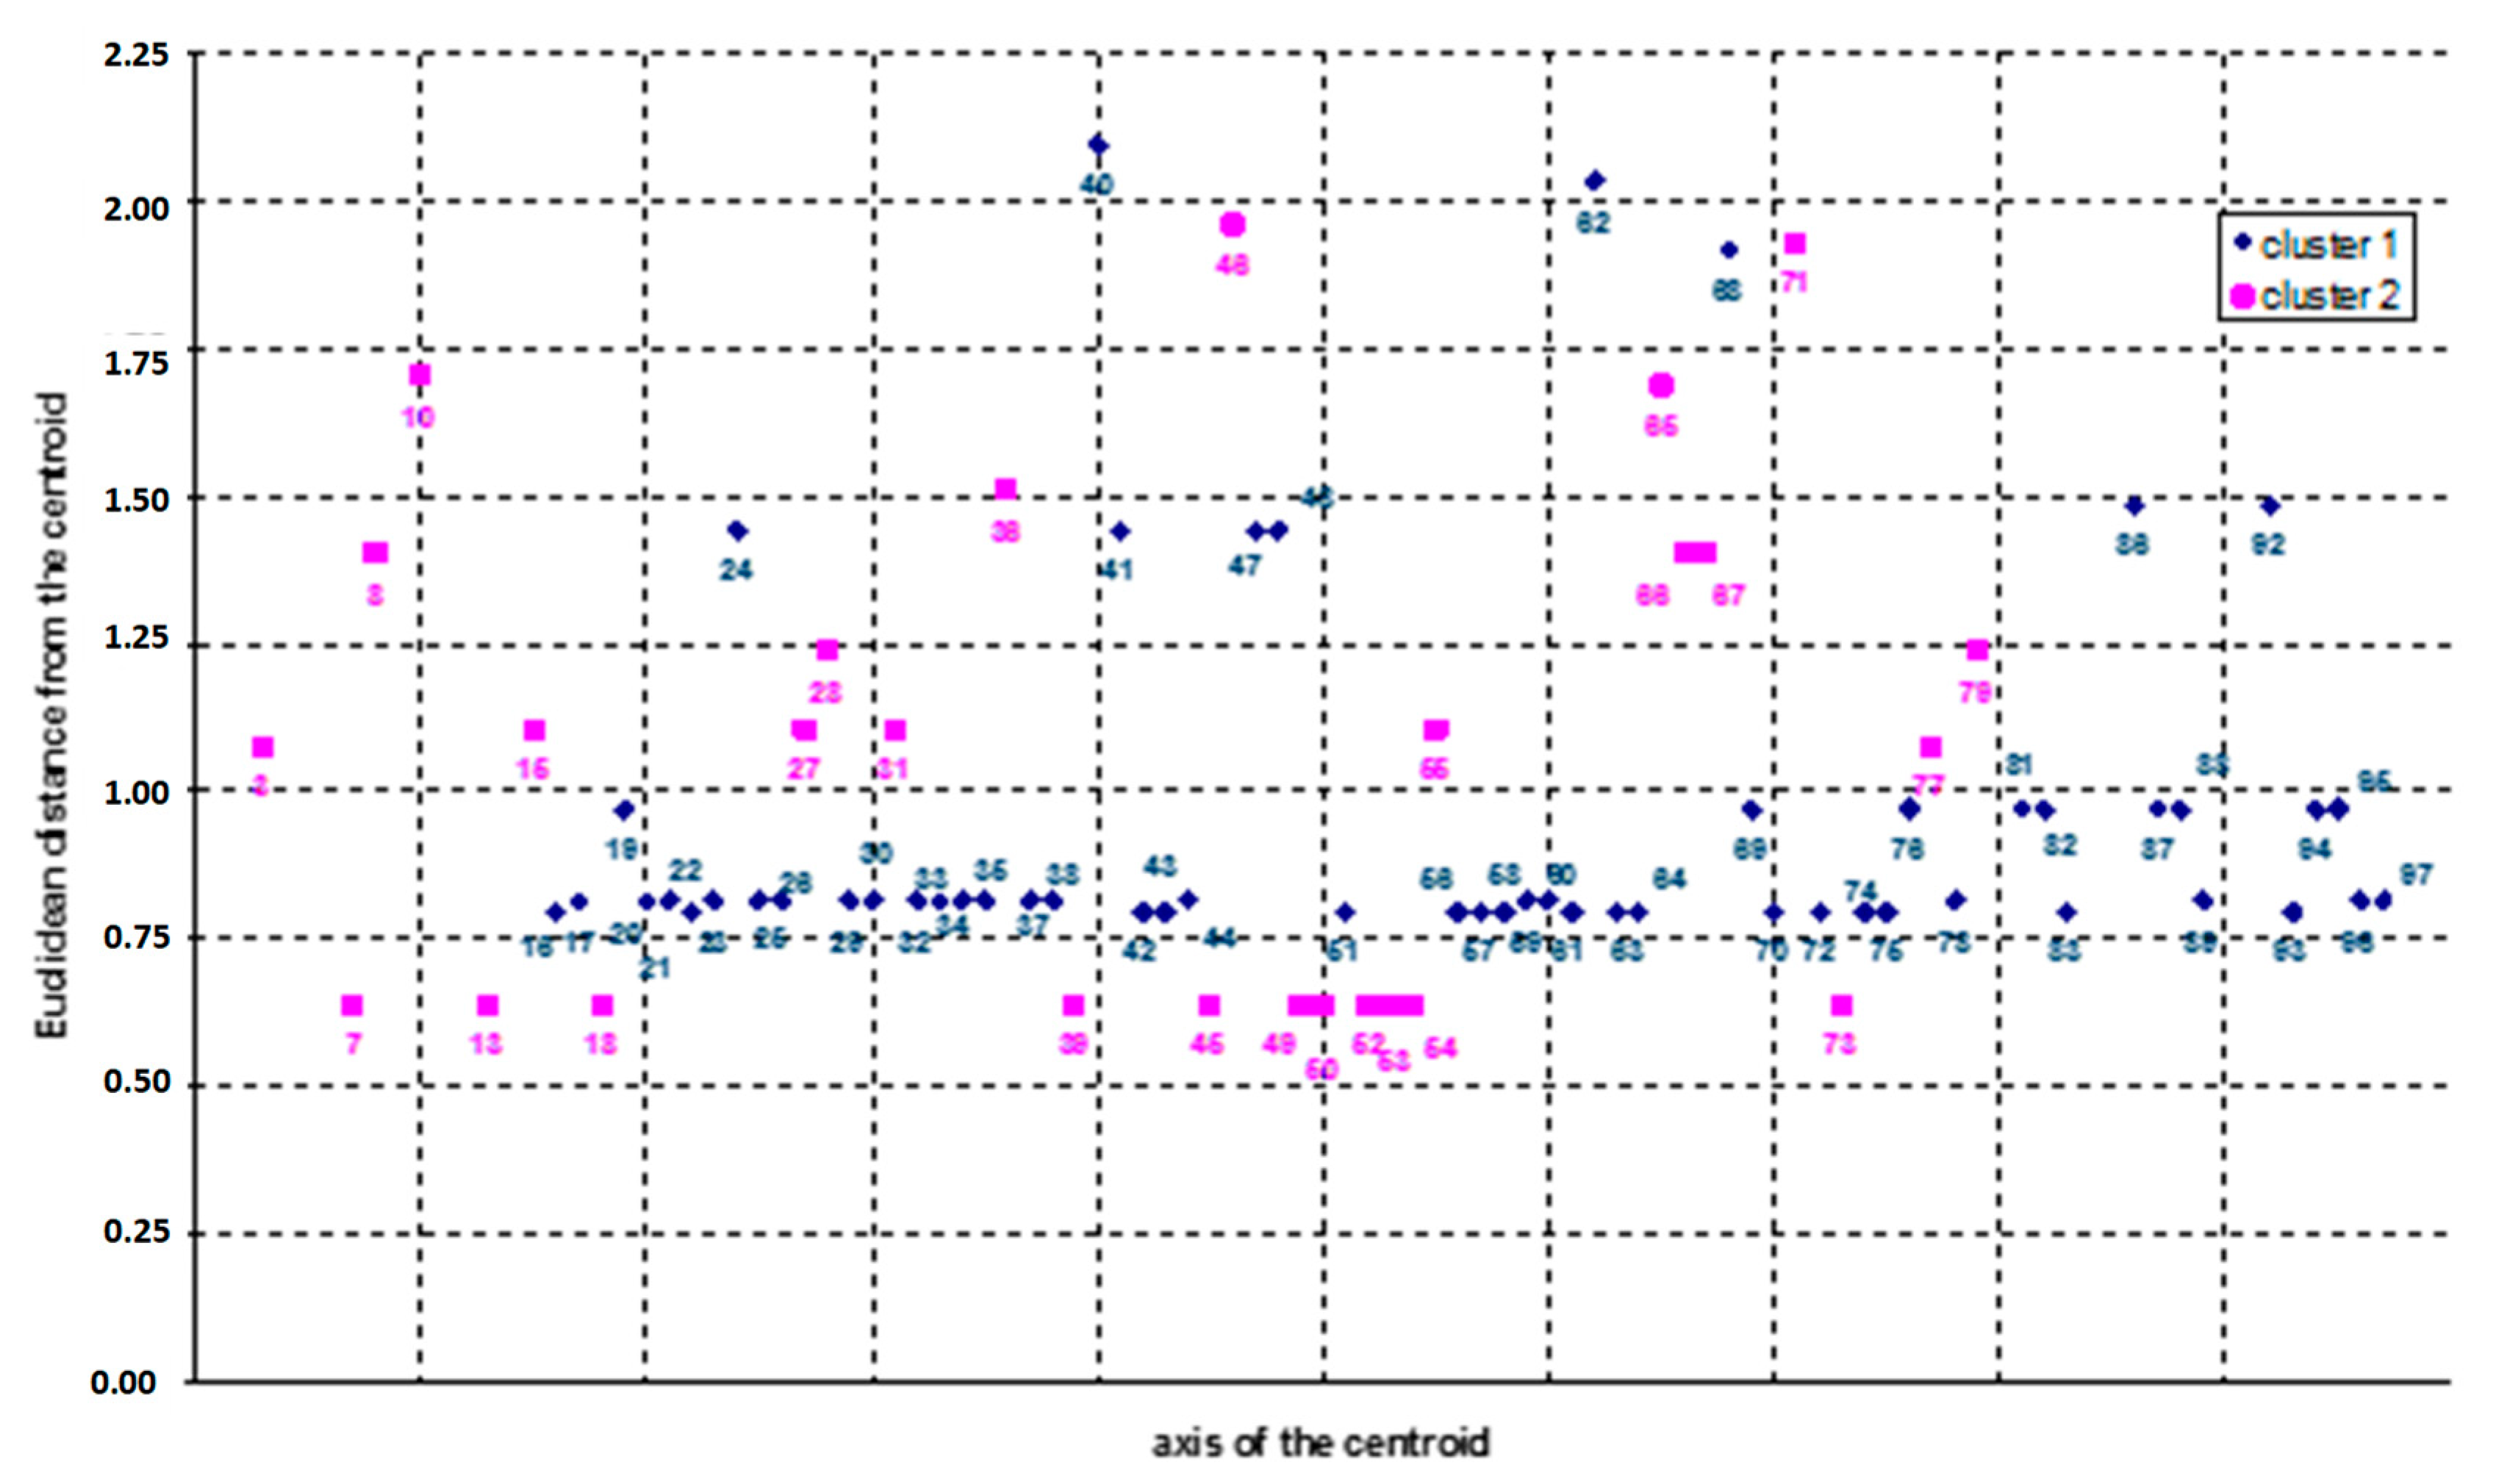
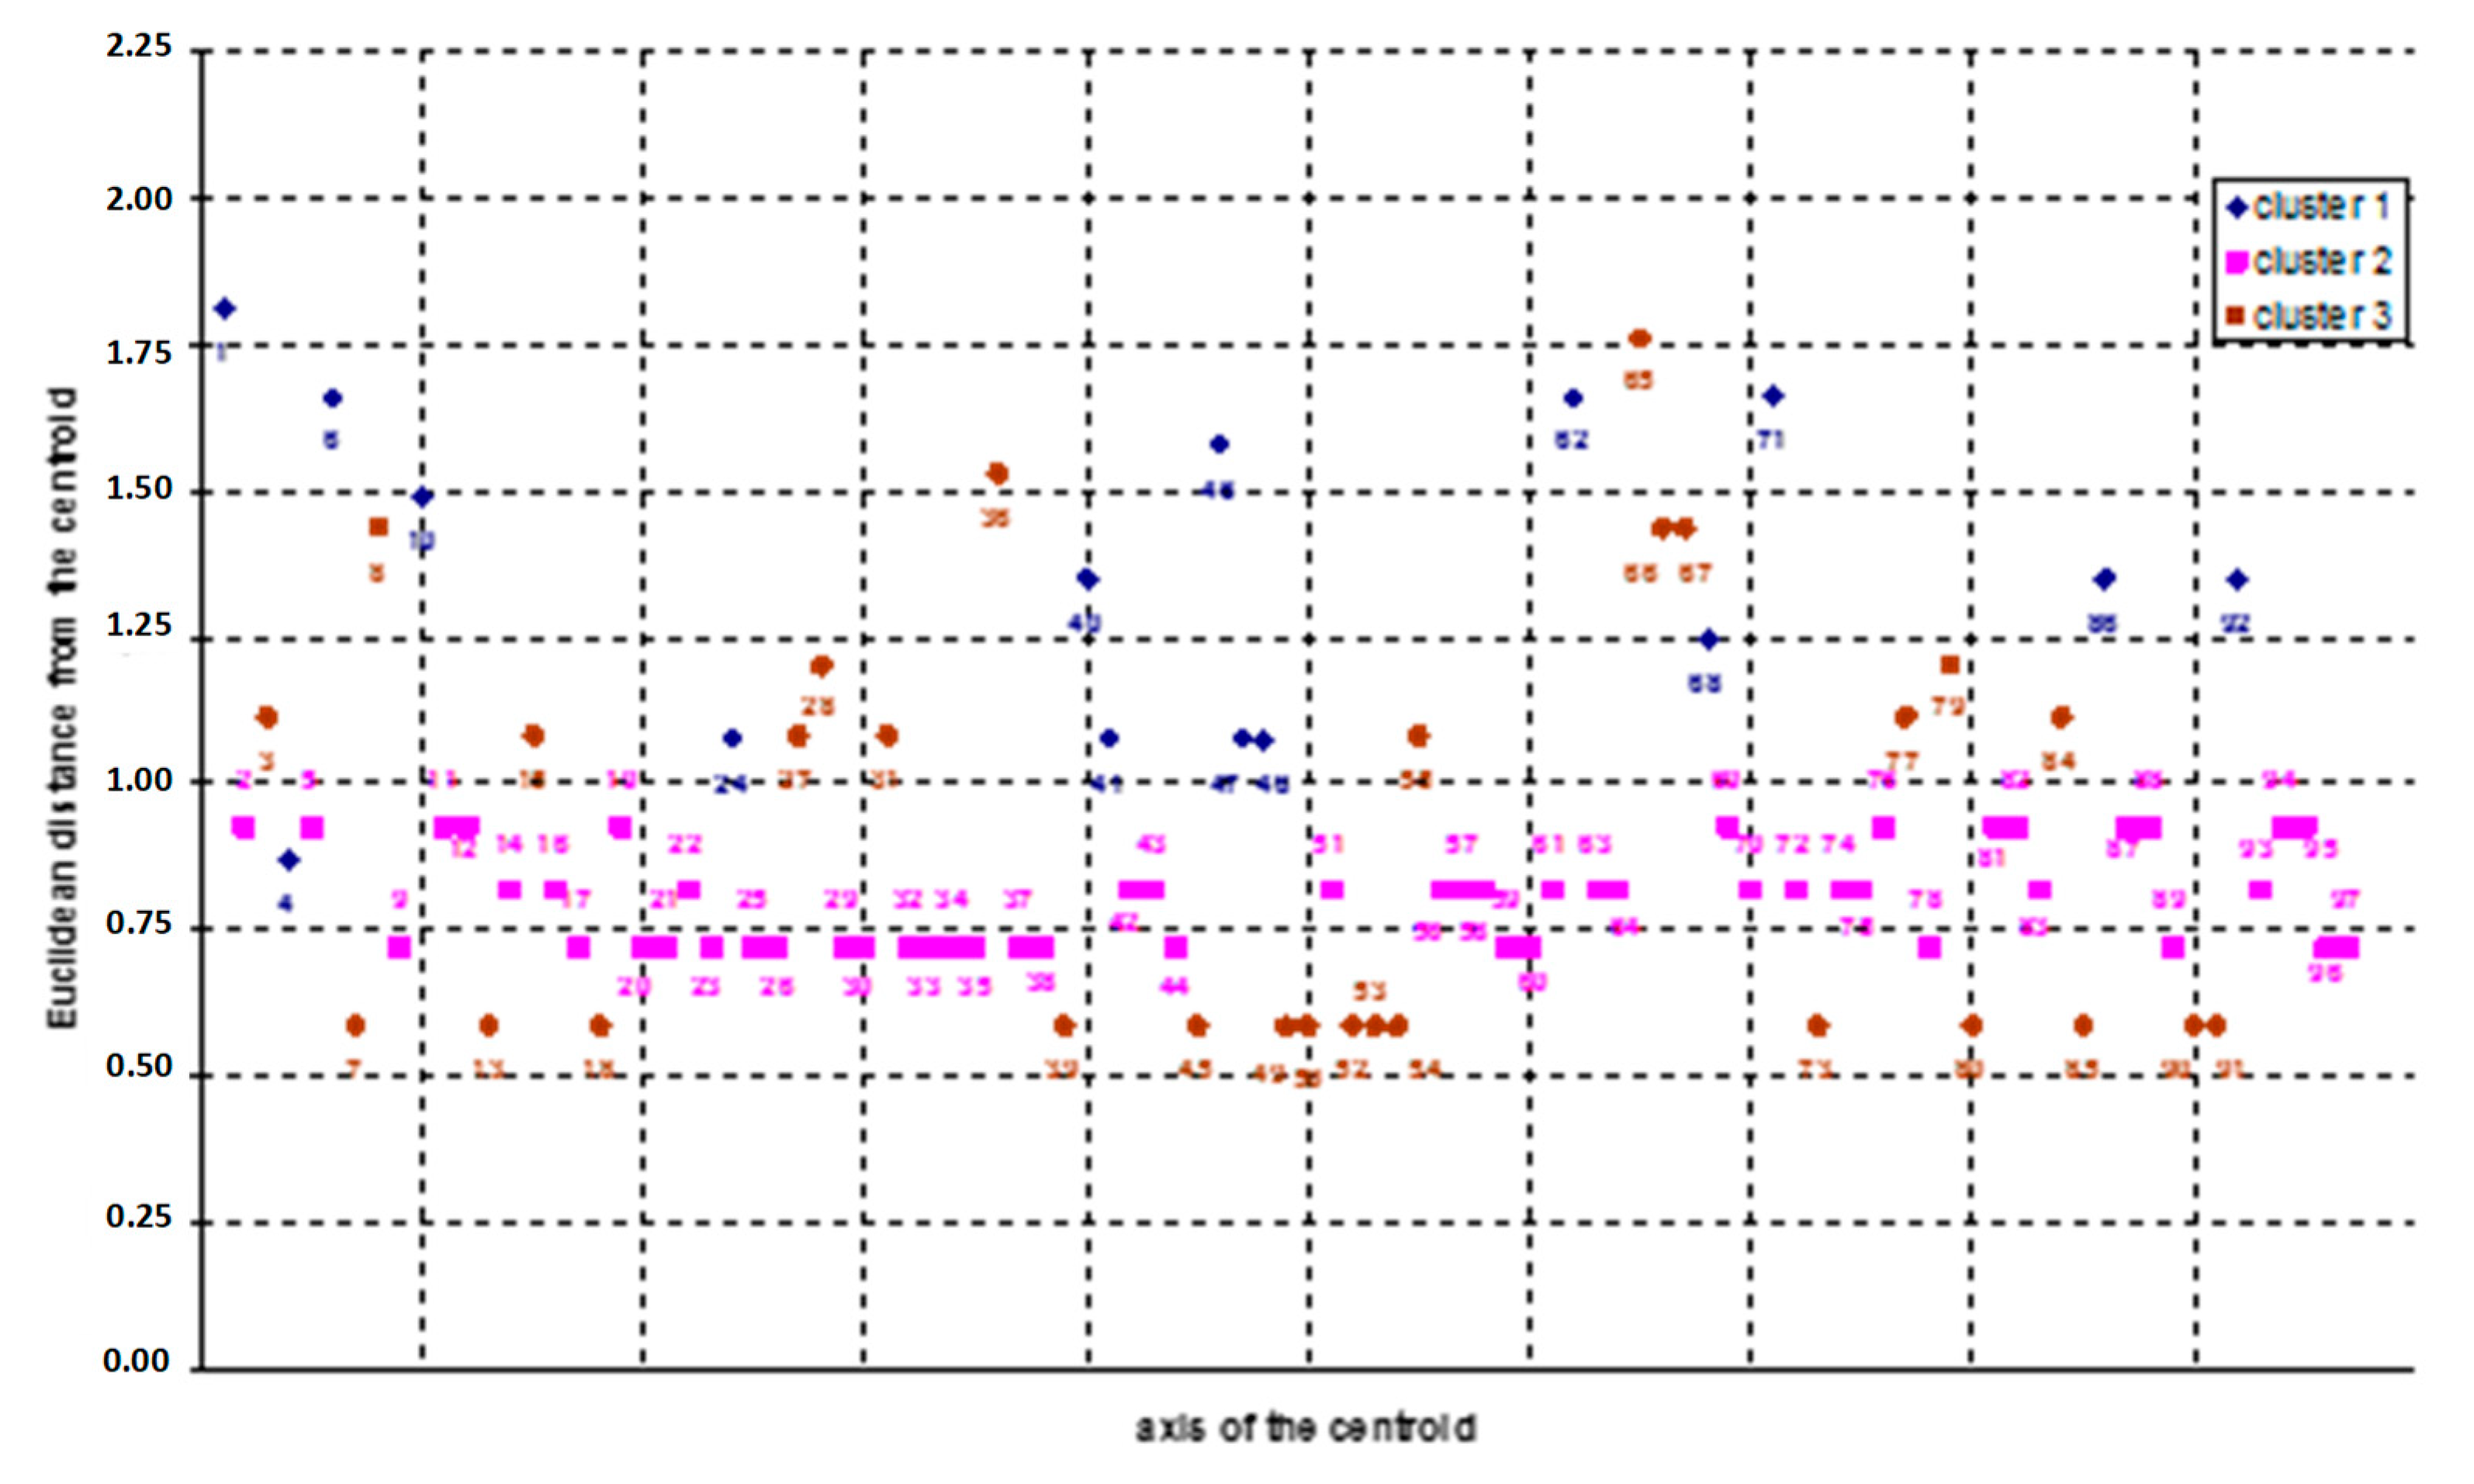
  • Cluster 2, populated by 53 cases, which are characterized by direct contact with the electrical line during construction activities not related to electrical works. Namely, 42% of these accidents are due to a failure of the working team and/or the safety manager.
  • Cluster 3, populated by 29 cases, determined by a failure of the worker (65%) when using a working equipment (e.g., a crane or a scaffold).
Although these two clusters are characterized by different accident modes, they present a common factor contributing to the occurrence of the fatalities, which is represented by the failure of humans (workers, co-workers, or safety managers). In fact, in both of them the human error plays a fundamental role, as in both risk profiles (cluster 2 and cluster 3) the mode of contact is characterized by foreseeable behaviors. Such a finding confirms the results obtained by other studies [74,75,78,79], underlining the fundamental role of human errors in safety management.
Moreover, the use of working equipment as proximal cause of the accidents confirms the results of similar studies in the construction sector [80,81,82], stressing the need for more rigorous interventions also at the normative level as in the case of scaffolding [83]. The results obtained showed that multiple factors always influenced the accidents′ occurrence, confirming the need to take into account the interactions between the different aspects that characterize working operations. This is consistent with the research cues coming also from other fields, such as the agriculture [84] or the oil and gas sectors [85], confirming that the interdependencies among the different variables of an accident should be scrutinized as in most cases the determinants of a fatality are multiple and interconnected, overlapping with each other [36]. As far as the electrical accidents are concerned, the results show that most fatalities occurred to workers carrying out activities not related to specific electrical works (cluster 2). On the one hand, such an output is in line with the results of similar studies in other countries [75,85], highlighting the high rate of electrical accidents among construction workers different from electricians. On the other hand, this aspect fosters the need of a more accurate and multidisciplinary training of both workers and safety managers. In fact, according to the requirements of occupational health and safety legislation, OHS training of workers should concern the risks related to the specific activities and operations assigned to the worker. As a consequence, specific information and training (and protective equipment) on electric risks are provided only to those workers who perform electrical work (e.g., electricians), while other type of workers (e.g., painters or carpenters) hardly receive this specific training. Usually, safety managers (and the entrepreneurs) are likely to follow such a “rule of thumb”, underestimating the problem. However, as demonstrated in our case study, construction works are made of multiple activities where the presence of electricity and consequently of the electrical risks cannot be disregarded anymore, requiring a change both at the cultural and legislative levels.

4.2. Research Implications

From a more general standpoint, the results of the study have demonstrated the capability of the proposed methodology in processing accidents data, generating useful information for the implementation of preventive and protective measures that are case-tailored to the specific working context. In fact, the analysis allowed us to define two main “risk profiles” (i.e., the ones deriving from cluster 2 and cluster 3 as in Figure 15). This type of output can provide predictions on accident patterns, showing at the same time safety flaws that need to be addressed to reduce the deviations that led to the accidents. Such a result certainly contributes to augmenting knowledge on the use of accidents data, providing a novel approach for filtering and aggregating ESAW data, which is not depending on the choices of the analysts.
More in detail, as pointed out in the previous sections, numerous examples of tools aimed at extracting information from accidents statistics and data can be found in literature. However, most of them require a subjective intervention of the analyst and/or of a panel of experts [86,87]. Conversely, this study considered a database (Infor.MO) where the type of information made available is standardized. Hence, the effort made by the analysts in collecting information is reduced and consequently the potential bias in treating data is limited, in line with Hola et al. [38].
Moreover, unlike other studies, our approach is based on the analysis of reports related to a specific type of accident (electrical shock), including in the analysis also distal factors such as responsibilities in the cold phase (i.e., at project level) in accordance with the classification provided by Suraji et al. [88]. The aggregation of these data by means of the k-means cluster analysis allowed the definition of the role of each accident determinant and its variables in the most probable accident causation, generating a set of critical information for the definition of the profile of each accident in a teleological manner, i.e., providing information on both the system′s risk factors and those related to legal responsibility.
The Matrix of Descriptors was used to synthesize data extracted from the ESAW reports into Boolean vectors, making available a basis for their systemic classification based on the accident descriptors and sub-descriptors. Therefore, MoD should be considered as a supportive tool for synthesizing information from the ESAW accident reports, providing a dataset that guarantees the logical disjunction of the accidents′ sub-descriptors. In practice, qualitative information contained in the reports is translated into a simply set of Boolean vectors (one vector for each accident), where the analyst inputs “1” if from the report emerges that a certain aspect affected the occurrence of the accident (e.g., if the electric accident occurred to a bricklayer while fixing a wall, the x21 variable is equal to 1). In this way, it is easier for the analyst to capture information from the ESAW reports, even from those ones filled in an improper manner: in our case study, 97 reports of accidents out of 116 could be used. Such a transformation of categorical variables into dichotomous variables for k-means cluster analysis allows for easy interpretation [89,90]. The results achieved at the end of each step of the proposed procedure were statistically verified by means of the ANOVA test and an excerpt of this is provided in the Supplementary Materials.
Overall, the merit of the proposed approach relies on the possibility of processing ESAW reports in an objective manner, eliciting valuable information concerning both distal and proximal factors, which can be used both by safety managers and decision makers to trace specific risk profiles. In other words, the combination of the MoD filtering and the aggregation through the cluster analysis can provide practical suggestions of where and how to act in order to reduce the repetition of similar accidents. Such an approach accomplishes other studies that have dealt with the management of ESAW data by means of cluster analysis [31,32]. However, while the latter consider any kind of accident occurred in a certain type of industry providing a wide perspective on it, our study is focused on the analysis of a specific type of accident to effectively draw up an accident scenario to be used to determine specific risk profiles, consistently with [30]. In addition, it has to point out that the proposed methodology allows a more thorough characterization of the risk profile, including both the system′s risk characteristics and legal responsibilities, which are key-factors in risk profiling and modeling in the construction industry [81]. This can reduce the distance between theoretical issues and practical needs of companies, in line with the research clues addressed among others by [91,92]. As far as the k-means cluster analysis is concerned, the procedure implemented in this study relies on its application twice: such an approach allows for a better definition of the centroids, guaranteeing a clearer evaluation of the mutual relationships among the accident′s variables, in line with research cues by Swuste et al. [93]. Furthermore, such an approach can reduce the limitations of k-means clustering due to its sensitiveness sensitive to noise and outlier points [52].
All things considered, the proposed approach can support safety managers in the preliminary characterization of risk scenarios [94,95], acting preventively and proactively to augment the effectiveness of OHS measures. The methodology can be applied for analyzing accidents statistics provided in accordance with the ESAW rules. Hence, its usability in different contexts and different countries (e.g., EU member states) is facilitated. Accordingly, this study can be valuable for theory development as well as for practitioners and decision makers.

4.3. Limitations

The main limitation of the proposed approach is due to the complexity of calculations, requiring specific skills and training in statistical analysis. At the same time, a further drawback of the proposed approach relies on the ESAW coding system itself. As remarked by Jacinto et al. [34], the skills of coders have a substantial impact on the coding reliability. Hence, the more the coding quality can be guaranteed, the more the proposed approach can provide effective results.
In addition, we have to remark that in this study the predictive role played by the results of our approach is limited to a “static” character if compared to the other approaches and models proposed in literature (e.g., [96,97]), which have a “dynamic” nature.

5. Conclusions

Learning from accidents is considered a fundamental step forward to guarantee a more generic prevention of their repetition [98]. The present study aimed at providing a methodology for capturing information from accidents databases developed following the ESAW protocol. For this purpose, a procedure for transforming categorical information into dichotomous variables was developed for filtering reports data, which can be further processed by means of the k-means cluster analysis. According to the proposed approach, this tool is used twice for a better definition of the centroids, guaranteeing a clearer evaluation of the mutual relationships among the accident′s variables. Such an approach allows the definition of both distal and proximal characteristics of a specific accident type, showing the role of each accident determinant and its variables in the most probable accident causation modes. Consequently, risk profiles based on the relationships existing among the accident determinants and the accident typical modes can be defined, providing practical information for the implementation of ad hoc safety measures.
The output of the study can be considered more relevant and thus able to enhance research in this specific field of occupational safety when considering the case study context, i.e., the electrical accidents in the construction industry. The achieved results can be used to reduce the occurrence of similar accidents by means of specific OHS measures in this sector. They also offer a basis for a wider application of the proposed methodology to different accident types.
Hence, additional applications of such an approach are expected in order to better validate the procedure augmenting knowledge on risk profiling from accidents databases, also considering different typologies of risks both in the construction industry as well as in other sectors.

Supplementary Materials

Author Contributions

Conceptualization, M.L., M.F.; methodology, M.L., M.F.; validation, M.L., G.P., M.F.; writing-review and editing, M.L., M.F.

Funding

This research received no external funding.

Acknowledgments

The Authors wish to thank Giulia Marra for her contribution in the case study development.

Conflicts of Interest

The authors declare no conflict of interest.

References

  1. Health and Safety Executive (HSE). Construction Statistics in Great Britain. 2019. Available online: http://www.hse.gov.uk/statistics/industry/construction.pdf (accessed on 19 November 2019).
  2. Japan Industrial Safety and Health Association (JISHA). OSH Statistics in Japan—2018. Available online: https://www.jisha.or.jp/english/statistics/accidents_in_detail_2018.html (accessed on 19 November 2019).
  3. Eurostat. Accidents at Work—Statistics by Economic Activity. Available online: https://ec.europa.eu/ eurostat/statistics-explained/index.php?title=Accidents_at_work_-_statistics_by_economic_activity (accessed on 19 November 2019).
  4. Jo, B.W.; Lee, Y.S.; Kim, J.H.; Khan, R.M.A. Trend analysis of construction industrial accidents in Korea from 2011 to 2015. Sustainability 2017, 9, 1297. [Google Scholar] [CrossRef]
  5. Gürcanli, G.E.; Müngen, U. Analysis of construction accidents in Turkey and responsible parties. Ind. Health 2013, 52, 581–595. [Google Scholar] [CrossRef] [PubMed]
  6. Shafique, M.; Rafiq, M. An Overview of Construction Occupational Accidents in Hong Kong: A Recent Trend and Future Perspectives. Appl. Sci. 2019, 9, 2069. [Google Scholar] [CrossRef]
  7. Zhou, X.-H.; Shen, S.-L.; Xu, Y.-S.; Zhou, A.-N. Analysis of Production Safety in the Construction Industry of China in 2018. Sustainability 2019, 11, 4537. [Google Scholar] [CrossRef]
  8. Sunindijo, R.Y.; Zou, P.X.W. Political Skill for Developing Construction Safety Climate. J. Constr. Eng. Manag. 2011, 138, 605–612. [Google Scholar] [CrossRef]
  9. Liaudanskiene, R.; Varnas, N.; Ustinovichius, L. Modelling the application of workplace safety and health act in Lithuanian construction sector. Technol. Econ. Dev. Econ. 2010, 16, 233–253. [Google Scholar] [CrossRef]
  10. Sherratt, F.; Farrell, P.; Noble, R. UK construction site safety: Discourses of enforcement and engagement. Constr. Manag. Econ. 2013, 31, 623–635. [Google Scholar] [CrossRef]
  11. Fargnoli, M.; De Minicis, M.; Di Gravio, G. Knowledge Management integration in Occupational Health and Safety systems in the construction industry. Int. J. Prod. Dev. 2011, 14, 165–185. [Google Scholar] [CrossRef]
  12. Loosemore, M.; Andonakis, N. Barriers to implementing OHS reforms—The experiences of small subcontractors in the Australian Construction Industry. Int. J. Proj. Manag. 2007, 25, 579–588. [Google Scholar] [CrossRef]
  13. Pinto, A.; Nunes, I.L.; Ribeiro, R.A. Occupational risk assessment in construction industry—Overview and reflection. Saf. Sci. 2011, 49, 616–624. [Google Scholar] [CrossRef]
  14. Aires, M.D.M.; Gámez, M.C.R.; Gibb, A. Prevention through design: The effect of European Directives on construction workplace accidents. Saf. Sci. 2010, 48, 248–258. [Google Scholar] [CrossRef]
  15. Fargnoli, M.; Lombardi, M.; Haber, N.; Guadagno, F. Hazard Function Deployment: A QFD based tool for the assessment of working tasks—A practical study in the construction industry. Int. J. Occup. Saf. Ergon. 2018, 1–53. [Google Scholar] [CrossRef]
  16. Sousa, V.; Almeida, N.M.; Dias, L.A. Risk-based management of occupational safety and health in the construction industry—Part 1: Background knowledge. Saf. Sci. 2014, 66, 75–86. [Google Scholar] [CrossRef]
  17. Bas, E. An integrated quality function deployment and capital budgeting methodology for occupational safety and health as a systems thinking approach: The case of the construction industry. Accid. Anal. Prev. 2014, 68, 42–56. [Google Scholar] [CrossRef]
  18. Gunduz, M.; Laitinen, H. A 10-step safety management framework for construction small and medium-sized enterprises. Int. J. Occup. Saf. Ergon. 2017, 23, 353–359. [Google Scholar] [CrossRef]
  19. Underwood, P.; Waterson, P. Systems thinking, the Swiss Cheese Model and accident analysis: A comparative systemic analysis of the Grayrigg train derailment using the ATSB, AcciMap and STAMP models. Accid. Anal. Prev. 2014, 68, 75–94. [Google Scholar] [CrossRef]
  20. Aneziris, O.N.; Topali, E.; Papazoglou, I.A. Occupational risk of building construction. Reliab. Eng. Sys. Saf. 2012, 105, 36–46. [Google Scholar] [CrossRef]
  21. Jacinto, C.; Soares, C. The added value of the new ESAW/Eurostat variables in accident analysis in the mining and quarrying industry. J. Saf. Res. 2008, 39, 631–644. [Google Scholar] [CrossRef]
  22. Lundberg, J.; Rollenhagen, C.; Hollnagel, E. What you look for is what you find—The consequences of underlying accident models in eight accident investigation manuals. Saf. Sci. 2009, 47, 1297–1311. [Google Scholar] [CrossRef]
  23. Lindberg, A.; Ove Hansson, S.; Rollenhagen, C. Learning from accidents—What more do we need to know. Saf. Sci. 2010, 48, 714–721. [Google Scholar] [CrossRef]
  24. Gibb, A.; Lingard, H.; Behm, M.; Cooke, T. Construction accident causality: Learning from different countries and differing consequences. Constr. Manag. Econ. 2014, 32, 446–459. [Google Scholar] [CrossRef]
  25. Chong, H.Y.; Low, T.S. Accidents in Malaysian construction industry: Statistical data and court cases. Int. J. Occup. Saf. Ergon. 2014, 20, 503–513. [Google Scholar] [CrossRef] [PubMed]
  26. Molinero-Ruiz, E.; Pitarque, S.; Fondevila-McDonald, Y.; Martin-Bustamante, M. How reliable and valid is the coding of the variables of the European Statistics on Accidents at Work (ESAW)? A need to improve preventive public policies. Saf. Sci. 2015, 79, 72–79. [Google Scholar] [CrossRef]
  27. Salguero-Caparros, F.; Suarez-Cebador, M.; Rubio-Romero, J.C. Analysis of investigation reports on occupational accidents. Saf. Sci. 2015, 72, 329–336. [Google Scholar] [CrossRef]
  28. Schenk, L.; Öberg, M. Comparing data from the Poisons Information Centre with employers′ accident reports reveal under-recognized hazards at the workplace. Ann. Work Expo. Health 2018, 62, 517–529. [Google Scholar] [CrossRef]
  29. Kogler, R.; Quendler, E.; Boxberger, J. Analysis of occupational accidents with agricultural machinery in the period 2008–2010 in Austria. Saf. Sci. 2015, 72, 319–328. [Google Scholar] [CrossRef]
  30. Rondelli, V.; Casazza, C.; Martelli, R. Tractor rollover fatalities, analyzing accident scenario. J. Saf. Res. 2018, 67, 99–106. [Google Scholar] [CrossRef]
  31. Palamara, F.; Piglione, F.; Piccinini, N. Self-Organizing Map and clustering algorithms for the analysis of occupational accident databases. Saf. Sci. 2011, 49, 1215–1230. [Google Scholar] [CrossRef]
  32. Comberti, L.; Demichela, M.; Baldissone, G.; Fois, G.; Luzzi, R. Large Occupational Accidents Data Analysis with a Coupled Unsupervised Algorithm: The S.O.M. K-Means Method. An Application to the Wood Industry. Safety 2018, 4, 51. [Google Scholar] [CrossRef]
  33. Carrillo-Castrillo, J.A.; Trillo-Cabello, A.F.; Rubio-Romero, J.C. Construction accidents: Identification of the main associations between causes, mechanisms and stages of the construction process. Int. J. Occup. Saf. Ergon. 2017, 23, 240–250. [Google Scholar] [CrossRef]
  34. Jacinto, C.; Santos, F.P.; Soares, C.G.; Silva, S.A. Assessing the coding reliability of work accidents statistical data: How coders make a difference. J. Saf. Res. 2016, 59, 9–21. [Google Scholar] [CrossRef] [PubMed]
  35. Bilir, S.; Gurcanli, G.E. A Method to Calculate the Accident Probabilities in Construction Industry Using a Poisson Distribution Model. In Advances in Safety Management and Human Factors; Arezes, P., Ed.; Springer: Cham, Switzerland, 2016; pp. 513–523. [Google Scholar] [CrossRef]
  36. Dien, Y.; Dechy, N.; Guillaume, E. Accident investigation: From searching direct causes to finding in-depth causes—Problem of analysis or/and of analyst? Saf. Sci. 2012, 50, 1398–1407. [Google Scholar] [CrossRef] [Green Version]
  37. Zhang, J.; Zhang, W.; Xu, P.; Chen, N. Applicability of accident analysis methods to Chinese construction accidents. J. Saf. Res. 2019, 68, 187–196. [Google Scholar] [CrossRef] [PubMed]
  38. Hola, A.; Sawicki, M.; Szóstak, M. Methodology of Classifying the Causes of Occupational Accidents Involving Construction Scaffolding Using Pareto-Lorenz Analysis. Appl. Sci. 2018, 8, 48. [Google Scholar] [CrossRef] [Green Version]
  39. Bellamy, L.J.; Ale, B.J.; Geyer, T.A.W.; Goossens, L.H.; Hale, A.R.; Oh, J.; Mud, M.; Bloemhof, A.; Papazoglou, I.A.; Whiston, J.Y. Storybuilder—A tool for the analysis of accident reports. Reliab. Eng. Sys. Saf. 2007, 92, 735–744. [Google Scholar] [CrossRef]
  40. Kvaloy, J.T.; Aven, T. An alternative approach to trend analysis in accident data. Reliab. Eng. Syst. Saf. 2005, 90, 75–82. [Google Scholar] [CrossRef]
  41. Lombardi, M.; Fargnoli, M. Prioritization of hazards by means of a QFD-based procedure. Int. J. Saf. Secur. Eng. 2018, 8, 342–353. [Google Scholar] [CrossRef] [Green Version]
  42. Shao, B.; Hu, Z.; Liu, Q.; Chen, S.; He, W. Fatal accident patterns of building construction activities in China. Saf. Sci. 2019, 111, 253–263. [Google Scholar] [CrossRef]
  43. Raviv, G.; Shapira, A.; Fishbain, B. AHP-based analysis of the risk potential of safety incidents: Case study of cranes in the construction industry. Saf. Sci. 2017, 91, 298–309. [Google Scholar] [CrossRef]
  44. Ayhan, B.U.; Tokdemir, O.B. Predicting the outcome of construction incidents. Saf. Sci. 2019, 113, 91–104. [Google Scholar] [CrossRef]
  45. Biggs, H.C.; Dinsdag, D.; Kirk, P.J.; Cipolla, D. Safety culture research, lead indicators, and the development of safety effectiveness indicators in the construction sector. Int. J. Technol. Knowl. Soc. 2010, 6, 133–140. [Google Scholar] [CrossRef] [Green Version]
  46. Hola, B.; Szóstak, M. Methodology of analysing the accident rate in the construction industry. Procedia Eng. 2017, 172, 355–362. [Google Scholar] [CrossRef]
  47. Ale, B.J.; Bellamy, L.J.; Baksteen, H.; Damen, M.; Goossens, L.H.; Hale, A.R.; Mud, M.; Oh, J.; Papazoglou, I.A.; Whiston, J.Y. Accidents in the construction industry in the Netherlands: An analysis of accident reports using Storybuilder. Reliab. Eng. Sys. Saf. 2008, 93, 1523–1533. [Google Scholar] [CrossRef]
  48. Love, P.E.D.; Teo, P.; Smith, J.; Ackermann, F.; Zhou, Y. The nature and severity of workplace injuries in construction: Engendering operational benchmarking. Ergonomics 2019, 62. [Google Scholar] [CrossRef] [PubMed]
  49. Cross, J. ISO 31010 Risk assessment techniques and open systems. In Proceedings of the Sixth Workshop on Open Systems Dependability (WOSD), Tokyo, Japan, 21 October 2017; pp. 15–18. [Google Scholar]
  50. Abdi, H.; Williams, L.J. Principal component analysis. Wiley Interdiscip. Rev. 2010, 2, 433–459. [Google Scholar] [CrossRef]
  51. Dillon, W.R.; Goldstein, M. Multivariate Analysis Methods and Applications; Wiley: New York, NY, USA, 1984. [Google Scholar]
  52. Celebi, M.E.; Kingravi, H.A.; Vela, P.A. A comparative study of efficient initialization methods for the k-means clustering algorithm. Exp. Sys. Appl. 2013, 40, 200–210. [Google Scholar] [CrossRef] [Green Version]
  53. Brodny, J.; Tutak, M. Analysis of the diversity in emissions of selected gaseous and particulate pollutants in the European Union countries. J. Environ. Manag. 2019, 231, 582–595. [Google Scholar] [CrossRef]
  54. INAIL (Italian Workers′ Compensation Authority). INFORMO Database on Serious and Fatal Accidents. Available online: https://appsricercascientifica.inail.it/getinf/informo/home_informo.asp (accessed on 25 September 2019).
  55. Proto, A.R.; Mazzocchi, F.; Cossio, F.; Bortolini, L.; Pascuzzi, S.; Caruso, L.; Diano, M.; Zimbalatti, G. A survey on occupational injuries in works on trees in Italy. Procedia Soc. Behav. Sci. 2016, 223, 435–441. [Google Scholar] [CrossRef]
  56. Lombardi, M.; Rossi, G. Cluster Analysis of Fatal Accidents Series in the Infor.Mo Database: Analysis, Evidence and Research Perspectives. Int. J. Saf. Secur. Eng. 2013, 3, 317–331. [Google Scholar] [CrossRef]
  57. Oltedal, S.; Rundmo, T. Using cluster analysis to test the cultural theory of risk perception. Transp. Res. Part F Traffic Psychol. Behav. 2007, 10, 254–262. [Google Scholar] [CrossRef]
  58. INAIL (Italian Workers′ Compensation Authority). INFORMO Database on Serious and Fatal Accidents. Details of Information Related to Fatal Accident 8164. Available online: https://appsricercascientifica.inail.it/ getinf_u/v iewCase.asp?id=8164&v (accessed on 25 September 2019).
  59. Punj, G.; Stewart, D.W. Cluster analysis in marketing research: Review and suggestions for application. J. Mark. Res. 1983, 20, 134–148. [Google Scholar] [CrossRef]
  60. Everitt, B.S.; Landau, S.; Leese, M. Cluster Analysis, 4th ed.; Arnold: London, UK, 2001. [Google Scholar]
  61. Alper, S.J.; Karsh, B.T. A systematic review of safety violations in industry. Accid. Anal. Prev. 2009, 41, 739–754. [Google Scholar] [CrossRef] [PubMed]
  62. Arocena, P.; Núñez, I. An empirical analysis of the effectiveness of occupational health and safety management systems in SMEs. Int. Small Bus. J. 2010, 28, 398–419. [Google Scholar] [CrossRef]
  63. Champoux, D.; Brun, J.P. Occupational health and safety management in small size enterprises: An overview of the situation and avenues for intervention and research. Saf. Sci. 2003, 41, 301–318. [Google Scholar] [CrossRef]
  64. Engkvist, I.L.; Kjellberg, A.; Wigaeus, H.E.; Hagberg, M.; Menckel, E.; Ekenvall, L. Back injuries among nursing personnel—Identification of work conditions with cluster analysis. Saf. Sci. 2001, 37, 1–18. [Google Scholar] [CrossRef]
  65. Raviv, G.; Fishbain, B.; Shapira, A. Analyzing risk factors in crane-related nearmiss and accident reports. Saf. Sci. 2017, 91, 192–205. [Google Scholar] [CrossRef]
  66. Kervern, G.Y. Cindynics: The science of danger. Risk Manag. 1995, 42, 34. [Google Scholar]
  67. Chantelauve, G. An overview of maritime safety assessment trends in a stakeholder perspective. In Proceedings of the European Safety and Reliability Conference 2003, Maastricht, The Netherlands, 15–18 June 2003; Bedford, T., van Gelder, P.H.A.J.M., Eds.; CRC Press Book: Maastricht, The Netherlands, 2003; pp. 387–395. [Google Scholar]
  68. Guo, B.H.; Yiu, T.W.; González, V.A. Identifying behaviour patterns of construction safety using system archetypes. Accid. Anal. Prev. 2015, 80, 125–141. [Google Scholar] [CrossRef]
  69. Wiegmann, D.A.; Shappell, S.A. Human error analysis of commercial aviation accidents: Application of the Human Factors Analysis and Classification System (HFACS). Aviat. Space Environ. Med. 2001, 72, 1006–1016. [Google Scholar]
  70. International Labour Office (ILO). Improvement of National Reporting, Data Collection and Analysis of Occupational Accidents and Diseases; ILO Publications: Geneva, Switzerland, 2012; ISBN 978-92-2-126817-8. [Google Scholar]
  71. IBM. Statistical Package for Social Science (SPSS), Version 5.0. Available online: https://www.ibm.com/it-it/products/spss-statistics/details (accessed on 25 September 2019).
  72. Harb, H.; Makhoul, A.; Couturier, R. An enhanced K-means and ANOVA-based clustering approach for similarity aggregation in underwater wireless sensor networks. IEEE Sens. J. 2015, 15, 5483–5493. [Google Scholar] [CrossRef] [Green Version]
  73. Szüle, B. Introduction to Data Analysis; Faculty of Economics, Corvinus University of Budapest: Budapest, Hungary, 2016; ISBN 978-963-503-619-6. [Google Scholar]
  74. Fargnoli, M.; Lombardi, M. Preliminary Human Safety Assessment (PHSA) for the Improvement of the Behavioral Aspects of Safety Climate in the Construction Industry. Buildings 2019, 9, 69. [Google Scholar] [CrossRef] [Green Version]
  75. Zhao, D.; Thabet, W.; McCoy, A.; Kleiner, B. Electrical deaths in the US construction: An analysis of fatality investigations. Int. J. Inj. Control. Saf. Prev. 2014, 21, 278–288. [Google Scholar] [CrossRef] [PubMed]
  76. Suarez Sanchez, F.A.; Carvajal Pelaez, G.I.; Catala Alis, J. Occupational safety and health in construction: A review of applications and trends. Ind. Health 2017, 55, 210–218. [Google Scholar] [CrossRef] [PubMed] [Green Version]
  77. Suárez-Cebador, M.; Rubio-Romero, J.C.; López-Arquillos, A. Severity of electrical accidents in the construction industry in Spain. J. Saf. Res. 2014, 48, 63–70. [Google Scholar] [CrossRef] [PubMed]
  78. Castillo-Rosa, J.; Suárez-Cebador, M.; Rubio-Romero, J.C.; Aguado, J.A. Personal factors and consequences of electrical occupational accidents in the primary, secondary and tertiary sectors. Saf. Sci. 2017, 91, 286–297. [Google Scholar] [CrossRef]
  79. Wang, J.; Yan, M. Application of an Improved Model for Accident Analysis: A Case Study. Int. J. Environ. Res. Public Health 2019, 16, 2756. [Google Scholar] [CrossRef] [Green Version]
  80. Zhang, F.; Fleyeh, H.; Wang, X.; Lu, M. Construction site accident analysis using text mining and natural language processing techniques. Autom. Constr. 2019, 99, 238–248. [Google Scholar] [CrossRef]
  81. Ning, X.; Qi, J.; Wu, C. A quantitative safety risk assessment model for construction site layout planning. Saf. Sci. 2018, 104, 246–259. [Google Scholar] [CrossRef]
  82. Raviv, G.; Shapira, A. Systematic approach to crane-related near-miss analysis in the construction industry. Int. J. Constr. Manag. 2018, 18, 310–320. [Google Scholar] [CrossRef]
  83. Rubio-Romero, J.C.; Suárez-Cebador, M.; Pardo-Ferreira, M.C.; De la Varga-Salto, J.M.; Carrillo-Castrillo, J.A. Does Europe Need an EU Product Safety Directive for Access Scaffolding? Int. J. Environ. Res. Public Health 2019, 16, 103. [Google Scholar] [CrossRef] [Green Version]
  84. Fargnoli, M.; Lombardi, M.; Haber, N. A fuzzy-QFD approach for the enhancement of work equipment safety: A case study in the agriculture sector. Int. J. Reliab. Saf. 2018, 12, 306–326. [Google Scholar] [CrossRef]
  85. Alrifaey, M.; Sai Hong, T.; Supeni, E.E.; As′arry, A.; Ang, C.K. Identification and Prioritization of Risk Factors in an Electrical Generator Based on the Hybrid FMEA Framework. Energies 2019, 12, 649. [Google Scholar] [CrossRef] [Green Version]
  86. Pinto, A. QRAM a Qualitative Occupational Safety Risk Assessment Model for the construction industry that incorporate uncertainties by the use of fuzzy sets. Saf. Sci. 2014, 63, 57–76. [Google Scholar] [CrossRef]
  87. Li, R.Y.M.; Chau, K.W.; Zeng, F.F. Ranking of Risks for Existing and New Building Works. Sustainability 2019, 11, 2863. [Google Scholar] [CrossRef] [Green Version]
  88. Suraji, A.; Duff, A.R.; Peckitt, S.J. Development of causal model of construction accident causation. J. Constr. Eng. Manag. 2001, 127, 337–344. [Google Scholar] [CrossRef]
  89. Ammon, B.V.; Bowman, J.; Mourad, R. Who are our students? Cluster analysis as a tool for understanding community college student populations. J. Appl. Res. Community Coll. 2008, 16, 29–41. [Google Scholar]
  90. Armstrong, J.J.; Zhu, M.; Hirdes, J.P.; Stolee, P. K-means cluster analysis of rehabilitation service users in the home health care system of Ontario: Examining the heterogeneity of a complex geriatric population. Arch. Phys. Med. Rehabil. 2012, 93, 2198–2205. [Google Scholar] [CrossRef]
  91. Gillman, M.; Pillay, M. An Integrative Literature Review: What Are the Barriers that Stop Organisations from Learning the Lessons Highlighted in Serious Incident Investigations? In Proceedings of the International Conference on Applied Human Factors and Ergonomics, Los Angeles, CA, USA, 17–21 July 2017; Springer: Cham, Switzerland; pp. 627–634. [Google Scholar] [CrossRef]
  92. Margaryan, A.; Littlejohn, A.; Stanton, N.A. Research and development agenda for Learning from Incidents. Saf. Sci. 2017, 99, 5–13. [Google Scholar] [CrossRef] [Green Version]
  93. Swuste, P.; Frijters, A.; Guldenmund, F. Is it possible to influence safety in the building sector?: A literature review extending from 1980 until the present. Saf. Sci. 2012, 50, 1333–1343. [Google Scholar] [CrossRef]
  94. Guarascio, M.; Lombardi, M.; Rossi, G.; Sciarra, G. Risk analysis and acceptability criteria. WIT Trans. Built Environ. 2007, 94, 131–138. [Google Scholar] [CrossRef] [Green Version]
  95. Mazaheri, A.; Montewka, J.; Nisula, J.; Kujala, P. Usability of accident and incident reports for evidence-based risk modeling—A case study on ship grounding reports. Saf. Sci. 2015, 76, 202–214. [Google Scholar] [CrossRef]
  96. Awal, Z.I.; Hasegawa, K. A study on accident theories and application to maritime accidents. Procedia Eng. 2017, 194, 298–306. [Google Scholar] [CrossRef]
  97. Hoła, B.; Szóstak, M. Modeling of the Accidentality Phenomenon in the Construction Industry. Appl. Sci. 2019, 9, 1878. [Google Scholar] [CrossRef] [Green Version]
  98. Drupsteen, L.; Groeneweg, J.; Zwetsloot, G.I. Critical steps in learning from incidents: Using learning potential in the process from reporting an incident to accident prevention. Int. J. Occup. Saf. Ergon. 2013, 19, 63–77. [Google Scholar] [CrossRef] [Green Version]
Figure 1. Example of the information provided by the Infor.MO database (adapted from [58]).
Ijerph 16 04748 g001
Figure 2. The cindynic hyperspace representation (adapted from [67]).
Ijerph 16 04748 g002
Figure 3. Scheme of the proposed methodology.
Ijerph 16 04748 g003
Figure 4. The Matrix of Descriptors (MoD) framework.
Ijerph 16 04748 g004
Figure 5. Excerpt of the MoD application (the MS Excel® software was used).
Ijerph 16 04748 g005
Figure 6. Scheme of the cluster analysis application.
Ijerph 16 04748 g006
Figure 7. Occupational injuries due to electric shock in Italy (data source: [54]).
Ijerph 16 04748 g007
Figure 8. MoD application.
Ijerph 16 04748 g008
Figure 9. Distribution of the 2-clusters solution (Euclidean distance from the centroid axis).
Ijerph 16 04748 g009
Figure 10. Results of the 2 clusters solution (values in red and green indicate the most relevant variables of each cluster).
Ijerph 16 04748 g010
Figure 11. Distribution of the 3-clusters solution (Euclidean distance from the centroid axis).
Ijerph 16 04748 g011
Figure 12. Variables′ values of the 3-clusters solution (values in red indicate the most relevant variables of each cluster).
Ijerph 16 04748 g012
Figure 13. Variables′ values of the 6-clusters solution (values in red indicate the most relevant variables).
Ijerph 16 04748 g013
Figure 14. The 3-clusters matrix for the definition of the centroids (values in green and red indicate the most relevant variables of each cluster).
Ijerph 16 04748 g014
Figure 15. Results of the 3-clusters solution with centroids (values in green and red indicate the most relevant variables of each cluster).
Ijerph 16 04748 g015
Table 1. Results of the statistical analysis of variables (descriptive statistics).
Variables NMinimumMaximumMeanDeviat.Variance
StatisticsStatisticsStatisticsStatisticsStand. ErrorStatisticsStatistics
x11970.0001.0000.020620.0145030.1428420.20
x12970.0001.0000.103090.0310350.3056600.093
x13970.0001.0000.567010.0505710.4980630.248
x14970.0001.0000.309280.0471730.4645970.216
x21970.0001.0000.670100.0479870.4726180.223
x22970.0001.0000.298970.0467250.4601840.212
x23970.0001.0000.030930.0176690.1740220.030
x31970.0001.0000.474230.0509630.5019290.252
x32970.0001.0000.329900.0479870.4726180.223
x33970.0001.0000.185570.0396770.3907760.153
x34970.0001.0000.010310.0103090.1015350.010
x41970.0001.0000.824740.0388030.3821620.146
x42970.0001.0000.175260.0388030.3821620.146
Valid (listwise)97

