1. Introduction
The development of mining in Mexico has had a high impact on the environment. This activity, which has been the economic basis for the foundation of several communities, unfortunately it also generated a large amount of liquid, solid and gaseous wastes, mainly in form of sewage, gas, and slags [
1]. The most common potentially toxic elements (PTE) derived from mining activities are lead (Pb), cadmium (Cd), zinc (Zn), arsenic (As), selenium (Se), and mercury (Hg) [
2]. The PTE do not decompose through the processes of natural degradation, they have low mobility in soil, so they are accumulate over time [
3]. The presence of metals in soil represents a risk for human health, since metal ions can be absorbed through inhalation of dust and food intake [
4]. Previous studies have revealed that human exposure to high concentrations of some soluble heavy metals affects the central nervous system and may also disrupt the functioning of some organs [
5,
6]. Studies performed on dams in Chihuahua City reported high concentrations of heavy metals in fishes, an important bioindicator of their presence in the local abiotic environment and representing a health risk due to their ingestion [
7,
8].
Currently, mining is considered as one of the most important sources of contamination of heavy metals and metalloids [
9]. Determining the spatial distribution of heavy metals could establish the basis for risk assessment in human health and support the development of environmental-urban management policies [
10], however, there are constraints in the number of samples, for which the estimation of values in non-sampled areas (interpolation) becomes necessary [
11]. Depending on the type of analyzed data, cost and accessibility of the site, it is determined how valuable the interpolation is [
12,
13,
14]. Data interpolation offers the advantage of projecting maps or continuous surfaces, however, the amount of data in the studied area could limit its use [
11]. Geostatistics is an efficient method for the study of the allocation of spatial characteristics of the soil and its spatial variation [
12,
13]. The use of deterministic and geostatistical techniques in the description of the distribution of metals and metalloids has been demonstrated by other researchers [
14,
15,
16].
Robinson and Metternicht [
17] used three different techniques, including kriging (geostatistical method), radial basis function (RBF), and inverse distance weighted (IDW), both deterministic, for surface estimation of salinity, acidity, and organic matter in soil. Pang et al. (2011) [
18] reported that Ordinary Kriging (OK) is the most common type of Kriging in practice and provides a better estimate of soil properties. The use of interpolation methods (IDW, OK, and RBF) leads to the search for the most appropriate for the spatial estimation of metals in soil.
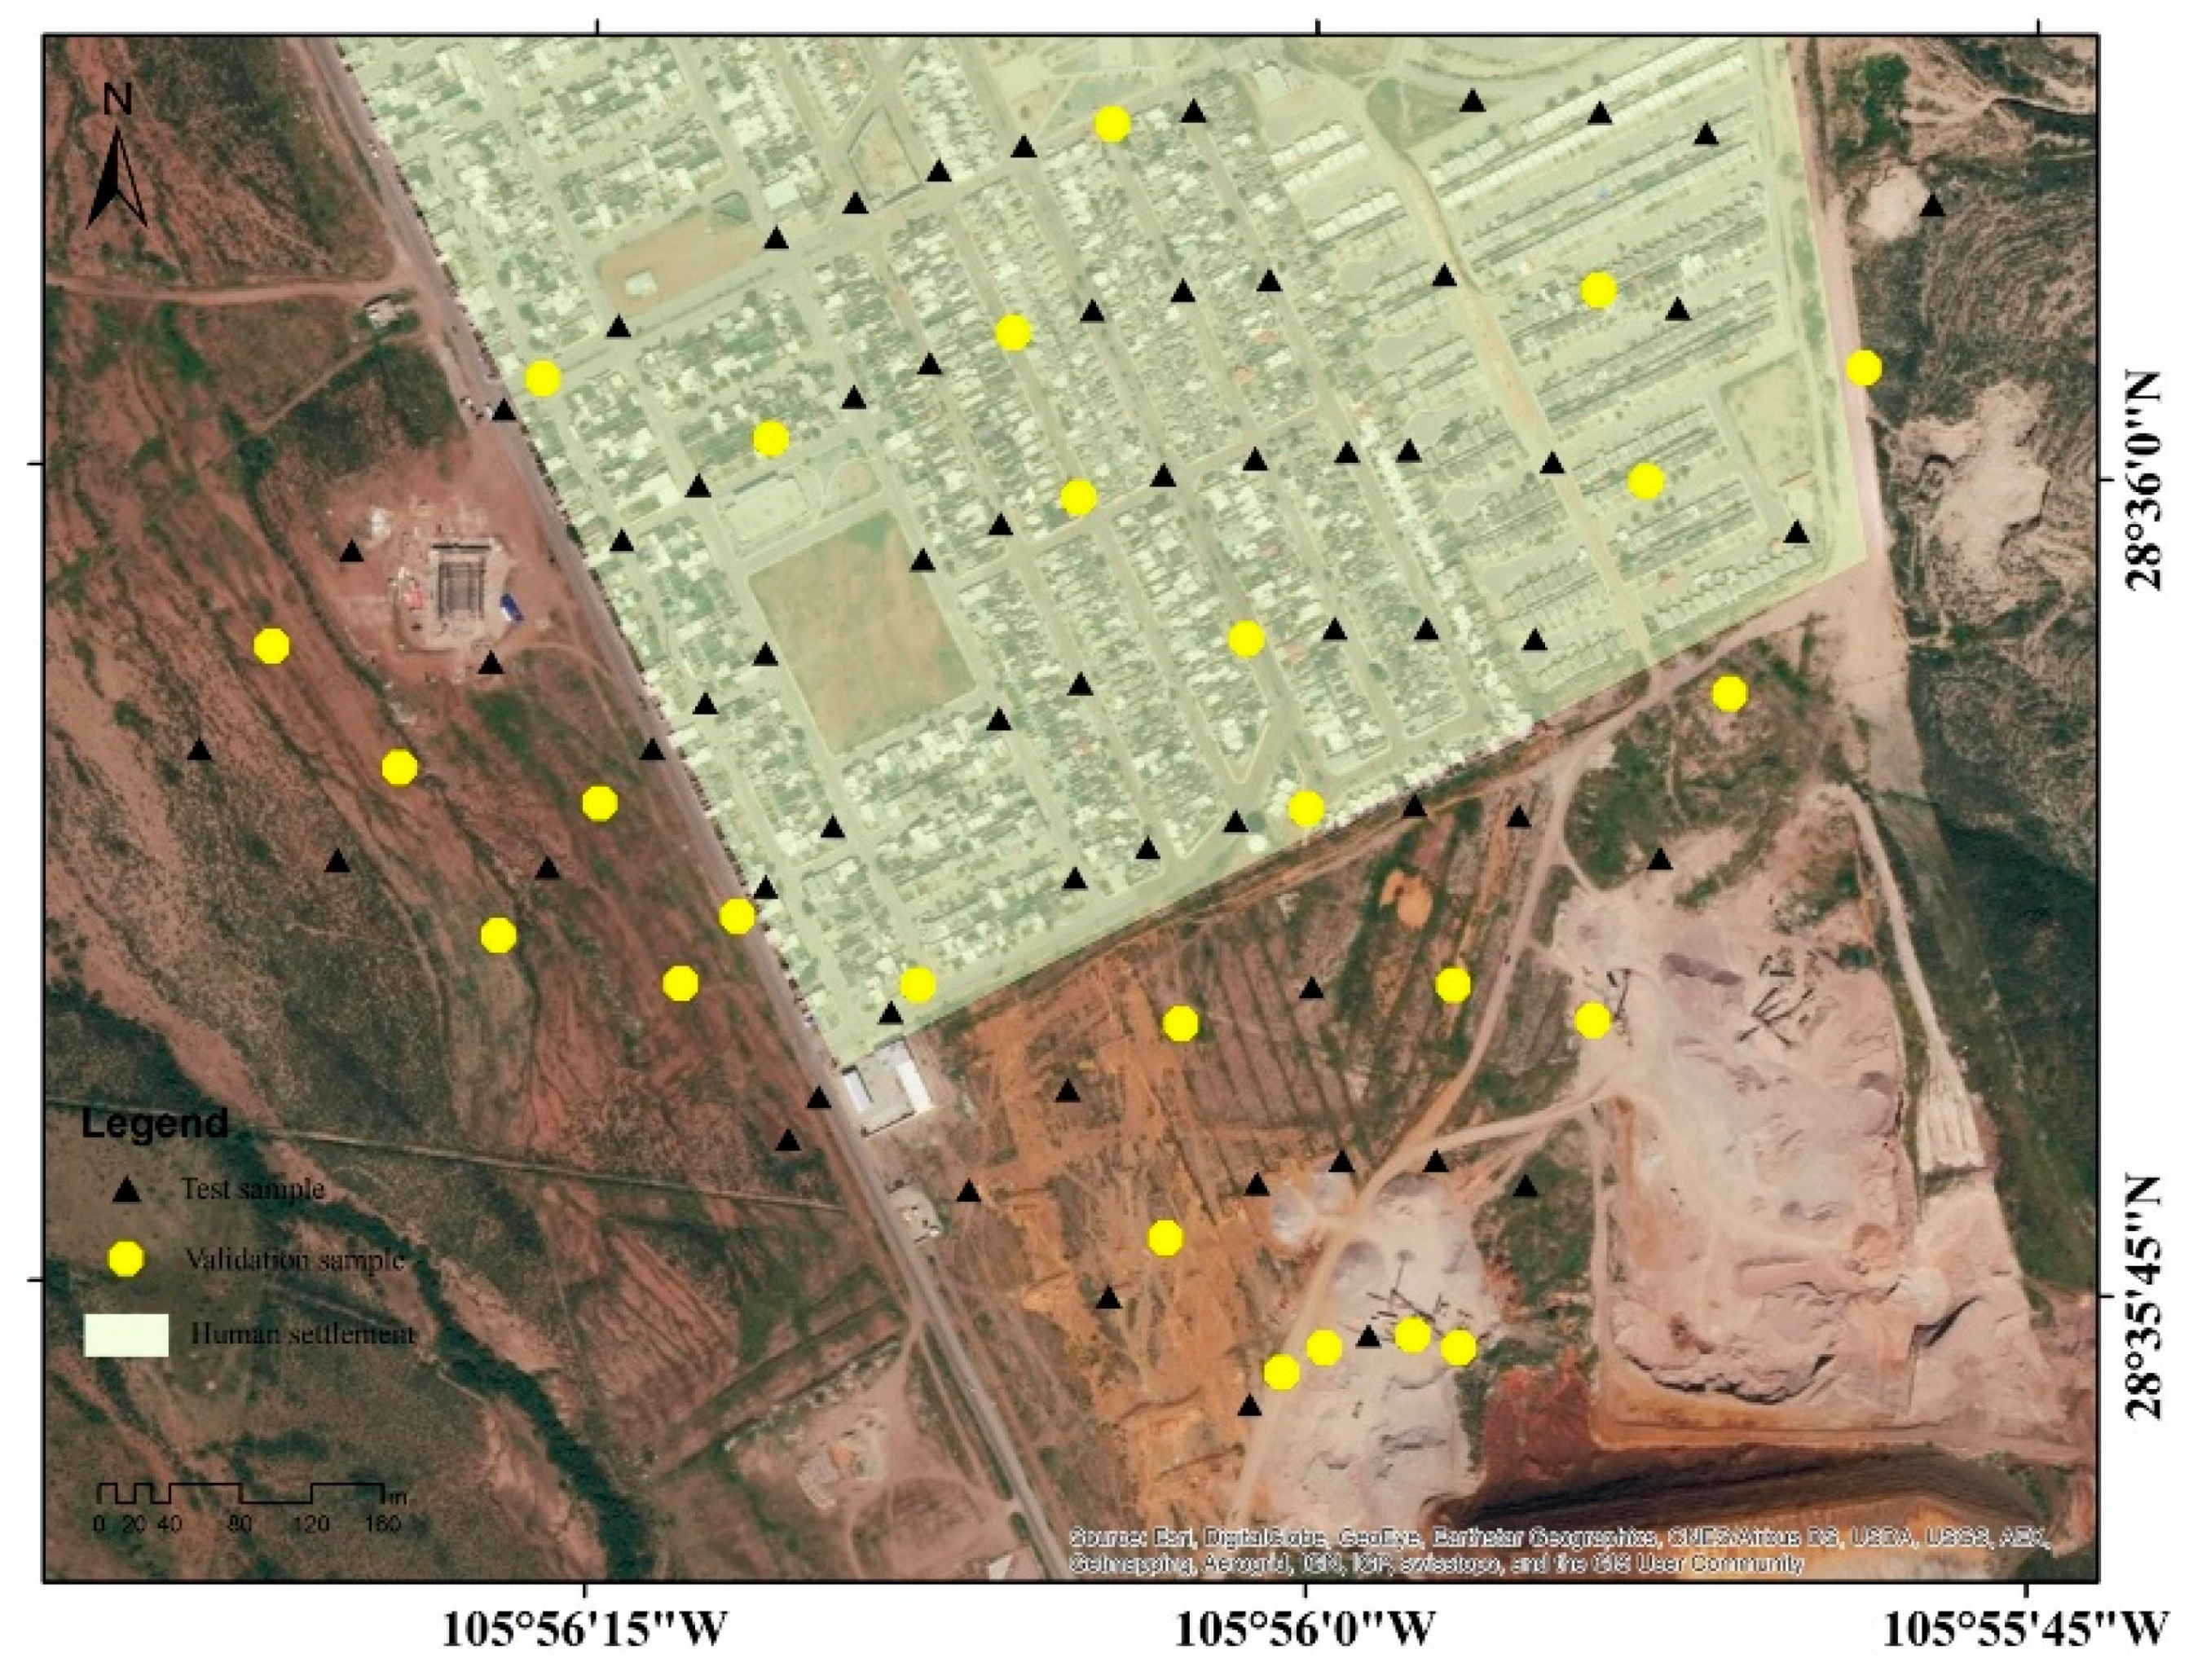
Due to this, the objective of this research was to compare the IDW, OK and RBF interpolation techniques using geographic information systems (GIS), to estimate and map the spatial distribution of As in the settlement Laderas de San Guillermo adjacent to a site with mining wastes in the municipality of Aquiles Serdán, Chihuahua, Mexico. Cross-validation will be applied to evaluate the best greatest fit com-pared to field data. The information derived from this study will be useful for the generation of urban-environmental policies focused on disease prevention by metals and metalloids. The mapping of the present research will be evidence to demonstrate the existence of the distribution of As in the residential area.
4. Discussion
Soil and dust are important components in the housing environment and, therefore, have the most significance in the effects of human health. Exposure to As could cause harmful effects to human health, such as skin lesions, cardiovascular diseases, and metabolic disorders [
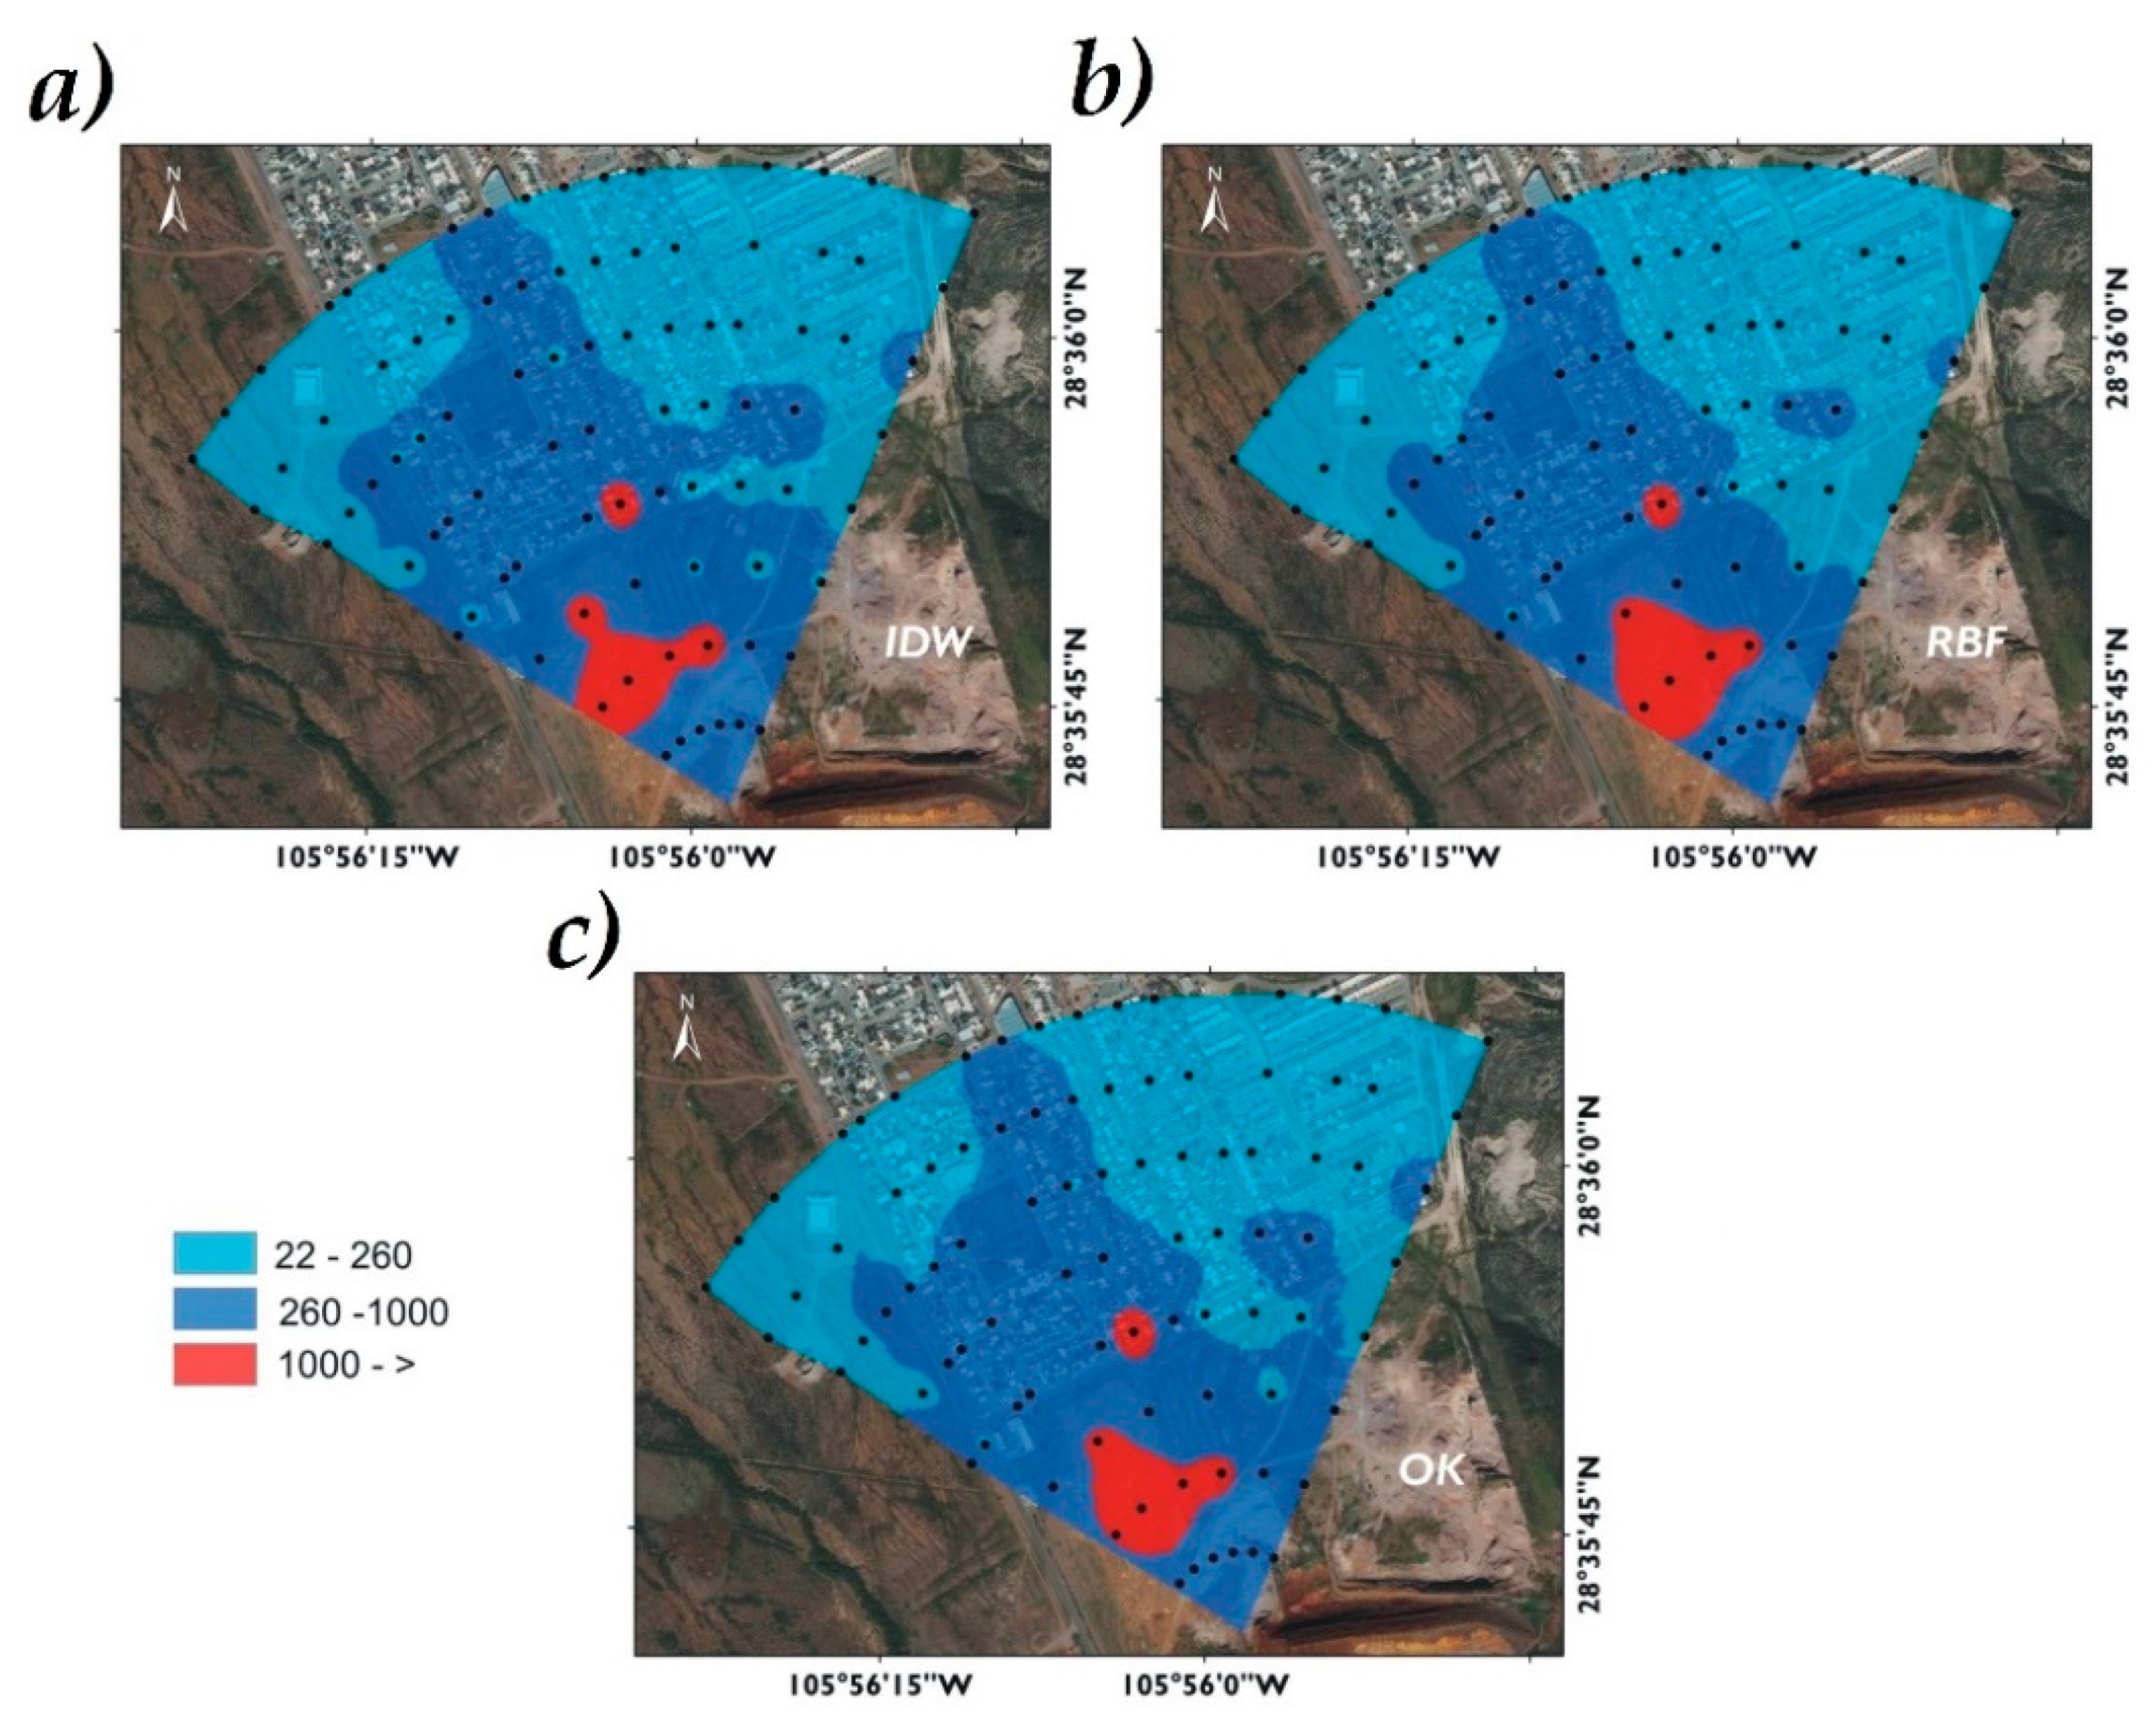
34]. The spatial distribution suggests the control of high concentrations of the metalloid (up to 2190 mg As/kg) in the neighborhood of the deposit of mining residues, marking this zone as the area with the highest concentration of As. The southern zone of the housing complex also has high concentrations of As (from 22 to 1000 mg As/kg) indicating that the slope and direction of the wind is strongly associated with the distribution [
39]. The lowest concentration of As was presented in the northern part of the housing complex, which match with the assumption related to be the farthest from the waste zone, however, it is worrying that these As concentrations exceed the reference levels for land use. The As dispersion is primarily caused by rain runoff due to slopes and wind transport in the direction from south to north [
35].
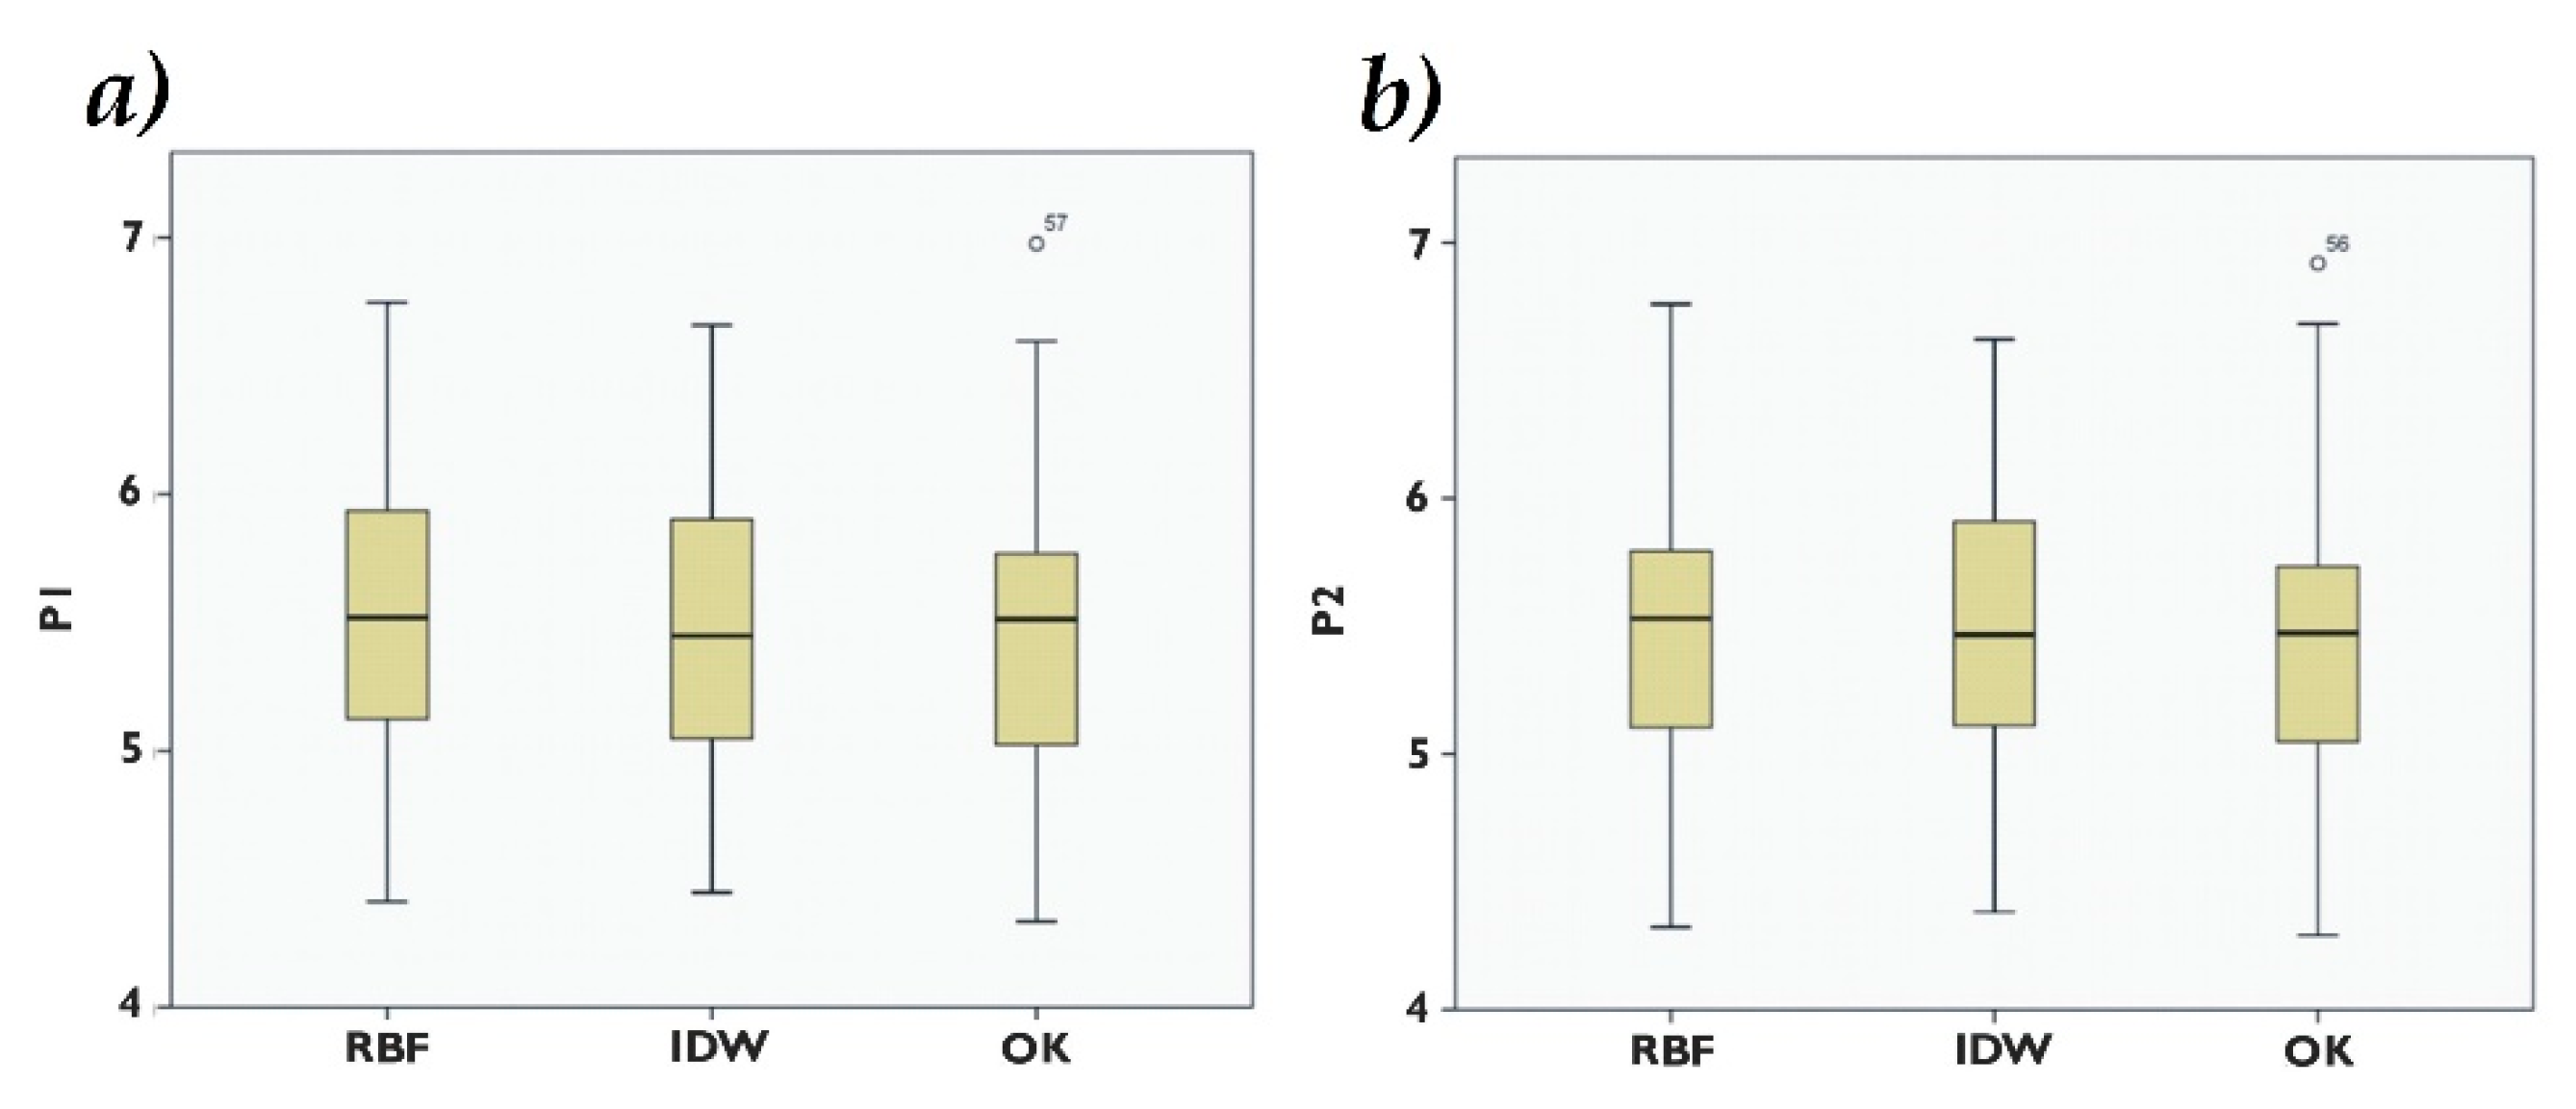
Descriptive statistics expressed that in P1, the model with the best evaluation indicators was IDW, with the smallest variance, good precision and the highest correlation between estimated and observed values (p < 0.0001). In this test, RBF the model with more precision showed values very close to those of IDW in variance and correlation. In P1, KO was not the best in the precision parameters of RMSE, E (%), Ceff, and R2, however, the spatial distribution of the error shows surfaces in yellow very similar to RBF. In P2 the model with the highest precision and correlation was OK, nevertheless it was the one that presented greater variance; IDW presented a small variance and high precision and correlation values.
In general, with correlation tests, a high correlation was determined between models per test, however, a different behavior was observed between tests, which is according to how the experimental data are removed to run the model. Additionally, IDW and RBF are easier to use because they require fewer input parameters. In contrast, OK is more difficult to use. The typical OK includes several stages, such as statistical testing, data transformation, spatial structural analysis, and semivariogram function [
40].
The error maps showed a high degree of error, on the northwest side (lowest As values). This could be due to the fact that in the zone with high concentrations of As can be present in a punctual way or the edge effect that affected the three methods of interpolation. The difference between tests (P1–P2) shows that OK best estimates the As(ln) values with less data (P2), in comparison to IDW and RBF. A higher data density can explain the superiority of RBF and IDW in P1. This shows that OK is better interpolator with a lower density of randomly distributed data, therefore, it is of greater use for the data simulation when the sampling and analysis is costly in the whole area, such is the case of As.
Bhunia et al. (2016) [
10] compared interpolators for organic carbon in soil using IDW and RBF, in such research they found that the IDW method was better in regards to RBF among others. In a research by Fortis-Hernández et al. (2010) [
41] about the dispersion of nitrate and ammonium in soil, the IDW method turned out to be the most significant, followed by RBF in comparison to OK. Mueller et al. (2001) [
42] compared IDW and OK in the analysis of pH, P, K, Ca, and Mg, concluding that IDW was a better option than OK, in data lacking spatial structure. Robinson and Metternicht [
17] compared the IDW, OK, and splines methods in the estimation of subsoil pH, soil pH, electrical conductivity, and organic matter. They found that IDW was better at interpolating subsoil pH, OK was better interpolator in surface soil for pH, while organic matter and electrical conductivity were better interpolated with splines. These comparisons with other types of soil elements show the great variability in the accuracy of interpolation methods. Yan et al. (2015) [
43] tested the performance of the Kriging interpolator, finding that the mine activity had no influence in the contiguous zones. Chaoyang et al. (2009) [
44] used the IDW and kriging interpolators and Fu and Wei [
45] the kriging interpolator finding that high concentrations of heavy metals come from mining settlements, which is consistent with our findings.
The efficiency of pollution assessment depends on the accurate mapping of metals and metalloids. The factors that affect accuracy are the number of samples, the distance between the sampling points and the sampling method [
46]. Generally, higher sampling density would produce more accurate contamination mapping of heavy metals [
42]. However, due to the cost and time of the sampling as well as the analysis cost of the samples, a high sampling density is impractical [
40].
With the error mapping, although the results showed few differences, it was possible to show the performance of the interpolation methods. This highlights the importance of verifying the results in a descriptive and spatial way to know the performance of the methods of interpolation [
47]. In comparison with other studies [
43,
48,
49,
50], only the result of the spatial distribution of the variables under study is mapped, however, the mapping of uncertainty is essential to know the viability of the application of interpolation methods. Before proposing risk strategies it is important that the error mapping be verified as subsequent efforts may be poorly focused on the space and surface.
The increase in population, the demand for residential buildings [
51], and the introduction of industries in areas with soils contaminated by mining waste pose a major health risk. This study tests the proximity and movement of arsenic in the human settlements of Aquiles Serdán. The interpolation maps are the basis for making decisions to minimize the health risk to the population.
Due to this, it is recommended to continue working with interpolation methods at these scales, for the management of the urban environment versus the As and other metals contamination. It is important to continue working with interpolation methods, nevertheless for the tests revealed in this research it is recommended to work at the submethod level of the interpolator and to verify the existence of significant differences between methods
5. Conclusions
The high environmental contamination of As present in soil of the studied housing area indicates a high dispersion of this metalloid presented in the mining wastes of the research area. The largest concentration of As is located in the southern part of the housing area, the one closest to the mining wastes. Waste deposits constitute a high risk for public health that must be addressed immediately, because if the contaminants dispersion in the area is not minimized, the health risk of the exposed population remains latent as the main routes of exposure: Inhalation of fine particles of airborne mining wastes, and particles suspended by vehicular traffic, as well as contaminated soil and dust intake.
Clear understanding of the distribution, extent and direction of As is the key in assessing the dispersion of such contaminant. As dispersion with the different interpolation methods IDW, OK, RBF was represented with similarities between them. The three methods enclosed the same area with higher As concentration and had minimal variation in the other classifications. Statistic data demonstrated that IDW was more precise in P1, and KO in the P2. Thus, the accuracy of the models could differ depending of the way of run the data. Although, differences between the models were not wide. The incorporation of more parameters, such as concentration of other metals, topography, soil type, and geology, among others, would be of interest to observe the behavior of interpolation methods.


 ,
, 


