Determinants of Diet and Physical Activity in Malaysian Adolescents: A Systematic Review

 ,
,
Abstract
:1. Introduction
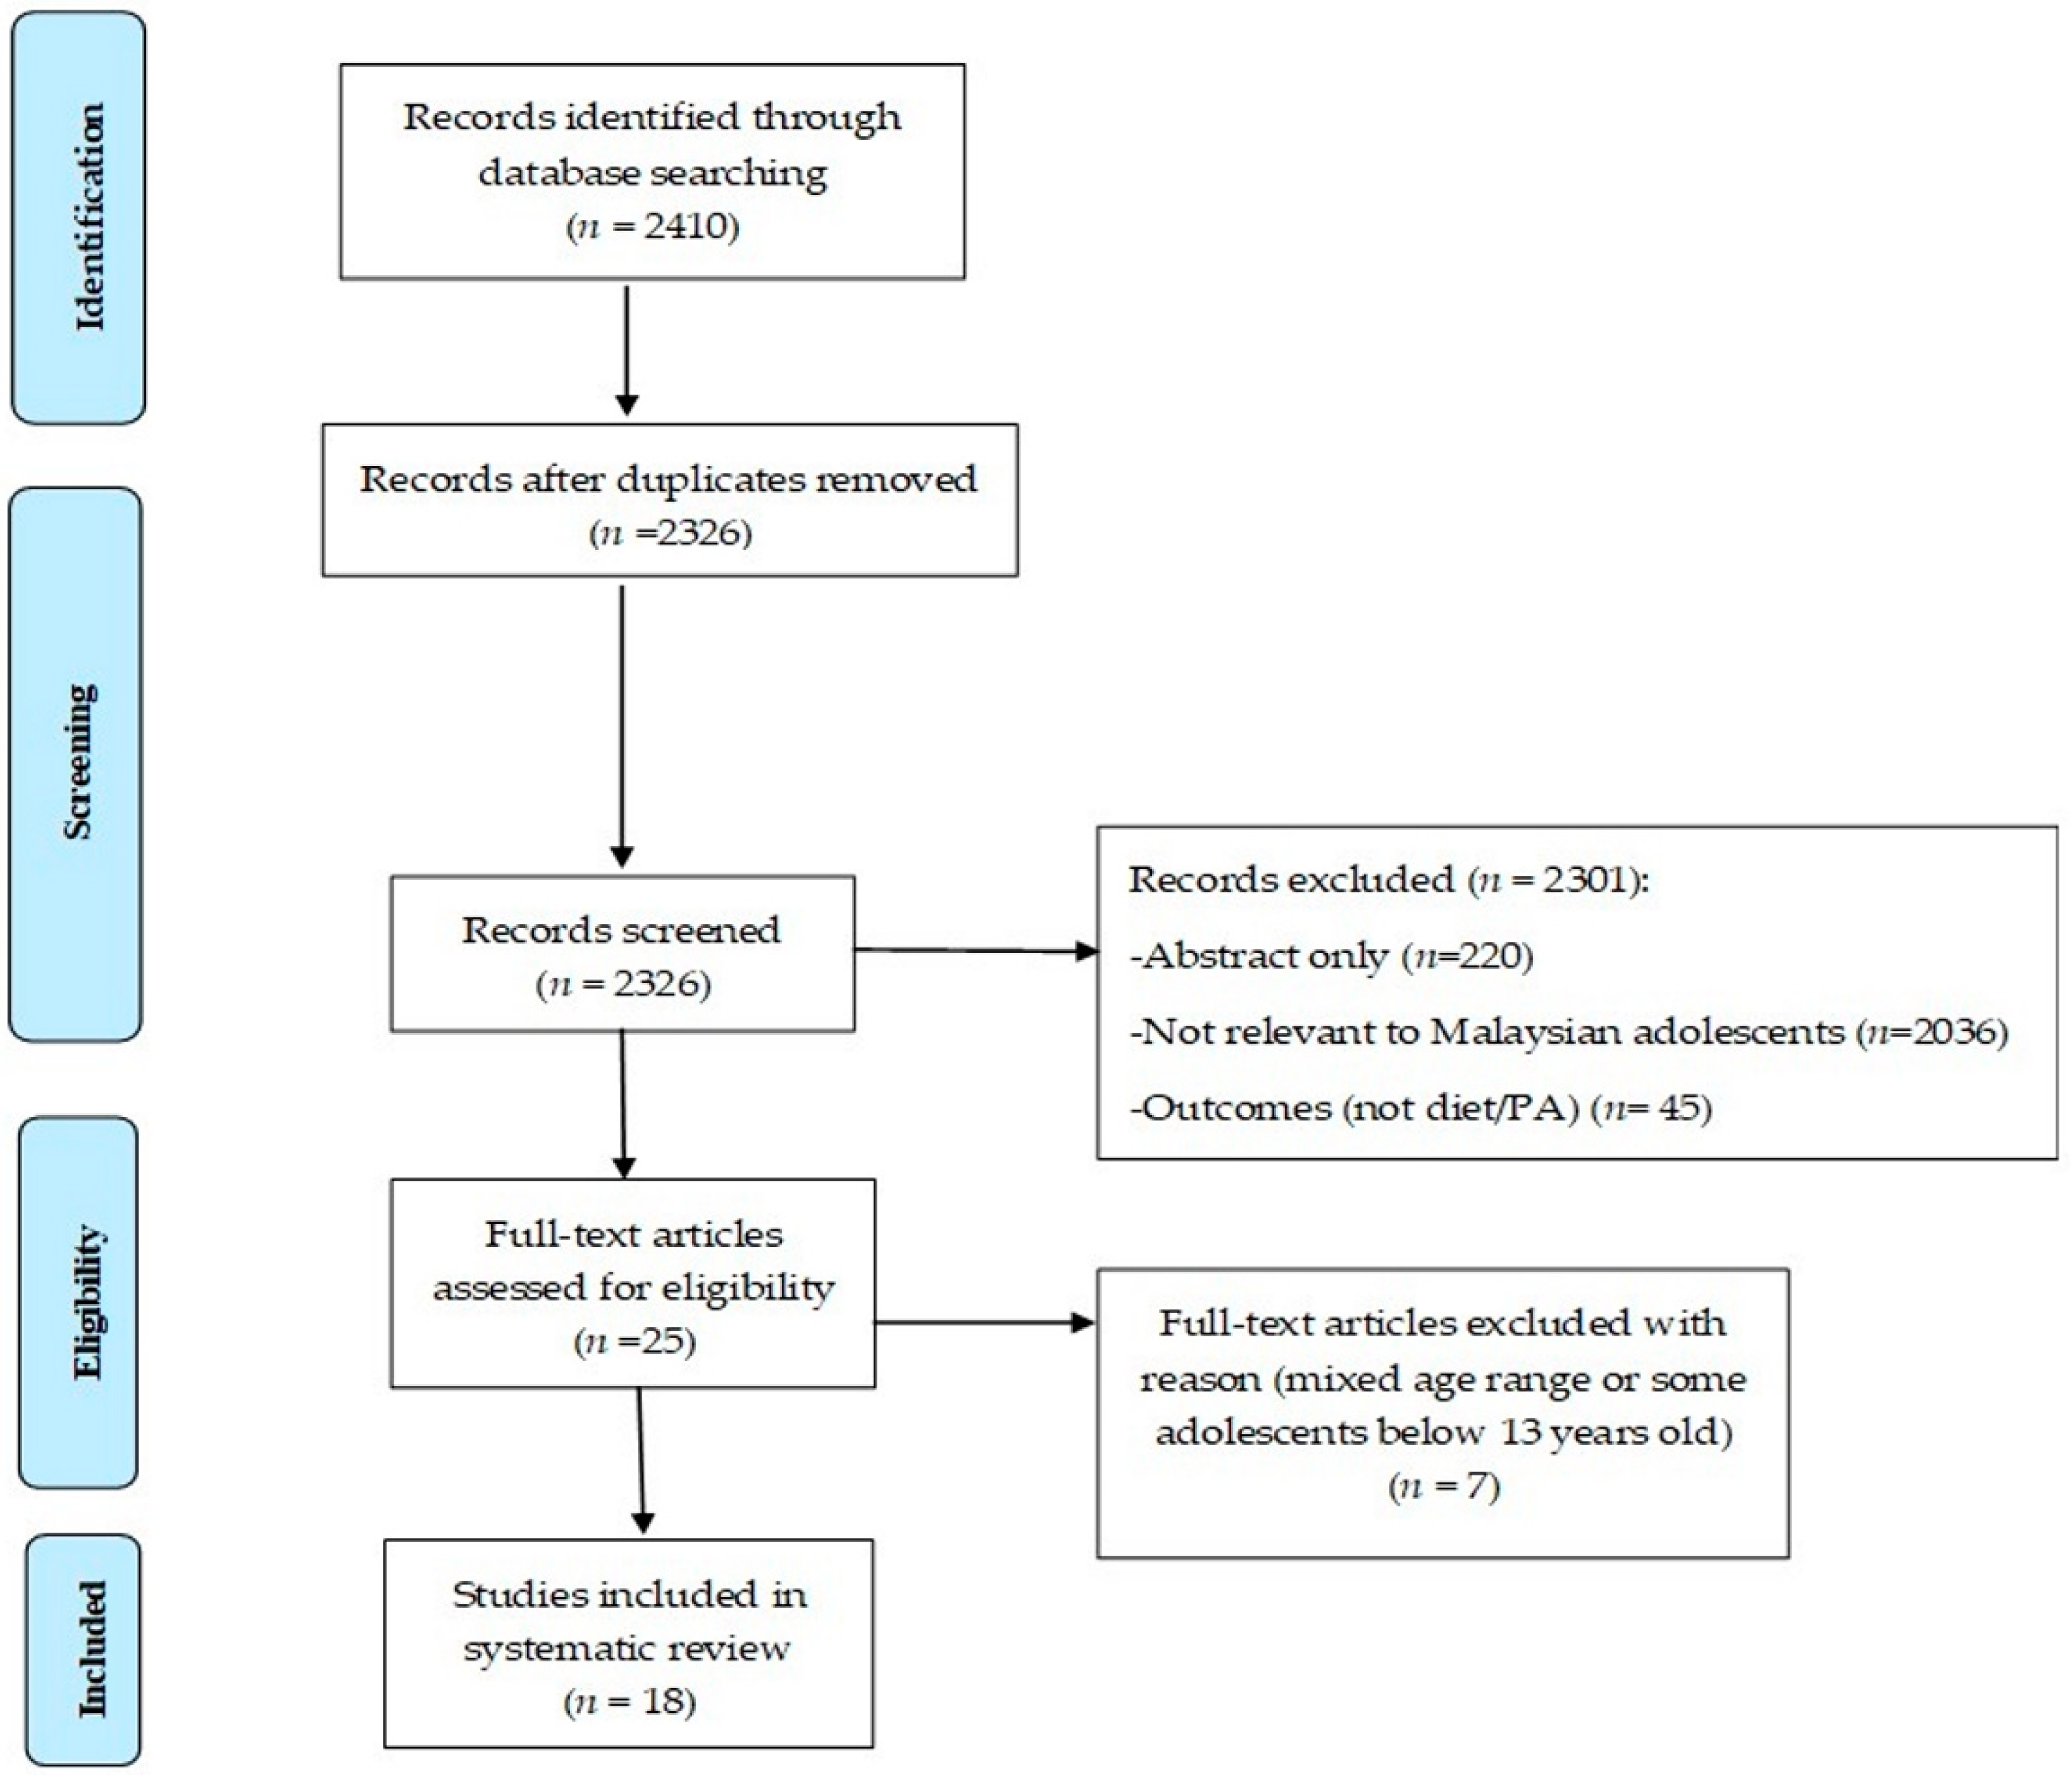
2. Methods
2.1. Literature Search
2.2. Selection of Studies
2.3. Quality Assessment
2.4. Data Extraction
2.5. Data Synthesis
3. Results
3.1. Dietary Determinants of Dietary Behaviours
3.1.1. Energy and Nutrients
3.1.2. Foods
3.2. Physical Activity Determinants of Physical Activity Behaviours
3.2.1. Demographic Determinants of Physical Activity
3.2.2. Physical-Environmental Determinants of Physical Activity
3.2.3. Social-Environmental Determinants of Physical Activity
3.2.4. Behavioural Determinants of Physical Activity
4. Discussion
4.1. Limitations
4.2. Recommendations for Further Research
5. Conclusions
Supplementary Materials
Author Contributions
Funding
Acknowledgments
Conflicts of Interest
References
- Smetanina, N.; Albaviciute, E.; Babinska, V.; Karinauskiene, L.; Albertsson-Wikland, K.; Petrauskiene, A.; Verkauskiene, R. Prevalence of overweight/obesity in relation to dietary habits and lifestyle among 7–17 years old children and adolescents in Lithuania. BMC Public Health 2015, 15, 1001. [Google Scholar] [CrossRef] [Green Version]
- Leech, R.M.; McNaughton, S.A.; Timperio, A. The clustering of diet, physical activity and sedentary behavior in children and adolescents: A review. Int. J. Behav. Nutr Phys. Act. 2014, 11, 4. [Google Scholar] [CrossRef] [PubMed]
- Mistry, S.K.; Puthussery, S. Risk factors of overweight and obesity in childhood and adolescence in South Asian countries: A systematic review of the evidence. Public Health 2015, 129, 200–209. [Google Scholar] [CrossRef] [PubMed]
- Pearson, N.; Biddle, S.J. Sedentary behavior and dietary intake in children, adolescents, and adults: A systematic review. Am. J. Prev. Med. 2011, 41, 178–188. [Google Scholar] [CrossRef] [PubMed]
- Ambrosini, G.L.; Emmett, P.M.; Northstone, K.; Howe, L.D.; Tilling, K.; Jebb, S.A. Identification of a dietary pattern prospectively associated with increased adiposity during childhood and adolescence. Int. J. Obes. 2012, 36, 1299. [Google Scholar] [CrossRef] [PubMed]
- Larson, N.I.; Neumark-Sztainer, D.; Hannan, P.J.; Story, M. Trends in adolescent fruit and vegetable consumption, 1999–2004: Project EAT. Am. J. Prev. Med. 2007, 32, 147–150. [Google Scholar] [CrossRef] [PubMed]
- Moreno, L.A.; Rodriguez, G.; Fleta, J.; Bueno-Lozano, M.; Lazaro, A.; Bueno, G. Trends of dietary habits in adolescents. Crit. Rev. Food Sci. Nutr. 2010, 50, 106–112. [Google Scholar] [CrossRef]
- Bauer, K.W.; Larson, N.I.; Nelson, M.C.; Story, M.; Neumark-Sztainer, D. Fast food intake among adolescents: Secular and longitudinal trends from 1999 to 2004. Prev. Med. 2009, 48, 284–287. [Google Scholar] [CrossRef]
- Kerr, M.A.; Rennie, K.L.; McCaffrey, T.A.; Wallace, J.M.; Hannon-Fletcher, M.P.; Livingstone, M.B.E. Snacking patterns among adolescents: A comparison of type, frequency and portion size between Britain in 1997 and Northern Ireland in 2005. Br. J. Nutr. 2008, 101, 122–131. [Google Scholar] [CrossRef]
- Abdel-Megeid, F.Y.; Abdelkarem, H.M.; El-Fetouh, A.M. Unhealthy nutritional habits in university students are a risk factor for cardiovascular diseases. Saudi Med. J. 2011, 32, 621–627. [Google Scholar]
- Barnes, A.S. Obesity and sedentary lifestyles: Risk for cardiovascular disease in women. Tex. Heart Inst. J. 2012, 39, 224. [Google Scholar] [PubMed]
- Scaglioni, S.; De Cosmi, V.; Ciappolino, V.; Parazzini, F.; Brambilla, P.; Agostoni, C. Factors influencing children’s eating behaviours. Nutrients 2018, 10, 706. [Google Scholar] [CrossRef] [PubMed]
- Krølner, R.; Rasmussen, M.; Brug, J.; Klepp, K.I.; Wind, M.; Due, P. Determinants of fruit and vegetable consumption among children and adolescents: A review of the literature. Part II: Qualitative studies. Int. J. Behav. Nutr. Phys. Act. 2011, 8, 112. [Google Scholar]
- Epuru, S.; Eideh, A.A.; Alshammari, E. Fruit and vegetable consumption trends among the female university students in Saudi Arabia. Eur Sci J. 2014, 10, 223–237. [Google Scholar]
- Pearson, N.; Biddle, S.J.; Gorely, T. Family correlates of fruit and vegetable consumption in children and adolescents: A systematic review. Public Health Nutr. 2009, 12, 267–283. [Google Scholar] [CrossRef] [PubMed]
- World Health Organization. Global Health Risks: Mortality and Burden of Disease Attributable to Selected Major Risks–Geneva WHO. 2009. Available online: http://www.who.int/healthinfo /global_burden_disease/GlobalHealthRisks_report_full.pdf (assessed on 15 February 2010).
- Biddle, S.J.; Pearson, N.; Ross, G.M.; Braithwaite, R. Tracking of sedentary behaviours of young people: A systematic review. Prev. Med. 2010, 51, 345–351. [Google Scholar] [CrossRef] [PubMed] [Green Version]
- Arundell, L.; Fletcher, E.; Salmon, J.; Veitch, J.; Hinkley, T. A systematic review of the prevalence of sedentary behavior during the after-school period among children aged 5–18 years. Int. J. Behav. Med. 2016, 13, 93. [Google Scholar] [CrossRef]
- Stierlin, A.S.; De Lepeleere, S.; Cardon, G.; Dargent-Molina, P.; Hoffmann, B.; Murphy, M.H.; Kennedy, A.; O’donoghue, G.; Chastin, S.F.; De Craemer, M. A systematic review of determinants of sedentary behaviour in youth: A DEDIPAC-study. Int. J. Behav. Med. 2015, 12, 133. [Google Scholar] [CrossRef]
- Smith, J.J.; Eather, N.; Morgan, P.J.; Plotnikoff, R.C.; Faigenbaum, A.D.; Lubans, D.R. The health benefits of muscular fitness for children and adolescents: A systematic review and meta-analysis. Sports Med. 2014, 44, 1209–1223. [Google Scholar] [CrossRef]
- Janssen, I.; LeBlanc, A.G. Systematic review of the health benefits of physical activity and fitness in school-aged children and youth. Int. J. Behav. Nutr. Phys. Act 2010, 7, 40. [Google Scholar] [CrossRef] [Green Version]
- Corder, K.; Winpenny, E.; Love, R.; Brown, H.E.; White, M.; van Sluijs, E. Change in physical activity from adolescence to early adulthood: A systematic review and meta-analysis of longitudinal cohort studies. Br. J. Sports Med. 2017, 1–9. [Google Scholar] [CrossRef]
- Telama, R. Tracking of physical activity from childhood to adulthood: A review. Obes. Facts 2009, 2, 187–195. [Google Scholar] [CrossRef] [PubMed]
- Currie, C.; Molcho, M.; Boyce, W.; Holstein, B.; Torsheim, T.; Richter, M. Researching health inequalities in adolescents: The development of the Health Behaviour in School-Aged Children (HBSC) family affluence scale. Soc. Sci Med. 2008, 66, 1429–1436. [Google Scholar] [CrossRef] [PubMed]
- Kahn, J.A.; Huang, B.; Gillman, M.W.; Field, A.E.; Austin, S.B.; Colditz, G.A.; Frazier, A.L. Patterns and determinants of physical activity in US adolescents. J. Adolesc. Health 2008, 42, 369–377. [Google Scholar] [CrossRef] [PubMed]
- Dumith, S.C.; Gigante, D.P.; Domingues, M.R.; Kohl, H.W. Physical activity change during adolescence: A systematic review and a pooled analysis. Int J. Epidemiol. 2011, 40, 685–698. [Google Scholar] [CrossRef]
- Abdul Majid, H.; Amiri, M.; Azmi, N.M.; Su, T.T.; Jalaludin, M.Y.; Al-Sadat, N. Physical activity, body composition and lipids changes in adolescents: Analysis from the MyHeART Study. Sci. Rep. 2016, 6, 30544. [Google Scholar] [CrossRef] [PubMed]
- DOSM (Department of Statistics, Malaysia). Statistics Yearbook Malaysia 2011; Department of Statistics Malaysia: Kuala Lumpur, Malaysia, 2012.
- Rampal, G.; Sidik, S.M.; Rampal, S.; Wong, D.Y.J.; Chow, P.L.; Liew, J.S.; Shum, Y.S. Prevalence of overweight among secondary school students in Klang district, Selangor. Malays. J. Nutr. 2007, 13, 1–8. [Google Scholar]
- Morton, K.; Atkin, A.; Corder, K.; Suhrcke, M.; Van Sluijs, E. The school environment and adolescent physical activity and sedentary behaviour: A mixed-studies systematic review. Obes. Rev. 2016, 17, 142–158. [Google Scholar] [CrossRef] [PubMed]
- Chin, Y.; Mohd Nasir, M. Eating behaviors among female adolescents in Kuantan district, Pahang, Malaysia. Pak. J. Nutr. 2009, 8, 425–432. [Google Scholar] [CrossRef]
- Nik Farid, D.N.; Yahya, A.; Al-Sadat, N.; Dahlui, M.; Su, T.T.; Thangiah, N.; Jalaludin, M.Y.; Abdul Majid, H.; MyHeART Study Group. High-Risk Behavior Among Young Adolescents in The Central and Northern Region of Peninsular Malaysia: Baseline Data from The MyHeART Study. J. Child Fam. Stud. 2016, 25, 3204–3213. [Google Scholar] [CrossRef]
- Wells, G.A.; Shea, B.; O’connell, D.; Peterson, J.; Welch, V.; Losos, M.; Tugwell, P. The Newcastle-Ottawa Scale (NOS) for Assessing the Quality of Nonrandomised Studies in Meta-Analyses. Available online: http://www.ohri.ca/programs/clinical_epidemiology/oxford.asp (assessed on 25 April 2016).
- Abdullah, N.-F.; Teo, P.S.; Foo, L.H. Ethnic Differences in the Food Intake Patterns and Its Association Factors of Adolescents in Malaysia. Nutrients 2016, 8, 551. [Google Scholar] [CrossRef] [PubMed]
- Rezali, F.W.; Chin, Y.S.; Mohd Shariff, Z.; Yusof, M.; Nisak, B.; Sanker, K.; Woon, F.C. Evaluation of diet quality and its associated factors among adolescents in Kuala Lumpur, Malaysia. Nutr. Res. Pract. 2015, 9, 511–516. [Google Scholar] [CrossRef]
- Loh, D.; Moy, F.; Zaharan, N.; Jalaludin, M.; Mohamed, Z. Sugar-sweetened beverage intake and its associations with cardiometabolic risks among adolescents. Pediatr. Obes. 2017, 12, e1–e5. [Google Scholar] [CrossRef] [PubMed]
- Nurul-Fadhilah, A.; Teo, P.S.; Huybrechts, I.; Foo, L.H. Infrequent breakfast consumption is associated with higher body adiposity and abdominal obesity in Malaysian school-aged adolescents. PLoS ONE 2013, 8, e59297. [Google Scholar] [CrossRef] [PubMed]
- Teo, P.S.; Nurul-Fadhilah, A.; Aziz, M.E.; Hills, A.P.; Foo, L.H. Lifestyle practices and obesity in Malaysian adolescents. Int. J. Environ. Res. Public Health 2014, 11, 5828–5838. [Google Scholar] [CrossRef] [PubMed]
- Boon, T.Y.; Sedek, R.; Kasim, Z.M. Association between snacking patterns, energy and nutrient intakes, and body mass index among school adolescents in Kuala Lumpur. Am. J. Food Nutr. 2012, 2, 69–77. [Google Scholar] [CrossRef]
- Baharudin, A.; Zainuddin, A.A.; Manickam, M.A.; Ambak, R.; Ahmad, M.H.; Naidu, B.M.; Cheong, S.M.; Ying, C.Y.; Saad, H.A.; Ahmad, N.A. Factors associated with physical inactivity among school-going adolescents: Data from the Malaysian School-Based Nutrition Survey 2012. Asia Pac. J. Public Health 2014, 26, 27S–35S. [Google Scholar] [CrossRef]
- Aniza, I.; Fairuz, M. Factors influencing physical activity level among secondary school adolescents in Petaling District, Selangor. Med. J. Malays. 2009, 64, 228–232. [Google Scholar]
- Dan, S.; Mohd, N.; Zalilah, M. Determination of factors associated with physical activity levels among adolescents attending school in Kuantan, Malaysia. Malays. J. Nutr. 2011, 17, 175–817. [Google Scholar]
- Farah Wahida, Z.; Mohd Nasir, M.; Hazizi, A. Physical activity, eating behaviour and body image perception among young adolescents in Kuantan, Pahang, Malaysia. Malays. J. Nutr. 2011, 17, 325–336. [Google Scholar]
- Cheah, Y.K.; Lim, H.K.; Kee, C.C.; Ghazali, S.M. Factors associated with participation in physical activity among adolescents in Malaysia. Int. J. Adolesc. Med. Health 2016, 28, 419–427. [Google Scholar] [CrossRef]
- Abd-Latif, R.; Nor, M.M.; Omar-Fauzee, M.S.; Ahmad, A.R.; Karim, F. Influence of physical environment towards leisure time physical activity (LTPA) among adolescents. Procedia Soc. Behav. Sci. 2012, 38, 234–242. [Google Scholar] [CrossRef]
- Cheah, W.L.; Chang, C.T.; Saimon, R. Environment factors associated with adolescents’ body mass index, physical activity and physical fitness in Kuching South City, Sarawak: A cross-sectional study. Int. J. Adolesc. Med. Health 2012, 24, 331–337. [Google Scholar] [CrossRef]
- Su, T.T.; Sim, P.Y.; Nahar, A.M.; Abdul Majid, H.; Murray, L.J.; Cantwell, M.M.; Al-Sadat, N.; Jalaludin, M.Y. Association between self-reported physical activity and indicators of body composition in Malaysian adolescents. Prev. Med. 2014, 67, 100–105. [Google Scholar] [CrossRef]
- Abdul Majid, H.; Ramli, L.; Ying, S.P.; Su, T.T.; Jalaludin, M.Y.; Mohsein, N.A.-S.A. Dietary intake among adolescents in a middle-income country: An outcome from the Malaysian health and adolescents longitudinal research team study (the MyHeARTs Study). PLoS ONE 2016, 11, e0155447. [Google Scholar] [CrossRef]
- Cynthia, J.; Zalilah, M.S.; Lim, M.Y. Relationship between family meals away from home and nutritional status of adolescents. Malays. J. Nutr. 2013, 19, 25–35. [Google Scholar]
- Biddle, S.J.; Atkin, A.J.; Cavill, N.; Foster, C. Correlates of physical activity in youth: A review of quantitative systematic reviews. Int. Rev. Sport Exerc. Psychol. 2011, 4, 25–49. [Google Scholar] [CrossRef]
- Van Der Horst, K.; Oenema, A.; Ferreira, I.; Wendel-Vos, W.; Giskes, K.; van Lenthe, F.; Brug, J. A systematic review of environmental correlates of obesity-related dietary behaviors in youth. Health Educ. Res. 2006, 22, 203–226. [Google Scholar] [CrossRef] [Green Version]
- Jodhun, B.M.; Pem, D.; Jeewon, R. A systematic review of factors affecting energy intake of adolescent girls. Afr. Health Sci. 2016, 16, 910–922. [Google Scholar] [CrossRef]
- Gilbert, P.A.; Khokhar, S. Changing dietary habits of ethnic groups in Europe and implications for health. Nutr. Rev. 2008, 66, 203–215. [Google Scholar] [CrossRef]
- Dekker, L.H.; Nicolaou, M.; van Dam, R.M.; de Vries, J.H.; de Boer, E.J.; Brants, H.A.; Beukers, M.H.; Snijder, M.B.; Stronks, K. Socio-economic status and ethnicity are independently associated with dietary patterns: The HELIUS-Dietary Patterns study. Food Nutr. Res. 2015, 59, 26317. [Google Scholar] [CrossRef] [PubMed]
- Woodruff, S.J.; Hanning, R.M. A review of family meal influence on adolescents’ dietary intake. Can. J. Diet. Pr. Res. 2008, 69, 14–22. [Google Scholar] [CrossRef] [PubMed]
- De Vet, E.; De Ridder, D.; De Wit, J. Environmental correlates of physical activity and dietary behaviours among young people: A systematic review of reviews. Obes. Rev. 2011, 12, 130–142. [Google Scholar] [CrossRef]
- Hanson, M.D.; Chen, E. Socioeconomic status and health behaviors in adolescence: A review of the literature. J. Behav. Med. 2007, 30, 263. [Google Scholar] [CrossRef]
- Darmon, N.; Drewnowski, A. Does social class predict diet quality? Am. J. Clin. Nutr. 2008, 87, 1107–1117. [Google Scholar] [CrossRef] [PubMed]
- Darmon, N.; Drewnowski, A. Contribution of food prices and diet cost to socioeconomic disparities in diet quality and health: A systematic review and analysis. Nutr. Rev. 2015, 73, 643–660. [Google Scholar] [CrossRef] [PubMed]
- Hinnig, P.; Monteiro, J.; de Assis, M.; Levy, R.; Peres, M.; Perazi, F.; Porporatti, A.; Canto, G. Dietary patterns of children and adolescents from high, medium and low human development countries and associated socioeconomic factors: A systematic review. Nutrients 2018, 10, 436. [Google Scholar] [CrossRef]
- Sterdt, E.; Liersch, S.; Walter, U. Correlates of physical activity of children and adolescents: A systematic review of reviews. Health Educ. J. 2014, 73, 72–89. [Google Scholar] [CrossRef]
- Van, K.D.H.; Paw, M.J.; Twisk, J.W.; Van, W.M. A brief review on correlates of physical activity and sedentariness in youth. Med. Sci. Sports Exerc. 2007, 39, 1241–1250. [Google Scholar]
- Van Hecke, L.; Loyen, A.; Verloigne, M.; Van der Ploeg, H.P.; Lakerveld, J.; Brug, J.; De Bourdeaudhuij, I.; Ekelund, U.; Donnelly, A.; Hendriksen, I. Variation in population levels of physical activity in European children and adolescents according to cross-European studies: A systematic literature review within DEDIPAC. Int J. Behav. Nutr. Phys. Act 2016, 13, 70. [Google Scholar] [CrossRef]
- Cheah, W.L.; Helmy, H.; Chang, C.T. Factors associated with physical inactivity among female and male rural adolescents in Borneo–a cross-sectional study. Int J. Adolesc. Med. Health 2014, 26, 447–453. [Google Scholar] [CrossRef] [PubMed]
- Taymoori, P.; Niknami, S.; Berry, T.; Ghofranipour, F.; Kazemnejad, A. Application of the health promotion model to predict stages of exercise behaviour in Iranian adolescents. East. Mediterr. Health J. 2009, 15, 1215–1225. [Google Scholar]
- Lyerly, J.E.; Huber, L.R.; Warren-Findlow, J.; Racine, E.F.; Dmochowski, J. Is breakfast skipping associated with physical activity among US adolescents? A cross-sectional study of adolescents aged 12–19 years, National Health and Nutrition Examination Survey (NHANES). Public Health Nutr. 2014, 17, 896–905. [Google Scholar] [CrossRef]
- Chinapaw, M.J.; Mokkink, L.B.; van Poppel, M.N.; van Mechelen, W.; Terwee, C.B. Physical activity questionnaires for youth. Sports Med. 2010, 40, 539–563. [Google Scholar] [CrossRef] [PubMed]
- Viner, R.M.; Ozer, E.M.; Denny, S.; Marmot, M.; Resnick, M.; Fatusi, A.; Currie, C. Adolescence and the social determinants of health. Lancet 2012, 379, 1641–1652. [Google Scholar] [CrossRef]
- Dinsa, G.D.; Goryakin, Y.; Fumagalli, E.; Suhrcke, M. Obesity and socioeconomic status in developing countries: A systematic review. Obes. Rev. 2012, 13, 1067–1079. [Google Scholar] [CrossRef]


| Author, Year [Ref] | Setting/Urbanity | Sample | Age (y) Mean ± SD | Ethnicity | Maternal Education | Income (RM) | Diet Measure | Diet Outcome | PA Measure | PA Outcome | Covariates |
|---|---|---|---|---|---|---|---|---|---|---|---|
| Chin & Mohd Nasir 2009 [31] | Kuantan in Pahang/NR | 407 (♀) | 15.2 ± 1.9 | Malay, Chinese, Indian | secondary: 57.0% | Mean ± SD RM 3266 ± 2566 | OQ (EBQ) | Meal skipping behaviours | NA | NA | NR |
| Abdullah et al. 2016 [34] | Kelantan/NR | 454 (♂ ♀) | 15.3 ± 1.9 | Malay, Chinese | Malay; secondary: 67.8% Chinese; secondary: 72.5% | Malay: 70% Chinese: 68% low income (<RM 2300) | FFQ | Healthy, Western & Local dietary pattern score | PAQ-C | PA | Age, gender, ethnicity, SES, breakfast skipping, snacking, eating out, fast food intake, soft drink intake, dietary supplement, PA levels, screen viewing |
| Rezali et al. 2015 [35] | Kuala Lumpur/Urban | 373 (♂ ♀) | 14.3 ± 1.2 | Malay, Chinese, Indian, other | NR | NR | 2 × 24R & OQ (EBQ) | Diet quality, food groups, meal frequency | NA | NA | NR |
| Loh et al. 2017 [36] | Kuala Lumpur/Urban | 873 (♂ ♀) | 13 * | Malay, Chinese, Indian, other | Secondary: 61.4% | NR | OQ (CNQ) | Sugar sweetened beverages intake | NA | NA | NR |
| Nurul-Fadhilah et al. 2013 [37] | Kota Bharu in Kelantan/NR | 236 (♂ ♀) | 15.3 ± 1.9 | Malay | NR | (Mean ± SD) RM 2191 ± 2553 | FFQ | Energy intake, frequency of eating out, snacking frequency | PAQ-C | PA | NR |
| Teo et al. 2014 [38] | Kota Bharu in Kelantan/NR | 454 (♂ ♀) | 15.3 ± 1.9 | Malay, Chinese | NR | NR | FFQ | Energy intake | PAC-C | PA & MVPA | NR |
| Boon et al. 2012 [39] | Kuala Lumpur/Urban | 156 (♂ ♀) | 14.1 ± 0.8 | Malay, Chinese, Indian | NR | Moderate (RM 2000–5999): 57.1% | 1 × 24R | Energy & macronutrients intake | NA | NA | NR |
| Abdul Majid et al. 2016 [48] * | Kuala Lumpur, Selangor, Perak/Urban & rural | 794 (♂ ♀) | 12.86 ± 0.3 | Malay, Chinese, Indian, other | Secondary: 66% | Low SES: 49% | 7DH | Energy & macronutrients intake | NA | NA | NR |
| Cynthia et al. 2013 [49] | Puchong in Selangor/Urban | 408 (♂ ♀) | 13.74 ± 0.56 | Malay, Chinese, other | Upper secondary: 38.9% | 41.9% < RM 3999 | 2 × 24R | Energy & macronutrients intake | NA | NA | Gender, ethnicity, BMI |
| Baharudin et al. 2014 [40] | National/NR | 40011 (♂ ♀) | 13.48 ± 2.24 | NR | NR | NR | NA | NA | PAQ-C | Physical inactivity | Age, gender, breakfast intake, BMI, School session |
| Aniza et al. 2009 [41] | Petaling in Selangor/Urban | 519 (♂ ♀) | 14 and 16 | Malay, Chinese, Indian | NR | Father—41.6% Mother—80.9% Low income (<RM 1500) | NA | NA | IPAQ | Physical inactivity, PA | NR |
| Dan et al. 2011 [42] | Kuantan in Pahang/NR | 400 (♂ ♀) | 13.23 ± 0.31 | Malay, Chinese, Indian | Total years (Mean ± SD): 12.29 ± 3.39 | >RM 3000: 38.5% | NA | NA | PAQ-C | PA | NR |
| Farah Wahida et al. 2011 [43] | Kuantan in Pahang/NR | 360 (♂ ♀) | 13.2 ± 0.3 | Malay, Chinese, Indian, other | Secondary: 50.6% | NR | NA | NA | PAQ-C | PA level, MVPA | NR |
| Cheah et al. 2016 [44] | NR/NR | 2991 (♂ ♀) | 15.88 ± 0.71 | Malay, Chinese, Indian, other | Secondary: 64.39% | NR | NA | NA | OQ | PA | Age, gender, ethnicity |
| Abd-Latif et al. 2012 [45] | Seremban, Muar, Kota, Star, Kuantan/NR | 913 (♂ ♀) | 13–17 | NR | NR | Medium SES: 44% | NA | NA | OQ | PA involvement | NR |
| Cheah et al. 2012 [46] | Kuching in Sarawak/NR | 316 (♂ ♀) | 14–16 | Malay, Chinse | Secondary: 63.9% | Mean ± SD RM 3652.9 ± 3740.6 | NA | NA | OQ | PA | NR |
| Su et al. 2014 [47] * | Kuala Lumpur, Selangor, Perak/Urban & rural | 1327 (♂ ♀) | 12.9 ± 0.3 | Malay, Chinese, Indian, other | NR | NR | NA | NA | PAQ-C | PA | NR |
| Abdul Majid et al. 2016 [27] * | Kuala Lumpur, Selangor, Perak/Urban & rural | 820 (♂ ♀) | 15 | Malay, Chinese, Indian, other | NR | NR | NA | NA | PAQ-C | PA | NR |
| Author, Year [Ref] | Outcome | Correlate | Association | p-Value |
|---|---|---|---|---|
| Energy & Nutrients | ||||
| Teo et al. 2014 [38] | Energy intake (kcal/day) | Gender | Male vs. Female (Median (95%, CI) | |
| Malay ♂ 2408 (2255–2437) vs. ♀ 2178 (2058–2246) | p < 0.01 | |||
| Chinese ♂ 1860 (1792–1970) vs. ♀ 1649 (1642–1828) | p < 0.05 | |||
| Abdul Majid et al. 2016 [48] | Male vs. Female (Mean (95% CI) ♂ 1774.0 (1730.8–1817.3) vs. ♀ 1595.2 (1567.4–1623.1) | p < 0.001 | ||
| Nurul-Fadhilah et al. 2013 [37] | Male vs. Female (Mean ± SD) ♂ 2346 ± 468 vs. ♀ 2152 ± 547 | p < 0.01 | ||
| Abdul Majid et al. 2016 [48] | Place of residence | Urban vs. Rural (Mean (95% CI) 1612.3 (1581.6–1643.1) vs. 1706.1 (1668.7–1743.4) | p < 0.001 | |
| Boon et al. 2012 [39] | Meal patterns | (Mean ± SD) 3M + 3S: 1952 ± 411 vs. 3M + 2S: 1883 ± 456 vs. 3M + 1S: 1687 ± 426 vs. 3M: 1405 ± 426 vs. ≤2M + 2,3S: 1414 ± 335 vs. ≤2M + 0,1S: 1340 ± 252 | p < 0.05 | |
| Snacking patterns | (Mean ± SD) 3M + 3S: 793 ± 246 vs. 3M + 2S: 514 ± 207 vs. 3M + 1S: 259 ± 176 vs. 3M vs. ≤2M + 2: 259 ± 176 vs. 3S: 0 vs. ≤2M + 0: 459 ± 209 vs. 1S: 247 ± 244 | p < 0.05 | ||
| Cynthia et al. 2013 [49] | Eating out | 0–2 times vs. 3–6 times vs. ≥7 times (Mean ± SE) 1984 ± 65 vs.1915 ± 97 vs. 2077 ± 100 | p = NS | |
| Abdul Majid et al. 2016 [48] | Carbohydrate intake (g/day) | Gender | Male vs. Female (Mean (95% CI) ♂ 245.2 (238.6–251.8) vs. ♀ 220.0 (215.7–224.2) | p < 0.001 |
| Place of residence | Urban vs. Rural (Mean (95% CI) 221.6 (216.8–226.3) vs. 236.4 (230.8–242.0) | p < 0.001 | ||
| Cynthia et al. 2013 [49] | Eating out | 0–2 times vs. 3–6 times vs. ≥7 times (Mean ± SE) 131.10 ± 1.69 vs. 132.02 ± 2.03 vs. 126.9 ± 2.58 | p = NS | |
| Boon et al. 2012 [39] | Meal pattern | (Mean ± SD) 3M + 3S: 258.9 ± 49.5 vs. 3M + 2S: 253.7 ± 72.6 vs. 3M + 1S: 225.2 ± 64.1 vs. 3M: 187.0 ± 40.0 vs. ≤2M + 2,3S: 200.2 ± 50.8 vs. ≤2M + 0,1S: 168.1 ± 43.7 | p < 0.05 | |
| Snacking practices | (Mean ± SD) 3M + 3S: 111.5 ± 34.4 vs. 3M + 2S: 74.0 ± 29.8 vs. 3M + 1S: 37.0 ± 24.8 vs. 3M: 0 vs. ≤2M + 2,3S: 71.8 ± 28.5 vs. ≤2M + 0,1S: 38.4 ± 37.9 | p < 0.05 | ||
| Abdul Majid et al. 2016 [48] | Protein intake (g/day) | Gender | Male vs. Female (Mean (95% CI) ♂ 65.7 (63.6–67.7) vs. ♀ 58.7 (57.4–59.7) | p < 0.001 |
| Place of residence | Urban vs. Rural (Mean (95% CI) 59.3 (57.9–60.6) vs. 63.1 (61.1–64.8) | p = 0.001 | ||
| Cynthia et al. 2013 [49] | Protein intake (g/day) | Eating out | 0–2 times vs. 3–6 times vs. ≥7 times (Mean ± SE) 42.37 ± 0.74 vs. 40.08 ± 0.89 vs. 43.73 ± 1.13 | p = NS |
| Boon et al. 2012 [39] | Meal pattern | (Mean ± SD) 3M + 3S: 79.7 ± 21.4 vs. 3M + 2S: 73.7 ± 17.9 vs. 3M + 1S: 72.1 ± 26.2 vs. 3M: 58.7 ± 15.8 vs. ≤2M + 2,3S: 49.7 ± 12.4 vs. ≤2M + 0,1S: 54.5 ± 14.4 | p < 0.05 | |
| Snacking practices | (Mean ±SD) 3M + 3S: 25.4 ± 10.3 vs. 3M + 2S: 16.4 ± 8.7 vs. 3M + 1S: 8.1 ± 9.60 vs. 3M: 0 vs. ≤2M + 2,3S: 11.3 ± 8.1; ≤2M + 0,1S: 8.1 ± 11.5 | p < 0.05 | ||
| Cynthia et al. 2013 [49] | Fat (g/day) | Eating out | 0–2 times vs. 3–6 times vs. ≥7 times (Mean ± SE) 34.05 ± 0.64 vs. 34.54 ± 0.77 vs. 34.86 ± 0.98 | p = 0.043 |
| Boon et al. 2012 [39] | Meal pattern | (Mean ± SD) 3M + 3S: 66.7 ± 21.4 vs. 3M + 2S: 64.3 ± 21.2 vs. 3M + 1S: 55.3 ± 18.2 vs. 3M: 47.1 ± 17.0 vs. ≤2M + 2,3S: 46.4 ± 18.0 vs. ≤2M + 0,1S: 50.0 ± 15.9 | p < 0.05 | |
| Snacking practices | (Mean ± SD) 3M + 3S = 27.7 ± 14.1 vs. 3M + 2S = 17.2 ± 10.3 3M + 1S = 8.8 ± 7.6 vs. 3M = 0 vs. ≤2M + 2 vs. 3S = 14.4 ± 10.6 vs. ≤2M + 0,1S = 6.9 ± 8.2 | p < 0.05 | ||
| Abdul Majid et al. 2016 [48] | Gender | Male vs. Female (Mean (95% CI) ♂ 59.7 (57.6–61.7) vs. ♀ 53.2 (52.0–54.3) | p < 0.001 | |
| Place of residence | Urban vs. Rural (Mean (95% CI) 54.6 (53.2–56.0) vs. 56.4 (54.8–57.9) | p = NS | ||
| Abdul Majid et al. 2016 [48] | Cholesterol (mg/d) | Gender | Male vs. Female (Mean (95% CI) ♂ 248.8 (236.5–261.0) vs. ♀ 209.1 (201.6–216.7) | p < 0.001 |
| Place of residence | Urban vs. Rural (Mean (95% CI) 202.6 (194.2–211.1) vs. 244.1 (234.1–254.0) | p < 0.001 | ||
| Mono-unsaturated fatty acid (g/d) | Gender | Male vs. Female (Mean (95% CI) ♂ 9.0 (8.5–9.5) vs. ♀ 7.9 (7.6–8.1) | p < 0.001 | |
| Place of residence | Urban vs. Rural (Mean (95% CI) 8.3 (7.9–8.6) vs. 8.3 (7.9–8.6) | p = NS | ||
| Poly-unsaturated fatty acid (g/d) | Gender | Male vs. Female (Mean (95% CI) ♂ 6.4 (6.1–6.7) vs. ♀ 5.8 (5.6–6.0) | p = 0.005 | |
| Place of residence | Urban vs. Rural (Mean (95% CI) 5.9 (5.7–6.2) vs. 6.2 (5.9–6.4) | p = NS | ||
| Saturated fatty acid (g/d) | Gender | Male vs. Female (Mean (95% CI) ♂ 12.0 (11.2–12.7) vs. ♀ 10.3 (9.9–10.7) | p < 0.001 | |
| Place of residence | Urban vs. Rural (Mean (95% CI) 10.8 (10.4–11.3) vs. 10.9 (10.4–11.5) | p = NS | ||
| Sugar (g/d) | Gender | Male vs. Female (Mean (95% CI) ♂ 34.7 (32.5–36.8) vs. ♀ 34.1 (32.7–35.5) | p = NS | |
| Place of residence | Urban vs. Rural (Mean (95% CI) 34.1 (32.3–35.8) vs. 34.5 (33.0–36.1) | p = NS | ||
| Abdul Majid et al. 2016 [48] | Crude fiber (g/d) | Gender | Male vs. Female (Mean (95% CI) ♂ 2.9 (2.7–3.1) vs. ♀ 3.0 (2.8–3.1) | p = NS |
| Place of residence | Urban vs. Rural (Mean (95% CI) 3.0 (2.8–3.1) vs. 2.9 (2.7–3.1) | p = NS | ||
| Foods | ||||
| Rezali et al. 2015 [35] | Cereals and grains (HEI score) | Gender | Male vs. Female (Mean ± SD) ♂ 5.5 ± 1.9 vs. ♀ 5.4 ± 2.1 | p = NS |
| Fish (HEI score) | Male vs. Female (Mean ± SD) ♂ 1.6 ± 2.0 vs. ♀ 3.4 ± 3.6 | p < 0.05 | ||
| Fruit (HEI score) | Male vs. Female (Median) ♂ 0 vs. ♀ 0 | p < 0.05 | ||
| Legumes (HEI score) | Male vs. Female (Mean ± SD) ♂ 1.8 ± 2.9 vs. ♀ 1.6 ± 2.6 | p = NS | ||
| Vegetables (HEI score) | Male vs. Female (Mean ± SD) ♂ 3.7 ± 2.5 vs. ♀ 3.1 ± 2.4 | p < 0.05 | ||
| Poultry, meat & egg (HEI score) | Male vs. Female (Mean ± SD) ♂ 8.0 ± 2.9 vs. ♀ 8.6 ± 2.6 | p > 0.05 | ||
| Milk and milk products (HEI score) | Male vs. Female (Median) ♂ 0 vs. ♀ 1 | p < 0.05 | ||
| Loh et al. 2017 [36] | Sugar sweetened beverages (SSB) (mL/day) | Ethnicity | Malay vs. Chinese vs. Indian vs. others (mean ± SE) 0.76 ± 0.04 vs. 0.44 ± 0.05 vs. 0.55 ± 0.10 vs. 0.63 ± 0.21 | p = 0.03 |
| Gender | Male vs. Female (mean ± SE) ♂ 0.68 ± 0.08 vs. ♀ 0.67± 0.03 | p = NS | ||
| Maternal education | Primary vs. Secondary vs. Tertiary (mean ± SE) Primary: 0.62 ± 0.07 vs. Secondary: 0.74 ± 0.05 vs. Tertiary: 0.61 ± 0.06 | p = NS | ||
| Dietary Patterns | ||||
| Rezali et al. 2015 [35] | Diet quality (HEI score) | Availability of healthy foods | Beta = 0.351 | p < 0.05 |
| Ethnicity | Malay; Beta = −2.416 | p < 0.05 | ||
| Gender | Male vs. Female (Mean ± SD) ♂ 34.2 ± 8.2 vs. ♀ 39.9 ± 9.0; Beta ♂ = −5.883 | p < 0.05 | ||
| Age | r = 0.123 | p < 0.05 | ||
| Self-efficacy for healthy eating | Beta = 0.242 | p < 0.05 | ||
| Frequency of breakfast | r = 0.038 | p = NS | ||
| Abdullah et al. 2016 [34] | Healthy dietary pattern score | Age | Malay vs. Chinese | |
| Beta = 0.141, SE = 0.033 | p < 0.001 | |||
| Beta = 0.165, SE = 0.029 | p < 0.001 | |||
| PA | Malay vs. Chinese | |||
| Beta = 0.142, SE = 0.036 | p < 0.001 | |||
| Beta = 0.10, SE = 0.024 | p < 0.001 | |||
| Eating out | Malay vs. Chinese | |||
| Beta = −0.088, SE = 0.036 | p = 0.014 | |||
| Beta = −0.086, SE = 0.026 | p = 0.001 | |||
| Ethnicity | Malay vs. Chinese (Mean ± SD) −0.101 ± 0.957 vs. 0.094 ± 1.03 | p = 0.039 | ||
| Fast food consumption | Malay vs. Chinese | |||
| Beta = −0.166, SE = 0.081 | p = 0.041 | |||
| Beta = −0.223, SE = 0.068 | p = 0.001 | |||
| Maternal education | Chinese; Beta = 0.242, SE = 0.114 | p = 0.035 | ||
| Local dietary pattern score | Eating out | Chinese; Beta = 0.067, SE = 0.022 | p = 0.003 | |
| Fast food consumption | Chinese; Beta = 0.133, SE = 0.057 | p = 0.021 | ||
| Snacking practices | Malay vs. Chinese | |||
| Beta = 0.158, SE = 0.063 | p = 0.013 | |||
| Beta = 0.254, SE = 0.096 | p = 0.009 | |||
| Ethnicity | Malay vs. Chinese (Mean ± SD) 0.399 ± 1.05 vs. −0.427 ± 0.73 | p < 0.001 | ||
| Nutritional supplements consumption | Chinese; Beta = −0.216, SE = 0.097 | p = 0.027 | ||
| Western dietary pattern score | Breakfast skipping | Malay; Beta = 0.476, SE = 0.129 | p < 0.001 | |
| Eating out | Malay vs. Chinese | |||
| Beta = 0.109, SE = 0.036 | p = 0.003 | |||
| Beta = 0.072, SE = 0.026 | p = 0.007 | |||
| Fast food consumption | Chinese; Beta = 0.156, SE = 0.068 | p = 0.023 | ||
| Snacking practices | Chinese; Beta = 0.157, SE = 0.055 | p = 0.004 | ||
| Abdullah et al. 2016 [34] | Western dietary pattern score | Soft drink consumption | Chinese; Beta = 0.080, SE = 0.035 | p = 0.023 |
| Household income | Malay; Beta = −0.078, SE = 0.027 | p = 0.005 | ||
| Age | Malay vs. Chinese | |||
| Beta = −0.136, SE = 0.033 | p < 0.001 | |||
| Beta = −0.084, SE = 0.029 | p = 0.004 | |||
| Ethnicity | Malay vs. Chinese (Mean ± SD) 0.224 ± 1.04 vs. −0.239 ± 0.89 | p < 0.001 | ||
| Nurul-Fadhilah et al. 2013 [37] | Frequency of eating out (times/week) | Gender | Male vs. Female (%) Daily: 8 vs. 7 4–6 times/week: 22 vs.32 1–3 times/week: 74 vs. 93 | p = NS |
| Chin & Mohd Nasir 2009 [31] | Meal frequency (meals/daily) | Eating companions | Family vs. Peer vs. Alone (%) Never skip any meals: 38.7 vs. 33.3 vs. 12.9 Skipped at least one meal: 52.7 vs. 47.6 vs. 61.3 Skipped all three meals daily: 12.9 vs. 61.3 vs. 25.8 | p < 0.05 |
| Ethnicity | Malay vs. Chinese vs. Indian (%) Never skip any meals: 27.1 vs. 51.3 vs. 57.7 Skipped at least one meal: 56.8 vs. 45.2 vs. 3.5 Skipped all three meals daily: 16.2 vs. 3.5 vs. 0 | p < 0.05 | ||
| Living arrangement | Staying with family vs. In school hostel (%) Never skip any meals: 36.8 vs. 31.4 Skipped at least one meal: 53.4 vs. 48.6 Skipped all three meals daily: 9.8 vs. 20 | p = 0.051 | ||
| Nurul-Fadhilah et al. 2013 [37] | Snacking frequency (times/day) | Gender | Snacking frequency Male vs. Female (Mean ± SD) ♂ 1.86 ± 1.0 vs. ♀ 2.4 ± 1.1 | p < 0.001 |
| Rezali et al. 2015 [35] | Snacking frequency (days/week) | Male vs. Female (Mean ± SD) | ||
| Breakfast: ♂ 5.2 ± 2.1 vs. ♀ 4.7 ± 2.6 | p < 0.05 | |||
| Lunch: ♂ 5.9 ± 1.8 vs. ♀ 5.8 ± 2.0 | p = NS | |||
| Dinner: ♂ 6.0 ± 1.9 vs. ♀5.8 ± 2.0 | p = NS | |||
| Correlate | Author, Year [Ref] | Outcome | Association | p-Value |
|---|---|---|---|---|
| Demographics | ||||
| Age | Baharudin et al. 2014 [40] | Physical inactivity | Inactive vs. Active, OR (95% CI) 1.2 (1.16–1.23) | p < 0.001 |
| Cheah et al. 2016 [44] | PA | −0.075 (0.101) | p = NS | |
| Gender | Baharudin et al. 2014 [40] | Physical inactivity | Female vs. Male (ref), OR (95% CI) 2.9 (2.66–3.10) | p < 0.001 |
| Aniza et al. 2009 [41] | Female vs. Male (ref), OR (95% CI) 2.176 (1.225–3.866) | p = 0.008 | ||
| Farah Wahida et al. 2011 [43] | PA level, MVPA | Male vs. Female: (%) Low: ♂ 65.0 vs. ♀ 82.7 Moderate: ♂ 35.0 vs. ♀ 17.3 High: ♂ 0 vs. ♀: 0 | p < 0.001 | |
| Dan et al. 2011 [42] | PA | Male, Beta: 2.366 | p = 0.0001 | |
| Cheah et al. 2016 [44] | Male vs. Female (ref): ♂ 0.603 (0.062) | p < 0.01 | ||
| Nurul-Fadhilah et al. 2013 [37] | Male vs. Female (Mean ± SD) ♂ 2.1 ± 1.7 vs. ♀ 1.3 ± 0.9 | p < 0.001 | ||
| Su et al. 2014 [47] | Male vs. Female Mean (95% CI) ♀ 2.02 (1.91–2.12) vs. ♂ 2.46 (2.29–2.64) | p< 0.001 | ||
| Abdul Majid et al. 2016 [27] | Female Median (IQR) | |||
| Rural: 2.09 (1.72–2.43) in 2012 | p = 0.006 | |||
| 1.93 (1.56–2.28) in 2014 | p = NS | |||
| Cheah et al. 2012 [46] | Male vs. Female (Mean ± SD) | |||
| Before school: 26.1 ± 22.08 vs. 26.7 ± 23.71 | p = NS | |||
| During school: 37.7 ± 36.42 vs. 38.6 ± 36.70 | p = NS | |||
| After school: 47.4 ± 37.60 vs. 43.8 ± 35.62 | p = NS | |||
| Total time: 111.1 ± 77.70 vs. 109.1 ± 75.45 | p = NS | |||
| Teo et al. 2014 [38] | Male vs. Female (Median (95%, CI) | |||
| Malay ♂1.7 (1.8–2.4) vs. ♀1.1 (1.2–1.5) | p < 0.001 | |||
| Chinese ♂ 1.4 (1.6–2.4) vs. ♀ 0.8 (1.0–1.5) | p < 0.01 | |||
| MVPA duration (h/day) | Male vs. Female (Median (95%, CI) | |||
| Malay ♂1.3 (1.5–2.1) vs. ♀ 0.4 (0.5–0.8) | p < 0.001 | |||
| Chinese ♂ 1.0 (1.4–2.1) vs. ♀ 0.4 (0.6–1.0) | p < 0.001 | |||
| Ethnicity | Aniza et al. 2009 [41] | PA | Inactive vs. Active (%) Malay 17.3 vs. 82.7; Others 27.3 vs. 72.7 | p = 0.007 |
| Dan et al. 2011 [42] | Malay vs. Chinese (%) Low: 38.2 vs. 32.1 Moderate/High: 61.8 vs. 67.9 | p = NS | ||
| Su et al. 2014 [47] | Malay vs. Chinese vs. Indian vs. Others (Mean (95% CI) 2.21 (2.18–2.24) vs. 1.92 (1.72–2.17) vs. 2.31 (2.03–2.59) vs. 2.50 (2.31–2.68) | p < 0.05 | ||
| Cheah et al. 2016 [44] | Chinese & Indian/other vs. Malay(ref) | |||
| Chinese: −0.496 (0.086) | p < 0.01 | |||
| Indian/other: −0.042 (0.115) | p = NS | |||
| Abdullah et al. 2016 [34] | Malay vs. Chinese (Mean ± SD) 2.8 ± 1.7 vs. 3.0 ± 2.3 | p = NS | ||
| Maternal employment | Aniza et al. 2009 [41] | Physical inactivity | Not working vs. Working (ref), OR (95% CI) 2.167 (1.263–3.717) | p = 0.005 |
| Paternal education | Dan et al. 2011 [42] | PA | r = 0.105 | p < 0.05 |
| Cheah et al. 2016 [44] | Primary vs. Secondary vs. Tertiary(ref) −0.106 (0.131) vs. −0.052 (0.084) | p = NS, p = NS | ||
| Maternal education | Dan et al. 2011 [42] | PA | r = 0.08 | p = NS |
| Cheah et al. 2016 [44] | Primary vs. Secondary vs. Tertiary (ref) −0.248 (0.0130) vs. −0.293 (0.090) | p < 0.1, p < 0.01 | ||
| Household income | Dan et al. 2011 [42] | PA | r = 0.08 | p = NS |
| Household size | r = 0.03 | p = NS | ||
| Cheah et al. 2016 [44] | 0.062 (0.016) | p < 0.01 | ||
| Parent’s marital status | Cheah et al. 2016 [44] | Married vs. Divorced/widowed (ref) 0.059 (0.137) | p = NS | |
| Physical-Environmental | ||||
| School session | Baharudin et al. 2014 [40] | PA | Noon vs. Morning (ref), OR (95% CI) 1.3 (1.13–1.44) | p < 0.001 |
| Place of residence | Su et al. 2014 [47] | Rural vs. urban (Mean (95% CI) 2.14 (1.95–2.32) vs. 2.34 (2.25–2.43) | p = NS | |
| Abdul Majid et al. 2016 [27] | Rural (Median (IQR) Rural: 2.24 (1.90–2.70) in 2012 2.12 (1.70–2.64) in 2014 | p = 0.013 | ||
| Hot weather | Aniza et al. 2009 [41] | PA | Inactive vs. Active (%) Yes: 25.3 vs. 74.7 No: 20 vs. 80 | p = 0.031 |
| Equipment not available | Inactive vs. Active (%) Yes: 26.9 vs. 73.1 No: 20.7 vs. 79.3 | p = 0.023 | ||
| Facility far from home | Inactive vs. Active (%) Yes: 25.6 vs. 74.4 No: 19.7 vs. 80.3 | p = 0.026 | ||
| Traffic safety | Cheah et al. 2012 [46] | r = −0.15 | p = NS | |
| Residential density | r = 0.072 | p = NS | ||
| Land-use mix diversity | r = 0.074 | p = NS | ||
| Land-use mix access | r = 0.43 | p = NS | ||
| Street connectivity | r = −0.03 | p = NS | ||
| Infrastructure for walking | r = −0.078 | p = NS | ||
| Aesthetics | r = −0.041 | p = NS | ||
| Safety from crime | r = −0.046 | p = NS | ||
| Neighborhood satisfaction | r = −0.009 | p = NS | ||
| Facility support | Abd-Latif et al. 2012 [45] | PA involvement | r = 0.069 | p = 0.038 |
| Usage level of facilities | r = 0.094 | p < 0.05 | ||
| Safety | r = 0.002 | p = NS | ||
| Social-Environmental | ||||
| Family without exercise | Aniza et al. 2009 [41] | PA | Inactive vs. Active (%) Yes: 27.1 vs. 72.9 No: 16.9 vs. 83.1 | p = 0.005 |
| Physical education | Cheah et al. 2016 [44] | 0.151 (0.018) | p < 0.01 | |
| Social influence | Dan et al. 2011 [42] | Peer; Beta = 0.339 | p = 0.0001 | |
| Family influence | r = 0.298 | p < 0.001 | ||
| Behavioral | ||||
| Breakfast intake | Baharudin et al. 2014 [40] | Physical inactivity | None, Irregular vs. Daily(ref), OR (95% CI) | |
| 1.9 (1.74, 2.13) | p < 0.001 | |||
| 1.4 (1.33, 1.55) | p < 0.001 | |||
| Stretching is important before exercise | Aniza et al. 2009 [41] | PA | No vs. Yes (ref), OR (95% CI) 3.747 (1.540–9.118) | p = 0.004 |
| Time constraint | Yes vs. No (ref), OR (95% CI) 2.473 (1.335–4.579) | p = 0.004 | ||
| Exercise when having ample time | No vs. Yes (ref) OR (95% CI) 2.482 (1.413–4.360) | p = 0.002 | ||
| No skills to participate in PA | Inactive vs. Active (%) Yes: 27.3 vs. 72.7 No: 19.3 vs. 80.7 | p = NS | ||
| Prefer to watch TV | Inactive vs. Active (%) Yes: 24.9 vs. 75.1 No: 9.1 vs. 90.9 | p = 0.005 | ||
| Embarrassed | Inactive vs. Active (%) Yes: 30 vs. 70 No: 21.4 vs. 78.6 | p = 0.028 | ||
| Being lazy | Inactive vs. Active (%) Yes: 30 vs. 70 No: 21.4 vs. 78.6 | p=<0.0001 | ||
| Too troublesome | Inactive vs. Active (%) Yes: 32.5 vs. 67.5 No: 20.6 vs. 79.4 | p = 0.005 | ||
© 2019 by the authors. Licensee MDPI, Basel, Switzerland. This article is an open access article distributed under the terms and conditions of the Creative Commons Attribution (CC BY) license (http://creativecommons.org/licenses/by/4.0/).
Share and Cite
Mohammadi, S.; Jalaludin, M.Y.; Su, T.T.; Dahlui, M.; Azmi Mohamed, M.N.; Abdul Majid, H. Determinants of Diet and Physical Activity in Malaysian Adolescents: A Systematic Review. Int. J. Environ. Res. Public Health 2019, 16, 603. https://doi.org/10.3390/ijerph16040603
Mohammadi S, Jalaludin MY, Su TT, Dahlui M, Azmi Mohamed MN, Abdul Majid H. Determinants of Diet and Physical Activity in Malaysian Adolescents: A Systematic Review. International Journal of Environmental Research and Public Health. 2019; 16(4):603. https://doi.org/10.3390/ijerph16040603
Chicago/Turabian StyleMohammadi, Shooka, Muhammad Yazid Jalaludin, Tin Tin Su, Maznah Dahlui, Mohd Nahar Azmi Mohamed, and Hazreen Abdul Majid. 2019. "Determinants of Diet and Physical Activity in Malaysian Adolescents: A Systematic Review" International Journal of Environmental Research and Public Health 16, no. 4: 603. https://doi.org/10.3390/ijerph16040603
APA StyleMohammadi, S., Jalaludin, M. Y., Su, T. T., Dahlui, M., Azmi Mohamed, M. N., & Abdul Majid, H. (2019). Determinants of Diet and Physical Activity in Malaysian Adolescents: A Systematic Review. International Journal of Environmental Research and Public Health, 16(4), 603. https://doi.org/10.3390/ijerph16040603