3.1. Influence of Parameters on Air-Flow Pattern
The velocity contour plots in
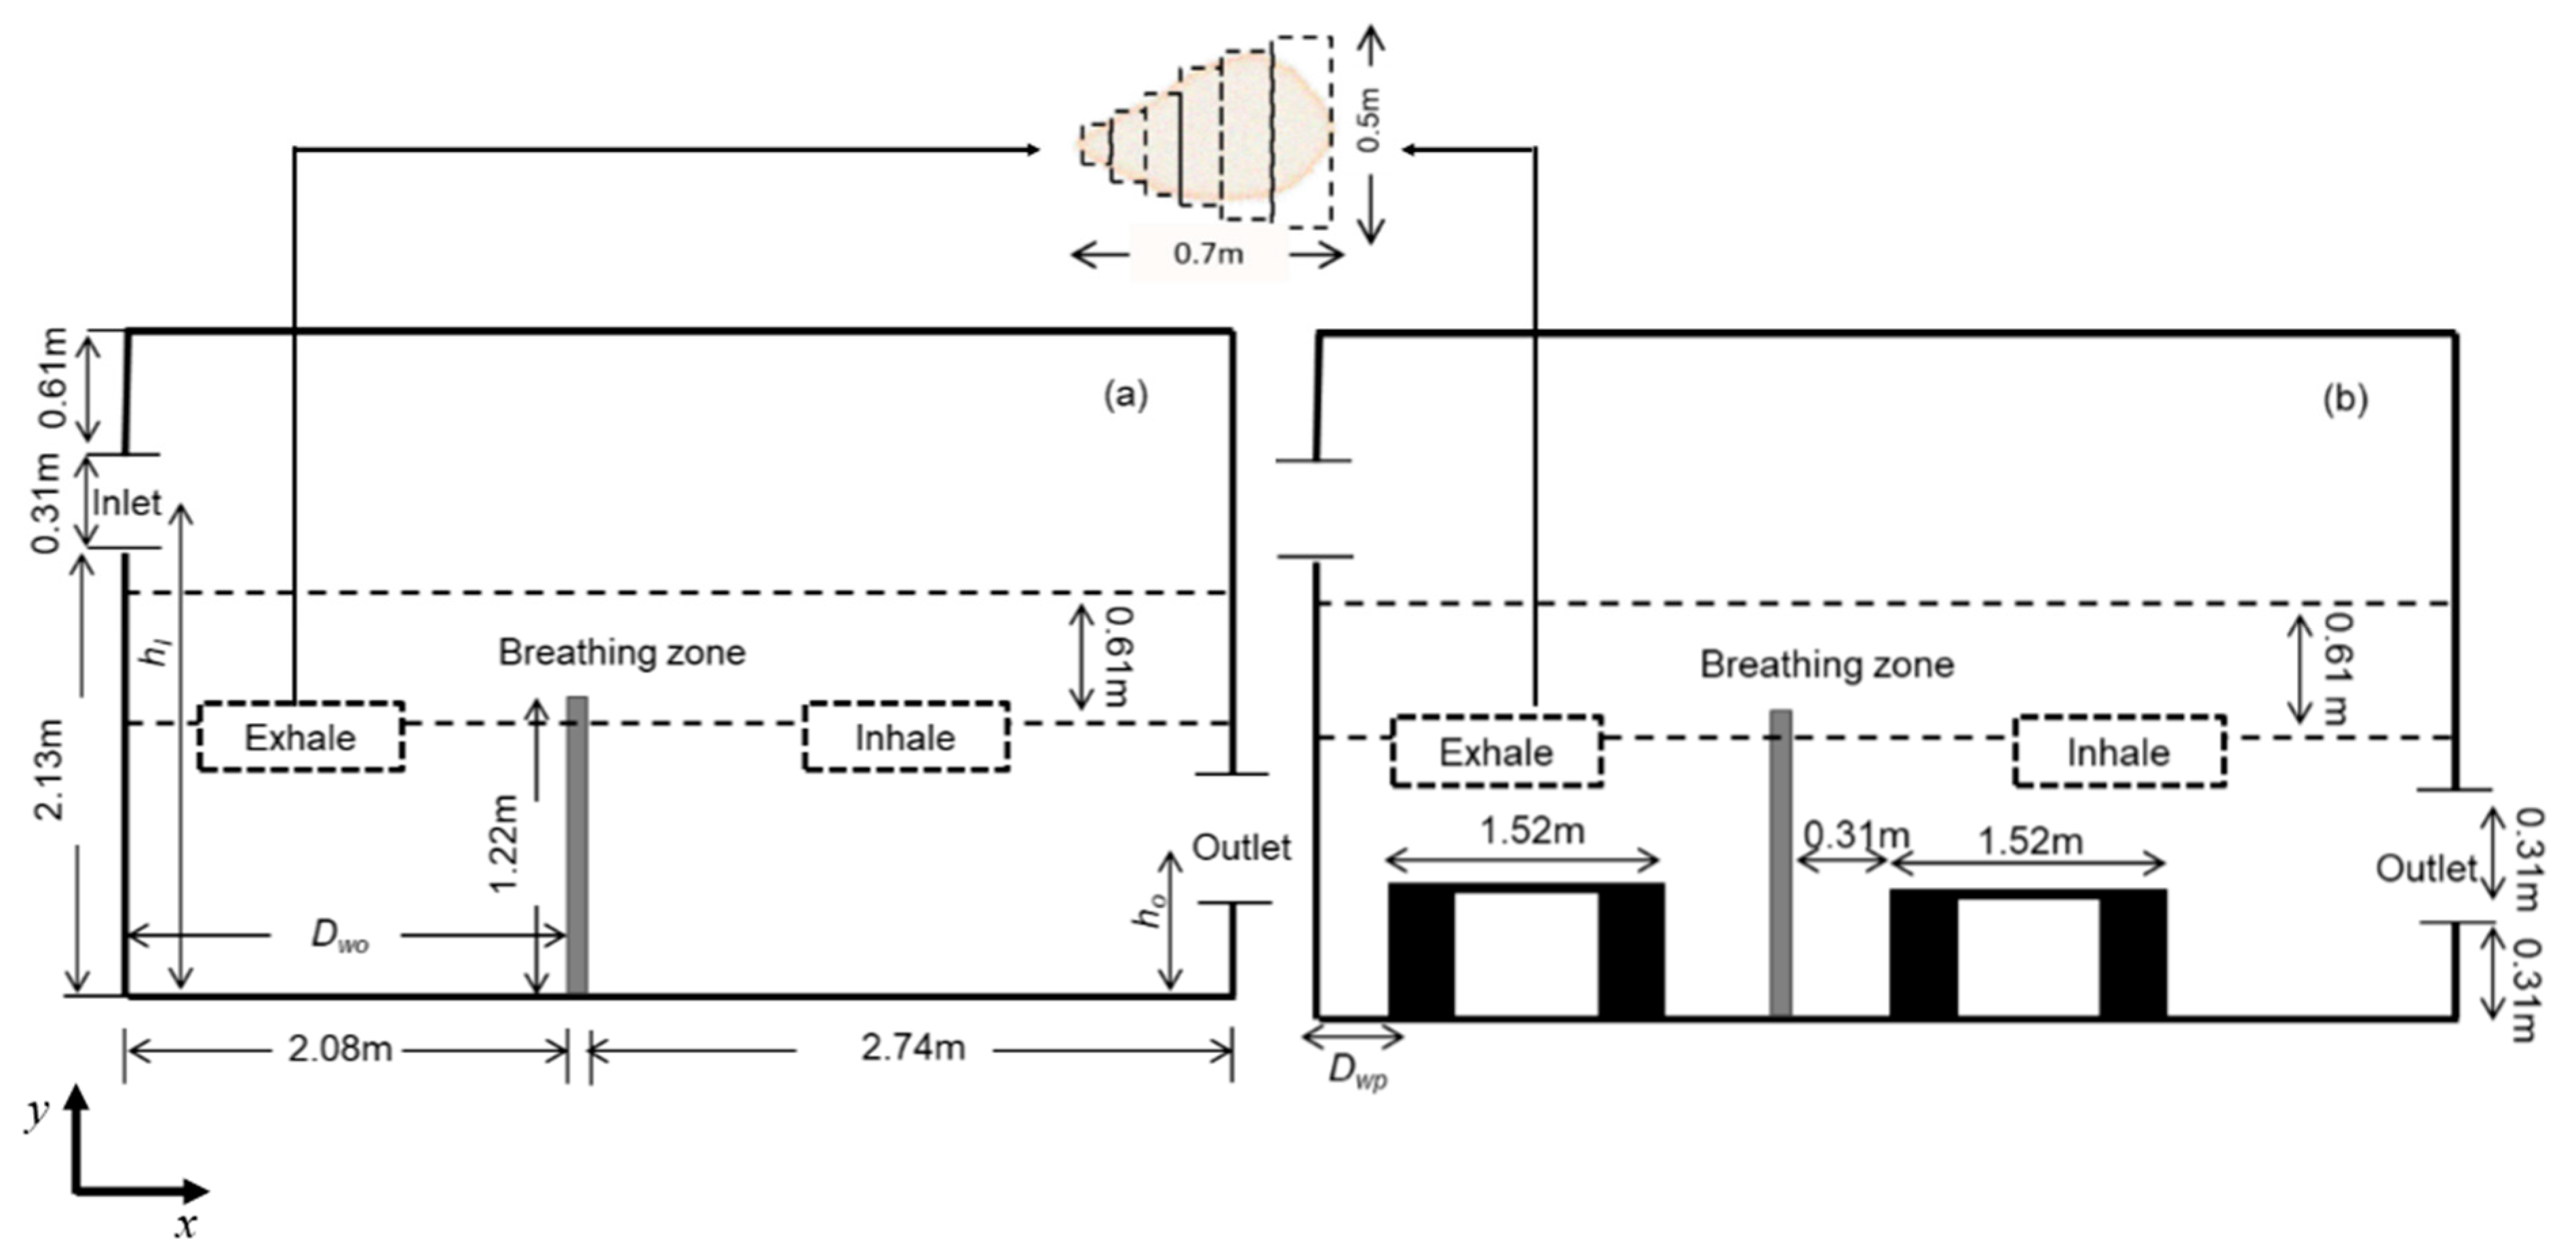
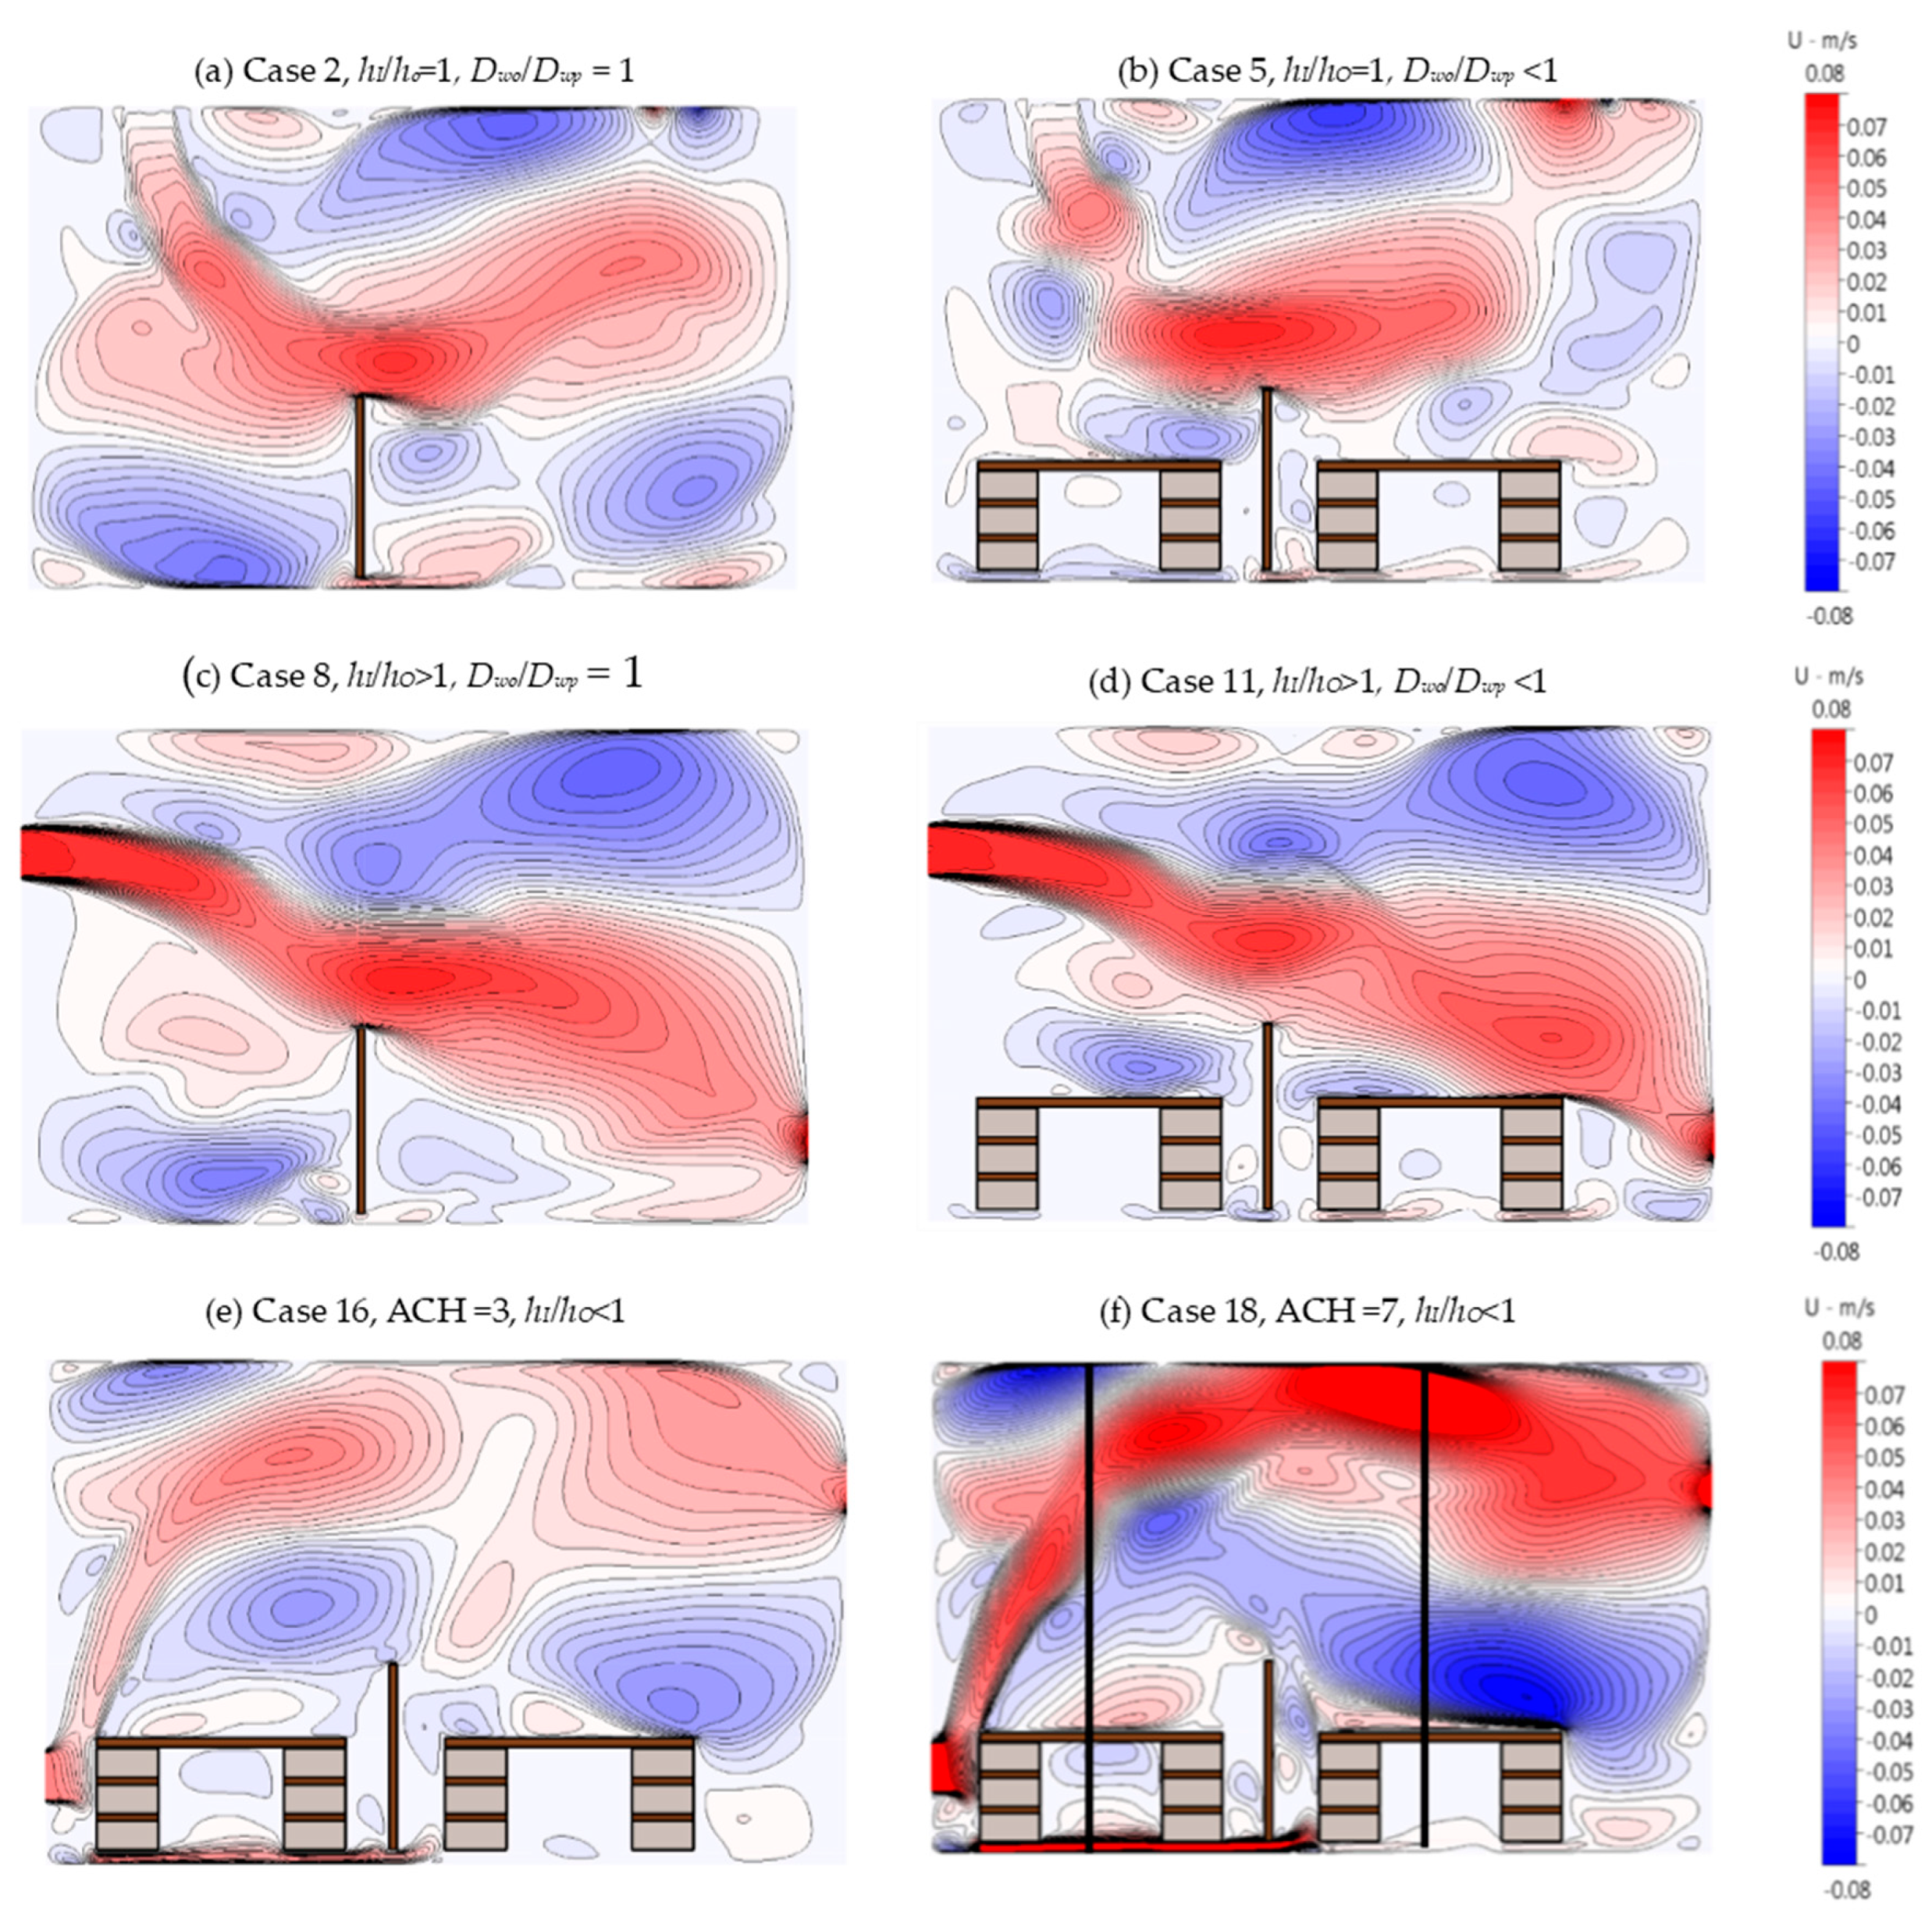
Figure 2 show the resulting air-flow pattern for cases 2, 5, 8, 11, 16, and 18. Cases 2, 5, 8, and 11 were at ACH = 5. In
Figure 2a, where both inlet and outlet were in the ceiling (case 2), the circulations with higher velocities were in the upper regions of the room and at the corners. For case 5,
Figure 2b, with all other configurations the same as case 2, the presence of desks did not appear to change the air-flow pattern significantly. In
Figure 2c,d, cases 8 and 11 appear similar, even though desks were present for the latter and absent for the former.
Figure 2e,f show the velocity contour plots for ACH = 3 and 7 when
hI/ho < 1 in the presence of desks. The presence of the desks in front of the inlet resulted in a sharp upturn of the air flow at the inlet into the domain, resulting in a different air-flow pattern in comparison to when
hI/ho = 1 or
hI/ho > 1. The plots confirm the combined influence that indoor parameters have on the air flow in the domain, but it is difficult to distinguish which parameter or configuration is better or worse for the occupants’ well-being.
The contour plots do, however, confirm that increasing ACH resulted in fewer locations in the domain where the velocity magnitudes were <0.01 m/s. The regions where such low velocities occurred remained the same for all configurations, as seen in
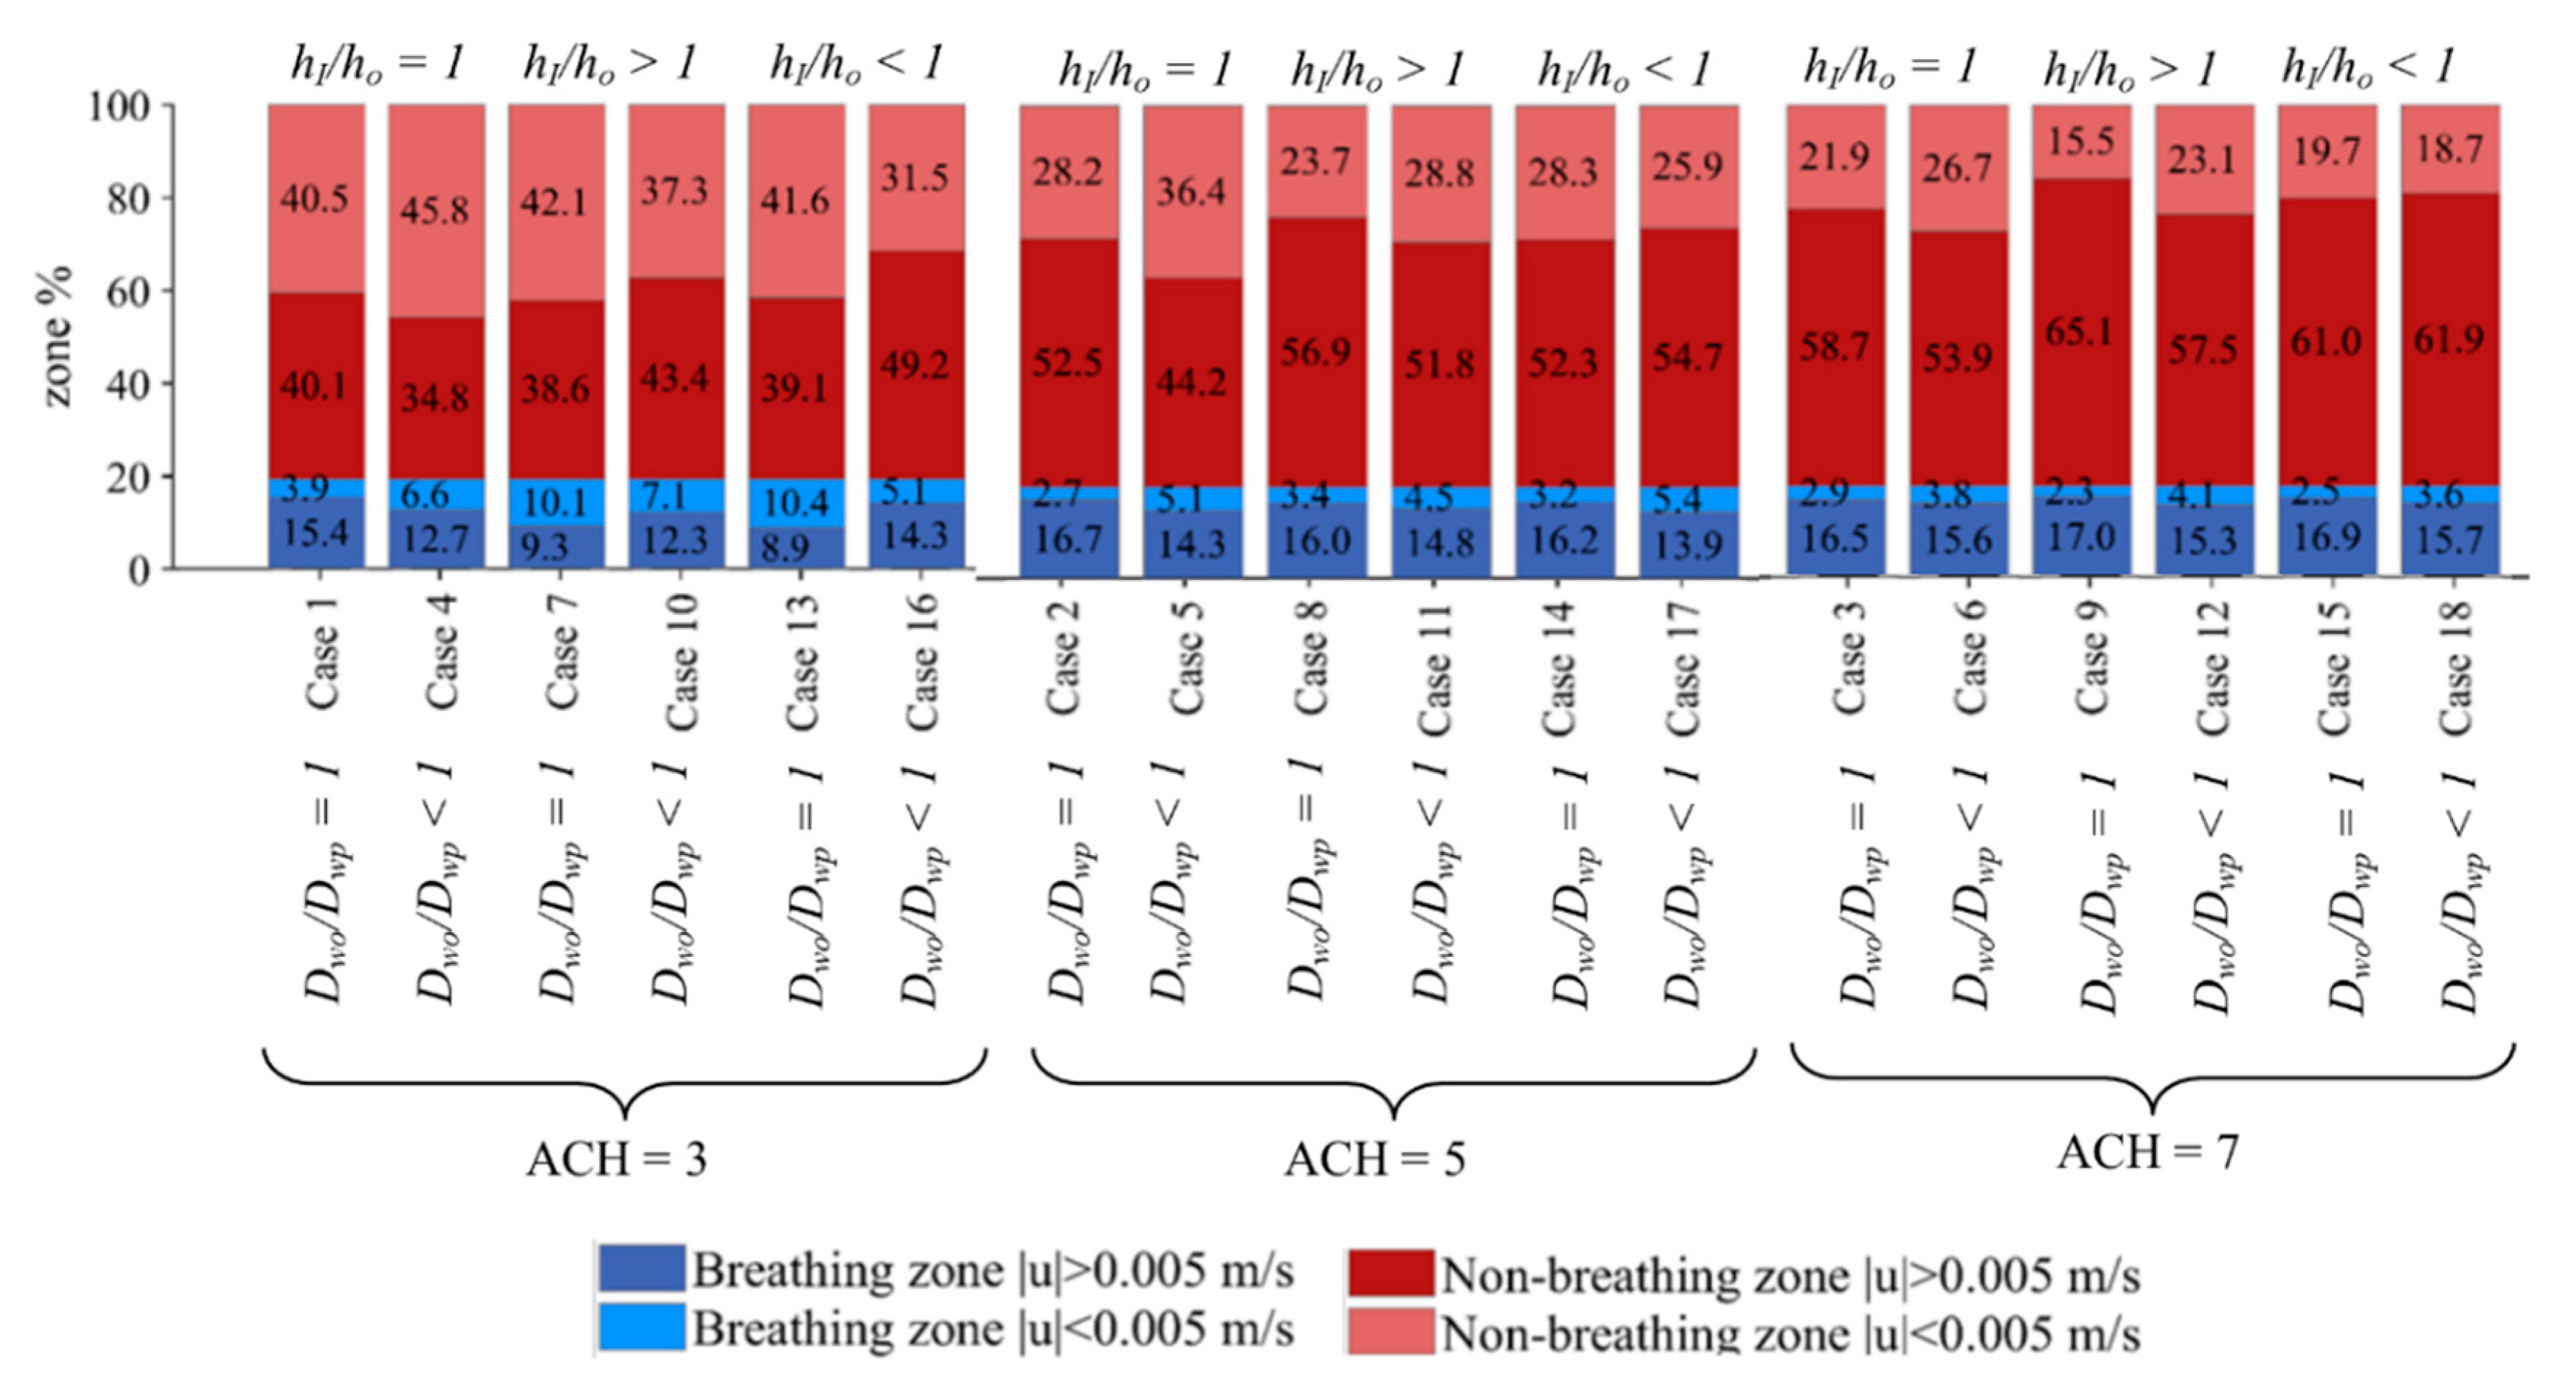
Figure 2. To assess the impact of the parameters on the regions with low velocities, the number of nodes with velocities less than 0.005 m/s was counted and normalized against the total number of nodes in the breathing and non-breathing zones. These were designated as dead zones.
The bar charts in
Figure 3 compare the percentage of dead zones for the 18 cases. The breathing zones are in blue shades and non-breathing zones are in red shades. The figure shows that increasing ACH, i.e., cases 1, 2, and 3 or cases 4, 5, and 6, resulted in a decreasing percentage of dead zones in the whole domain and in the breathing zone. The percentage of dead zones in the domain nearly halved when air changes were increased from 3 to 5, though the decrease when ACH was increased from 5 to 7 was not as consistent.
Comparing cases without desks (Dwo/Dwp = 1) and with desks (Dwo/Dwp < 1), the percentage of dead zones in both regions increased when the inlet and outlet were located at the top, for ACH = 3 (cases 1 and 4). When hI/ho > 1 (cases 7 and 10) and hI/ho < 1 (cases 13 and 16), the dead zone percentage decreased with the inclusion of desks for the whole domain. At ACH = 5, dead zone percentage increased for all regions when hI/ho = 1 (cases 2 and 5) and hI/ho > 1 (cases 8 and 11), and it increased for the breathing zone only when hI/ho < 1 (cases 14 and 17). The dead zone percentage decreased for the non-breathing zones for all cases, with cases 14 and 17 as the only exceptions, when desks were included. At ACH = 7, the exception also occurred when hI/ho < 1 (cases 15 and 18) for the non-breathing zone as well, with a slight increase in the percentage of dead zones when desks were included. Overall, it appears that, when the inlet and outlet location satisfies hI/ho < 1, the trend differs from the other configurations. This can be due to the location of the desks in the domain relative to the inlet position.
3.2. Line Plots and Statistical Moments for Interpreting Air Flow across All Cases
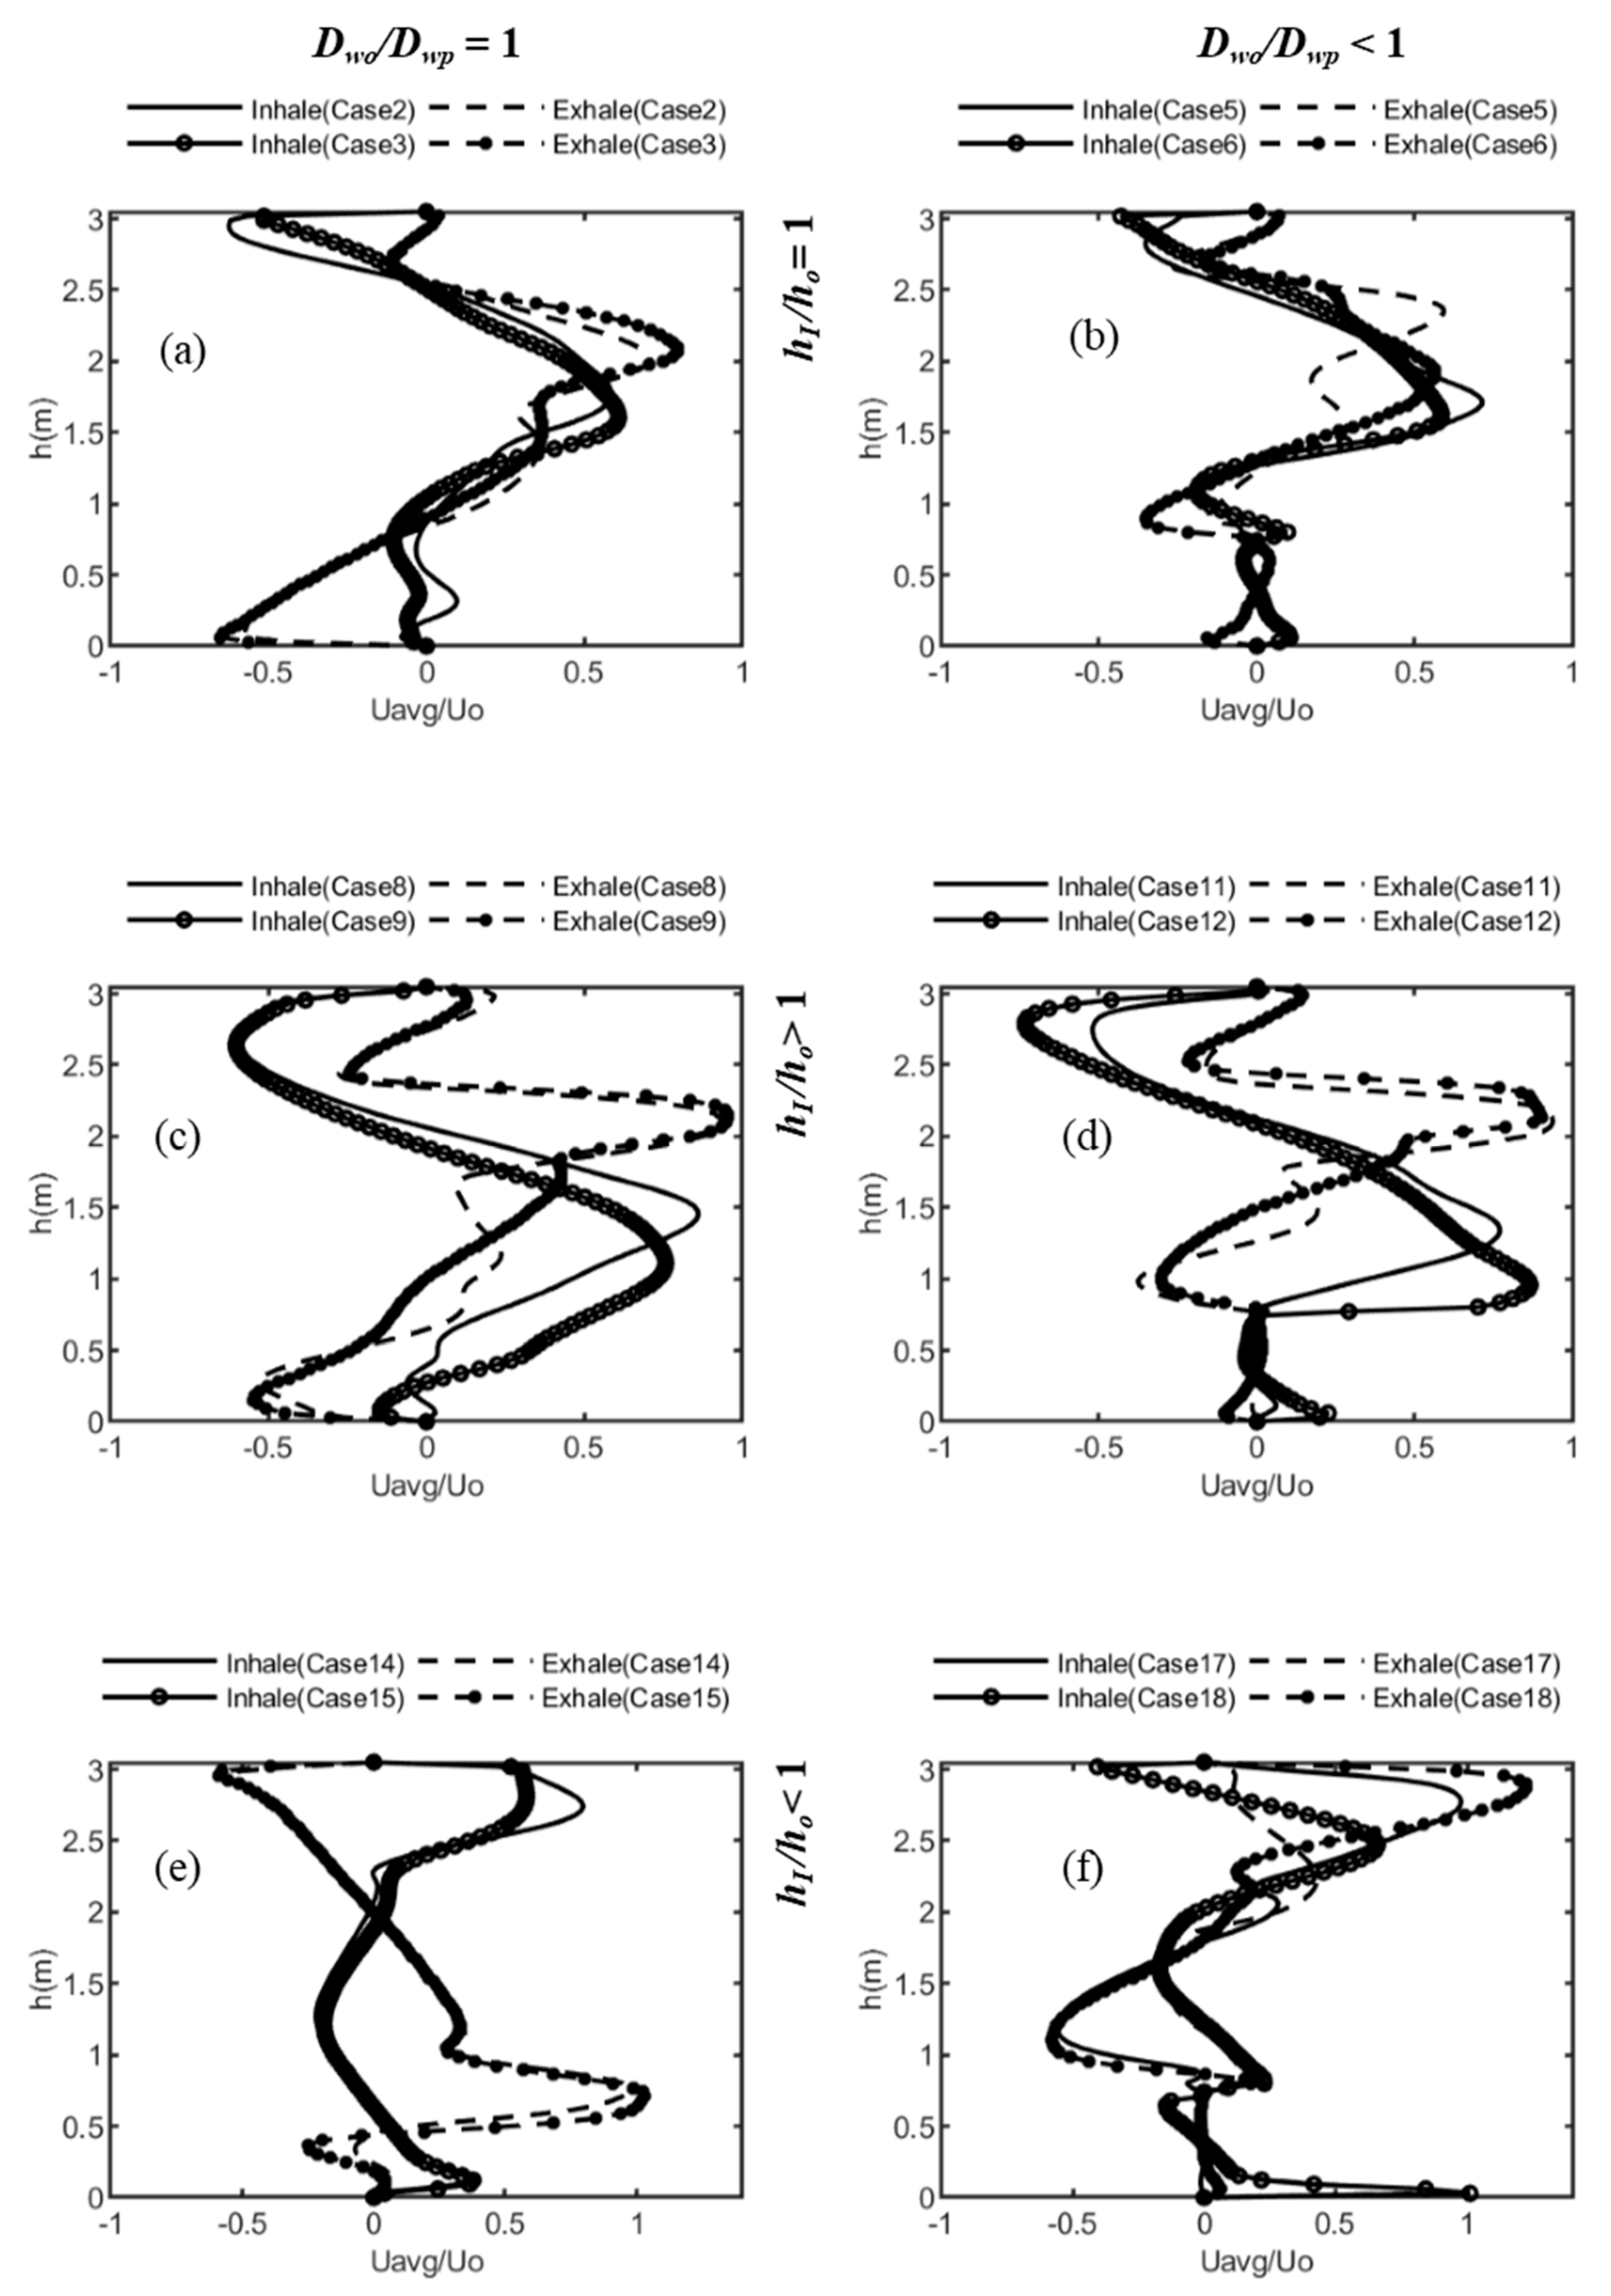
Figure 4 shows line plots of the normalized velocity for cases 2, 3; 5, 6; 8, 9; 11, 12; 14, 15; and 17, 18 at
x = 1.1 m and 3.05 m in the exhale and inhale zones (locations shown in
Figure 2d using line probes).
Figure 4a compares the velocity profiles for cases 2 and 3 where ACH increases from 5 to 7. The air-flow inlet and outlet were located at the top, i.e.,
hI/ho = 1, and no desks were present,
Dwo/Dwp = 1. Increasing the ACH caused a vortex or recirculation zone to form near the domain for ACH = 7; otherwise, the line plots were similar for both locations.
Figure 4b shows cases 5 and 6 with desks, which resulted in velocities near zero at desk heights.
Figure 4c,d show line plots for cases 8, 9; and 11, 12, with the inlet located above the outlet,
hI/ho > 1. Maximum velocity values occurred at the inlet height for the exhale side, with the lines nearly overlaying. For the inhale side, the plots appeared to “smooth” out as inlet effects diminished (
hI/ho < 1 for
Figure 4e,f). The peaks were reversed for the exhale and inhale zones in
Figure 4e. The presence of desks resulted in sharp peaks at the lower end of the domain (
Figure 4f). Overall, the position of the inlet/outlet on the flow pattern appeared to have a lesser effect when
hI/ho > 1, and desks appeared to have a lesser effect when
hI/ho = 1.
Figure 4 shows the influence of the different configurations on the air-flow pattern, and it highlights the difficulty in comparing the effects of the multiple configurations.
To better interpret the results across all 18 cases, statistical moments were applied next. The mean, standard deviation, and the skewness were calculated for the average velocities across the room height at
x = 1.1 m and 3.05 m. The means increased from ~0.004 m/s to ~0.007 m/s to ~0.010 m/s as the ACH increased from 3 to 7, and they were very nearly the same value for both sides of the partition.
Table 2 lists the values for standard deviation and skewness for both exhale and inhale zones, and the change going from one zone to the other. The standard deviation increased with increasing ACH for each zone. Comparing exhale and inhale sides, an impact of the configuration can be seen. The standard deviation decreased from the exhale to the inhale region when
hI/ho = 1 and
Dwo/Dwp = 1. There was a slight increase when desks were present and ACH = 5 and 7. This indicates that the air flow does not gain momentum for this configuration, suggesting the possibility that contaminant dispersion is influenced mainly by the conditions at the inlet side of the domain. With desks present, the air flow was interrupted and, at higher ACH, some momentum was carried forward, resulting in a rise in the standard deviation. A decreasing trend from the exhalation zone to the inhalation zone can be seen for
hI/ho < 1 in the absence of any desks. In the presence of desks, however, the standard deviation increased for all cases moving from the exhale to the inhale side for
hI/ho > 1.
Skewness gives the direction of the total mass of air. A negative skew indicates that the mass of the air flow is toward x = 0, and a positive skew shows that the mass of air is flowing toward the room end, i.e., where the outlet is located. In the exhale zone, when the inlet and outlet were located at the top, the mass of air flow was toward the inlet, i.e., skewness was negative for cases 1 to 4. In all other cases, for the exhale zone, the air flow was directed toward the outlet. Cases 1, 2, and 3 had no desks. With no desks to break the incoming air stream from the inlet located in the ceiling, the air mass had more space to move in either or both directions. This can also be seen for case 4, where, at ACH = 3, even though desks were present, the air dispersed before the air stream hit the desks.
For the inhale zone, cases 2, 9, 12, and 16 had negative skew values. All these cases had unique configurations, and skewness gives insight into the impact of the different configurations. Case 2 is the only case for the group with hI/ho = 1 where the flow of the air mass was toward the exhale zone from the inhale zone (ACH = 5 and no desks were present). For case 9, the group of cases 7, 8, and 9 had the same parameter values (hI/ho > 1, Dwo/Dwp = 1), except for increasing ACH from 3 to 5 to 7, respectively. Cases 10, 11, and 12 were also the same (hI/ho > 1, Dwo/Dwp < 1) except for ACH. One group was without desks and the other was with desks. At ACH = 7, the flow direction was opposite for cases 9 and 12. Case 16 with ACH = 3, on the other hand, also had a negative skew value. For case 16, hI/ho < 1 and desks were present. Skewness transitioned from negative to positive and vice versa for the cases 1, 3, 4, 9, 12, and 16. For cases 1, 3, and 4, where the common factor was hI/ho = 1, the transition was negative to positive. For cases 9, 12 (hI/ho > 1), and case 16 (hI/ho < 1), the transition was positive to negative, i.e., the mass of air moved toward the exhale zone, away from the inlet end, and then reversed direction.
3.3. Statistical Moments Describing the Spatial Distribution of Particles
To obtain an overall picture of the spatial distribution of the particles, the average and standard moments of the location of the particles for
x and
y coordinates at the end of the simulation were determined.
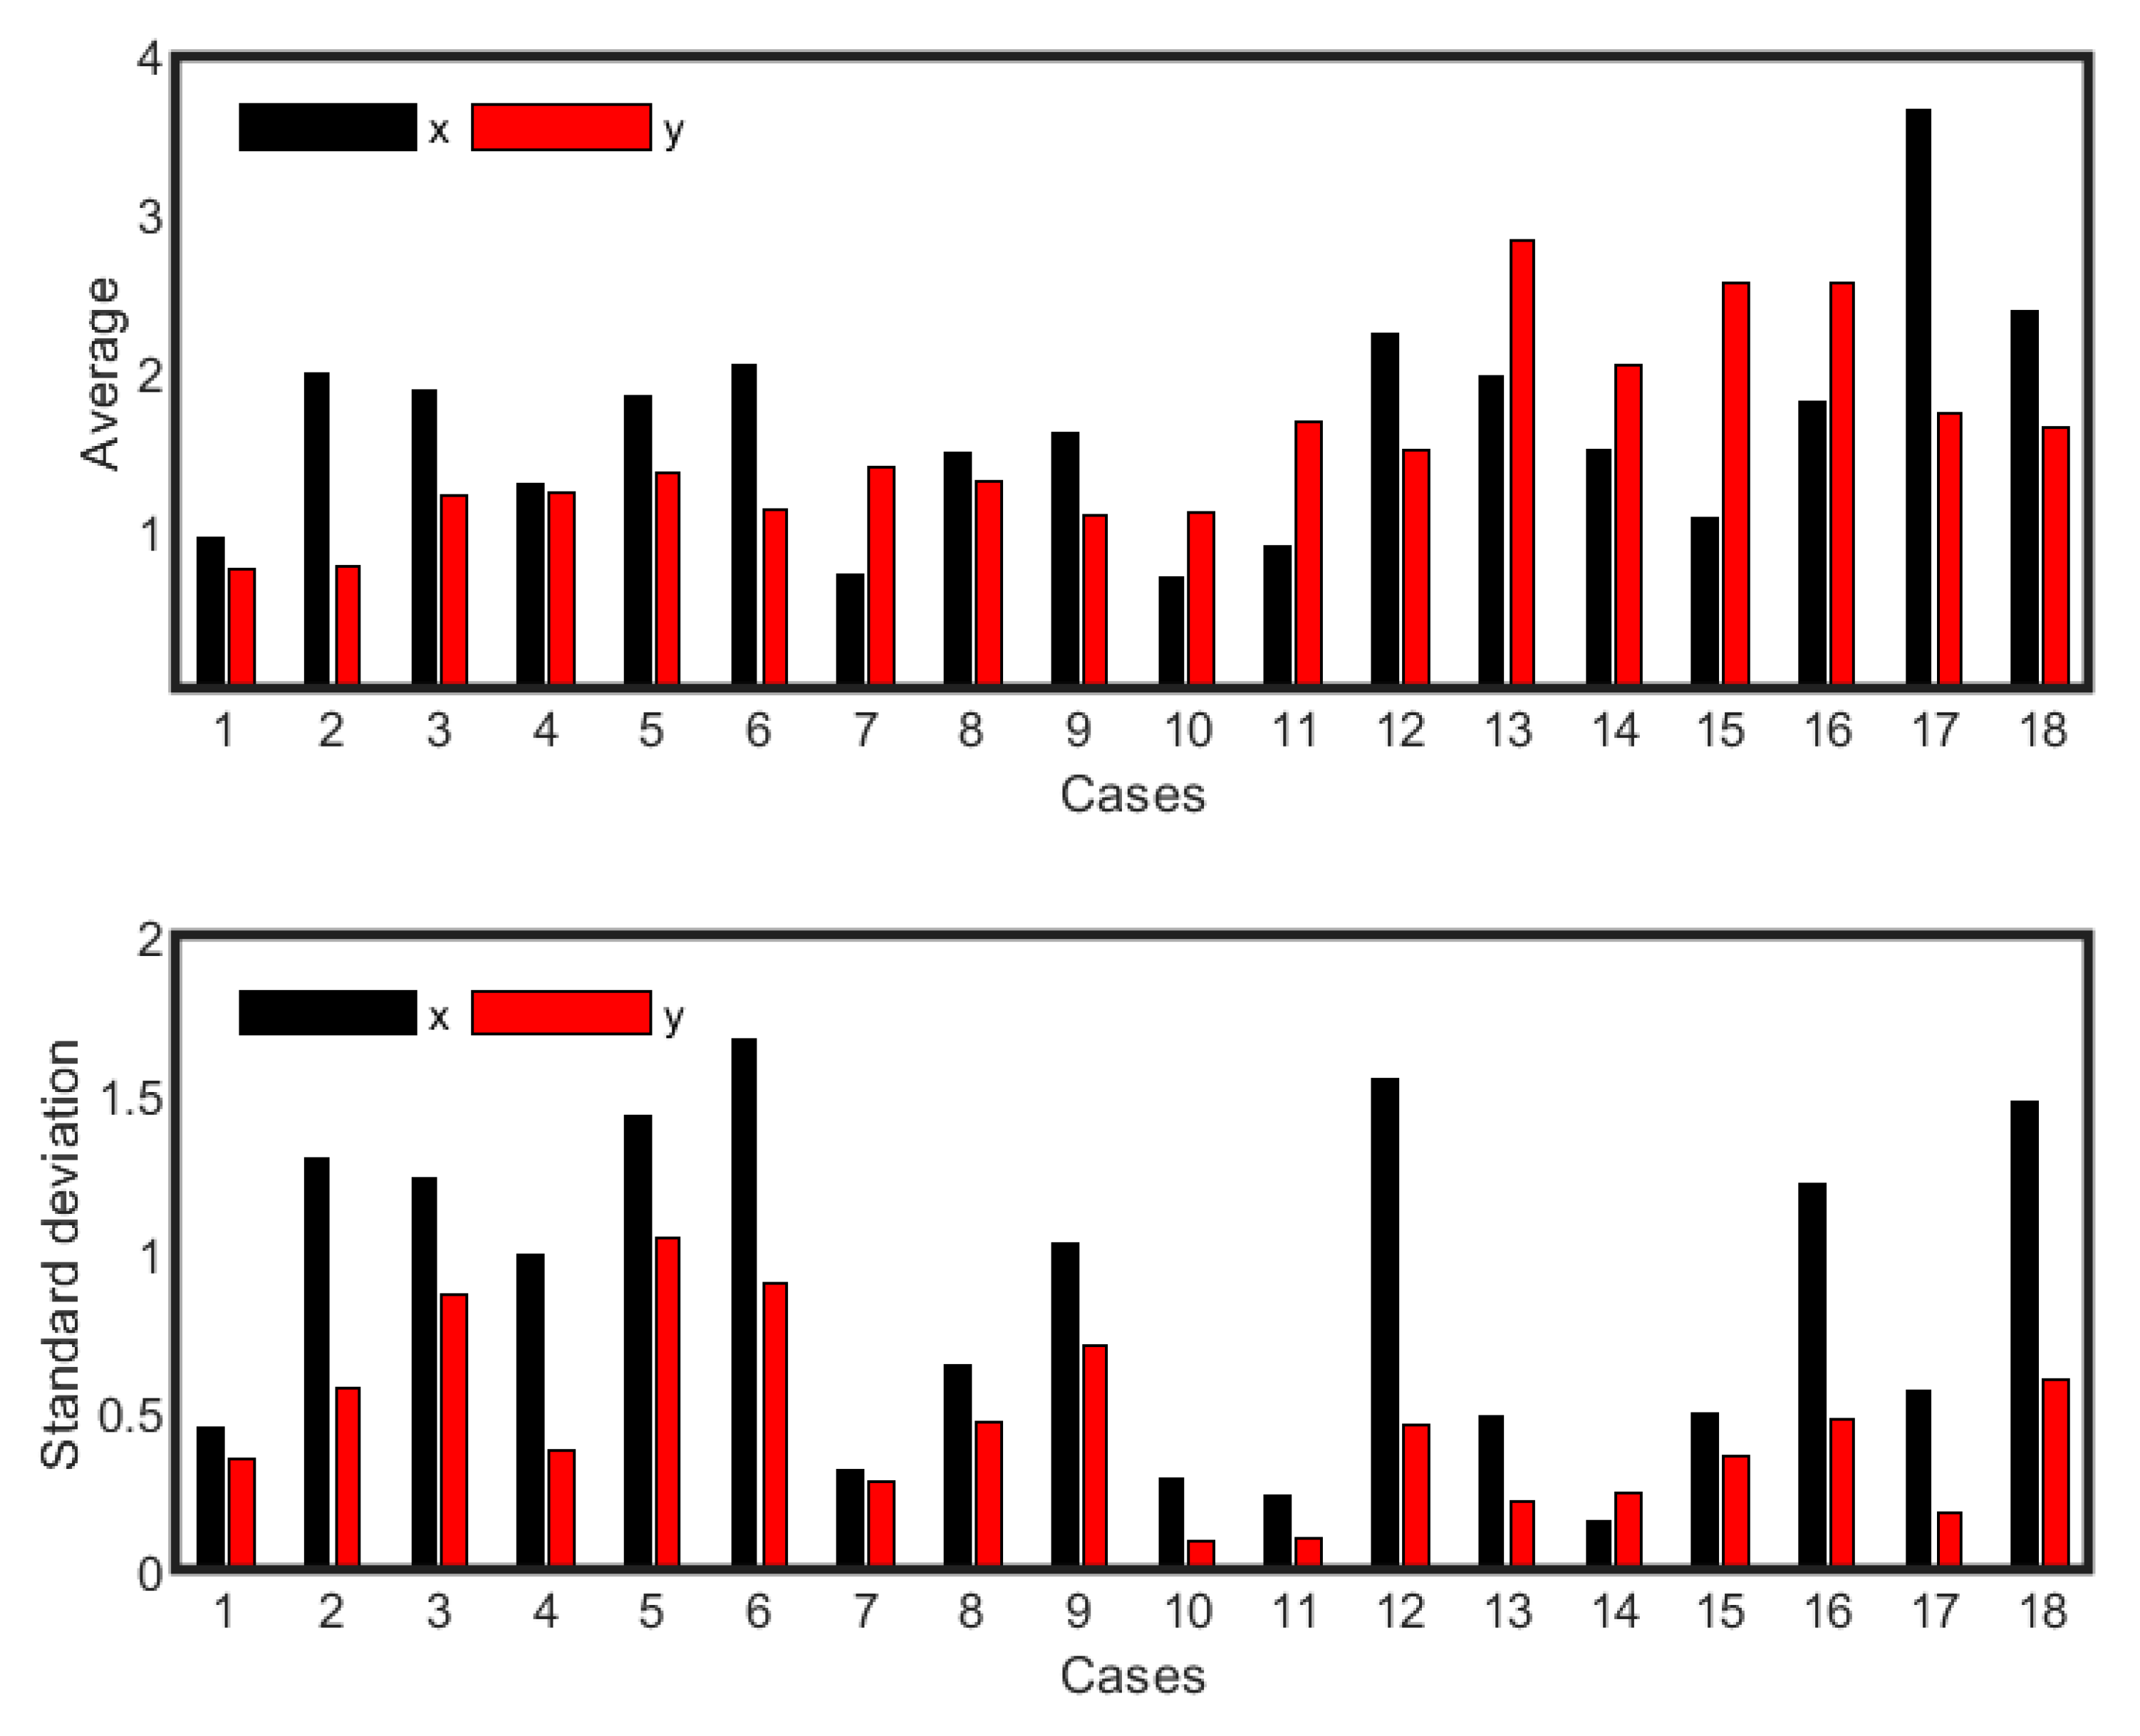
Figure 5 shows the average and standard deviation (
x and
y coordinates) for the 18 cases. The values differed for all cases, which confirms that every configuration of ventilation pattern, ACH, and desks resulted in a unique spatial distribution of the particles. A higher value of the mean or average
x and
y indicated that particles were located toward the inhalation zone or that more particles were located near the ceiling, respectively. Standard deviation quantifies the clustering of the particles in the domain around the average. For example, particles in case 2 (ACH = 5,
hI/ho = 1,
Dwo/Dwp = 1) were, on average, within 2 m of the entrance, occupying the region right below the breathing zone, but dispersed more in the horizontal direction, staying within a meter of the domain’s floor. For case 17 (ACH = 5,
hI/ho < 1,
Dwo/Dwp < 1), on the other hand, particles moved to the inhalation zone and were in the breathing region, but clustered in that location.
Increasing ACH from 3 to 5 generally pushed the particles toward the inhale zone, for example, in cases 1, 2; and cases 7, 8; except for cases 13, 14 where hI/ho < 1 and Dwo/Dwp = 1, and for cases 17, 18 where hI/ho < 1 and Dwo/Dwp < 1. There was no clear trend when ACH increased from 5 to 7. Most particles remained in the exhale zone for case 7. For case 17, most particles appeared to be in the inhale zone. For cases 13 to 16, the particles were above the breathing zone, whereas, for all the remaining scenarios, the particles were within the height of the breathing zone. Cases 13 to 16 had the common configuration of hI/ho < 1. Once ACH increased from 3 to 5 and 7 for cases 17 and 18, the particles were at the height within the breathing zone.
Scanning through the standard deviation values (
Figure 6b), it could be concluded that no specific parameter appears to dominate the particle dispersion for both
x and
y directions. Increasing ACH from 3 to 5 resulted in an increase in the standard deviation value for
x when the inlet and outlet were located at the top, i.e.,
hI/ho = 1 (cases 1, 2; cases 4, 5). For
hI/ho > 1 (cases 7, 8; cases 10, 11) and
hI/ho < 1 (cases 13, 14; cases 16, 17), the increase was not consistent. When ACH = 7, higher spread occurred for case 12 (ACH = 7,
hI/ho > 1,
Dwo/Dwp < 1) and case 18 (ACH = 7,
hI/ho < 1,
Dwo/Dwp < 1). However, particles in case 16 (ACH = 3,
hI/ho < 1,
Dwo/Dwp < 1) also had a standard deviation value nearly the same as cases 12 and 18, even though the ACH was 3. The least particle dispersion occurred for the cases 7, 10, 11, and 14 for the
x value. The values for
y location followed the same trend as
x and were always less than
x, except for case 14 (ACH = 5,
hI/ho < 1,
Dwo/Dwp = 1), where dispersion of the particles was slightly more in the vertical direction than in the horizontal direction.
The standard deviation values for air flow in
Table 2 were compared to the trends in
Figure 5b. Focusing on cases with relatively more clustering for both
x and
y values (i.e., cases 7, 10, 11, 14, and 17), it can be seen that smaller magnitudes of standard deviation for air flow were seen for cases 7 (~0.019 both sides) and 10 (~0.013 both sides) when ACH = 3 and
hI/ho > 1 in the absence and presence of desks, respectively, compared to the other cases. However, for cases 11, 14, and 17, the standard deviation for air flow was within the magnitude of the other cases (~0.021 to ~0.029) even though the standard deviation values for particles indicated clustering. In these three cases, the inlet and outlet were at the opposite end (case 11,
hI/ho > 1; case 14,
hI/ho < 1; and case 17,
hI/ho < 1) and ACH was either 5 (case 11, 17) or 7 (case 14). Desks were present for cases 11 and 17 but absent for case 14.
3.4. Temporal Trend of the Particles
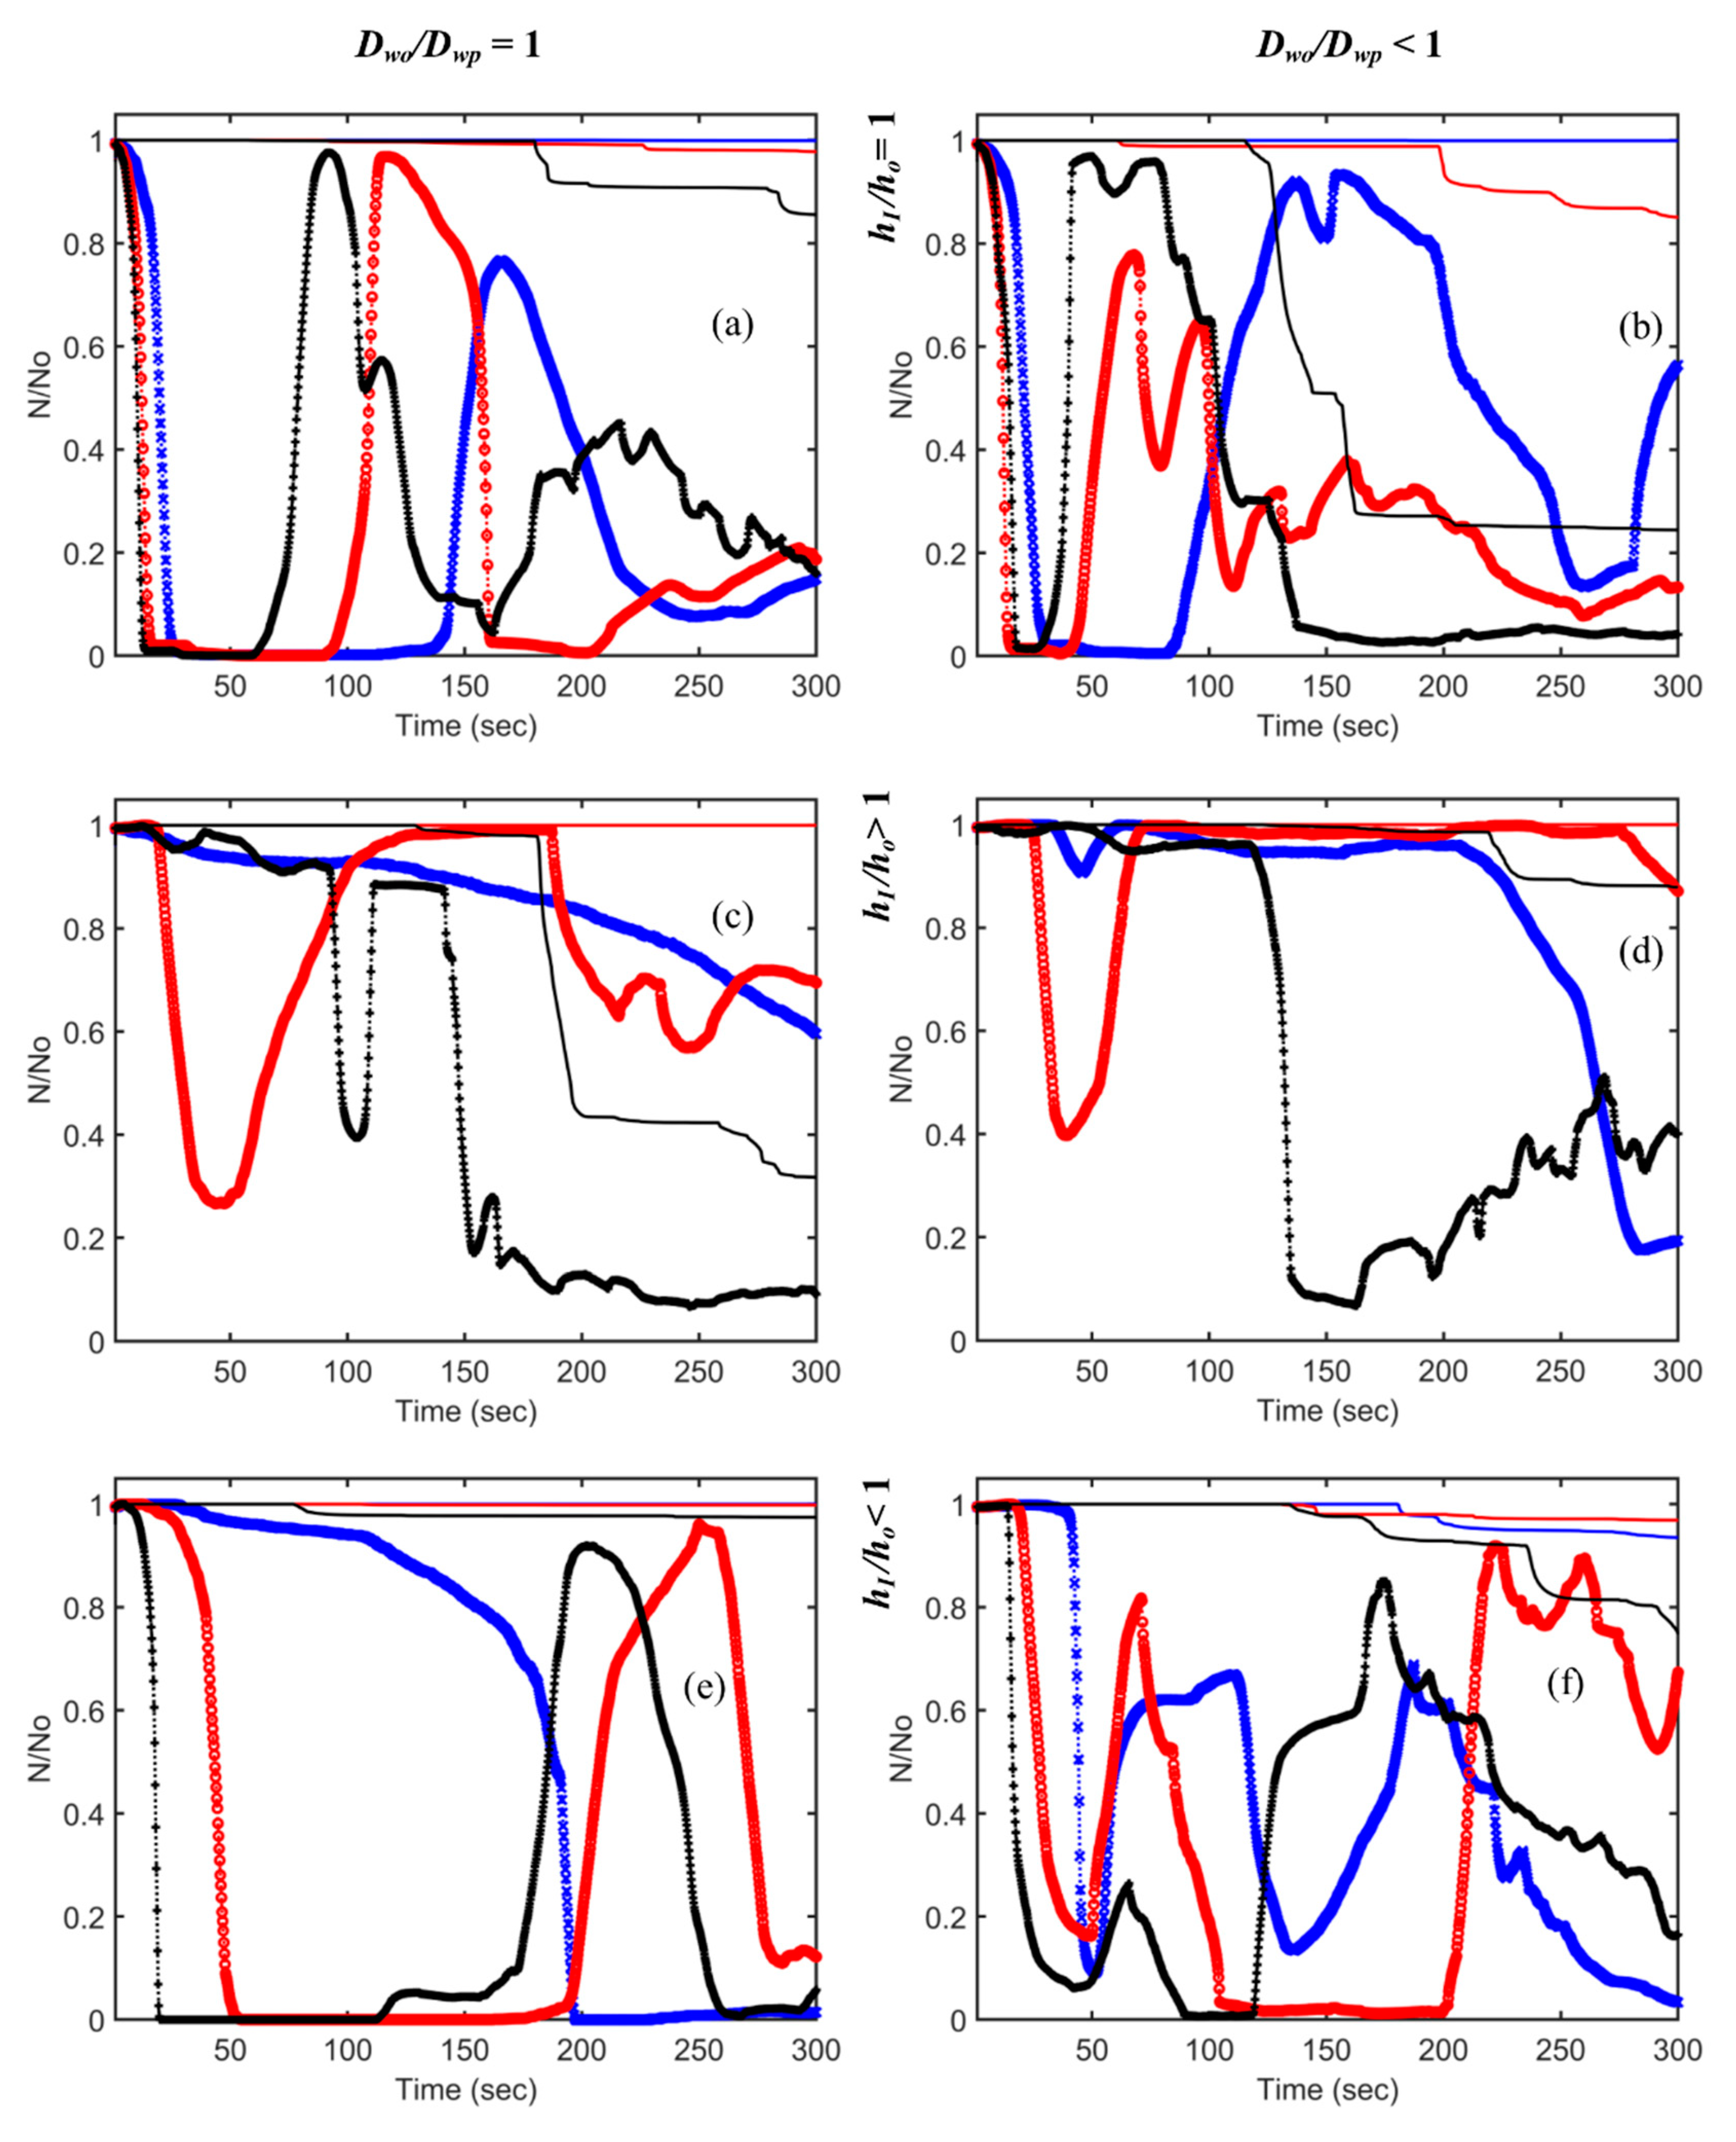
The temporal evolution of the particle number in the breathing zone and in the whole domain for all cases is shown in
Figure 6. The plots show the unique impact of each configuration of the 18 simulations. The effect of increasing ACH from 3 to 7 is shown in every plot. The first column in the figure is for the cases with the presence of the partition only,
Dwo/Dwp = 1, and the second column is for the cases with both partition and desks,
Dwo/Dwp < 1. The first row is for
hI/ho = 1, the second row is for
hI/ho > 1, and the third row is for
hI/ho < 1. Lines in the plot represent particle number evolution in the whole domain, and lines with markers represent evolution in the breathing zone only.
Assessing the influence of increasing air changes, at ACH = 7, a larger number of particles left the domain compared to at ACH 3 and 5. However, the least removal also occurred when
hI/ho < 1 and
Dwo/Dwp = 1 for ACH = 7 (case 15). There is no clear interpretation as to the impact of the presence or absence of desks or the inlet/outlet locations. When the inlet and outlet were located at the top, in the presence of desks, more particles exited the room for ACH = 5 and 7. There was little or no change in the trend for ACH = 3. When
hI/ho < 1 for ACH = 5 and 7, the presence of desks was observed to have the same effect; however, overall, a smaller number of particles were removed when compared to
hI/ho = 1. For
hI/ho > 1, the presence of desks resulted in the entrapment of higher particles in the whole domain, and the number leaving the domain was small. Particles cycled in and out of the breathing zone with the air flow. The peak of the cycles was dependent on the total remaining particles in the domain. Hence, more particles returned to the breathing zone in the following cycle if particles remained in the room. Cases 13, 14, and 15 (
Figure 6e) illustrate this clearly. For ACH = 3, it appears that particles in the breathing zone left the room; however, for ACH = 5 and 7, the pattern indicates a return earlier for ACH = 7 than that for ACH = 5. Hence, for ACH = 3, the particles return to the breathing zone after a longer time period. The peak of the cyclic behavior coincides with the trend line for the change in the total number of particles in the domain.
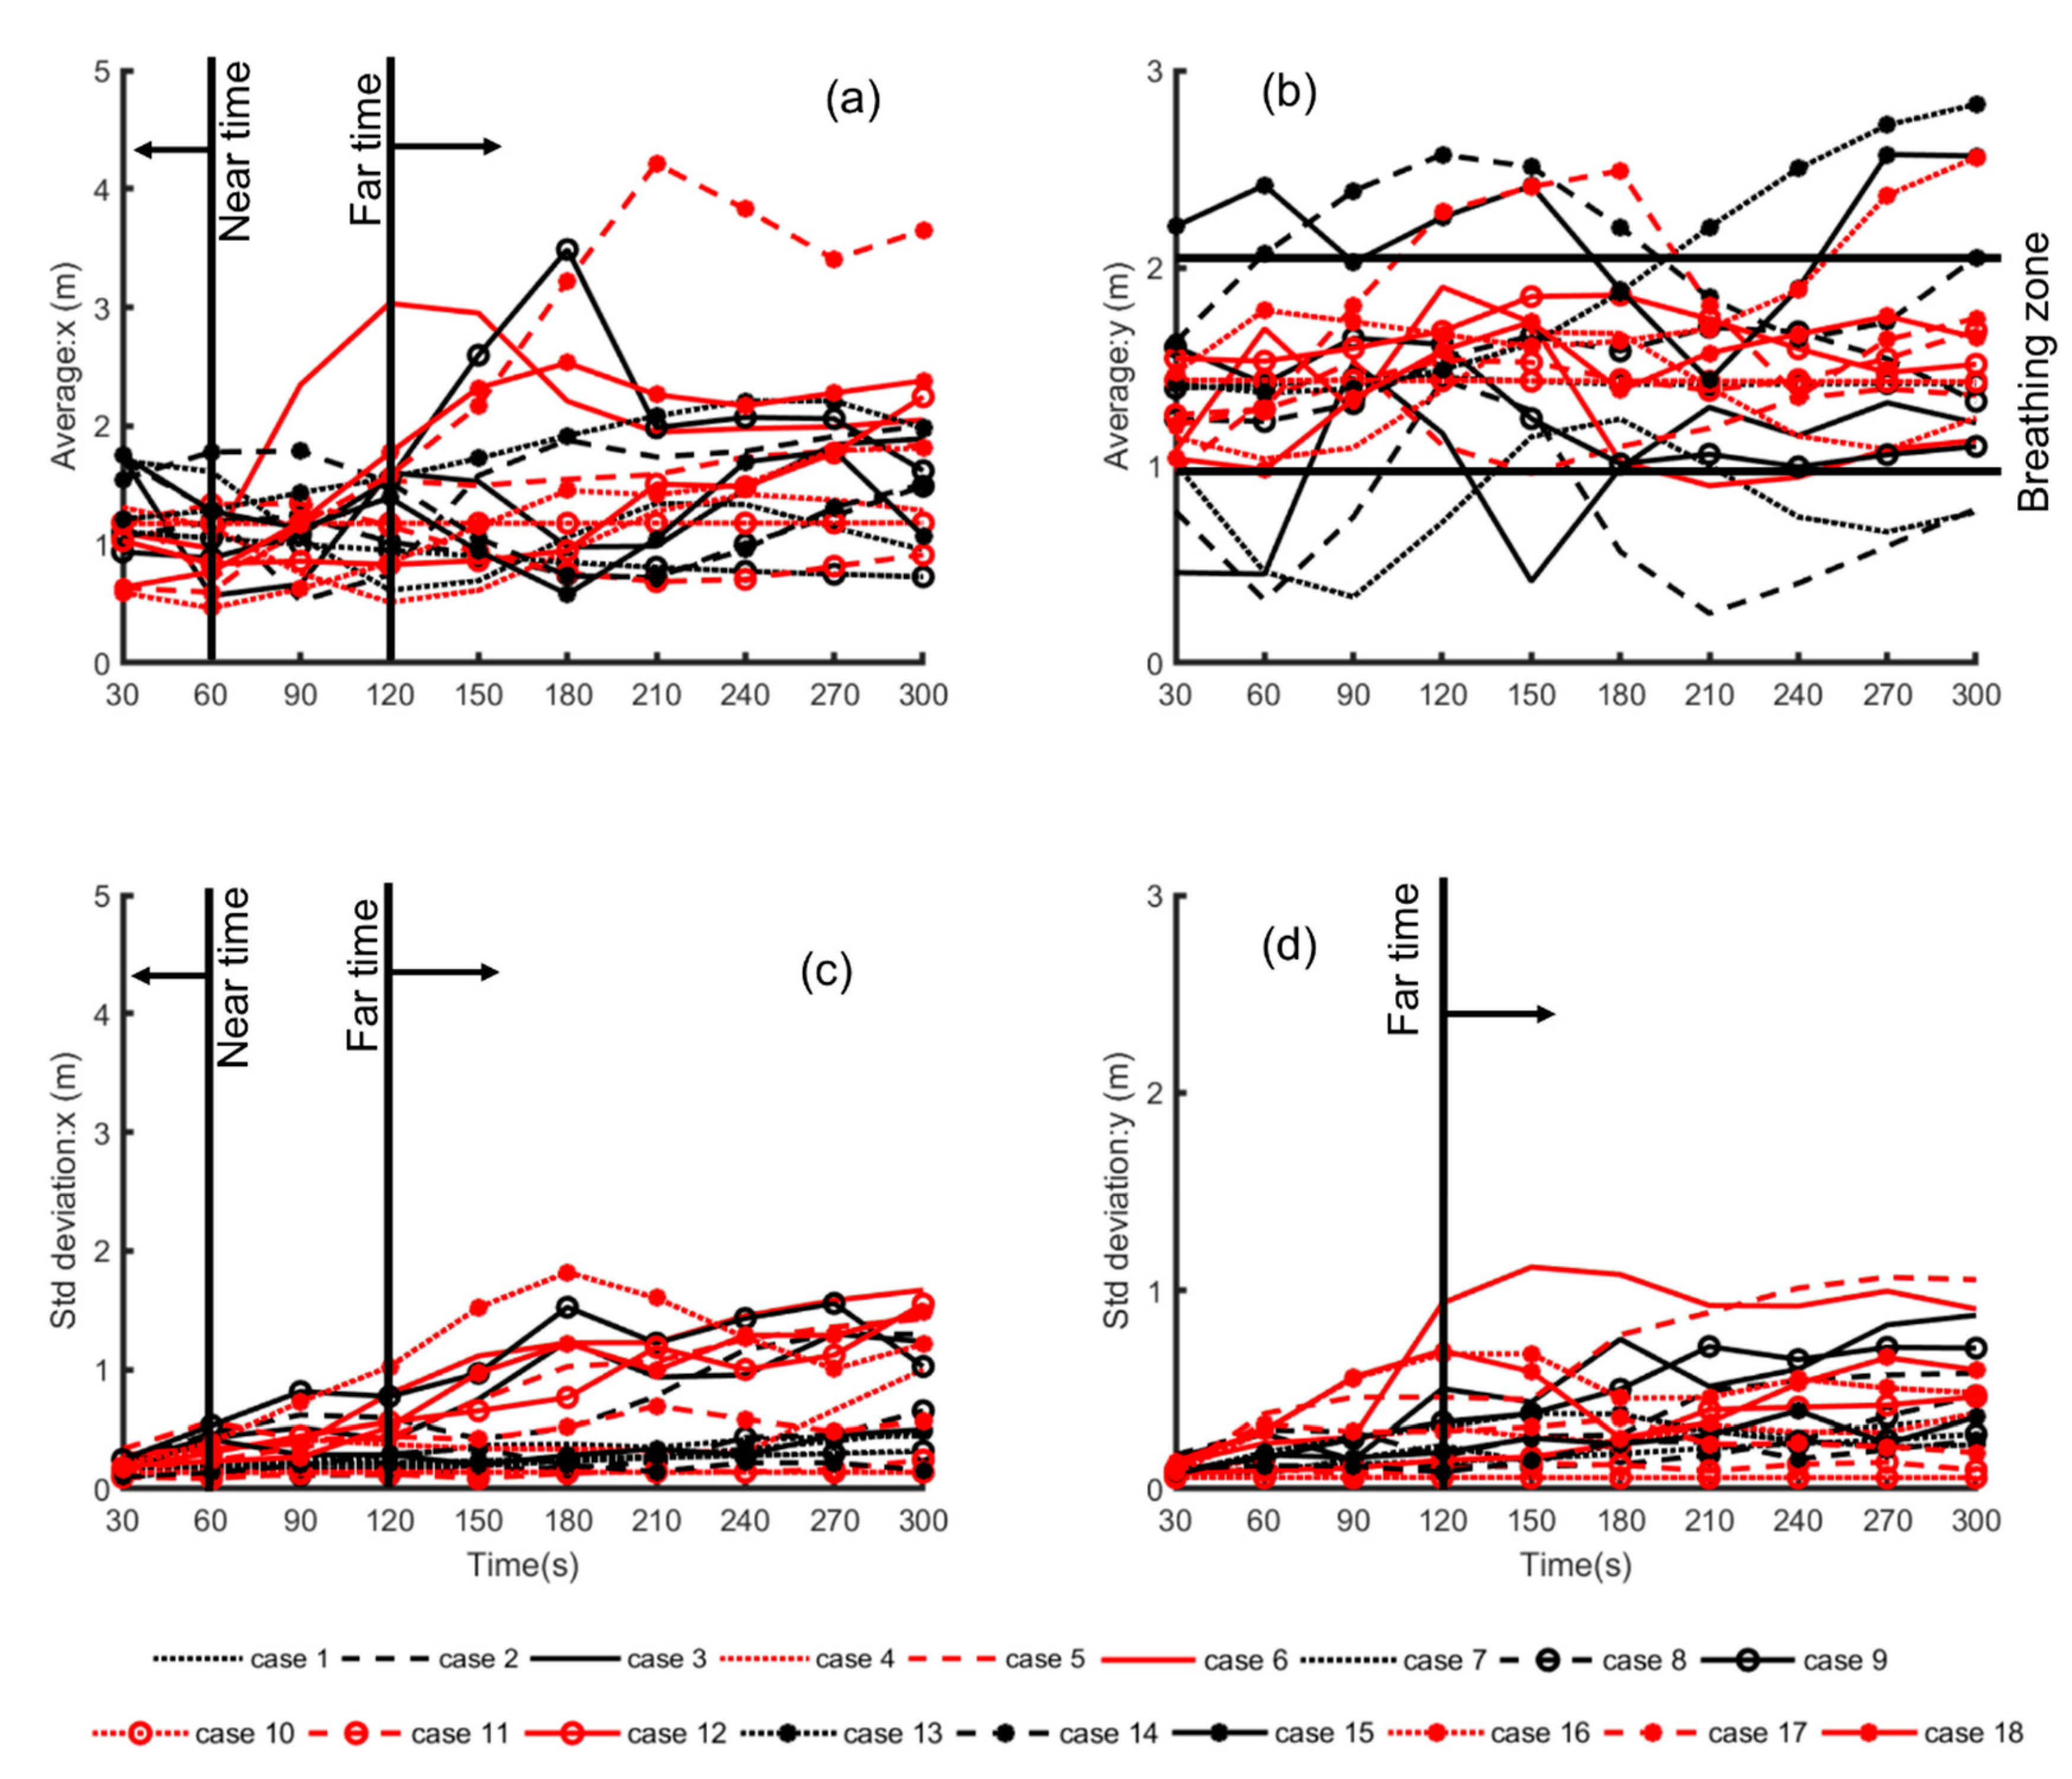
To assess the temporal trend for all cases, the average and standard deviation change over time for the
x and
y locations of the particles in the whole domain and in the breathing zone were plotted (
Figure 7). The dispersion trend of the particles could be classified under “near time”, <60 s after release, and “far time”, >120 s after release, along the horizontal direction of the room (
Figure 7a,c). For the first 60 s, the average location of the particles was on the inlet side, around the exhale zone, before dispersing afterward. After that, the effects of the room configuration appeared to take over with the average value of
x location, i.e., the spatial distance from the inlet side or the exhale region, increasing. The value of
x was mainly higher for higher ACH and for the configuration
hI/ho > 1, while it was lower for ACH = 3.
Figure 7c is the corresponding temporal change of the standard deviation of the spatial
x locations. The standard deviation is a representation of the particle clustering trend. Within the first minute of release, the standard deviation was ~0.5 or less for all cases. After 120 s, the particles started dispersing for some scenarios, and, for others, the particles remained clustered for the entire particle tracking duration.
Figure 7b shows a distinct difference in the average location of the particles along the room height. Particles released in the configuration where the inlet/outlet was located at the top appeared to congregate in the lower portion of the space (below 1.5 m) for all ACH and in the presence and absence of desks. Case 7 was the only exception, where the particles constantly stayed at the same average height. For all cases, the particles congregated in and around the breathing zone.
Figure 7d shows the corresponding standard deviation change of the particle positions for
y. The standard deviation increased beyond 120 s.
3.5. Dosage
The total number of particles inhaled over time was calculated using Equation (3), where
Dt is the dosage or the number of particles inhaled over a specific time period
t,
is the number of particles (maximum, minimum, or mean) in the breathing zone for time
t,
f is the fraction of particles that will enter the respiratory tracts based on a particle size of 0.05, and
accounts for breathing over the time period
t, assuming a representative adult population and that the amount of particles that can be breathed in
t time is
[
28].
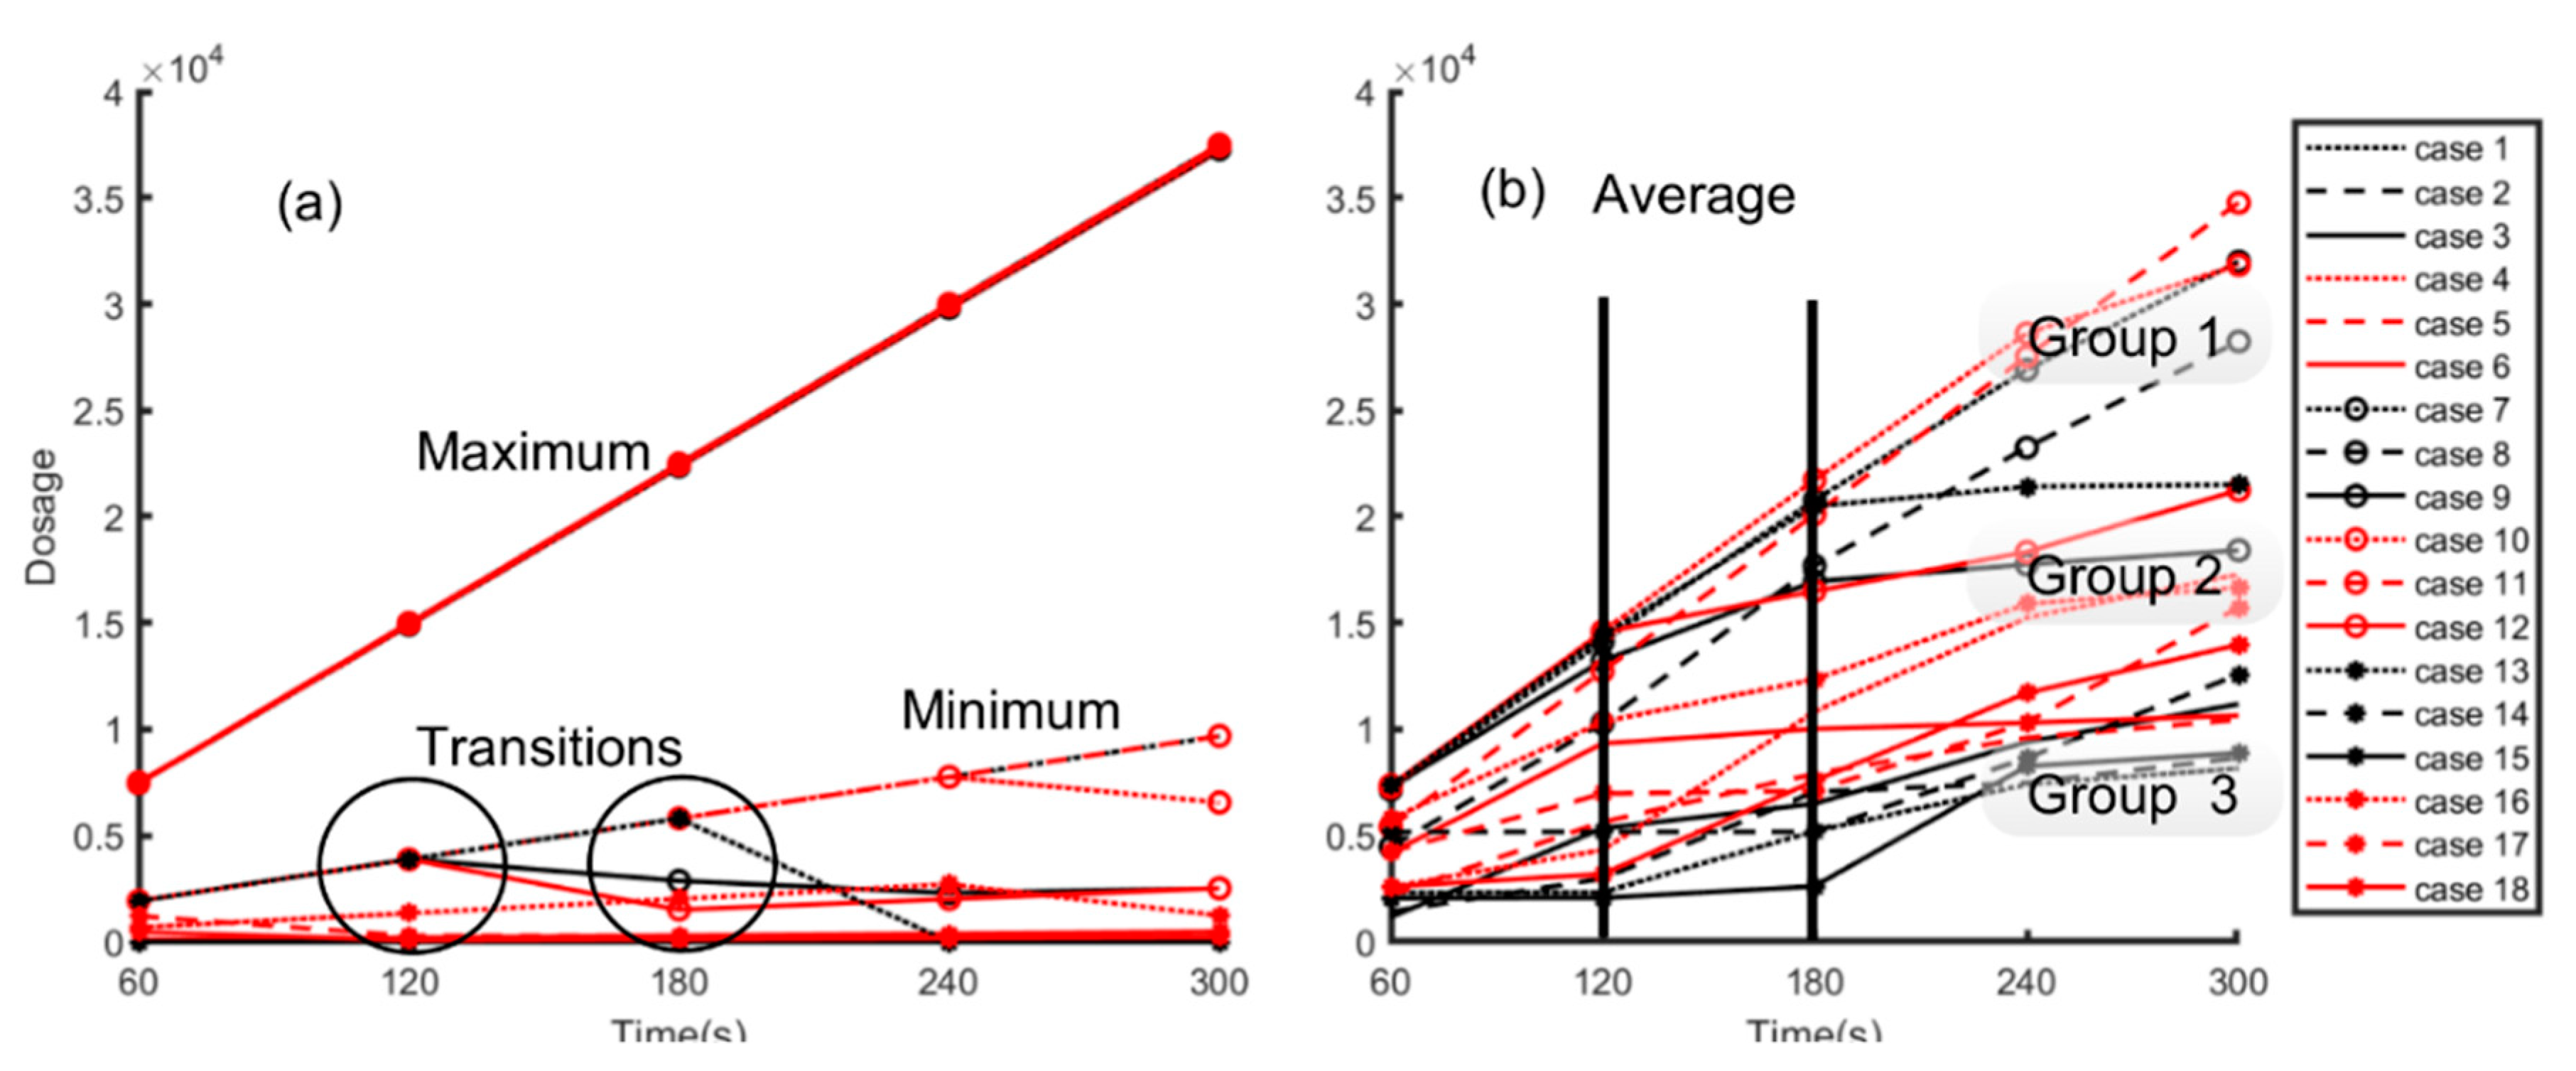
Figure 8a shows the results for the maximum and minimum dosage for the 18 cases, and
Figure 8b shows the change in average dosage over 300 s. The maximum inhaled dosage increased exponentially and overlapped for all cases, with the maximum value at 4 × 10
4. For the minimum value, it varied with the highest being near 1 × 10
4 for cases in which
hI/ho > 1 and desks were present with the exception of when ACH = 7 (case 12). The minimum hovered near zero and decreased for the other configurations of
hI/ho. There appeared to be a change in the behavior after 120 s and then after 180 s.
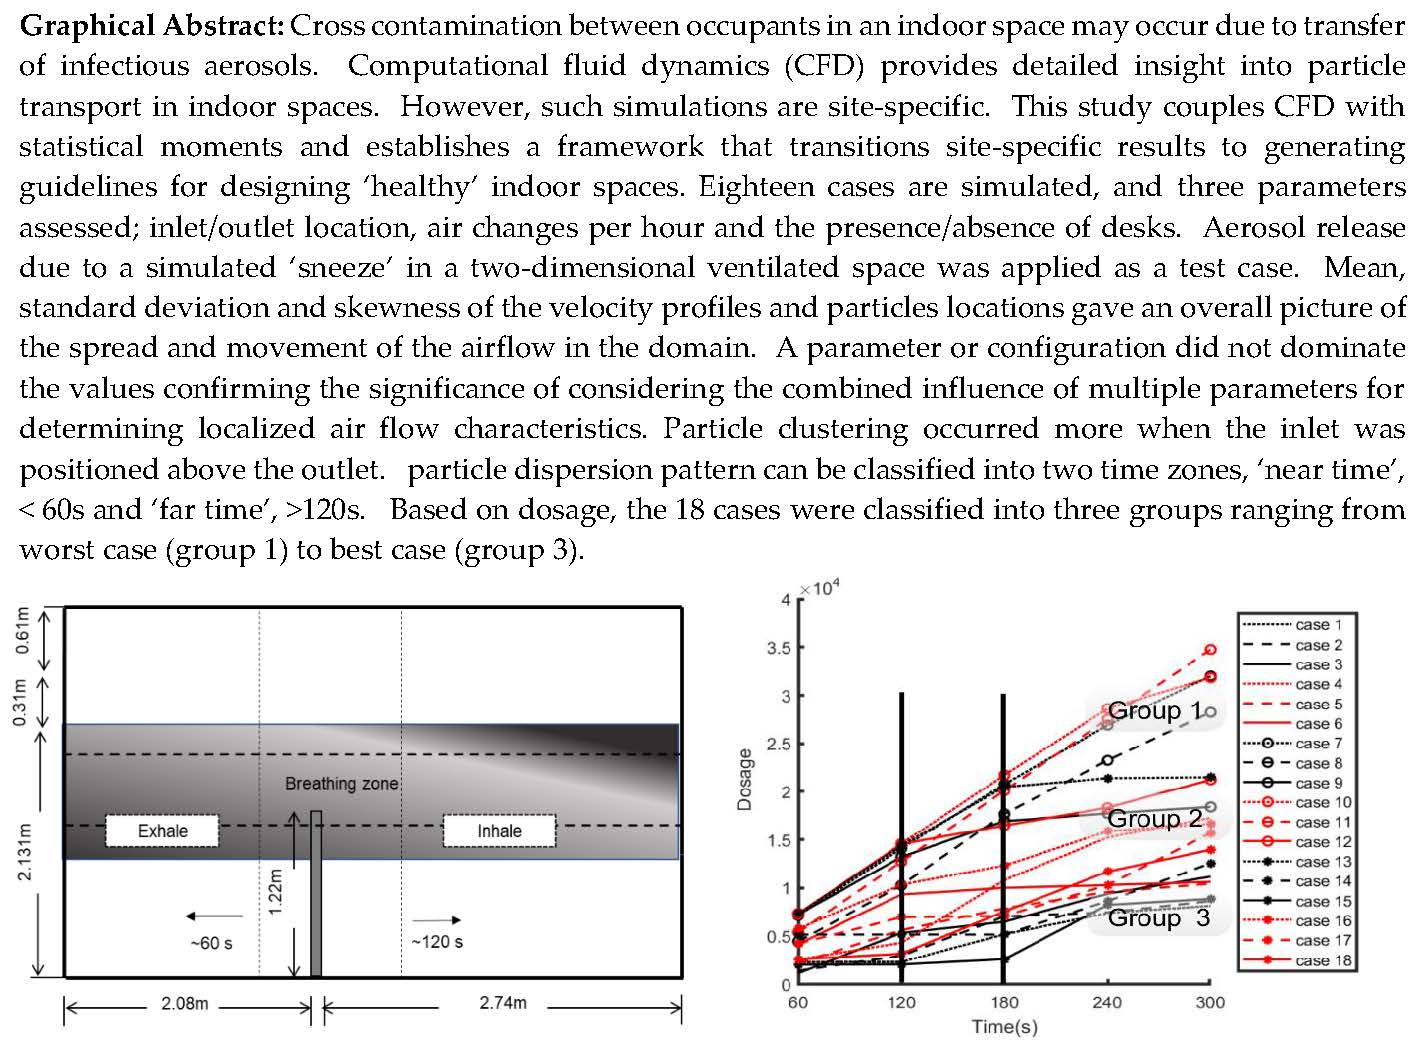
Figure 8b captures the average number of particles exposed to over the time period. The plot is broken down into three groups. Group 1 refers to the cases where there was an exponential rise. The average dosage in group 1 was also closer to the maximum line in
Figure 8a. Group 2 refers to cases which had an exponential rise until 120 s or 180 s and then leveled off. The dosage amounts also fell between the maximum and minimum boundaries. Group 3 covers the remaining cases, which fell near the minimum band of
Figure 8a. Some cases of this group also started with an exponential rise, but this rise was less steep than that in group 1. Others transitioned into an exponential rise after 120 s or 180 s.
Table 3 classifies the groups and the related cases with their specific configurations. In group 1,
hI/ho > 1 for all cases and ACH = 7 was absent. Hence, the “worst-case scenario” occurred when the inlet was located above the outlet for lower air changes. At higher air changes, the effects of the location were minimized. The six cases in group 2 were equally divided with two cases each for the ratio
hI/ho, i.e., when ACH = 7,
hI/ho > 1, and when ACH = 3,
hI/ho < 1, further illustrating the inter-dependent relationship between the relative location of inlet/outlet and air changes per hour. In group 3, which can be classified as the “best-case scenario”, there were four cases for the inlet and outlet located at the top, and the remaining four cases for the inlet located below the outlet.
The influence of the presence or absence of desks was neutral, comparing the number of cases in group 1. In group 2, there were more cases with desks than without desks. Transitions at different times occurred in the cases in group 2, indicating that desks influenced the outcomes. Group 3 justified having no desks, as cases where no desks were present dominated the group, indicating the inhalation dosage of particles increased for the occupants when desks were present.


