Article

Installation Planning in Regional Thermal Power Industry for Emissions Reduction Based on an Emissions Inventory

1
Department of Environmental Engineering, Zhejiang University, Hangzhou 310058, China
2
Appraisal Center for Environment and Engineering, Ministry of Environmental Protection, Beijing 100012, China
*
Author to whom correspondence should be addressed.
Int. J. Environ. Res. Public Health 2019, 16(6), 938; https://doi.org/10.3390/ijerph16060938
Submission received: 21 February 2019 / Revised: 5 March 2019 / Accepted: 11 March 2019 / Published: 15 March 2019
(This article belongs to the Section Environmental Science and Engineering)

Abstract

:
Exploring suitable strategies for air pollution control, while still maintaining sustainable development of the thermal power industry, is significant for the improvement of environmental quality and public health. This study aimed to establish a coupling relationship between installed capacity versus energy consumption and pollutant emissions, namely the installed efficiency, and to further provide ideas and methods for the control of regional air pollutants and installation planning. An inventory of 338 installed thermal power units in the Jing-Jin-Ji Region in 2013 was established as a case study, and comparisons were made by clustering classification based on the installed efficiencies of energy consumption and pollutant emissions. The results show that the thermal power units were divided into five classes by their installed capacity: 0–50, 50–200, 200–350, 350–600, and 600+ MW. Under the energy conservation and emissions reduction scenario, with the total installed capacity and the power generation generally kept constant, the coal consumption was reduced by 17.1 million tons (8.7%), and the total emissions were reduced by 79.8% (SO2), 84.9% (NOx), 60.9% (PM), and 59.5% (PM2.5).

1. Introduction

Currently, thermal power is still an indispensable part of the electric power industry. The world’s total thermal power generation was 9.41 × 10¹¹ GWh in 2015, which will continue to increase in the following 10 years and is expected to reach1.01 × 1012 GWh in 2025 [1]. However, air pollution from thermal power industry is an important cause of haze, being responsible for 35% of haze in China [2], with an annual 1% increase exposure to fine particulate matter (PM2.5) corresponding to a 2.942% increase in household health expenditure [3]. Previous studies have stated that the introduction of air control policies can help with the improvement of environment quality and public health [4,5]. Therefore, exploring suitable strategies for air pollution control, while maintaining sustainable development of the thermal power industry, is currently one of the issues receiving attention.
It has been shown that, in some industries, air pollutant emissions from 30% of pollution sources with the most outdated processes and technology account for 58%–82% of the industry’s total [6]. To determine the key areas to control emissions, and ultimately provide a solution to pollution strategies and installation planning, it is prudent to explore whether the aspects of low production capacity and air pollution also prevail in the thermal power sector.
To date, many emission inventories of pollutant sources have been established and studied to develop emissions reduction strategies in China and other countries [7,8,9,10]. However, these inventories analyzed the emissions reduction strategies based only on the level of emissions; even if the production scale was taken into account, no relationship was established between pollutant emissions and production scale [9]. Hence, after an emissions inventory is established, it is still necessary to establish a coupling relationship between production capacity and pollutant emissions, determine priorities for emissions reduction, and propose a reasonable emissions reduction strategy.
The Lorenz curve is generally used to illustrate the distribution of national income among a country’s population, and its function is to visualize the unequal relation of two variables [10]. In recent years, the types of variables illustrated by the Lorenz curve have become more extensive. This curve has been used to establish unequal relations between socio-economic variables, such as population, income, and gross domestic product, versus pollutant emissions, as well as in environmental fields, such as carbon emissions reduction [11,12,13]. The Gini coefficient can comprehensively examine the degree of distribution equality, because the curvature of the Lorenz curve is proportional to the Gini coefficient. An emissions reduction strategy may create inequality if it is based solely on the level of pollutant emissions without taking into account the impact of equipment and technology. Thus, the Lorenz curve can be used to analyze emissions reduction strategies in the thermal power industry by considering equipment, technology, and energy consumption, while the Gini coefficient can be adopted to estimate the inequality index of emissions from thermal power units. K-means clustering is a typical partition clustering algorithm that has been applied to determine the air index, and the association between air pollution and human health [14,15,16]. Owing to its simplicity and efficiency, k-means clustering is suitable for rapid grouping under the impact of multiple factors. Because the effects of three factors, namely installed capacity, coal consumption, and various pollutant emissions, should be taken into account for emissions reduction strategies in the thermal power industry, k-means clustering enables rapid grouping of installations according to the pollutant emissions inventory.
This paper aims to establish a coupling relationship between installed capacity versus energy consumption and pollutant emissions, and to further provide ideas and methods for the control of regional air pollutants and installation planning. The thermal power industry in the Beijing-Tianjin-Hebei (Jing-Jin-Ji) Region was selected for case analysis of SO2, NOx, and particulate matter (PM) emissions in the year 2013. We established an inventory of the production scale, coal consumption, and air pollutant emissions, and determined the inequality by using the Lorenz curve. A coupling relationship between installed capacity versus energy consumption and pollutant emissions was then established, namely the installed efficiency. Further, we used k-means clustering to classify thermal power units by their installation scale, analyzed the emission characteristics, and devised an energy conservation and emissions reduction (EE) scenario, thereby determining industry shutdown limits, entry thresholds, and industry upgrades based on the efficiency of pollutant emissions

2. Methods

2.1. Data Collection

The geographic location, unit information, coal consumption, flue gas emissions, pollutant control, and stack parameters of thermal power units in the Jing-Jin-Ji Region were collected and improved through the cooperation of the Environmental Engineering Assessment Center of the Ministry of Environmental Protection, local environmental protection departments, and the power generation groups. In addition, the database was checked and supplemented by a combination of field investigation and questionnaires. The details are shown in Table 1.

2.2. Establishment and Verification of Emissions Inventory

The emissions inventory was established based on pollution source survey methods to collect basic information, such as exact location, size, coal consumption, and power generation hours of coal-fired power-generating units in the Jing-Jin-Ji Region. The emissions factor method was used to calculate the emissions and emission rates from coal-fired units according to the mean hourly concentration of specific pollutant emissions, flue gas volume under standard conditions, and power generation hours during the study year. The pollutant emissions of SO2, NOx, and PM were calculated as follows:
Q = i = 1 S t C i × L i × 10 6
where Q is the annual emission of a pollutant in kilograms per hour, Ci is the mass concentration of hourly emissions of dry flue gas under standard conditions in milligrams per cubic meter, Li is the dry flue gas volume under standard conditions in cubic meters per hour (here, Li is estimated based on the coal consumption of 8.5–9 m3/kg according to the installation class), and St is the power generation hours within one year.
Because PM2.5 monitoring was not specifically performed, PM2.5 emissions were quantified based on their mass ratio in PM (the ratio gradually increased with decreasing PM concentration) to derive final emissions values.
According to the practical investigation, the actual total installed capacity of the thermal power industry in the Jing-Jin-Ji Region was 54,801 MW. This result was 2% lower than that recorded in the statistical yearbook, mainly because some enterprises had no production.
According to the investigation and verification, the total emissions from thermal power units in this region were 298,431.18 (SO2), 60,321.190 (NOx), and 72,007.47 (PM) tons, while the values were 311,706.7 (SO2), 709,217.7 (NOx), and 85,140.7 (PM) tons, according to the Annual Statistic Report [17]. The probable reason is that the statistics of some thermal power plants in the region were not accurately recorded.

2.3. Establishment of Unequal Relations

To analyze the inequality of pollutant emissions from different scales of thermal power units, the units were ranked by size in descending order. We calculated the ratio of cumulative capacity Y(i) and the cumulative ratio X(i) of SO2, NOx, PM, and PM2.5 emissions. A Lorenz curve for installed capacity versus pollutant emissions was drawn according to the function
Y = L ( X )
The Gini coefficient (G) was calculated by the curve fitting method using a polynomial function:
Y ^ = L ^ ( X ) = a n X n + a n 1 X n 1 + + a 1 X + a 0
where n = 6. The value of G was calculated using the following formula of integration:
G = 1 2 0 1 L ( X ) d X 1 2 0 1 L ^ ( X ) d X

2.4. Installed Efficiency

To establish the relationship between production scale versus pollutant emissions and coal consumption, we calculated the SO2, NOx, PM, and PM2.5 emissions and coal consumption per unit installed capacity, that is, the installed efficiency:
E i j = P i j C i j
where Eij is the installed efficiency of thermal power units with installed capacity I in the range of i–j (iI < j); Cij is the total installed capacity of thermal power units with installed capacity in the range of i–j; and Pij is the annual emissions of SO2, NOx, PM, and PM2.5 and coal consumption in thermal power units with installed capacity in the range of i–j.

2.5. K-Means Clustering Analysis
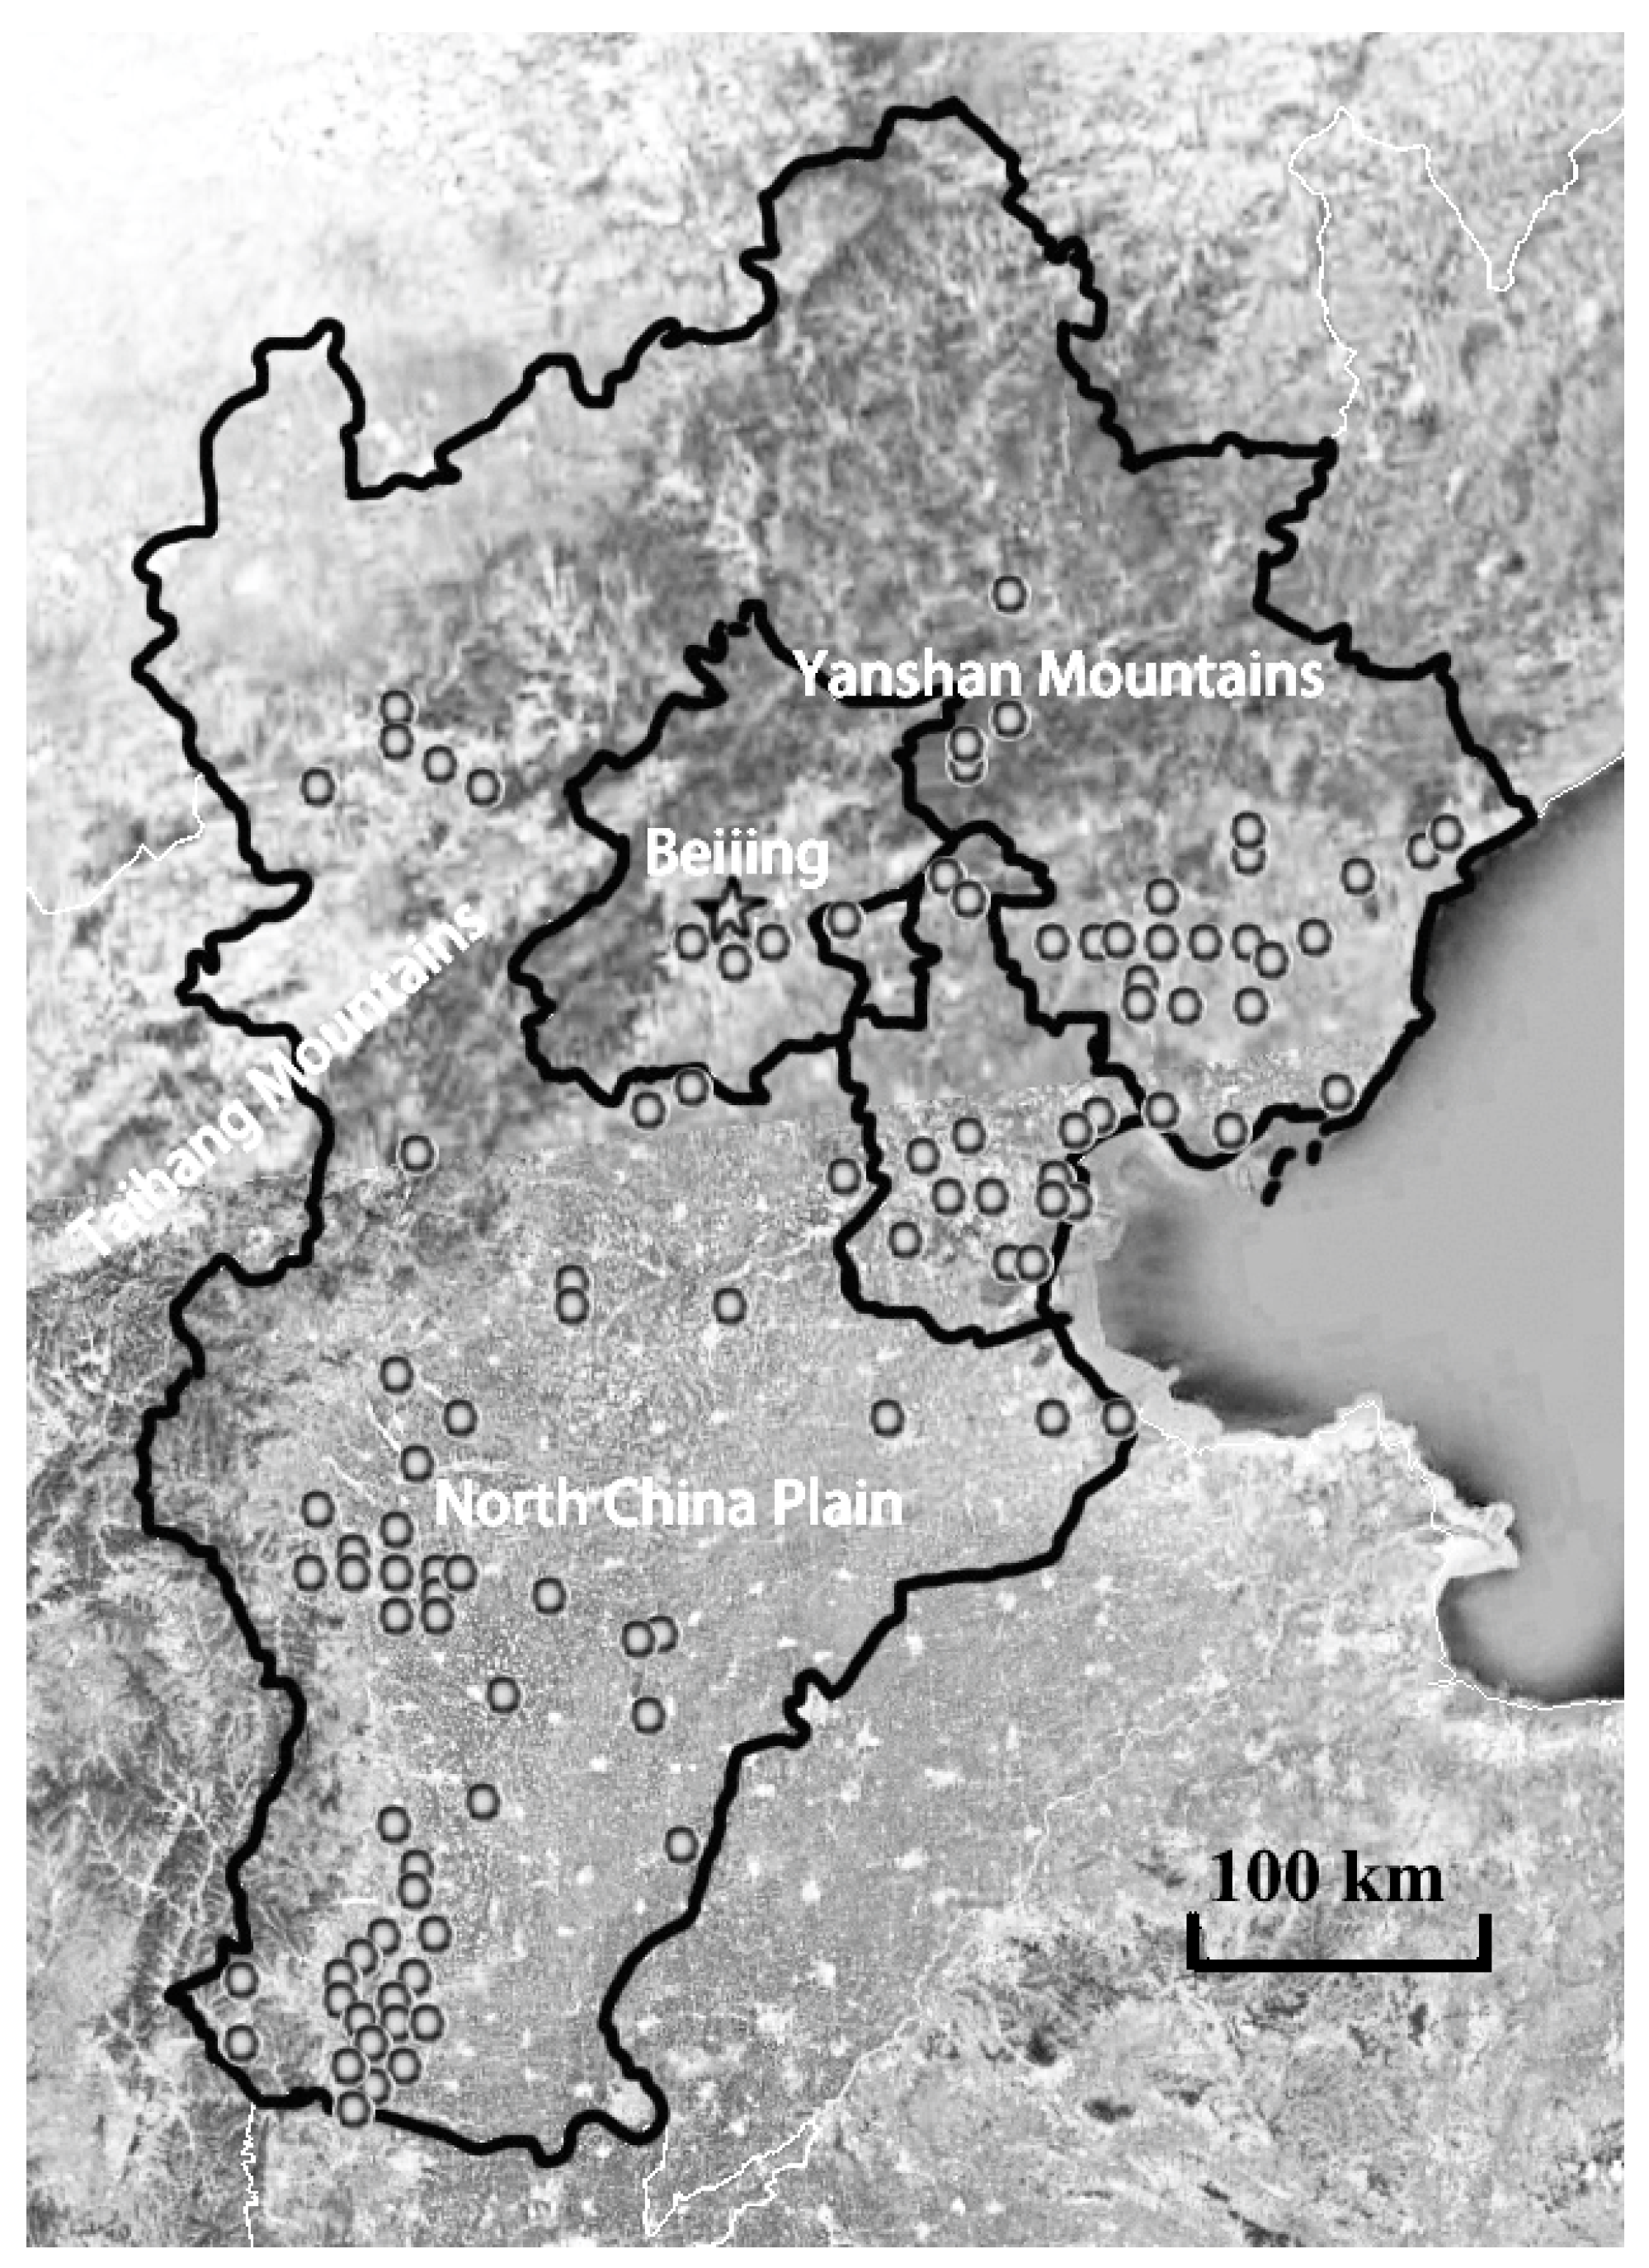
The SPSS statistical analysis software (IBM SPSS, Somers, NY, USA) was used to perform k-means clustering for thermal power enterprises classified into different installation scales. The variable for installed efficiency was calculated at 50 MW intervals. The total installed capacity of units with 400–450, 450–500, and 550–600 MW of thermal power was 0, and thus their installed efficiency was also 0, and these sizes were not included in the clustering process. The number of clusters was determined using the elbow method. The maximum number of iterations was 10 and the convergence criterion was 0.02.

2.6. Case Study

The Jing-Jin-Ji Region is located in the western part of China’s Bohai Economic Rim, at the northern end of the North China Plain. In this region, there are 11 prefecture-level cities, including Beijing, Tianjin, and Hebei, and it has a total area of 21.80 × 10⁴ km2. This region has experienced one of the fastest economic developments in the world over the past 30 years, and it is also one of the regions with the most serious air pollution in China. In January 2013, the Jing-Jin-Ji Region experienced the worst persistent haze pollution incident in history [18]. That same year, the Ministry of Environmental Protection of China announced the top 10 cities with most serious air pollution [19], 8 of which are in the Jing-Jin-Ji Region. Thermal power units in this region are mainly concentrated in the North China Plain where terrain is flat, especially in the southern area and the eastern coast of this region (Figure 1).
The Jing-Jin-Ji Region has numerous installations for China’s thermal power industry. According to the statistical yearbook [20], the thermal power installed capacity in Jing-Jin-Ji Region was 59.70 GW in 2013, that is, 6.9% of the country’s installed thermal power capacity; yet this only accounts for 2.3% of the country’s total area. From 2005 to 2013, thermal power installed capacity grew by 84.6% and thermal power generation grew by 66.8% in the Jing-Jin-Ji Region.
As the thermal power industry is the main coal-consuming industry in the Jing-Jin-Ji Region, its pollutant emissions have a profound impact on regional air quality. A recent study [21] showed that emissions from thermal power industry in the Jing-Jin-Ji Region accounted for 25.02% (SO2), 39.55% (NOx), and 5.73% (PM10, inhalable particles, <10 μm) of the region’s total emissions of these pollutants. According to the Environmental Quality Bulletin of the Beijing-Tianjin-Hebei Region [22,23,24], in 2013, the mean annual concentrations of pollutants such as NO2, PM2.5 (fine particles, <2.5 μm), and PM10 (excluding SO2) exceeded the national standards in Beijing and Tianjin, while the mean annual concentrations of all pollutants exceeded the national standards in Hebei Province. Thus, it is representative to select the thermal power industry in the Jing-Jin-Ji Region for case analysis in the year 2013.

3. Results and Discussion

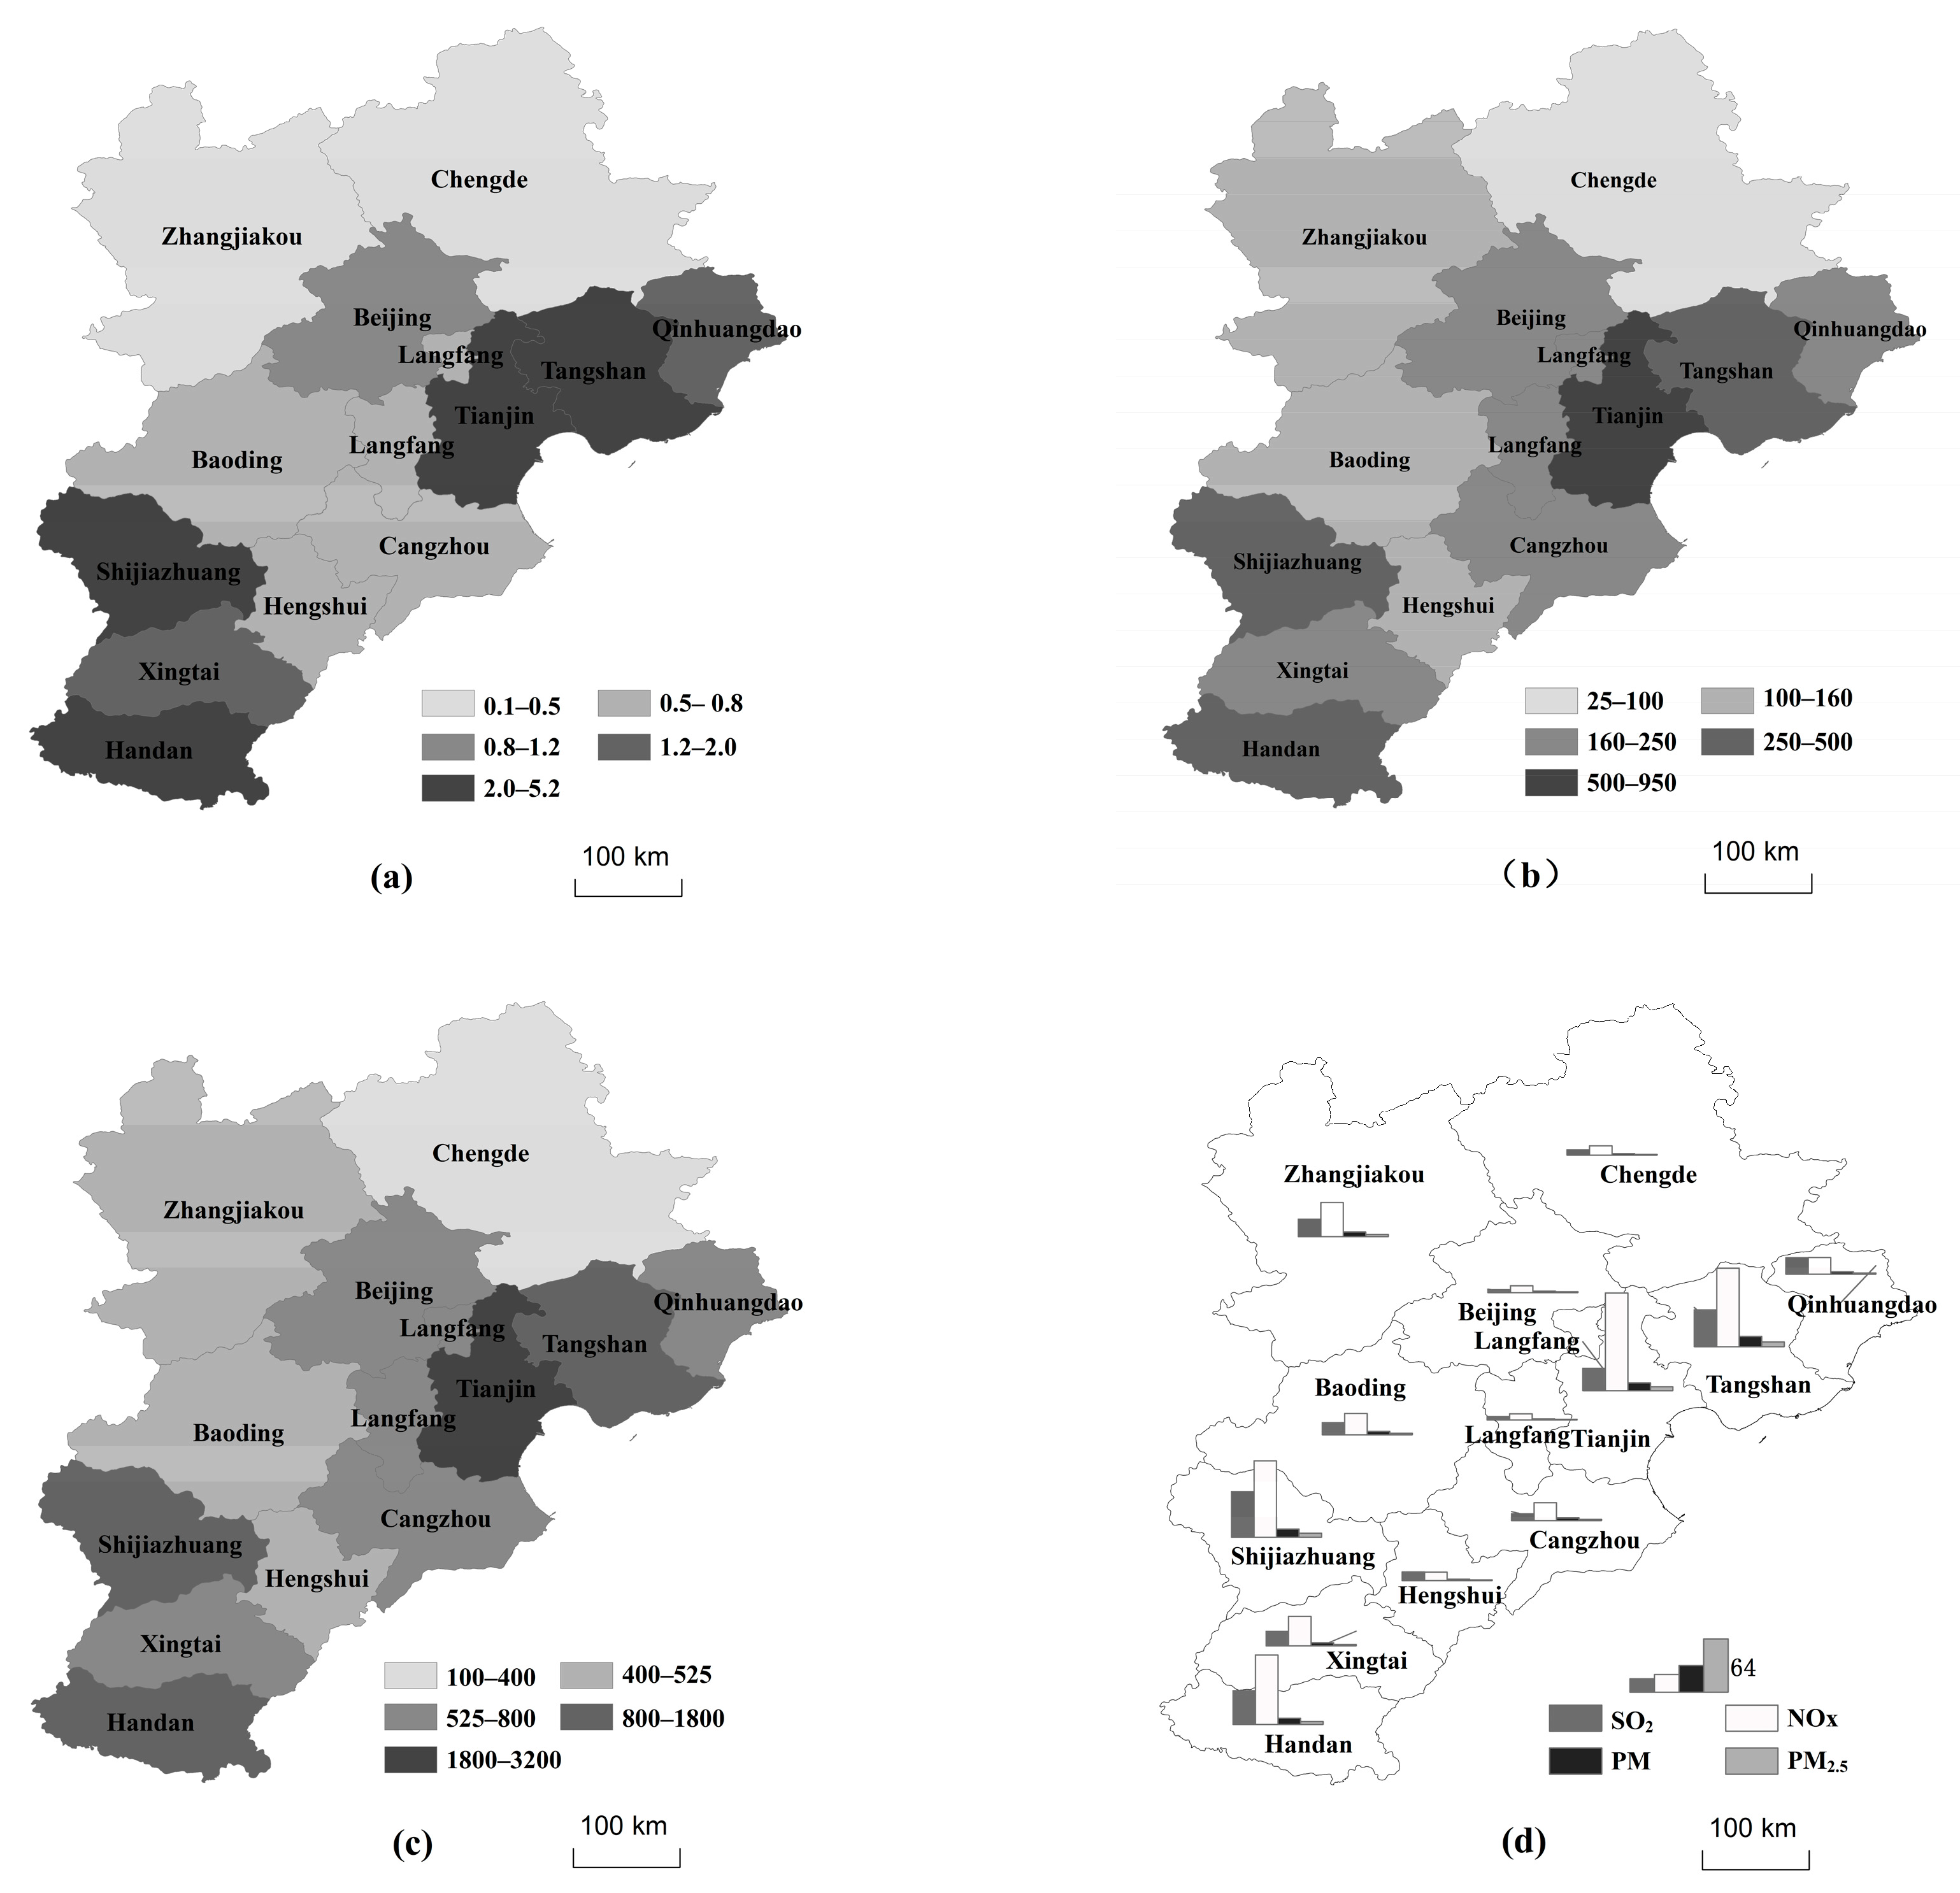
3.1. Production Scale and Emissions Data

There were 133 thermal power enterprises (groups) in the Jing-Jin-Ji Region in 2013, with a total of 338 installed units and a total installed capacity of 54,800.5 MW. The number of installed thermal power units per unit area and the installed capacity in different cities are detailed in Figure 2a,b. The installed capacity of thermal power units in Tianjin, Tangshan, Xingtai, and Handan was far greater than that in other cities. As is shown in Figure 1, these areas have flat terrain with more plains than mountains, and therefore are suitable for the construction of thermal power units.
The total coal consumption of the thermal power industry in the Jing-Jin-Ji Region was 196.3914 million tons, accounting for 10.34% of the total thermal coal consumption in China [20]. The spatial distribution of thermal power coal consumption per unit area, as shown in Figure 2c, was consistent with that of the installed level in the Jing-Jin-Ji Region. The total emissions of the thermal power industry in Jing-Jin-Ji Region were 146,791.87 (SO2), 351,303.49 (NOx), 36,712.58 (PM), and 18,551.32 (PM2.5) tons. The pollutant emissions of different cities are shown in Figure 2d.

3.2. Unit Classification

The Lorenz curve of pollutant emissions in Jing-Jin-Ji Region is shown in Figure 3. The emissions of thermal power units with Y(i) > 80% accounted for 39.7% (SO2), 34.0% (NOx), 34.7% (PM), and 32.8% (PM2.5) of the total emissions. That is, the SO2 emissions from the smallest 20% of units contributed to 39.7% of the total emissions.
By using the curve fitting method, the Gini coefficients of emissions were calculated to be 0.28 (SO2), 0.22 (NOx), 0.23 (PM), and 0.21 (PM2.5), showing a significant inequality of emissions. Hence, the thermal power units needed to be classified to study pollutant emissions and emissions reduction strategies for different classes.
The elbow method determined the number of clusters to be 5, and then k-means clustering was performed. Results are given in Table 2. Because no units had an installed capacity of 400–450, 450–500, or 550–600 MW thermal power, the fourth class was combined into the 350 to 600 MW class. In this way, the thermal power units were divided into five classes by their installation scale: 0–50, 50–200, 200–350, 350–600, and 600+ MW.

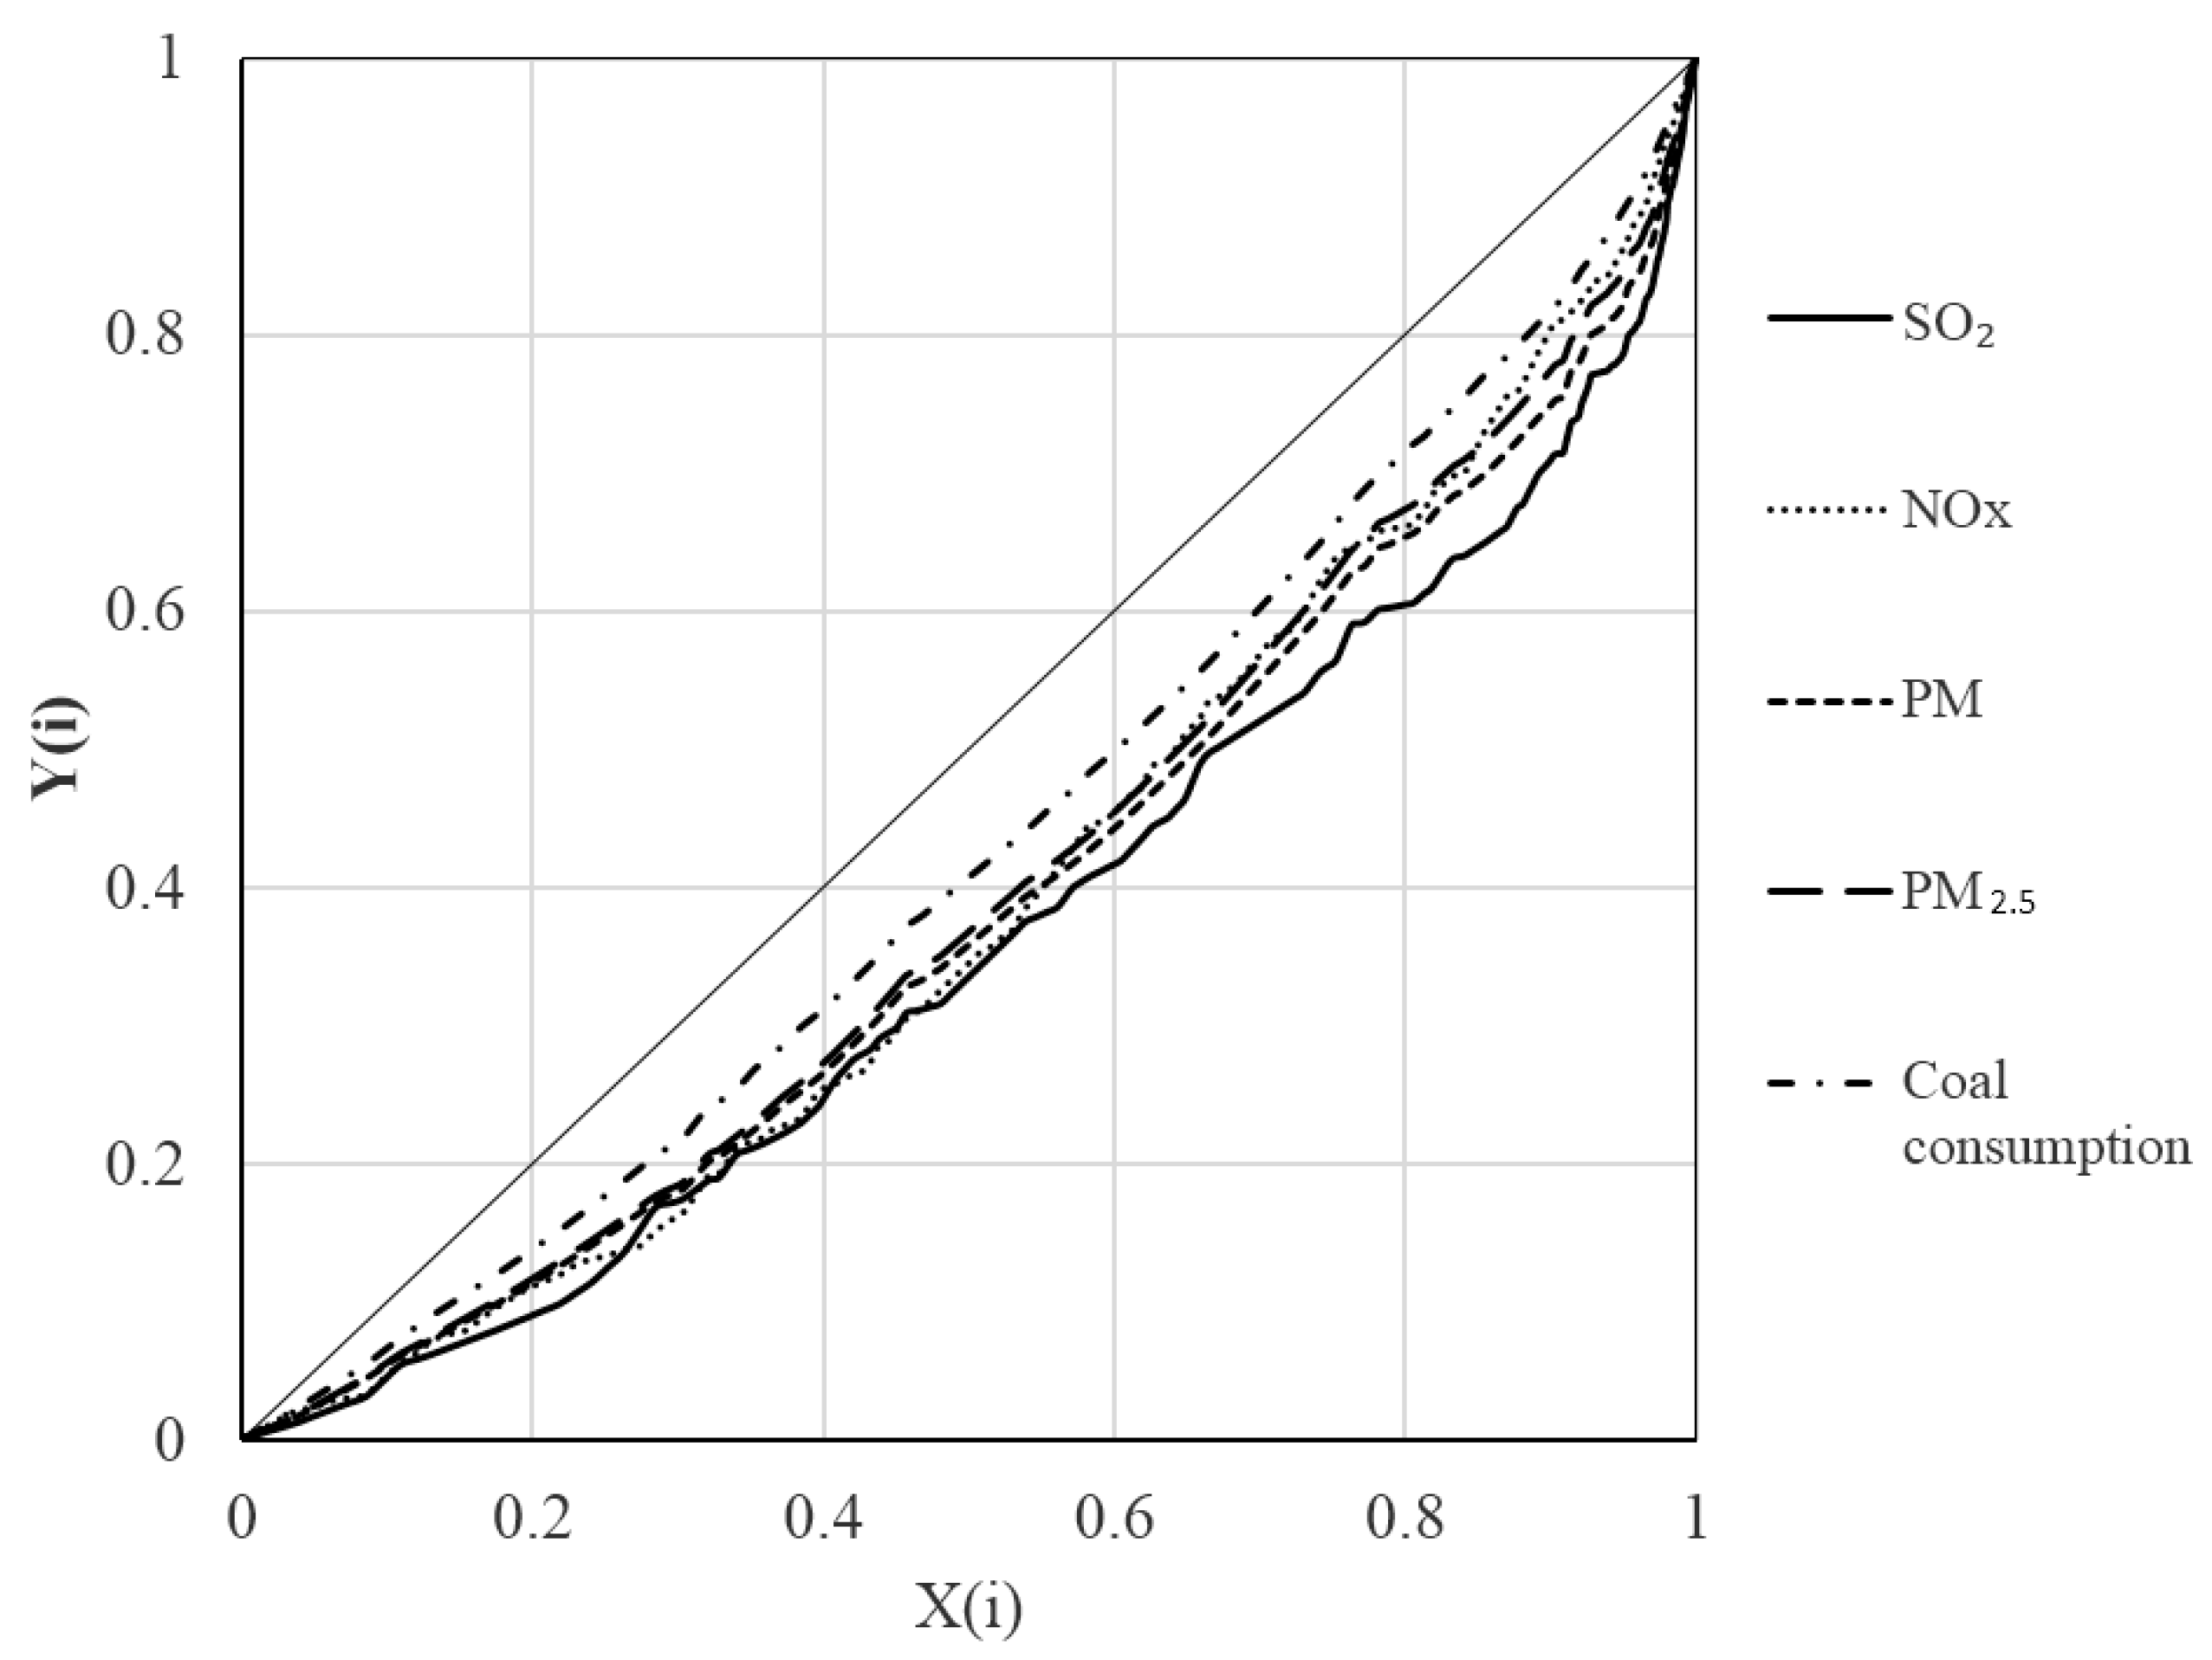
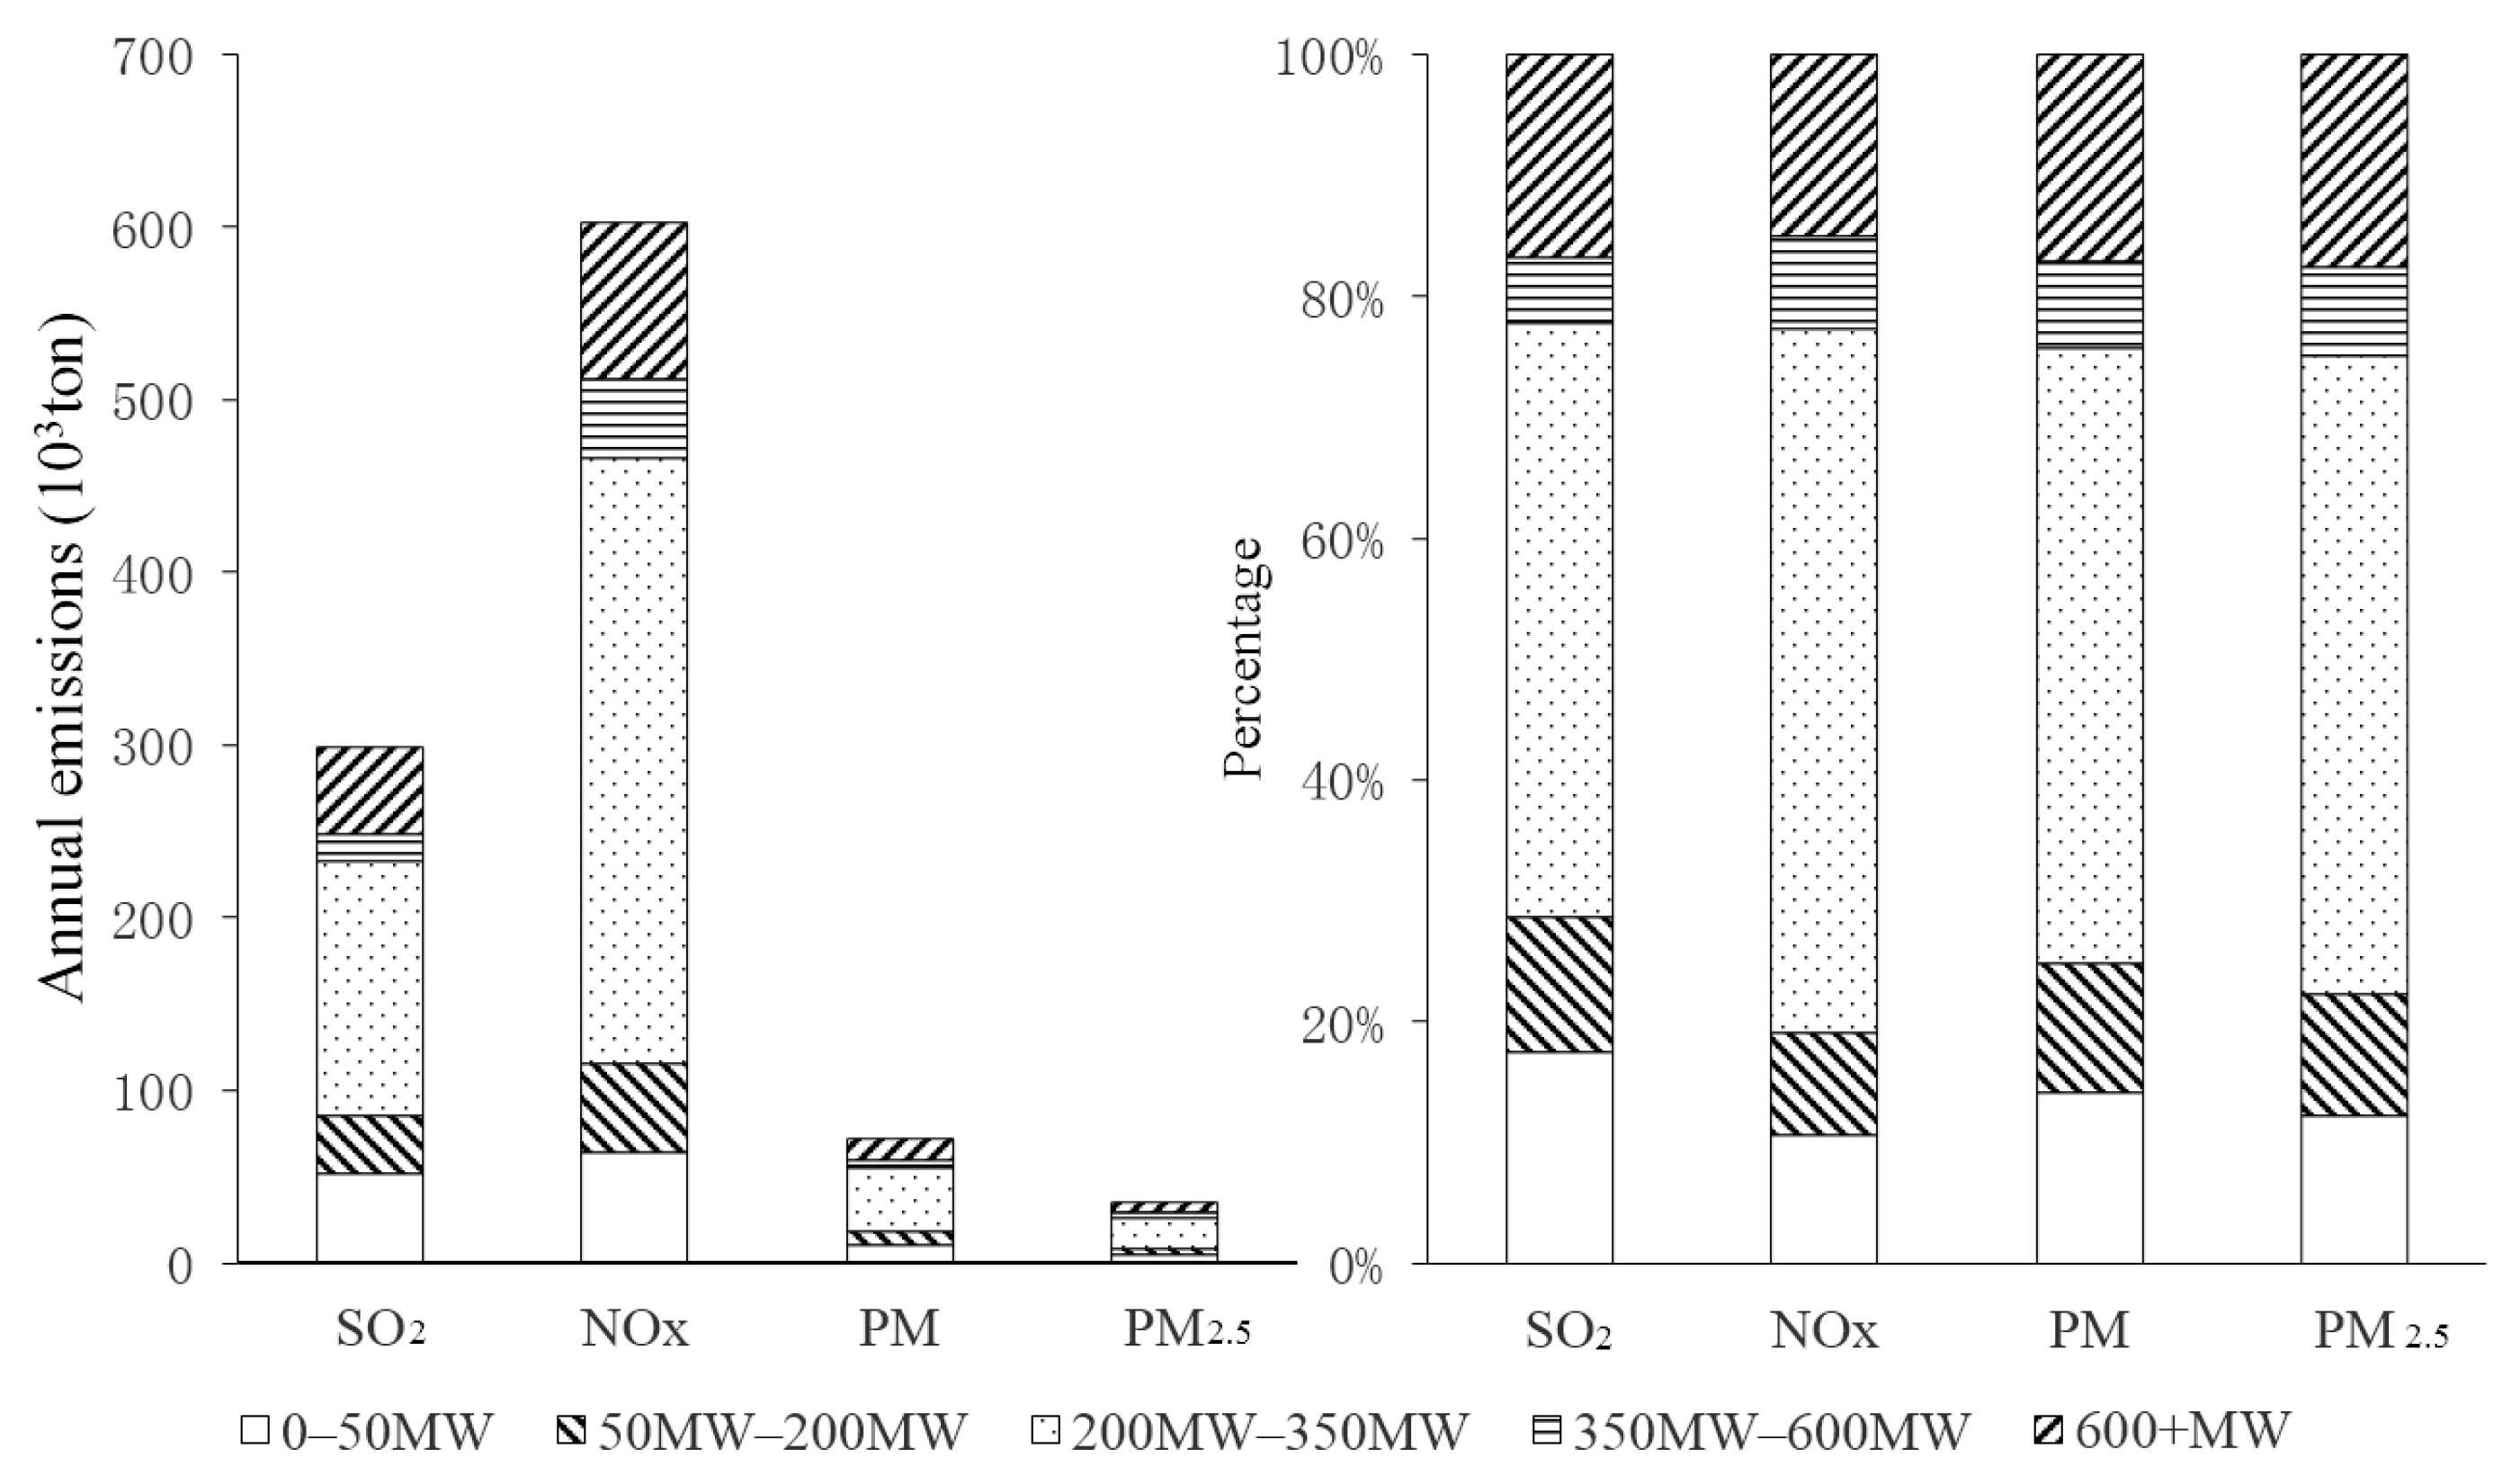
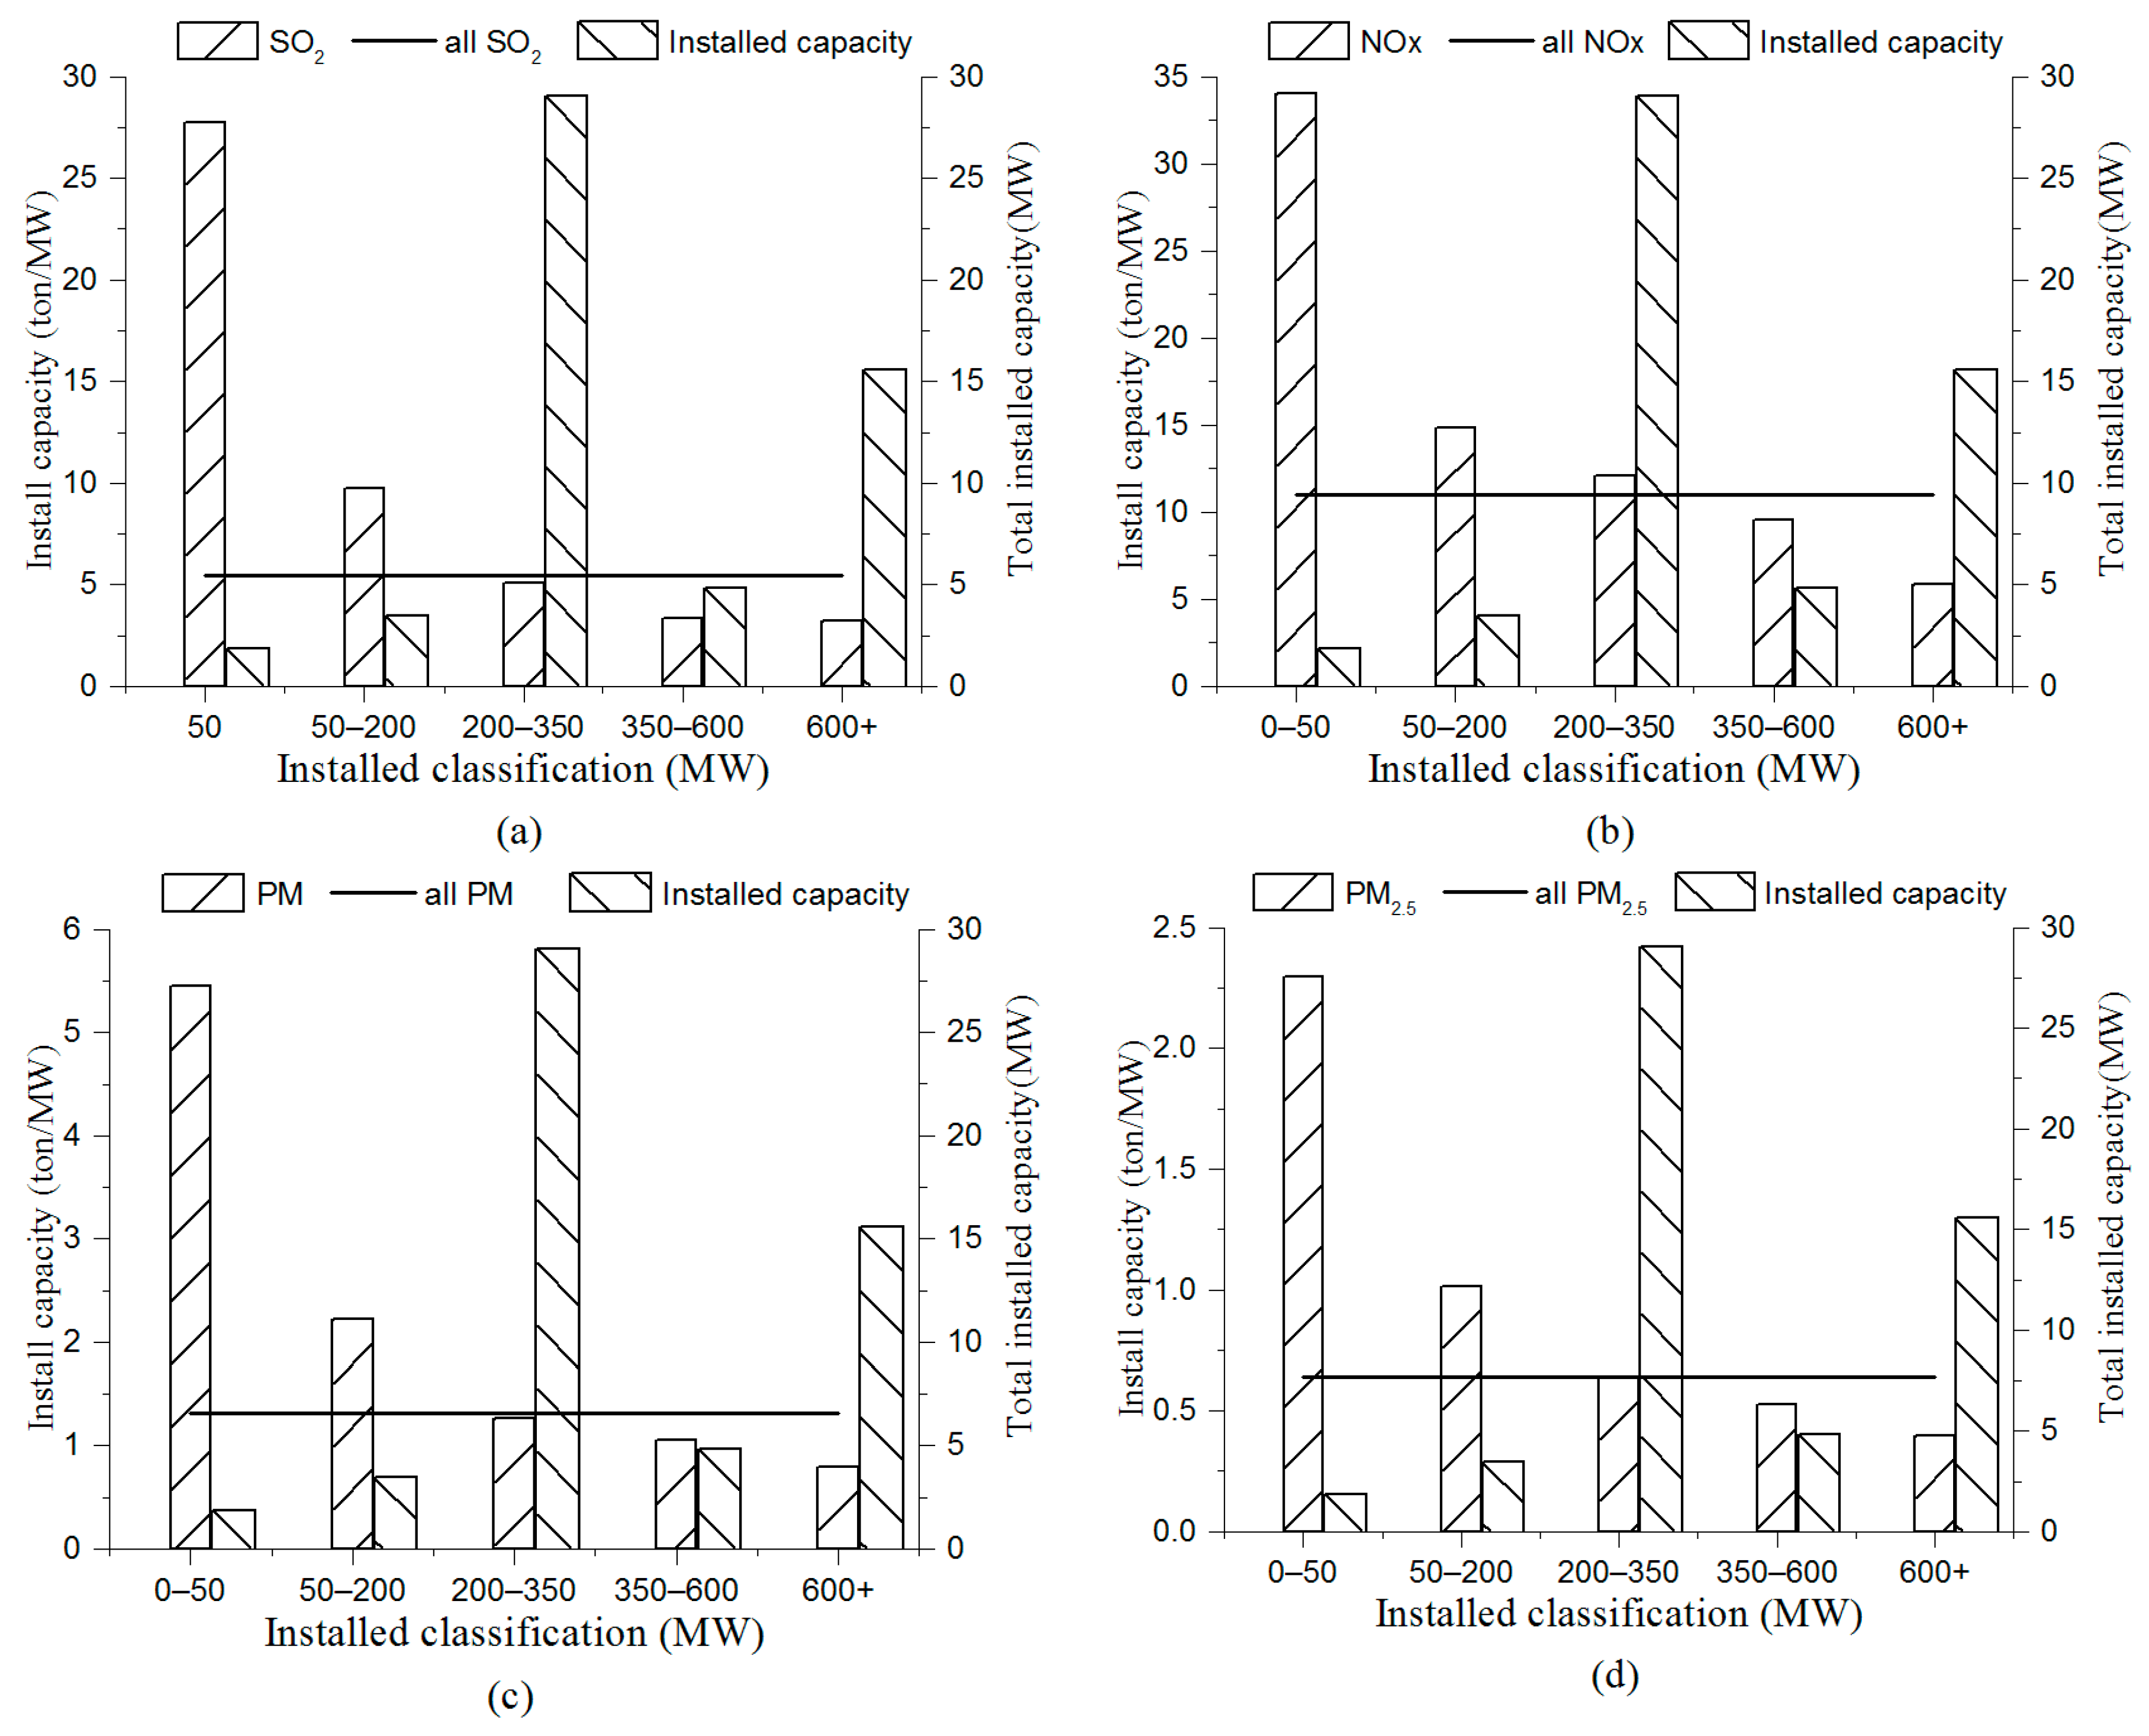
3.3. Emission Characteristics

The pollutant emissions and their ratio for each class of units are shown in Figure 4. The largest pollutant emissions level was found in thermal power units of 200–350 MW, where the total emissions were 146,791.87 (SO2), 351,303.49 (NOx), 36,712.58 (PM), and 18,551.32 (PM2.5) tons, with corresponding emission ratios of 49.2% (SO2), 58.2% (NOx), 51.0% (PM), and 52.9% (PM2.5). The installed capacity of this class of units accounted for 53.1% of the total installed capacity, which was comparable to the emission ratios. In addition, the installed capacity of 0 to 50 MW units accounted for 3.4% of the installed capacity, and their total emissions were 52,060.57 (SO2), 63,837.98 (NOx), 10,219.44 (PM), and 4306.38 (PM2.5) tons, with corresponding emission ratios of 17.4%, 10.6%, 14.2%, and 12.3%. According to these results, the effect of emissions reduction by shutting down units <50 MW was significant.

3.4. Installed Efficiency

The installed efficiency of different classes of thermal power units is shown in Figure 5. There were marked differences in the efficiency of pollutant emissions and coal consumption among the various classes. In other words, when converted to the same scale of power generation capacity, the coal consumption and pollutant emissions of small units were much greater than those of large units. For 0–50 MW of installed capacity, the installed efficiency reached 27.76 (SO2), 34.04 (NOx), 5.45 (PM), and 2.30 (PM2.5) kilotons/MW. With 600+ MW installed capacity, the installed efficiency was only 3.21 (SO2), 5.83 (PM), 0.80 (PM), and 0.40 (PM2.5) kilotons/MW.
The relationships between the installed efficiency of different classes versus the total installed capacity and mean installed efficiency are illustrated in Figure 6. By comparing the installed efficiency and the total installed capacity of different classes, it was derived that the units with 200–350 MW thermal power had the highest total installed capacity, while their installed efficiency of pollutant emissions and coal consumption was comparable to the average level and ranked third. Therefore, reducing the overall installed efficiency of 200–350 MW through a process improvement approach would significantly save energy and reduce emissions. The remaining four classes were units with 600+, 350–600, 50–200, and 0–50 MWh, in descending order according to the total installed capacity. Their corresponding installed efficiency rankings were fourth, fifth, second, and first. It is necessary to limit the production of units with 0–350 MW and encourage the construction of new units with 600+ MW. By comparing the installed efficiency and the mean installed efficiency of all classes, it was derived that the installed efficiency of pollutant emissions and coal consumption in thermal power units with 350+ MW was below the average level. The probable reason is that technologies of the thermal power units with 0–350 MW are limited and backward. Thus, it is more conducive to achieving the EE goals to restrict the installed capacity of new thermal power units to no less than 350 MW.

3.5. Energy Conservation and Emissions Reduction Scenario

An EE scenario was established according to the above analysis, combined with related standard bulletins in the thermal power industry [25,26,27,28,29], and compared with a “business as usual” (BAU) scenario for the thermal power industry in the Jing-Jin-Ji Region in 2013. We assumed that the coal quality was constant and that the total power generation and total installed capacity were generally kept constant. The EE scenario had the following characteristics:
(1)
All <50 MW units were shut down.
(2)
The 50–200 MW units met special emission standards (with emission concentrations no greater than 50 (SO2), 100 (NOx), and 20 (PM) mg/m3), with a standard coal consumption for power generation that was no greater than 293 g/kWh.
(3)
The 200–350 MW thermal power units met ultra-low emission standards (with emission concentrations no greater than 35 (SO2), 50 (NOx), and 10 (PM) mg/m3), with a standard coal consumption for power generation that was no greater than 293 g/kWh.
(4)
The existing 350–600 MW and 600+ MW thermal power units met ultra-low emission standards (as given in item 3), with a standard coal consumption for power generation no greater than 293 and 284 g/kWh when installed capacity was increased by 5% and 10%, respectively. The newly installed units met ultra-low emission standards and the standard coal consumption for power generation by the new thermal power units was no greater than 287 and 270 g/kWh, respectively.
The production scale, annual (a) coal consumption, and annual pollutant emissions of different unit classes under the BAU and EE scenarios are shown in Table 3.
The results show that under the EE scenario, different unit classes had the following effects on the total production scale and total pollutant emissions with respect to the BAU scenario:
(1)
Shutting down the 0–50 MW thermal power units reduced the installed capacity, power generation, and coal consumption by 3.4%, 3.7%, and 8.3%, respectively; the total emissions were reduced by 17.4% (SO2), 10.6% (NOx), 14.2% (PM) and 12.3% (PM2.5).
(2)
For the 50–200 MW units, the EE scenario with constant installed capacity and power generation reduced coal consumption by 0.9%; the total emissions by 8.6% (SO2), 5.8% (NOx), 5.9% (PM), and 5.1% (PM2.5).
(3)
For the 200–350 MW units, the EE scenario with constant installed capacity and power generation reduced coal consumption by 1.9%; the total emissions were reduced by 38.1% (SO2), 50.4% (NOx), 24.7% (PM), and 25.9% (PM2.5).
(4)
For the 350–600 MW units, the EE scenario increased the installed capacity, power generation, and coal consumption by 0.4%, 0.4%, and 0.4%, respectively; the total emissions were reduced by 3.6% (SO2), 6.4% (NOx), 5.0% (PM), and 5.1% (PM2.5).
(5)
For the 600+ MW units, the EE scenario increased the installed capacity, power generation, and coal consumption by 2.8%, 2.8%, and 2.1%, respectively; the total emissions were reduced by 12.1% (SO2), 11.7% (NOx), 11.1% (PM), and 11.4% (PM2.5).
The EE scenario considerably reduced pollutant emissions and saved more energy compared with the BAU scenario. Table 4 shows that when the total installed capacity and power generation were generally constant, the coal consumption was reduced by 17.1 million tons (8.7%), and the total emissions were reduced by 79.8% (SO2), 84.9% (NOx), 60.9% (PM), and 59.5% (PM2.5). Compared with a previous study [30], the total installed capacity of thermal power units increased by 4.1%, while total emissions were reduced by 15.0% (SO2), 12.6% (NOx), and 8.4% (PM).

4. Conclusions

In this study, an inventory of production scale, coal consumption, and air pollutant emissions was used to provide a reference for an energy conservation and emissions reduction strategy in the thermal power industry. Comparisons were made by clustering classification based on the installed efficiencies of energy consumption and pollutant emissions. This method can also apply to other polluting industries for the analysis of EE strategies from the perspective of emissions inventory.
Our results showed that emissions from the smallest 20% of thermal power units accounted for 39.7% (SO2), 34.0% (NOx), 34.7% (PM), and 32.8% (PM2.5) of total emissions from thermal power units in the Jing-Jin-Ji Region in 2013. According to the installed efficiency, the thermal power units were divided into five classes by their installation scale: 0–50, 50–200, 200–350, 350–600, and 600–1,000 MW. The analysis of emission characteristics revealed that units <50 MW had low total installed capacity and a high ratio of pollutant emissions, and we recommend that these plants be shut down as soon as possible. The analysis of installed efficiency revealed that units >350 MW had installed efficiency of energy consumption and pollutant emissions below the average level, so we further recommend that installed capacity of new thermal power units be restricted to no less than 350 MW.
Compared with BAU, the EE scenario not only considerably reduced the pollutant emissions of thermal power units, but also saved energy: when the total installed capacity and power generation were generally constant, the total coal consumption was reduced by 17.1 million tons (8.7%), whereas the total emissions were lowered by 79.8% (SO2), 84.9% (NOx), 60.9% (PM), and 59.5% (PM2.5).

Author Contributions

Conceptualization, Y.Z.; Data curation, C.Z.; Formal analysis, Y.Z. and C.Z.; Funding acquisition, Q.Z. and J.W.; Methodology, Y.Z.; Project administration, Q.Z.; Resources, J.W.; Supervision, J.W.; Visualization, Y.Z. and Q.Z.; Writing—Original draft, Y.Z. and Q.Z.; Writing—Review & editing, Y.Z.

Funding

This research was funded by the National Key Technology Research and Development Program of the Ministry of Science and Technology of the People’s Republic of China, grant number 2015BAA05B02.

Acknowledgments

The authors are grateful for data support provided by the Appraisal Center for Environment and Engineering Ministry of the Environmental Protection (ACEE).

Conflicts of Interest

The authors declare no conflict of interest.

References

  1. Energy Information Administration. International Energy Outlook 2017. Available online: http://cn.knoema.com/EIAIEO2017/international-energy-outlook-2017 (accessed on 16 February 2019).
  2. Jin, Q.; Fang, X.; Wen, B.; Shan, A. Spatio-temporal variations of PM2.5 emissions in china from 2005 to 2014. Chemosphere 2017, 183, 429–436. [Google Scholar] [CrossRef] [PubMed]
  3. Jing, Y.; Bing, Z. Air pollution and healthcare expenditure: Implication for the benefit of air pollution control in China. Environ. Int. 2018, 120, 443–455. [Google Scholar] [CrossRef]
  4. Liu, W.; Xu, Z.; Yang, T. Health Effects of Air Pollution in China. Int. J. Environ. Res. Pub. Health 2018, 15, 1471. [Google Scholar] [CrossRef] [PubMed]
  5. Jin, Y.; Andersson, H.; Zhang, S.; Tian, W.L.; Zhang, Q.Y.; Jiao, L. Air Pollution Control Policies in China: A Retrospective and Prospects. Int. J. Environ. Res. Pub. Health 2016, 13, 1219. [Google Scholar] [CrossRef] [PubMed]
  6. Li, X.; Sun, G.; Wang, X.; Tian, W.L.; Zhang, Q.Y.; Jiao, L. Vehicle exhausts emission characteristics and contributions in Hangzhou district. China Environ. Sci. 2013, 33, 1684–1689. (In Chinese) [Google Scholar]
  7. Shen, J.; Zheng, C.; Yang, L.; Xu, L.; Zhang, Y.; Liu, S.; Gao, X. Atmospheric emission inventory of SO3 from coal-fired power plants in China in the period 2009–2014. Atmos. Environ. 2019, 197, 14–21. [Google Scholar] [CrossRef]
  8. Liang, X.; Chen, X.; Zhang, J.; Shi, T.; Sun, X.; Fan, L.; Ye, D. Reactivity-based industrial volatile organic compounds emission inventory and its implications for ozone control strategies in China. Atmos. Environ. 2017, 162, 115–126. [Google Scholar] [CrossRef]
  9. Gao, C.; Gao, W.; Song, K.; Na, H.; Tian, F.; Zhang, S. Spatial and temporal dynamics of air-pollutant emission inventory of steel industry in China: A bottom-up approach. Resour. Conserv. Recycl. 2019, 143, 184–200. [Google Scholar] [CrossRef]
  10. Chen, L.; Li, L.; Yang, X.; Zhang, Y.; Chen, L.; Ma, X. Assessing the Impact of Land-Use Planning on the Atmospheric Environment through Predicting the Spatial Variability of Airborne Pollutants. Int. J. Environ. Res. Pub. Health 2019, 16, 172. [Google Scholar] [CrossRef] [PubMed]
  11. Gastwirth, J.L. A general definition of the Lorenz curve. Econometrica 1971, 39, 1037–1039. [Google Scholar] [CrossRef]
  12. Dong, L.; Liang, H. Spatial analysis on China’s regional air pollutants and CO2, emissions: Emission pattern and regional disparity. Atmos. Environ. 2014, 92, 280–291. [Google Scholar] [CrossRef]
  13. Dong, L.; Liang, H.; Luo, X.; Ren, J.; Zhang, N.; Gao, Z.; Dou, Y. Balancing regional industrial development: Analysis on regional disparity of China’s industrial emissions and policy implications. J. Clean. Prod. 2016, 126, 223–235. [Google Scholar] [CrossRef]
  14. Saha, D.; Kemanian, A.R.; Montes, F.; Gall, H.; Adler, P.R.; Rau, B.M. Lorenz curve and gini coefficient reveal hot spots and hot moments for nitrous oxide emissions. J. Geophys. Res. 2018, 123, 193–206. [Google Scholar] [CrossRef]
  15. Kingsy, G.R.; Manimegalai, R.; Geetha, D.M.; Rajathi, S.; Usha, K.; Raabiathul, B.N. Air pollution analysis using enhanced K-Means clustering algorithm for real time sensor data. In Proceedings of the 2016 IEEE Region 10 Conference, Singapore, 22–25 November 2016; pp. 1945–1949. [Google Scholar]
  16. Keller, J.P.; Drton, M.; Larson, T.; Kaufman, J.D.; Sandler, D.P.; Szpiro, A.A. Covariate-adaptive clustering of exposures for air pollution epidemiology cohorts. Ann. Appl. Stat. 2017, 11, 93–113. [Google Scholar] [CrossRef] [PubMed]
  17. Min, K.D.; Kwon, H.J.; Kim, K.; Kim, S.Y. Air Pollution Monitoring Design for Application in a Densely Populated City. Int. J. Environ. Res. Public Health 2017, 14, 686. [Google Scholar] [CrossRef] [PubMed]
  18. Ministry of Ecology and Environmental of the People’s Republic of China. Annual Statistic Report on Environment in China, 2014; China Environmental Press: Beijing, China, 2014; pp. 77–82.
  19. Huang, R.J.; Zhang, Y.; Bozzetti, C.; Ho, K.F.; Cao, J.J.; Han, Y.; Zotter, P. High secondary aerosol contribution to particulate pollution during haze events in china. Nature 2014, 514, 218–222. [Google Scholar] [CrossRef] [PubMed]
  20. Ministry of Ecology and Environmental of the People’s Republic of China. China Environmental Status Bulletin. 2013. Available online: http://www.mee.gov.cn/hjzl/zghjzkgb/lnzghjzkgb/201605/P020160526564151497131.pdf (accessed on 16 February 2019).
  21. China Electricity Council. Annual Development Report of Electric Power Industry in China, 2014. Guangming; Daily News Agency: Beijing, China, 2014; pp. 12–14. [Google Scholar]
  22. Xin, B.; Wang, G.; Wen, R.; He, Y.; Ding, F.; Wu, Z.; Meng, F. Air pollution effect of the thermal power plants in Beijing-Tianjin-Hebei region. China Environ. Sci. 2015, 35, 364–373. (In Chinese) [Google Scholar]
  23. Beijing Municipal Environmental Protection Bureau. Beijing Environmental Statement. 2013. Available online: http://www.bjepb.gov.cn/bjhrb/resource/cms/2018/04/2018042409561997085.pdf (accessed on 16 February 2019).
  24. Tianjin Ecology and Environment Bureau. Tianjin Environmental Statement. 2013. Available online: http://hjbh.tj.gov.cn/env/env-quality/the-state-of-the-environment-bulletin/tianjin/201410/t20141024–2196.html (accessed on 16 February 2019).
  25. Hebei Provincial Department of Ecology and Environment. Hebei Environmental Statement. 2013. Available online: http://www.hebhb.gov.cn/hjzlzkgb/201406/P020140606552933555911.pdf (accessed on 16 February 2019).
  26. Emission Standards of Air Pollutants for Thermal Power Plants GB 13223–2011; China Environmental Press: Beijing, China, 2011.
  27. Ministry of Ecology and Environmental of the People’s Republic of China. Announcement on the Implementation of Special Emission Limits for Air Pollutants. 2013. Available online: http://dqhj.mee.gov.cn/zcfg/201303/t20130305–343569.shtml (accessed on 16 February 2019).
  28. National Development and Reform Commission. Action Plan for Energy Saving, Emission Reduction, Upgrading Coal-Fired Power Plants (2014–2020). 2014. Available online: http://bgt.ndrc.gov.cn/zcfb/201409/t20140919–626242.html (accessed on 16 February 2019).
  29. Ministry of Ecology and Environmental of the People’s Republic of China. Air Pollution Control Work Program in Jing-Jin-Ji Region and Surrounding Areas for 2017. 2017. Available online: http://dqhj.mep.gov.cn/dtxx/201703/t20170323–408663.shtml (accessed on 16 February 2019).
  30. Wu, J.; Zhou, C.; Xu, H.; Huang, R.; Mo, H.; Zhu, J.; Zhang, Q. Study on spatial-temporal variabilities of air pollution emission from coal-fired power generation industry in Beijing-Tianjing-Hebei region. Environ. Eng. 2017, 8, 141–145. (In Chinese) [Google Scholar]
Figure 1. Distribution of thermal power units in the Jing-Jin-Ji Region.
Ijerph 16 00938 g001
Figure 2. Spatial distribution of thermal power units in the Jing-Jin-Ji Region: (a) installations per unit area (10−3 units/km2), (b) installed capacity per unit area (kW/km2), (c) coal consumption per unit area (ton/km2/year), (d) annual emissions (10−3 ton/year).
Ijerph 16 00938 g002
Figure 3. Lorenz curve of thermal power units in Jing-Jin-Ji Region.
Ijerph 16 00938 g003
Figure 4. Pollutant emissions and ratios for each class.
Ijerph 16 00938 g004
Figure 5. Installed capacity. * The unit of installed efficiency for coal consumption is 103 ton/MW, and the unit of installed efficiency for pollutants is ton/MW.
Ijerph 16 00938 g005
Figure 6. Installed capacity and installed efficiency: (a) installed capacity and SO2 emissions installed efficiency, (b) installed capacity and NOx emissions installed efficiency, (c) installed capacity and PM emissions installed efficiency, (d) installed capacity and PM2.5 emissions installed efficiency, (e) installed capacity and coal consumption installed efficiency.
Ijerph 16 00938 g006aIjerph 16 00938 g006b
Table 1. Information gathering methods.
Information CategorySpecific Description
Geographic location City, province and longitude, latitude (°/′/′′)
Unit informationUnit number, installation thermal capacity, boiler tonnage, construction conditions, construction property, and power generation hours
Coal consumption constructionStandard coal consumption for power generation, coal consumption, coal quality information (ash content, sulfur content, nitrogen content, mercury content, coal source, and calorific value)
Flue gas emissionsFlue gas volume, SO2 concentration, SO2 emission rate, NOx concentration, NOx emission rate, PM concentration, and PM emission rate
Pollutant controlTreatment process, treatment efficiency, emission concentration, and emission load
Chimney parametersHeight, outlet diameter, outlet temperature, flow rate, and emission pattern
Table 2. K-means clustering of installed efficiency.
Installed CapacityCoal Consumption
(103 ton/MW)
SO2
(ton/MW)
NOx
(ton/MW)
PM
(ton/MW)
PM2.5
(ton/MW)
Cluster
0–500.8727.7634.045.452.31
50–1000.5810.315.072.631.182
100–1500.549.9213.11.780.872
150–2000.5310.0514.692.451.062
200–2500.464.9413.81.160.65
250–3000.44.8412.331.170.625
300–3500.365.1311.821.290.655
350–4000.313.5811.711.050.534
400–450 *------
450–500 *------
500–5500.352.9312.081.050.524
550–600 *------
600–6500.273.5460.830.423
650–7000.263.185.280.810.43
1000+0.211.716.090.570.293
* The total installed capacity is 0 in 400–450, 450–500, and 550–600 MW, so the installed efficiency does not exist.
Table 3. Scenario analysis results.
Installed Classification
(MW)
ScenarioNumber of Installed Units Installed Capacity
(MW)
Power Generation
(106 MWh)
Coal Consumption
(106 ton/a)
SO2
(103 ton/a)
NOx
(103 ton/a)
PM
(103 ton/a)
PM2.5
(103 ton/a)
0–50BAU1561875.512.216.452.163.810.24.3
EE00000000
50–200BAU413453.021.619.033.651.37.73.5
EE413453.021.617.27.916.33.41.7
200–350BAU10529,082.0174.3105.0146.8351.336.718.6
EE10529,082.0174.3101.233.147.318.99.5
350–600BAU124830.027.915.716.046.15.12.5
EE125071.529.316.55.27.41.50.7
600+BAU2415,560.094.040.350.090.712.46.2
EE2517,116.0103.444.314.019.94.32.2
BAU: business as usual; EE: energy-conservation and emissions-reduction. Ton/a: ton/annual.
Table 4. Scenario comparison.
Scenario
Comparison
Installed Capacity
(MW)
Power Generation
(106 MWh)
Coal Consumption
(106 ton/a)
SO2
(103 ton/a)
NOx
(103 ton/a)
PM
(103 ton/a)
PM2.5
(103 ton/a)
BAU54,800.5330.1196.4298.4603.272.035.1
EE54,722.5328.7179.360.290.928.114.1
Ratio−0.1%−0.4%−8.7%−79.8%−84.9%−60.9%−59.9%

