Limited Knowledge of Chronic Kidney Disease among Type 2 Diabetes Mellitus Patients in India

Abstract
:1. Introduction
2. Methodology
2.1. Study Setting
2.2. Study Population
2.3. Questionnaire Used
2.4. Clinical and Laboratory Analysis
2.5. Statistical Analysis
3. Results
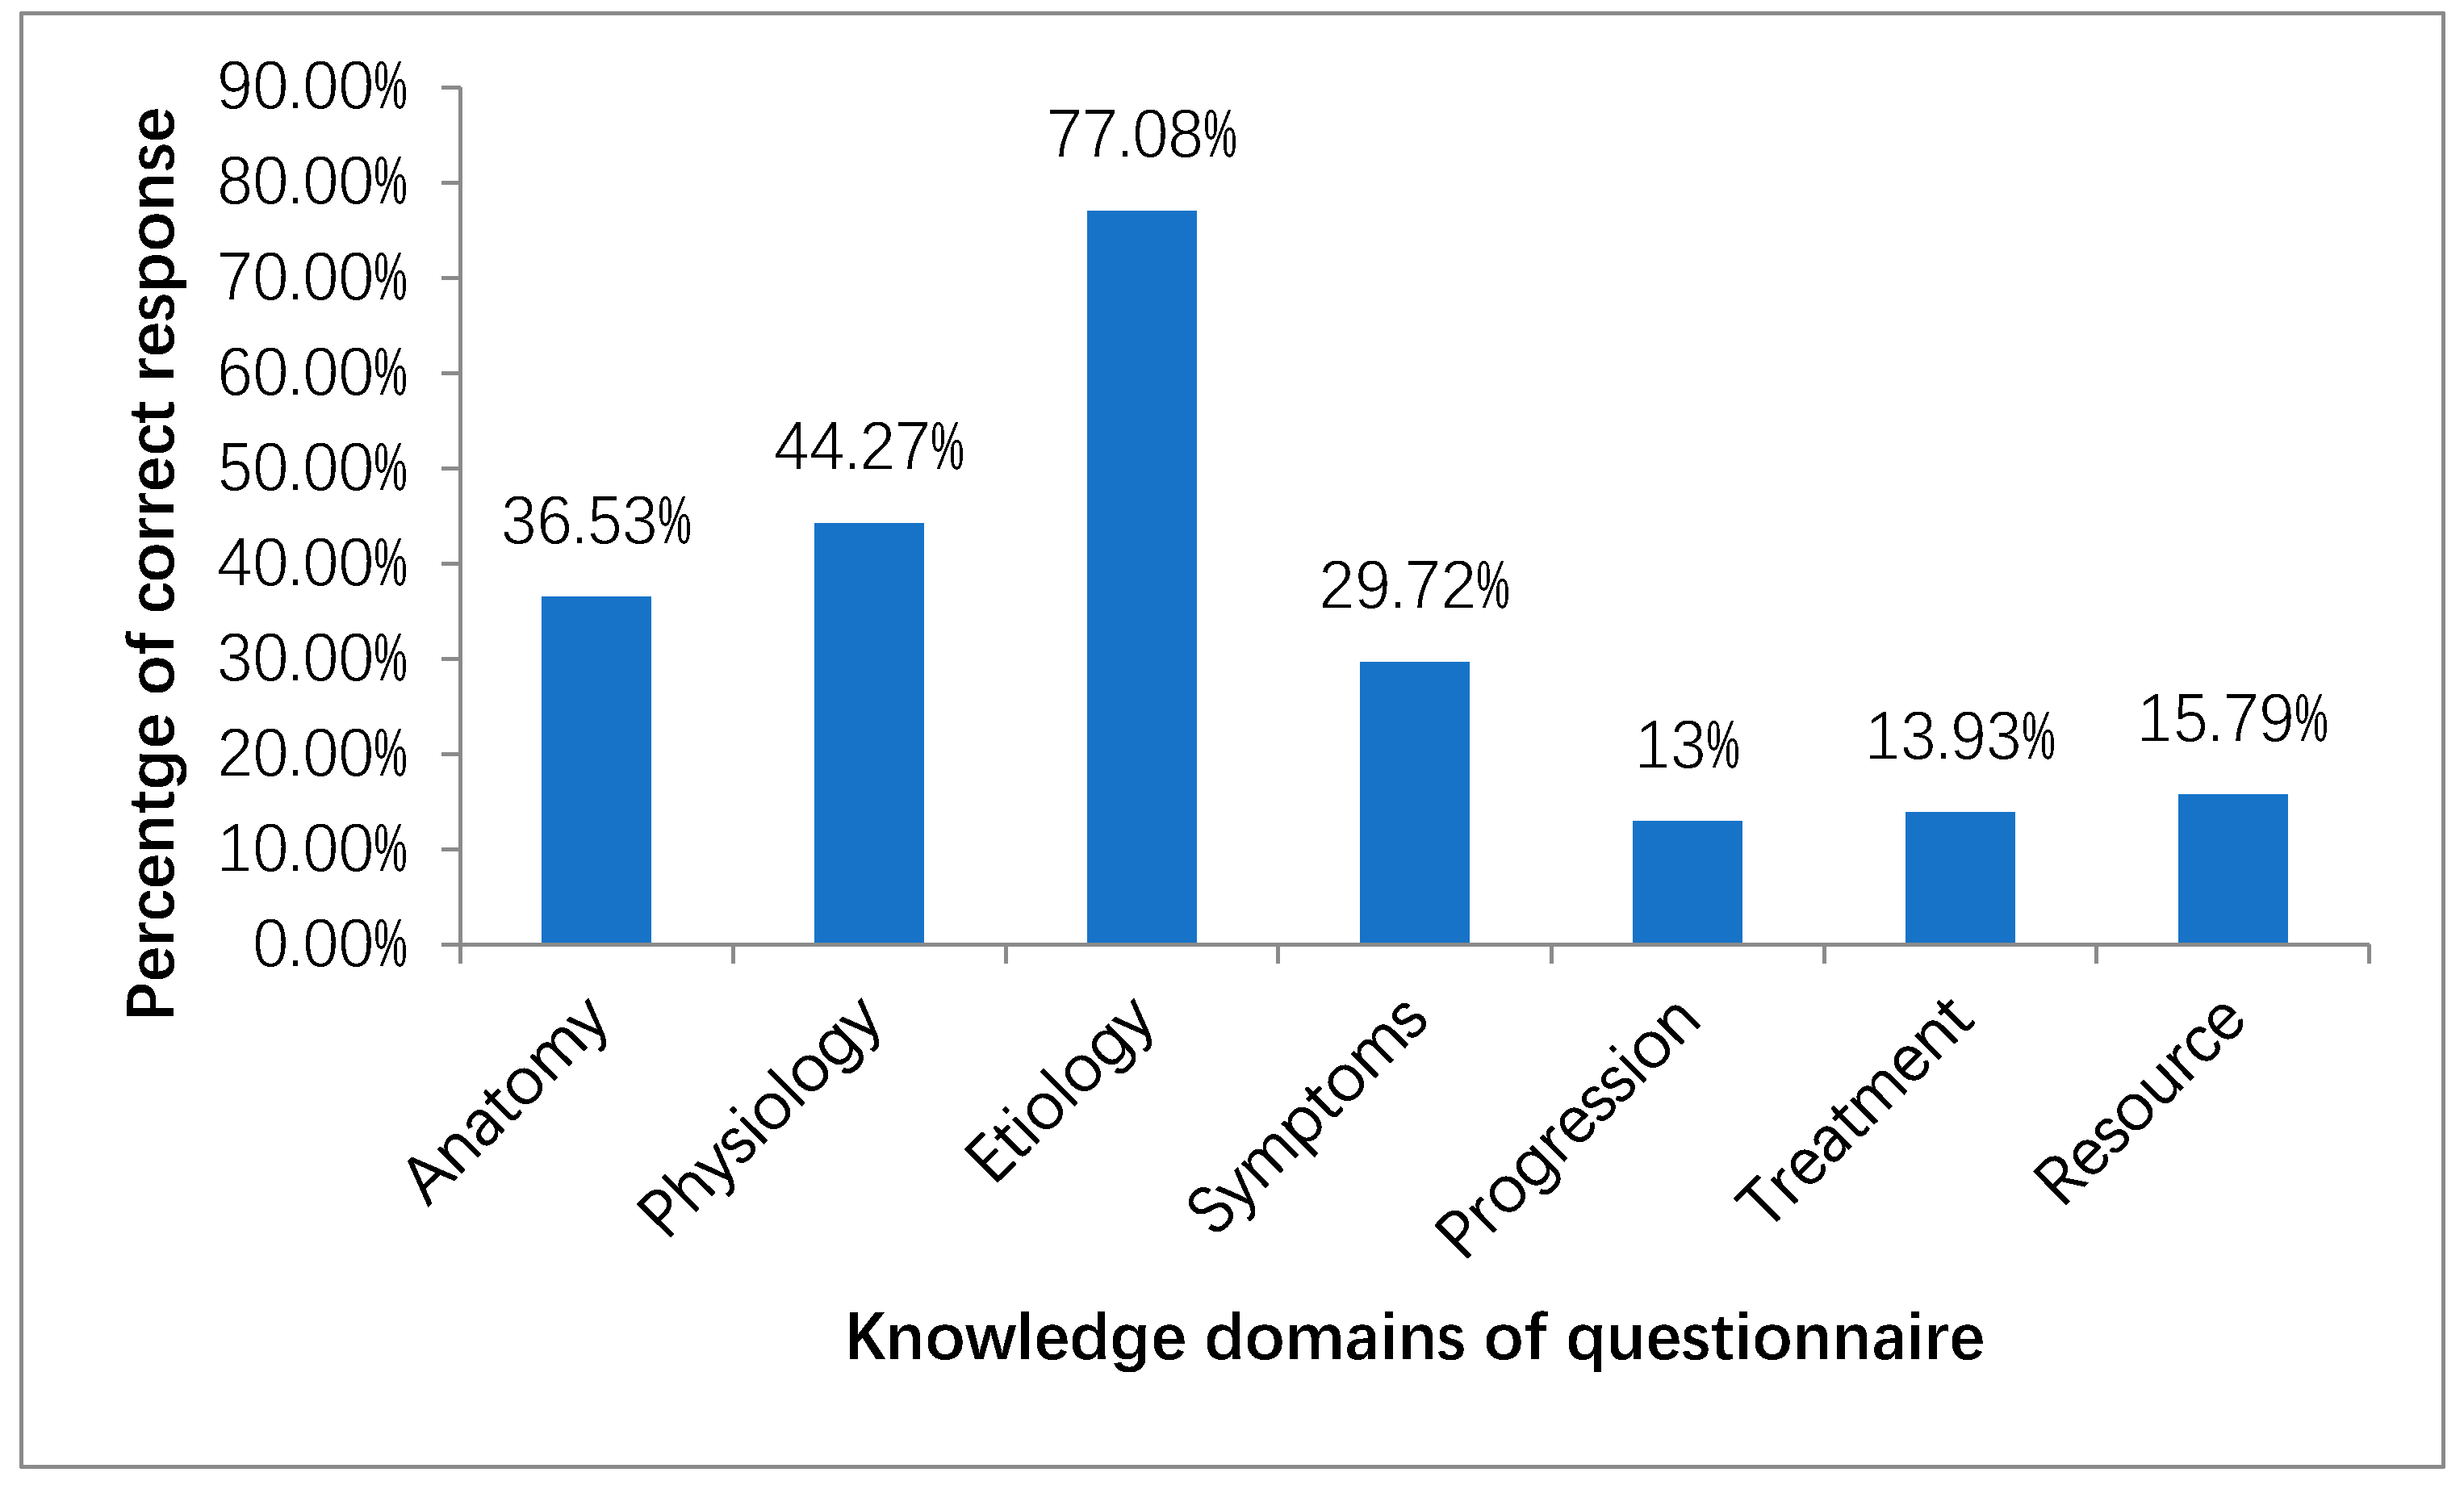
3.1. Patient’s Knowledge of CKD
3.2. Factors Influencing CKD knowledge
4. Discussion
5. Conclusions
Supplementary Materials
Author Contributions
Funding
Acknowledgments
Conflicts of Interest
References
- Lea, J.P.; Nicholas, S.B. Diabetes mellitus and hypertension: Key risk factors for kidney disease. J. Natl. Med. Assoc. 2002, 94, 7S. [Google Scholar]
- Li, Y.; Xia, P.; Xu, L.; Wang, Y.; Chen, L. A meta-analysis on prehypertension and chronic kidney disease. PLoS ONE 2016, 11, e0156575. [Google Scholar] [CrossRef] [PubMed]
- Levin, A.; Stevens, P.E.; Bilous, R.W.; Coresh, J.; De Francisco, A.L.; De Jong, P.E.; Griffith, K.E.; Hemmelgarn, B.R.; Iseki, K.; Lamb, E.J.; et al. Kidney Disease: Improving Global Outcomes (KDIGO) CKD Work Group. KDIGO 2012 clinical practice guideline for the evaluation and management of chronic kidney disease. Kidney Int. Suppl. 2013, 3, 1–150. [Google Scholar]
- Zhang, L.; Wang, F.; Wang, L.; Wang, W.; Liu, B.; Liu, J.; Chen, M.; He, Q.; Liao, Y.; Yu, X.; et al. Prevalence of chronic kidney disease in China: A cross-sectional survey. Lancet 2012, 379, 815–822. [Google Scholar] [CrossRef]
- Tozawa, M.; Iseki, K.; Iseki, C.; Kinjo, K.; Ikemiya, Y.; Takishita, S. Blood pressure predicts risk of developing end-stage renal disease in men and women. Hypertension 2003, 41, 1341–1345. [Google Scholar] [CrossRef] [PubMed]
- Tuttle, K.R.; Bakris, G.L.; Bilous, R.W.; Chiang, J.L.; De Boer, I.H.; Goldstein-Fuchs, J.; Hirsch, I.B.; Kalantar-Zadeh, K.; Narva, A.S.; Navaneethan, S.D.; et al. Diabetic kidney disease: A report from an ADA Consensus Conference. Am. J. Kidney Dis. 2014, 64, 510–533. [Google Scholar] [CrossRef]
- Rajapurkar, M.M.; John, G.T.; Kirpalani, A.L.; Abraham, G.; Agarwal, S.K.; Almeida, A.F.; Gang, S.; Gupta, A.; Modi, G.; Pahari, D.; et al. What do we know about chronic kidney disease in India: First report of the Indian CKD registry. BMC Nephrol. 2012, 13, 10. [Google Scholar] [CrossRef]
- Collins, A.J.F. United States Renal Data System 2008 Annual Data Report. Am. J. Kidney Dis. 2009, 53, S1–S374. [Google Scholar] [CrossRef]
- Hill, N.R.; Fatoba, S.T.; Oke, J.L.; Hirst, J.A.; O’Callaghan, C.A.; Lasserson, D.S.; Hobbs, F.R. Global Prevalence of Chronic Kidney Disease—A Systematic Review and Meta-Analysis. PLoS ONE 2016, 11, e0158765. [Google Scholar] [CrossRef]
- Prasannakumar, M.; Rajput, R.; Seshadri, K.; Talwalkar, P.; Agarwal, P.; Gokulnath, G.; Kotak, B.; Raza, A.; Vasnawala, H.; Teli, C. An observational, cross-sectional study to assess the prevalence of chronic kidney disease in type 2 diabetes patients in India (START-India). Indian J. Endocrinol. Metab. 2015, 19, 520–523. [Google Scholar]
- Lozano, R.; Naghavi, M.; Foreman, K.; Lim, S.; Shibuya, K.; Aboyans, V.; Abraham, J.; Adair, T.; Aggarwal, R.; Ahn, S.Y.; et al. Global and regional mortality from 235 causes of death for 20 age groups in 1990 and 2010: A systematic analysis for the Global Burden of Disease Study 2010. Lancet 2012, 380, 2095–2128. [Google Scholar] [CrossRef]
- Afkarian, M.; Sachs, M.C.; Kestenbaum, B.; Hirsch, I.B.; Tuttle, K.R.; Himmelfarb, J.; De Boer, I.H. Kidney disease and increased mortality risk in type 2 diabetes. J. Am. Soc. Nephrol. 2013, 24, 302–308. [Google Scholar] [CrossRef] [PubMed]
- Burrows, N.R.; Hora, I.; Geiss, L.S.; Gregg, E.W.; Albright, A. Incidence of End-Stage Renal Disease Attributed to Diabetes Among Persons with Diagnosed Diabetes—United States and Puerto Rico, 2000–2014. MMWR Morb. Mortal. Wkly. Rep. 2017, 66, 1165–1170. [Google Scholar] [CrossRef]
- Foley, R.N.; Collins, A.J. The growing economic burden of diabetic kidney disease. Curr. Diab. Rep. 2009, 9, 460. [Google Scholar] [CrossRef]
- McQueen, R.B.; Farahbakhshian, S.; Bell, K.F.; Nair, K.V.; Saseen, J.J. Economic burden of comorbid chronic kidney disease and diabetes. J. Med. Econ. 2017, 20, 585–591. [Google Scholar] [CrossRef] [PubMed]
- Vupputuri, S.; Kimes, T.M.; Calloway, M.O.; Christian, J.B.; Bruhn, D.; Martin, A.A.; Nichols, G.A. The economic burden of progressive chronic kidney disease among patients with type 2 diabetes. J. Diabetes Complicat. 2014, 28, 10–16. [Google Scholar] [CrossRef] [PubMed]
- Zhou, Z.; Chaudhari, P.; Yang, H.; Fang, A.P.; Zhao, J.; Law, E.H.; Wu, E.Q.; Jiang, R.; Seifeldin, R. Healthcare Resource Use, Costs, and Disease Progression Associated with Diabetic Nephropathy in Adults with Type 2 Diabetes: A Retrospective Observational Study. Diabetes Ther. 2017, 8, 555–571. [Google Scholar] [CrossRef] [Green Version]
- Chronic Kidney Disease. Available online: http://www.worldkidneyday.org/faqs/chronic-kidney-disease/ (accessed on 26 January 2019).
- Chugh, K.; Jha, V.; Chugh, S. (Eds.) Economics of dialysis and renal transplantation in the developing world. Transpl. Proc. 1999, 31, 3275–3277. [Google Scholar] [CrossRef]
- Sakhuja, V.; Sud, K. End-stage renal disease in India and Pakistan: Burden of disease and management issues. Kidney Int. 2003, 63, S115–S118. [Google Scholar] [CrossRef] [Green Version]
- National Kidney Foundation. Available online: https://www.kidney.org/news/newsroom/nr/92 (accessed on 26 January 2019).
- Sarnak, M.J.; Levey, A.S.; Schoolwerth, A.C.; Coresh, J.; Culleton, B.; Hamm, L.L.; McCullough, P.A.; Kasiske, B.L.; Kelepouris, E.; Klag, M.J.; et al. Kidney disease as a risk factor for development of cardiovascular disease: A statement from the American Heart Association Councils on Kidney in Cardiovascular Disease, High Blood Pressure Research, Clinical Cardiology, and Epidemiology and Prevention. Hypertension 2003, 42, 1050–1065. [Google Scholar] [CrossRef] [PubMed]
- Van Dipten, C.; de Grauw, W.J.; Wetzels, J.F.; Assendelft, W.J.; Scherpbier-de Haan, N.D.; Dees, M.K. What patients with mild-to-moderate kidney disease know, think, and feel about their disease: An in-depth interview study. J. Am. Board Fam. Med. 2018, 31, 570–577. [Google Scholar] [CrossRef] [PubMed]
- Chow, W.L.; Joshi, V.D.; Tin, A.S.; van der Erf, S.; Lim, J.F.Y.; Swah, T.S.; Teo, S.S.; Goh, P.S.; Tan, G.C.; Lim, C.; et al. Limited knowledge of chronic kidney disease among primary care patients–a cross-sectional survey. BMC Nephrol. 2012, 13, 54. [Google Scholar] [CrossRef]
- Gheewala, P.A.; Peterson, G.M.; Zaidi, S.T.R.; Jose, M.D.; Castelino, R.L. Public knowledge of chronic kidney disease evaluated using a validated questionnaire: A cross-sectional study. BMC Public Health 2018, 18, 371. [Google Scholar] [CrossRef]
- Ene-Iordache, B.; Perico, N.; Bikbov, B.; Carminati, S.; Remuzzi, A.; Perna, A.; Islam, N.; Bravo, R.F.; Aleckovic-Halilovic, M.; Zou, H.; et al. Chronic kidney disease and cardiovascular risk in six regions of the world (ISN-KDDC): A cross-sectional study. Lancet Glob. Health 2016, 4, e307–e319. [Google Scholar] [CrossRef]
- Whaley-Connell, A.; Sowers, J.R.; McCullough, P.A.; Roberts, T.; McFarlane, S.I.; Chen, S.-C.; Li, S.; Wang, C.; Collins, A.J.; Bakris, G.L.; et al. Diabetes mellitus and CKD awareness: The kidney early evaluation program (KEEP) and national health and nutrition examination survey (NHANES). Am. J. Kidney Dis. 2009, 53, S11–S21. [Google Scholar] [CrossRef]
- India Statistics Summary. Available online: http://apps.who.int/gho/data/node.country.country-IND. (accessed on 6 January 2019).
- World Medical Association. Declaration of Helsinki: Ethical principles for medical research involving human subjects. JAMA 2013, 310, 2191–2194. [Google Scholar] [CrossRef]
- Von Elm, E.; Altman, D.G.; Egger, M.; Pocock, S.J.; Gøtzsche, P.C.; Vandenbroucke, J.P. The Strengthening the Reporting of Observational Studies in Epidemiology (STROBE) Statement: Guidelines for reporting observational studies. Int. J. Surg. 2014, 12, 1495–1499. [Google Scholar] [CrossRef] [Green Version]
- Bell, K.; Twiggs, J.; Olin, B.R.; Date, I.R. Hypertension: The Silent Killer: Updated JNC-8 Guideline Recommendations; Alabama Pharmacy Association: Montgomery, AL, USA, 2015; pp. 1–8. [Google Scholar]
- American Diabetes Association. Report of the expert committee on the diagnosis and classification of diabetes mellitus. Diabetes Care 2003, 26, s5–s20. [Google Scholar] [CrossRef]
- Levey, A.S.; Stevens, L.A.; Schmid, C.H.; Zhang, Y.L.; Castro, A.F.; Feldman, H.I.; Kusek, J.W.; Eggers, P.; Van Lente, F.; Greene, T.; et al. A new equation to estimate glomerular filtration rate. Ann. Int. Med. 2009, 150, 604–612. [Google Scholar] [CrossRef]
- Levey, A.S.; Coresh, J.; Bolton, K.; Culleton, B.; Harvey, K.S.; Ikizler, T.A.; Johnson, C.A.; Kausz, A.; Kimmel, P.L.; Kusek, J.; et al. K/DOQI clinical practice guidelines for chronic kidney disease: Evaluation, classification, and stratification. Am. J. Kidney Dis. 2002, 39, S1–S266. [Google Scholar]
- Chow, K.; Szeto, C.; Kwan, B.; Leung, C.; Li, P. Public lacks knowledge on chronic kidney disease: Telephone survey. Hong Kong Medj. 2014, 20, 139–144. [Google Scholar] [CrossRef] [PubMed]
- Ng, C.Y.; Lee, Z.S.; Goh, K.S. Cross-sectional study on knowledge of chronic kidney disease among medical outpatient clinic patients. Med. J. Malays. 2016, 71, 99–104. [Google Scholar]
- Fezeu, L.; Fointama, E.; Ngufor, G.; Mbeh, G.; Mbanya, J.-C. Diabetes awareness in general population in Cameroon. Diabetes Res. Clin. Pract. 2010, 90, 312–318. [Google Scholar] [CrossRef]
- Lemos, C.F.; Rodrigues, M.P.; Veiga, J.R.P. Family income is associated with quality of life in patients with chronic kidney disease in the pre-dialysis phase: A cross sectional study. Health Qual. Life Outcomes 2015, 13, 202. [Google Scholar] [CrossRef] [PubMed]
- Rabi, D.M.; Edwards, A.L.; Southern, D.A.; Svenson, L.W.; Sargious, P.M.; Norton, P.; Larsen, E.T.; Ghali, W.A. Association of socio-economic status with diabetes prevalence and utilization of diabetes care services. BMC Health Serv. Res. 2006, 6, 124. [Google Scholar] [CrossRef] [PubMed]
- Finkelstein, F.O.; Story, K.; Firanek, C.; Barre, P.; Takano, T.; Soroka, S.; Mujais, S.; Rodd, K.; Mendelssohn, D. Perceived knowledge among patients cared for by nephrologists about chronic kidney disease and end-stage renal disease therapies. Kidney Int. 2008, 74, 1178–1184. [Google Scholar] [CrossRef] [PubMed] [Green Version]


| Variables | Male | Female | Total | p Value |
|---|---|---|---|---|
| Age groups | >0.999 | |||
| ≥50 | 93 (59.6%) | 99 (59.3%) | 192 (59.4%) | |
| <50 | 63 (40.4%) | 68 (40.7%) | 131 (40.6%) | |
| Marital Status | >0.999 | |||
| Married | 150 (96.2%) | 161 (96.4%) | 311 (96.3%) | |
| Unmarried | 6 (3.85%) | 6 (3.59%) | 12 (3.72%) | |
| Family History of Diabetes | 0.8223 | |||
| Yes | 69 (44.2%) | 71 (42.5%) | 140 (43.3%) | |
| No | 87 (55.8%) | 96 (57.5%) | 183 (56.7%) | |
| Substance Use | 0.0459 | |||
| Yes | 43 (27.6%) | 30 (18.0%) | 73 (22.6%) | |
| No | 113 (72.4%) | 137 (82.0%) | 250 (77.4%) | |
| Education | 0.0077 | |||
| Literate | 111 (71.2%) | 94 (56.3%) | 205 (63.5%) | |
| Illiterate | 45 (28.8%) | 73 (43.7%) | 118 (36.5%) | |
| Occupation | 0.0308 | |||
| Employed | 98 (62.8%) | 124 (74.3%) | 222 (68.7%) | |
| Unemployed | 58 (37.2%) | 43 (25.7%) | 101 (31.3%) | |
| Socioeconomic Status | 0.0324 | |||
| Middle | 43 (27.6%) | 29 (17.4%) | 72 (22.3%) | |
| Lower | 113 (72.4%) | 138 (82.6%) | 251 (77.7%) | |
| CKD Stage | 0.3724 | |||
| Stage III | 48 (30.8%) | 63 (37.7%) | 111 (34.4%) | |
| Stage II | 65 (41.7%) | 66 (39.5%) | 131 (40.6%) | |
| Stage I | 43 (27.6%) | 38 (22.8%) | 81 (25.1%) | |
| HTN Stage | 0.6244 | |||
| Stage I HTN | 40 (25.6%) | 36 (21.6%) | 76 (23.5%) | |
| Stage II HTN | 23 (14.7%) | 33 (19.8%) | 56 (17.3%) | |
| Prehypertension | 43 (27.6%) | 46 (27.5%) | 89 (27.6%) | |
| Normal | 50 (32.1%) | 52 (31.1%) | 102 (31.6%) | |
| BMI Categories | 0.6529 | |||
| Overweight | 61 (39.1%) | 59 (35.3%) | 120 (37.2%) | |
| Obese | 32 (20.5%) | 41 (24.6%) | 73 (22.6%) | |
| Normal | 63 (40.4%) | 67 (40.1%) | 130 (40.2%) | |
| Co-morbidities | 0.6431 | |||
| Yes | 53 (34.0%) | 61 (36.5%) | 114 (35.3%) | |
| No | 103 (66.0%) | 106 (63.5%) | 209 (64.7%) | |
| Duration of diabetes | 0.3743 | |||
| Less than 10 years | 79 (50.6%) | 89 (53.3%) | 168 (52.0%) | |
| More than 10 years | 77 (49.4%) | 78 (46.7%) | 155 (48.0%) | |
| Duration of HTN | ||||
| Less than 5 years | 44 (63.76%) | 37 (58.73%) | 81 (61.36%) | 0.5942 |
| More than 5 years | 25 (36.23%) | 26 (41.26%) | 51 (38.63%) |
| Variables | Less than 4 Correct Answers | At least 4 Correct Answers | Total | p Value |
|---|---|---|---|---|
| Age Groups | 0.5832 | |||
| ≥50 | 153 (60.2%) | 39 (56.5%) | 192 (59.4%) | |
| <50 | 101 (39.8%) | 30 (43.5%) | 131 (40.6%) | |
| Gender | 0.2231 | |||
| Female | 136 (53.5%) | 31 (44.9%) | 167 (51.7%) | |
| Male | 118 (46.5%) | 38 (55.1%) | 156 (48.3%) | |
| Family History of Diabetes | 0.1018 | |||
| Yes | 104 (40.9%) | 36 (52.2%) | 140 (43.3%) | |
| No | 150 (59.1%) | 33 (47.8%) | 183 (56.7%) | |
| Substance Use | 0.8724 | |||
| Yes | 57 (22.4%) | 16 (23.2%) | 73 (22.6%) | |
| No | 197 (77.6%) | 53 (76.8%) | 250 (77.4%) | |
| Education | 0.004 | |||
| Literate | 151 (59.44%) | 54 (78.26%) | 205 (63.5%) | |
| Illiterate | 103 (40.56%) | 15 (21.74%) | 118 (36.5%) | |
| Occupation | 0.0783 | |||
| Employed | 181 (71.3%) | 41 (59.4%) | 222 (68.7%) | |
| Unemployed | 73 (28.7%) | 28 (40.6%) | 101 (31.3%) | |
| Socioeconomic Status | 0.0003 | |||
| Middle | 45 (17.7%) | 27 (39.1%) | 72 (22.3%) | |
| Lower | 209 (82.3%) | 42 (60.9%) | 251 (77.7%) | |
| Monthly Family Income | 0.0034 | |||
| More than 20,000 INR | 34 (13.4%) | 20 (29.0%) | 54 (16.7%) | |
| Less than 20,000 INR | 220 (86.6%) | 49 (71.0%) | 269 (83.3%) | |
| CKD Stages | 0.5453 | |||
| Stage III | 89 (35.0%) | 22 (31.9%) | 111 (34.4%) | |
| Stage II | 99 (39.0%) | 32 (46.4%) | 131 (40.6%) | |
| Stage I | 66 (26.0%) | 15 (21.7%) | 81 (25.1%) | |
| HTN Stages | 0.4704 | |||
| Stage I HTN | 63 (24.8%) | 13 (18.8%) | 76 (23.5%) | |
| Stage II HTN | 40 (15.7%) | 16 (23.2%) | 56 (17.3%) | |
| Prehypertension | 70 (27.6%) | 19 (27.5%) | 89 (27.6%) | |
| Normal | 81 (31.9%) | 21 (30.4%) | 102 (31.6%) | |
| Glycemic Control | 0.1321 | |||
| Poor (HbA1c ≥ 7) | 187 (73.6%) | 44 (63.8%) | 231 (71.5%) | |
| Good (HbA1c < 7) | 67 (26.4%) | 25 (36.2%) | 92 (28.5%) | |
| BMI Categories | 0.5314 | |||
| Overweight | 97 (38.2%) | 23 (33.3%) | 120 (37.2%) | |
| Obese | 59 (23.2%) | 14 (20.3%) | 73 (22.6%) | |
| Normal | 98 (38.6%) | 32 (46.4%) | 130 (40.2%) | |
| Co-morbidities | 0.4791 | |||
| Yes | 87 (34.3%) | 27 (39.1%) | 114 (35.3%) | |
| No | 167 (65.7%) | 42 (60.9%) | 209 (64.7%) | |
| Duration of Diabetes | 0.3418 | |||
| Less than 10 years | 136 (53.5%) | 32 (46.4%) | 168 (52.0%) | |
| More than 10 years | 118 (46.5%) | 37 (53.6%) | 155 (48.0%) | |
| Duration of HTN | ||||
| Less than 5 years | 66 (62.85%) | 15 (55.55%) | 81 (61.36%) | 0.5123 |
| More than 5 years | 39 (37.15%) | 12 (44.45%) | 51 (38.63%) |
| Variables | C_Q1 (Anatomy) | IC_Q1 (Anatomy) | Odds Ratio | C_Q2 (Physiology) | IC_Q2 (Physiology) | Odds Ratio | C_Q3 (Etiology) | IC_Q3 (Etiology) | Odds Ratio |
|---|---|---|---|---|---|---|---|---|---|
| Age Groups | |||||||||
| ≥50 | 66 (20.4%) | 126 (39.0%) | 0.796 (0.503, 1.260) | 80 (24.8%) | 112 (34.7%) | 0.771 (0.493, 1.205) | 154 (47.7%) | 38 (11.8%) | 1.536 (0.911, 2.590) |
| <50 | 52 (16.1%) | 79 (24.5%) | Reference | 63 (19.5%) | 68 (21.1%) | Reference | 95 (29.4%) | 36 (11.1%) | Reference |
| Gender | |||||||||
| Female | 60 (18.5%) | 107 (33.1%) | 0.947 (0.602, 1.491) | 70 (21.7%) | 97 (30.0%) | 0.821 (0.529, 1.274) | 126 (39.0%) | 41 (12.7%) | 0.825 (0.490, 1.389) |
| Male | 58 (18.0%) | 98 (30.3%) | Reference | 73 (22.6%) | 83 (25.7%) | Reference | 123 (38.1%) | 33 (10.2%) | Reference |
| Family History of Diabetes | |||||||||
| Yes | 56 (17.3%) | 84 (26.0%) | 1.301 (0.825, 2.053) | 72 (22.3%) | 68 (21.1%) | 1.670 (1.070, 2.607) | 115 (35.6%) | 25 (7.74%) | 1.682 (0.978, 2.893) |
| No | 62 (19.2%) | 121 (37.5%) | Reference | 71 (22.0%) | 112 (34.7%) | Reference | 134 (41.5%) | 49 (15.2%) | Reference |
| Substance Use | |||||||||
| Yes | 30 (9.29%) | 43 (13.3%) | 1.284 (0.753, 2.190) | 34 (10.5%) | 39 (12.1%) | 1.128 (0.668, 1.903) | 61 (18.9%) | 12 (3.72%) | 1.676 (0.847, 3.317) |
| No | 88 (27.2%) | 162 (50.2%) | Reference | 109 (33.7%) | 141 (43.7%) | Reference | 188 (58.2%) | 62 (19.2%) | Reference |
| Education | |||||||||
| Literate | 74 (22.9%) | 131 (40.6%) | 0.950 (0.594, 1.519) | 87 (26.9%) | 118 (36.5%) | 0.816 (0.518, 1.287) | 162 (50.2%) | 43 (13.3%) | 1.342 (0.790, 2.281) |
| Illiterate | 44 (13.6%) | 74 (22.9%) | Reference | 56 (17.3%) | 62 (19.2%) | Reference | 87 (26.9%) | 31 (9.60%) | Reference |
| Occupation | |||||||||
| Employed | 76 (23.5%) | 146 (45.2%) | 0.731 (0.451, 1.185) | 92 (28.5%) | 130 (40.2%) | 0.694 (0.432, 1.113) | 170 (52.6%) | 52 (16.1%) | 0.910 (0.517, 1.603) |
| Unemployed | 42 (13.0%) | 59 (18.3%) | Reference | 51 (15.8%) | 50 (15.5%) | Reference | 79 (24.5%) | 22 (6.81%) | Reference |
| Socioeconomic Status | |||||||||
| Middle | 34 (10.5%) | 38 (11.8%) | 1.779 (1.045, 3.028) * | 45 (13.9%) | 27 (8.36%) | 2.602 (1.516, 4.467) ** | 63 (19.5%) | 9 (2.79%) | 2.446 (1.152, 5.196) * |
| Lower | 84 (26.0%) | 167 (51.7%) | Reference | 98 (30.3%) | 153 (47.4%) | Reference | 186 (57.6%) | 65 (20.1%) | Reference |
| Family Income | |||||||||
| More than 20,000 INR (monthly) | 27 (8.36%) | 27 (8.36%) | 1.956 (1.084, 3.529) * | 32 (9.91%) | 22 (6.81%) | 2.070 (1.142, 3.752) * | 47 (14.6%) | 7 (2.17%) | 2.227 (0.961, 5.162) * |
| Less than 20,000 INR (monthly) | 91 (28.2%) | 178 (55.1%) | Reference | 111 (34.4%) | 158 (48.9%) | Reference | 202 (62.5%) | 67 (20.7%) | Reference |
| CKD Stage | |||||||||
| Stage III | 36 (11.1%) | 75 (23.2%) | 0.861 (0.471, 1.574) | 46 (14.2%) | 65 (20.1%) | 1.269 (0.703, 2.291) | 86 (26.6%) | 25 (7.74%) | 1.536 (0.803, 2.937) |
| Stage II | 53 (16.4%) | 78 (24.1%) | 1.218 (0.687, 2.160) | 68 (21.1%) | 63 (19.5%) | 1.935 (1.096, 3.419) * | 107 (33.1%) | 24 (7.43%) | 1.990 (1.042, 3.800) |
| Stage I | 29 (8.98%) | 52 (16.1%) | Reference | 29 (8.98%) | 52 (16.1%) | Reference | 56 (17.3%) | 25 (7.74%) | Reference |
| HTN Stage | |||||||||
| Stage I HTN | 24 (7.43%) | 52 (16.1%) | 0.659 (0.353, 1.231) | 31 (9.60%) | 45 (13.9%) | 0.908 (0.497, 1.659) | 46 (14.2%) | 30 (9.29%) | 0.307 (0.153, 0.614) ** |
| Stage II HTN | 23 (7.12%) | 33 (10.2%) | 0.996 (0.513, 1.931) | 34 (10.5%) | 22 (6.81%) | 2.037 (1.049, 3.958) ** | 44 (13.6%) | 12 (3.72%) | 0.733 (0.322, 1.671) |
| Prehypertension | 29 (8.98%) | 60 (18.6%) | 0.690 (0.381, 1.250) | 34 (10.5%) | 55 (17.0%) | 0.815 (0.456, 1.455) | 74 (22.9%) | 15 (4.64%) | 0.987 (0.461, 2.112) |
| Normal | 42 (13.0%) | 60 (18.6%) | Reference | 44 (13.6%) | 58 (18.0%) | Reference | 85 (26.3%) | 17 (5.26%) | Reference |
| BMI Categories | |||||||||
| Overweight | 39 (12.1%) | 81 (25.1%) | 0.770 (0.458, 1.296) | 54 (16.7%) | 66 (20.4%) | 1.152 (0.698, 1.900) | 98 (30.3%) | 22 (6.81%) | 1.840 (1.013, 3.343) |
| Obese | 29 (8.98%) | 44 (13.6%) | 1.055 (0.586, 1.897) | 35 (10.8%) | 38 (11.8%) | 1.296 (0.728, 2.308) | 59 (18.3%) | 14 (4.33%) | 1.741 (0.869, 3.486) |
| Normal | 50 (15.5%) | 80 (24.8%) | Reference | 54 (16.7%) | 76 (23.5%) | Reference | 92 (28.5%) | 38 (11.8%) | Reference |
| Co-morbidities | |||||||||
| Yes | 43 (13.3%) | 71 (22.0%) | 1.082 (0.675, 1.736) | 51 (15.8%) | 63 (19.5%) | 1.030 (0.650, 1.630) | 87 (26.9%) | 27 (8.36%) | 0.935 (0.545, 1.605) |
| No | 75 (23.2%) | 134 (41.5%) | Reference | 92 (28.5%) | 117 (36.2%) | Reference | 162 (50.2%) | 47 (14.6%) | Reference |
| Duration of Diabetes | |||||||||
| More than 10 years | 56 (17.3%) | 99 (30.7%) | 0.967 (0.615, 1.522) | 68 (21.1%) | 87 (26.9%) | 0.969 (0.625, 1.504) | 117 (36.2%) | 38 (11.8%) | 0.840 (0.500, 1.412) |
| Less than 10 years | 62 (19.2%) | 106 (32.8%) | Reference | 75 (23.2%) | 93 (28.8%) | Reference | 132 (40.9%) | 36 (11.1%) | Reference |
| Glycemic Control | |||||||||
| Poor (HbA1c ≥ 7) | 76 (23.5%) | 155 (48.0%) | 1.713 (1.046, 2.806) * | 95 (29.4%) | 136 (42.1%) | 1.562 (0.961, 2.539) | 174 (53.9%) | 57 (17.6%) | 1.445 (0.789, 2.648) |
| Good (HbA1c < 7) | 42 (13.0%) | 50 (15.5%) | Reference | 48 (14.9%) | 44 (13.6%) | Reference | 75 (23.2%) | 17 (5.26%) | Reference |
| Duration of HTN # | |||||||||
| More than 5 years | 22 (16.66%) | 29 (21.97%) | 1.16 (0.57, 2.36) | 28 (21.21%) | 23 (17.42%) | 1.13 (0.55, 2.28) | 39 (29.54%) | 12 (9.09%) | 1.28 (0.57, 2.88) |
| Less than 5 years | 32 (24.24%) | 49 (37.12%) | Reference | 42 (31.81%) | 39 (29.54%) | Reference | 58 (43.94%) | 23 (17.42%) | Reference |
| Variables | C_Q4 (Symptoms) | IC_Q4 (Symptoms) | Odds Ratio | C_Q5 (Progression) | IC_Q5 (Progression) | Odds Ratio | C_Q6 (Treatment) | IC_Q6 (Treatment) | Odds Ratio | C_Q7 (Resource) | IC_Q7 (Resource) | Odds Ratio |
|---|---|---|---|---|---|---|---|---|---|---|---|---|
| Age Groups | ||||||||||||
| ≥50 | 54 (16.7%) | 138 (42.7%) | 0.829 (0.511, 1.344) | 23 (7.12%) | 169 (52.3%) | 0.802 (0.418, 1.541) | 23 (7.12%) | 169 (52.3%) | 0.674 (0.358, 1.269) | 26 (8.05%) | 166 (51.4%) | 0.664 (0.364, 1.211) |
| <50 | 42 (13.0%) | 89 (27.6%) | Reference | 19 (5.88%) | 112 (34.7%) | Reference | 22 (6.81%) | 109 (33.7%) | Reference | 25 (7.74%) | 106 (32.8%) | Reference |
| Gender | ||||||||||||
| Female | 46 (14.2%) | 121 (37.5%) | 0.806 (0.500, 1.300) | 26 (8.05%) | 141 (43.7%) | 1.613 (0.829, 3.137) | 20 (6.19%) | 147 (45.5%) | 0.713 (0.378, 1.343) | 25 (7.74%) | 142 (44.0%) | 0.880 (0.484, 1.601) |
| Male | 50 (15.5%) | 106 (32.8%) | Reference | 16 (4.95%) | 140 (43.3%) | Reference | 25 (7.74%) | 131 (40.6%) | Reference | 26 (8.05%) | 130 (40.2%) | Reference |
| Family History of Diabetes | ||||||||||||
| Yes | 48 (14.9%) | 92 (28.5%) | 1.467 (0.908, 2.371) | 25 (7.74%) | 115 (35.6%) | 2.123 (1.097, 4.109) * | 21 (6.50%) | 119 (36.8%) | 1.169 (0.621, 2.200) | 22 (6.81%) | 118 (36.5%) | 0.990 (0.541, 1.811) |
| No | 48 (14.9%) | 135 (41.8%) | Reference | 17 (5.26%) | 166 (51.4%) | Reference | 24 (7.43%) | 159 (49.2%) | Reference | 29 (8.98%) | 154 (47.7%) | Reference |
| Substance Use | ||||||||||||
| Yes | 22 (6.81%) | 51 (15.8%) | 1.026 (0.581, 1.812) | 13 (4.02%) | 60 (18.6%) | 1.651 (0.809, 3.371) | 6 (1.86%) | 67 (20.7%) | 0.485 (0.197, 1.195) | 10 (3.10%) | 63 (19.5%) | 0.809 (0.384, 1.707) |
| No | 74 (22.9%) | 176 (54.5%) | Reference | 29 (8.98%) | 221 (68.4%) | Reference | 39 (12.1%) | 211 (65.3%) | Reference | 41 (12.7%) | 209 (64.7%) | Reference |
| Education | ||||||||||||
| Literate | 64 (19.8%) | 141 (43.7%) | 1.220 (0.738, 2.015) | 27 (8.36%) | 178 (55.1%) | 1.041 (0.530, 2.048) | 28 (8.67%) | 177 (54.8%) | 0.940 (0.490, 1.801) | 28 (8.67%) | 177 (54.8%) | 0.653 (0.357, 1.197) |
| Illiterate | 32 (9.91%) | 86 (26.6%) | Reference | 15 (4.64%) | 103 (31.9%) | Reference | 17 (5.26%) | 101 (31.3%) | Reference | 23 (7.12%) | 95 (29.4%) | Reference |
| Occupation | ||||||||||||
| Employed | 61 (18.9%) | 161 (49.8%) | 0.714 (0.431, 1.184) | 25 (7.74%) | 197 (61.0%) | 0.627 (0.322, 1.222) | 33 (10.2%) | 189 (58.5%) | 1.295 (0.638, 2.626) | 30 (9.29%) | 192 (59.4%) | 0.595 (0.322, 1.102) |
| Unemployed | 35 (10.8%) | 66 (20.4%) | Reference | 17 (5.26%) | 84 (26.0%) | Reference | 12 (3.72%) | 89 (27.6%) | Reference | 21 (6.50%) | 80 (24.8%) | Reference |
| Socioeconomic Status | ||||||||||||
| Middle | 31 (9.60%) | 41 (12.7%) | 2.164 (1.254, 3.733) ** | 15 (4.64%) | 57 (17.6%) | 2.183 (1.090, 4.374) * | 11 (3.41%) | 61 (18.9%) | 1.151 (0.551, 2.405) | 21 (6.50%) | 51 (15.8%) | 3.033 (1.607, 5.726) ** |
| Lower | 65 (20.1%) | 186 (57.6%) | Reference | 27 (8.36%) | 224 (69.3%) | Reference | 34 (10.5%) | 217 (67.2%) | Reference | 30 (9.29%) | 221 (68.4%) | Reference |
| Family Income | ||||||||||||
| More than 20,000 INR (monthly) | 23 (7.12%) | 31 (9.60%) | 1.992 (1.091, 3.640) * | 13 (4.02%) | 41 (12.7%) | 2.624 (1.260, 5.463) ** | 10 (3.10%) | 44 (13.6%) | 1.519( 0.701, 3.292) | 15 (4.64%) | 39 (12.1%) | 2.489 (1.247, 4.969) ** |
| Less than 20,000 INR (monthly) | 73 (22.6%) | 196 (60.7%) | Reference | 29 (8.98%) | 240 (74.3%) | Reference | 35 (10.8%) | 234 (72.4%) | Reference | 36 (11.1%) | 233 (72.1%) | Reference |
| CKD Stage | ||||||||||||
| Stage III | 27 (8.36%) | 84 (26.0%) | 0.811 (0.424, 1.551) | 8 (2.48%) | 103 (31.9%) | 0.292 (0.119, 0.717) * | 16 (4.95%) | 95 (29.4%) | 1.537 (0.624, 3.787) | 16 (4.95%) | 95 (29.4%) | 0.968 (0.431, 2.177) |
| Stage II | 46 (14.2%) | 85 (26.3%) | 1.365 (0.748, 2.491) | 17 (5.26%) | 114 (35.3%) | 0.561 (0.268, 1.175) | 21 (6.50%) | 110 (34.1%) | 1.742 (0.732, 4.143) | 23 (7.12%) | 108 (33.4%) | 1.225 (0.572, 2.620) |
| Stage I | 23 (7.12%) | 58 (18.0%) | Reference | 17 (5.26%) | 64 (19.8%) | Reference | 8 (2.48%) | 73 (22.6%) | Reference | 12 (3.72%) | 69 (21.4%) | Reference |
| HTN Stage | ||||||||||||
| Stage I HTN | 19 (5.88%) | 57 (17.6%) | 0.926 (0.469, 1.829) | 11 (3.41%) | 65 (20.1%) | 1.400 (0.572, 3.424) | 11 (3.41%) | 65 (20.1%) | 1.159 (0.488, 2.750) | 11 (3.41%) | 65 (20.1%) | 1.064 (0.454, 2.494) |
| Stage II HTN | 20 (6.19%) | 36 (11.1%) | 1.543 (0.765, 3.113) | 10 (3.10%) | 46 (14.2%) | 1.798 (0.712, 4.544) | 10 (3.10%) | 46 (14.2%) | 1.489 (0.607, 3.654) | 11 (3.41%) | 45 (13.9%) | 1.537 (0.645, 3.659) |
| Prehypertension | 30 (9.29%) | 59 (18.3%) | 1.412 (0.758, 2.630) | 10 (3.10%) | 79 (24.5%) | 1.047 (0.422, 2.596) | 11 (3.41%) | 78 (24.1%) | 0.965 (0.409, 2.278) | 15 (4.64%) | 74 (22.9%) | 1.274 (0.578, 2.811) |
| Normal | 27 (8.36%) | 75 (23.2%) | Reference | 11 (3.41%) | 91 (28.2%) | Reference | 13 (4.02%) | 89 (27.6%) | Reference | 14 (4.33%) | 88 (27.2%) | Reference |
| BMI Categories | ||||||||||||
| Overweight | 29 (8.98%) | 91 (28.2%) | 0.623 (0.358, 1.084) | 16 (4.95%) | 104 (32.2%) | 0.755( 0.376, 1.518) | 18 (5.57%) | 102 (31.6%) | 1.031 (0.513, 2.073) | 12 (3.72%) | 108 (33.4%) | 0.424 (0.204, 0.881) |
| Obese | 23 (7.12%) | 50 (15.5%) | 0.899 (0.487, 1.660) | 4 (1.24%) | 69 (21.4%) | 0.285 (0.094, 0.861) * | 8 (2.48%) | 65 (20.1%) | 0.719 (0.298, 1.735) | 12 (3.72%) | 61 (18.9%) | 0.750 (0.354, 1.589) |
| Normal | 44 (13.6%) | 86 (26.6%) | Reference | 22 (6.81%) | 108 (33.4%) | Reference | 19 (5.88%) | 111 (34.4%) | Reference | 27 (8.36%) | 103 (31.9%) | Reference |
| Co-morbidities | ||||||||||||
| Yes | 35 (10.8%) | 79 (24.5%) | 1.075 (0.654, 1.767) | 18 (5.57%) | 96 (29.7%) | 1.445 (0.748, 2.794) | 15 (4.64%) | 99 (30.7%) | 0.904 (0.464, 1.761) | 21 (6.50%) | 93 (28.8%) | 1.347 (0.731, 2.483) |
| No | 61 (18.9%) | 148 (45.8%) | Reference | 24 (7.43%) | 185 (57.3%) | Reference | 30 (9.29%) | 179 (55.4%) | Reference | 30 (9.29%) | 179 (55.4%) | Reference |
| Duration of Diabetes | ||||||||||||
| More than 10 years | 51 (15.8%) | 104 (32.2%) | 1.340 (0.831, 2.163) | 21 (6.50%) | 134 (41.5%) | 1.097 (0.574, 2.098) | 22 (6.81%) | 133 (41.2%) | 1.043 (0.555, 1.958) | 26 (8.05%) | 129 (39.9%) | 1.153 (0.634, 2.097) |
| Less than 10 years | 45 (13.9%) | 123 (38.1%) | Reference | 21 (6.50%) | 147 (45.5%) | Reference | 23 (7.12%) | 145 (44.9%) | Reference | 25 (7.74%) | 143 (44.3%) | Reference |
| Glycemic Control | ||||||||||||
| Poor (HbA1c ≥ 7) | 69 (21.4%) | 162 (50.2%) | 0.975 (0.574, 1.657) | 32 (9.91%) | 199 (61.6%) | 0.758 (0.356, 1.614) | 34 (10.5%) | 197 (61.0%) | 0.787 (0.380, 1.629) | 39 (12.1%) | 192 (59.4%) | 0.739 (0.368, 1.484) |
| Good (HbA1c < 7) | 27 (8.36%) | 65 (20.1%) | Reference | 10 (3.10%) | 82 (25.4%) | Reference | 11 (3.41%) | 81 (25.1%) | Reference | 12 (3.72%) | 80 (24.8%) | Reference |
| Duration of HTN # | ||||||||||||
| More than 5 years | 14 (10.60%) | 37 (27.81%) | 0.75 (0.35, 1.63) | 12 (9.09%) | 40 (30.30%) | 0.857 (0.379, 1.935) | 8 (6.06%) | 43 (32.57%) | 0.890 (0.344, 2.300) | 4 (3.03%) | 47 (65.60%) | 0.899 (0.249, 3.241) |
| Less than 5 years | 27 (20.45%) | 54 (40.90%) | Reference | 21 (15.90%) | 60 (45.45%) | Reference | 14 (10.60%) | 67 (50.75%) | Reference | 7 (5.30%) | 74 (56.06%) | Reference |
© 2019 by the authors. Licensee MDPI, Basel, Switzerland. This article is an open access article distributed under the terms and conditions of the Creative Commons Attribution (CC BY) license (http://creativecommons.org/licenses/by/4.0/).
Share and Cite
Hussain, S.; Habib, A.; Najmi, A.K. Limited Knowledge of Chronic Kidney Disease among Type 2 Diabetes Mellitus Patients in India. Int. J. Environ. Res. Public Health 2019, 16, 1443. https://doi.org/10.3390/ijerph16081443
Hussain S, Habib A, Najmi AK. Limited Knowledge of Chronic Kidney Disease among Type 2 Diabetes Mellitus Patients in India. International Journal of Environmental Research and Public Health. 2019; 16(8):1443. https://doi.org/10.3390/ijerph16081443
Chicago/Turabian StyleHussain, Salman, Anwar Habib, and Abul Kalam Najmi. 2019. "Limited Knowledge of Chronic Kidney Disease among Type 2 Diabetes Mellitus Patients in India" International Journal of Environmental Research and Public Health 16, no. 8: 1443. https://doi.org/10.3390/ijerph16081443