Analysis of the Relationship between the Levels of Androgens and Biochemical Bone Markers in Men Aged 60–75 Years

 , , and
Abstract
:1. Introduction
2. Material and Methods
2.1. Study and Control Groups
2.2. Clinical Examination
2.3. The Levels of Androgens Calculations
2.4. Criteria for a Diagnosis of Testosterone Deficiency Syndrome
2.5. Bone Mass Measurements
2.6. Statistical Analysis
3. Results
4. Discussion
5. Conclusions
Author Contributions
Funding
Conflicts of Interest
References
- Sinnesaeel, M.; Boonnen, S.; Claessens, F.; Gielen, E.; Vanderschueren, D. Testosterone and the Male Skeleton: A Dual Mode of Action. J. Osteoporos. 2011, 2011, 240328. [Google Scholar] [CrossRef] [Green Version]
- Amin, S.; Zhang, Y.; Felson, D.T.; Sawin, C.T.; Hannan, M.T.; Wilson, P.W.; Kiel, D.P. Estradiol, testosterone, and the risk for hip fractures in elderly men from the Framingham Study. Am. J. Med. 2006, 119, 426. [Google Scholar] [CrossRef] [PubMed]
- Falahati-Nini, A.; Riggs, B.L.; Atkinson, E.J.; O’Fallon, W.M.; Eastell, R.; Khosla, S. Relative contributions of testosterone and estrogen in regulating bone resorption and formation in normal elderly men. J. Clin. Investig. 2000, 106, 1553–1560. [Google Scholar] [CrossRef] [PubMed] [Green Version]
- Diamond, T.; Smerdely, P.; Kormas, N.; Sekel, R.; Vu, T.; Day, P. Hip fracture in elderly men: The importance of subclinical vitamin D deficiency and hypogonadism. Med. J. Aust. 1998, 169, 138–141. [Google Scholar] [CrossRef] [PubMed]
- Chamouni, A.; Oury, F. Reciprocal interaction between bone and gonads. Arch. Biochem. Biophys. 2014, 561, 147–153. [Google Scholar] [CrossRef]
- Almeida, M.; Han, L.; Ambrogini, E.; Bartell, S.M.; Manolagas, S.C. Oxidative stress stimulates apoptosis and activates NF-κB in osteoblastic cells via a PKCβ/p66shc signaling cascade: Counter regulation by estrogens or androgens. Mol. Endocrinol. 2010, 24, 2030–2037. [Google Scholar] [CrossRef] [Green Version]
- Keeting, P.E.; Rifas, L.; Harris, S.A.; Colvard, D.S.; Spelsberg, T.C.; Peck, W.A.; Riggs, B.L. Evidence for interleukin-1β production by cultured normal human osteoblast-like cells. J. Bone. Miner. Res. 1991, 6, 827–833. [Google Scholar] [CrossRef]
- Vanderschueren, D.; Laurent, M.R.; Claessens, F.; Gielen, E.; Lagerquist, M.K.; Vandenput, L.; Borjesson, A.E. Sex steroid actions in male bone. Endocr. Rev. 2014, 35, 906–960. [Google Scholar] [CrossRef]
- Miedlich, S.U.; Karamooz, N.; Hammes, S.R. Aromatase deficiency in a male patient—Case report and review of the literature. Bone 2016, 93, 181–186. [Google Scholar] [CrossRef]
- Khosla, S. New insights into androgen and estrogen receptor regulation of the male skeleton. J. Bone Miner. Res. 2015, 7, 134–1137. [Google Scholar] [CrossRef] [Green Version]
- Vermeulen, A.; Verdonck, L.; Kaufman, J.M. A critical evaluation of simple methods for the estimation of free testosterone in serum. J. Clin. Endocrinol. Metab. 1999, 84, 3666–3672. [Google Scholar] [CrossRef] [PubMed]
- Chung, M.C.; Gombar, S.; Shi, R.Z. Implementation of Automated Calculation of Free and Bioavailable Testosterone in Epic Beaker Laboratory Information System. J. Pathol. Inf. 2017, 8, 28. [Google Scholar]
- Morris, P.D.; Malkin, C.J.; Channer, K.S.; Jones, T.H. A mathematical comparison of techniques to predict biologically available testosterone in a cohort of 1072 men. Eur. J. Endocrinol. 2004, 151, 241–249. [Google Scholar] [CrossRef] [PubMed] [Green Version]
- Kula, K.; Słowikowska-Hilczer, J. Hipogonadyzm późny u mężczyzn (Late-onset hypoonadism in men). Endokrynol. Pol. 2012, 63, 15–19. [Google Scholar]
- Palermo, A.; Tuccinardi, D.; Defeudis, G.; Watanabe, M.; D’Onofrio, L.; Lauria Pantano, A.; Napoli, N.; Pozzilli, P.; Manfrini, S. BMI and BMD: The Potential Interplay between Obesity and Bone Fragility. Int. J. Environ. Res. Public Health 2016, 13, 544. [Google Scholar] [CrossRef] [Green Version]
- Khosla, S.; Melton, L.J., 3rd; Atkinson, E.J.; O’Fallon, W.M. Relationship of serum sex steroid levels to longitudinal changes in bone density in young versus elderly men. J. Clin. Endocrinol. Metab. 2001, 86, 3555–3561. [Google Scholar] [CrossRef]
- Chen, Z.; Maricic, M.; Nguyen, P.; Ahmann, F.R.; Bruhn, R.; Dalkin, B.L. Low bone density and high percentage of body fat among men who were treated with androgen deprivation therapy for prostate carcinoma. Cancer 2002, 95, 2136–2141. [Google Scholar] [CrossRef]
- Smith, M.R.; McGovern, F.J.; Zietman, A.L.; Fallon, M.A.; Hayden, D.L.; Schoenfeld, D.A.; Kantoff, P.W.; Finkelstein, J.S. Pamidronate to prevent bone loss during androgen-deprivation therapy for prostate cancer. N. Engl. J. Med. 2001, 345, 948–952. [Google Scholar] [CrossRef]
- Sobel, V.; Schwartz, B.; Zhu, Y.S.; Cordero, J.J.; Imperato-McGinley, J. Bone mineral density in the complete androgen insensitivity and 5alpha-reductase-2 deficiency syndromes. J. Clin. Endocrinol. Metab. 2006, 91, 3017. [Google Scholar] [CrossRef] [Green Version]
- Foresta, C.; Strapazzon, G.; De Toni, L.; Gianesello, L.; Calcagno, A.; Pilon, C.; Plebani, M.; Vettor, R. Evidence for osteocalcin production by adipose tissue and its role in human metabolism. J. Clin. Endocrinol. Metab. 2010, 95, 3502–3506. [Google Scholar] [CrossRef] [Green Version]
- Smith, L.B.; Saunders, T.K. The skeleton: The new controller of male fertility? Cell 2011, 144, 642–643. [Google Scholar] [CrossRef] [PubMed] [Green Version]
- Liu, Z.Y.; Yang, Y.; Wen, C.Y.; Rong, L.M. Serum Osteocalcin and Testosterone Concentrations in Adult Males with or without Primary Osteoporosis: A Meta-Analysis. Biomed. Res. Int. 2017, 2017, 9892048. [Google Scholar] [CrossRef] [PubMed] [Green Version]
- Fink, H.A.; Ewing, S.K.; Ensrud, K.E.; Barrett-Connor, E.; Taylor, B.C.; Cauley, J.A.; Orwoll, E.S. Association of testosterone and estradiol deficiency with osteoporosis and rapid bone loss in older men. J. Clin. Endocrinol. Metab. 2006, 91, 3908–3915. [Google Scholar] [CrossRef] [PubMed]
- Zhong, N.; Xu, B.; Cui, R.; Xu, M.; Su, J.; Zhang, Z.; Liu, Y.; Li, L.; Sheng, C.; Sheng, H.; et al. Positive Correlation between Serum Osteocalcin and Testosterone in Male Hyperthyroidism Patients with High Bone Turnover. Exp. Clin. Endocrinol. Diabetes 2016, 124, 452–456. [Google Scholar] [CrossRef] [Green Version]
- Hannemann, A.; Breer, S.; Wallaschofski, H.; Nauck, M.; Baumeister, S.E.; Barvencik, F.; Amling, M.; Schinke, T.; Haring, R.; Keller, J. Osteocalcin is associated with testosterone in the general population and selected patients with bone disorders. Andrology 2013, 1, 469–474. [Google Scholar] [CrossRef] [Green Version]
- LeBlanc, E.S.; Nielson, C.M.; Marshall, L.M.; Lapidus, J.A.; Barrett-Connor, E.; Ensrud, K.E.; Hoffman, A.R.; Laughlin, G.; Ohlsson, C.; Orwoll, E.S. The effects of serum testosterone, estradiol, and sex hormone binding globulin levels on fracture risk in older men. J. Clin. Endocrinol. Metab. 2009, 94, 3337–3346. [Google Scholar] [CrossRef] [Green Version]
- Krege, J.H.; Lane, N.E.; Harris, J.M.; Miller, P.D. PINP as a biological response marker during teriparatide treatment for osteoporosis. Osteoporos. Int. 2014, 25, 2159–2171. [Google Scholar]
- Bellows, C.G.; Reimers, S.M.; Heersche, J.N. Expression of mRNAs for type-I collagen, bone sialoprotein, osteocalcin, and osteopontin at different stages of osteoblastic differentiation and their regulation by 1, 25 dihydroxyvitamin D3. Cell. Tissue Res. 1999, 297, 249–259. [Google Scholar] [CrossRef]
- Xiao, H.Y.; Lu, Y.H.; Gong, Y.P.; Pei, Y.; Cheng, X.L.; Li, N.; Fang, F.S.; Tian, H.; Li, C.L. Correlation of sex hormones and parathyroid hormone with biochemical markers of bone turnover in aged men. Zhonghua Nan Ke Xue. 2014, 20, 257–262. [Google Scholar]
- Välimäki, V.V.; Alfthan, H.; Ivaska, K.K.; Löyttyniemi, E.; Pettersson, K.; Stenman, U.H.; Välimäki, M.J. Serum estradiol, testosterone, and sex hormone-binding globulin as regulators of peak bone mass and bone turnover rate in young Finnish men. J. Clin. Endocrinol. Metab. 2004, 89, 3785–3789. [Google Scholar] [CrossRef] [Green Version]
- Khosla, S.; Monroe, D.G. Regulation of Bone Metabolism by Sex Steroids. Cold Spring Harb Perspect Med. 2018, 2, 031211. [Google Scholar] [CrossRef] [PubMed] [Green Version]
- Rochira, V.; Balestrieri, A.; Madeo, B.; Zirilli, L.; Granata, A.R.; Carani, C. Osteoporosis and male aged-related hypogonadism: Role of sex steroids on bone (patho) physiology. Eur. J. Endocrinol. 2006, 154, 175–185. [Google Scholar] [CrossRef] [Green Version]
- Lee, H.; Finkelstein, J.S.; Miller, M.; Comeaux, S.J.; Cohen, R.I.; Leder, B.Z. Effects of selective testosterone and estradiol withdrawal on skeletal sensitivity to parathyroid hormone in men. J. Clin. Endocrinol. Metab. 2006, 91, 1069–1075. [Google Scholar] [CrossRef] [PubMed] [Green Version]
- Vanderschueren, D.; Boonen, S.; Bouillon, R. Osteoporosis and osteoporotic fractures in men: A clinical perspective. Baillieres Best Pract. Res. Clin. Endocrinol. Metab. 2000, 14, 299–315. [Google Scholar] [CrossRef] [PubMed]
- Greco, E.A.; Lenzi, A.; Migliaccio, S. The obesity of bone. Ther. Adv. Endocrinol. Metab. 2015, 6, 273–286. [Google Scholar] [CrossRef] [PubMed] [Green Version]
- Eriksen, E.F.; Colvard, D.S.; Berg, N.J.; Graham, M.L.; Mann, K.G.; Spelsberg, T.C.; Riggs, B.L. Evidence of estrogen receptors in normal human osteoblast-like cells. Science 1988, 241, 84–86. [Google Scholar] [CrossRef]
- Kim, H. New understanding of glucocorticoid action in bone cells. BMB Rep. 2010, 43, 524–529. [Google Scholar] [CrossRef]
- Gomez-Ambrosi, J.; Rodrıguez, A.; Catalan, V.; Fruhbeck, G. The bone-adipose axis in obesity and weight loss. Obes. Surg. 2008, 18, 1134–1143. [Google Scholar] [CrossRef]
- Fukumoto, S.; Martin, T. Bone as an endocrine organ. Trends Endocrinol. Metab. 2009, 20, 230–236. [Google Scholar] [CrossRef]
- Sood, A.; Shore, S.A. Adiponectin, leptin, and resistin in asthma: Basic mechanisms through population studies. J. Allergy (Cairo) 2013, 2013, 785–835. [Google Scholar] [CrossRef] [Green Version]
- De Lima Azambuja, R.; da Costa Santos Azambuja, L.S.E.; Costa, C.; Rufino, R. Adiponectin in asthma and obesity: Protective agent or risk factor for more severe disease? Lung 2015, 193, 749–755. [Google Scholar] [CrossRef] [PubMed]
- Miethe, S.; Guarino, M.; Alhamdan, F.; Simon, H.U.; Renz, H.; Dufour, J.F.; Potaczek, D.P.; Garn, H. Effects of obesity on asthma: Immunometabolic links. Pol. Arch. Intern. Med. 2018, 128, 469–477. [Google Scholar] [CrossRef] [PubMed] [Green Version]

| Variable | Patients without TDS n = 112 | Patients with TDS n = 63 | p | ||
|---|---|---|---|---|---|
| X ± SD | Me | X ± SD | Me | ||
| Anthropometric parameters | |||||
| Age [years] | 66.86 ± 4.50 | 67.00 | 67.77 ± 4.54 | 68.00 | 0.294 2 |
| Weight [kg] | 88.02 ± 13.96 | 88.00 | 97.88 ± 14.23 | 97.00 | 0.001 *,1 |
| BMI [kg/m2] | 28.84 ± 4.14 | 29.05 | 31.28 ± 4.18 | 30.86 | 0.003 *,1 |
| Hormonal parameters | |||||
| TT [ng/mL] | 5.67 ± 1.93 | 5.11 | 2.82 ± 0.76 | 3.16 | 0.001 *,2 |
| FT [ng/mL] | 0.09 ± 0.04 | 0.08 | 0.07 ± 0.03 | 0.07 | 0.004 *,2 |
| bioT [ng/dl] | 2.14 ± 0.95 | 1.98 | 1.52 ± 0.70 | 1.47 | 0.001 *,2 |
| E2 [pg/mL] | 89.19 ± 41.45 | 80.80 | 68.96 ± 36.86 | 54.14 | 0.003 *,2 |
| SHBG [nmol/L] | 60.33 ± 42.87 | 54.86 | 32.04 ± 23.94 | 24.23 | 0.001 *,2 |
| DHEAs [µg/mL] | 0.81 ± 0.58 | 0.64 | 0.82 ± 0.81 | 0.59 | 0.382 2 |
| Markers of bone turnover | |||||
| CtX-I [ng/mL] | 0.44 ± 0.23 | 0.40 | 0.43 ± 0.18 | 0.39 | 0.885 2 |
| PTH [pg/mL] | 38.37 ± 24.32 | 31.87 | 32.23 ± 17.07 | 30.54 | 0.172 2 |
| OC [ng/mL] | 6.12 ± 4.30 | 5.45 | 6.56 ± 3.76 | 5.69 | 0.389 2 |
| PINP [ng/mL] | 995.18 ± 869.42 | 834.25 | 700.95 ± 922.93 | 558.65 | 0.004 *,2 |
| Bone mineral density | |||||
| BMD [g/cm2] spine | 1.46 ± 0.24 | 1.43 | 1.41 ± 0.20 | 1.37 | 0.582 1 |
| BMD [g/cm2] hip | 1.15 ± 0.18 | 1.14 | 1.08 ± 0.16 | 1.06 | 0.215 1 |
| BMD [g/cm2] | 1.27 ± 0.15 | 1.29 | 1.24 ± 0.15 | 1.22 | 0.393 1 |
| Variable | Patients without TDS, n = 112 | Patients with TDS, n = 63 | |||||||
|---|---|---|---|---|---|---|---|---|---|
| p | Beta | −95.00% | +95.00% | p | Beta | −95.00% | +95.00% | ||
| PINP | TT ng/mL | 0.001 * | 0.389 | 0.175 | 0.604 | 0.458 | 0.141 | −0.243 | 0.526 |
| FT ng/mL | 0.060 | 0.234 | −0.010 | 0.477 | 0.585 | −0.118 | −0.560 | 0.322 | |
| bioT ng/dl | 0.068 | 0.227 | −0.018 | 0.471 | 0.484 | −0.150 | −0.585 | 0.284 | |
| E2 pg/mL | 0.002 * | 0.360 | 0.132 | 0.588 | <0.001 * | 0.726 | 0.469 | 0.984 | |
| SHBG nmol/L | 0.153 | 0.177 | −0.067 | 0.422 | 0.179 | 0.280 | −0.136 | 0.696 | |
| DHEA µg/mL | 0.864 | 0.021 | −0.220 | 0.262 | 0.850 | 0.035 | −0.349 | 0.421 | |
| PTH | TT ng/mL | 0.996 | 0.001 | −0.232 | 0.233 | 0.122 | 0.275 | −0.078 | 0.360 |
| FT ng/mL | 0.492 | −0.086 | −0.334 | 0.162 | 0.545 | −0.125 | −0.543 | 0.593 | |
| BioT ng/dl | 0.730 | −0.043 | −0.293 | 0.206 | 0.623 | −0.101 | −0.515 | 0.314 | |
| E2 pg/mL | 0.258 | 0.137 | −0.103 | 0.378 | 0.090 | 0.284 | −0.054 | 0.623 | |
| SHBG nmol/L | 0.167 | 0.171 | −0.073 | 0.416 | 0.133 | 0.296 | −0.096 | 0.687 | |
| DHEA µg/mL | 0.265 | −0.135 | −0.374 | 0.104 | 0.208 | −0.224 | −0.579 | 0.132 | |
| CtX-I | TT ng/mL | 0.354 | 0.107 | −0.121 | 0.334 | 0.133 | −0.277 | −0.643 | 0.089 |
| FT ng/mL | 0.313 | −0.124 | −0.367 | 0.119 | 0.091 | −0.347 | −0.753 | 0.059 | |
| BioT ng/dl | 0.149 | −0.177 | −0.419 | 0.065 | 0.057 | −0.385 | −0.781 | 0.012 | |
| E2 pg/mL | 0.274 | 0.131 | −0.106 | 0.368 | 0.548 | 0.108 | −0.255 | 0.471 | |
| SHBG nmol/L | 0.066 | 0.223 | −0.015 | 0.462 | 0.428 | −0.163 | −0.578 | 0.251 | |
| DHEA µg/mL | 0.447 | −0.091 | −0.327 | 0.146 | 0.270 | −0.203 | −0.572 | 0.166 | |
| OC | TT ng/mL | 0.201 | 0.145 | −0.079 | 0.370 | 0.377 | −0.160 | −0.524 | 0.204 |
| FT ng/mL | 0.938 | −0.010 | −0.253 | 0.234 | 0.298 | −0.211 | −0.618 | 0.196 | |
| BioT ng/dl | 0.705 | −0.047 | −0.291 | 0.198 | 0.280 | −0.216 | −0.618 | 0.185 | |
| E2 pg/mL | 0.463 | 0.087 | −0.149 | 0.324 | 0.419 | −0.141 | −0.492 | 0.210 | |
| SHBG nmol/L | 0.115 | 0.190 | −0.047 | 0.427 | 0.236 | −0.236 | −0.633 | 0.162 | |
| DHEA µg/mL | 0.251 | −0.135 | −0.368 | 0.098 | 0.257 | −0.203 | −0.561 | 0.155 | |
| Variable | Patients with TDS | Patients without TDS | ||||||||
|---|---|---|---|---|---|---|---|---|---|---|
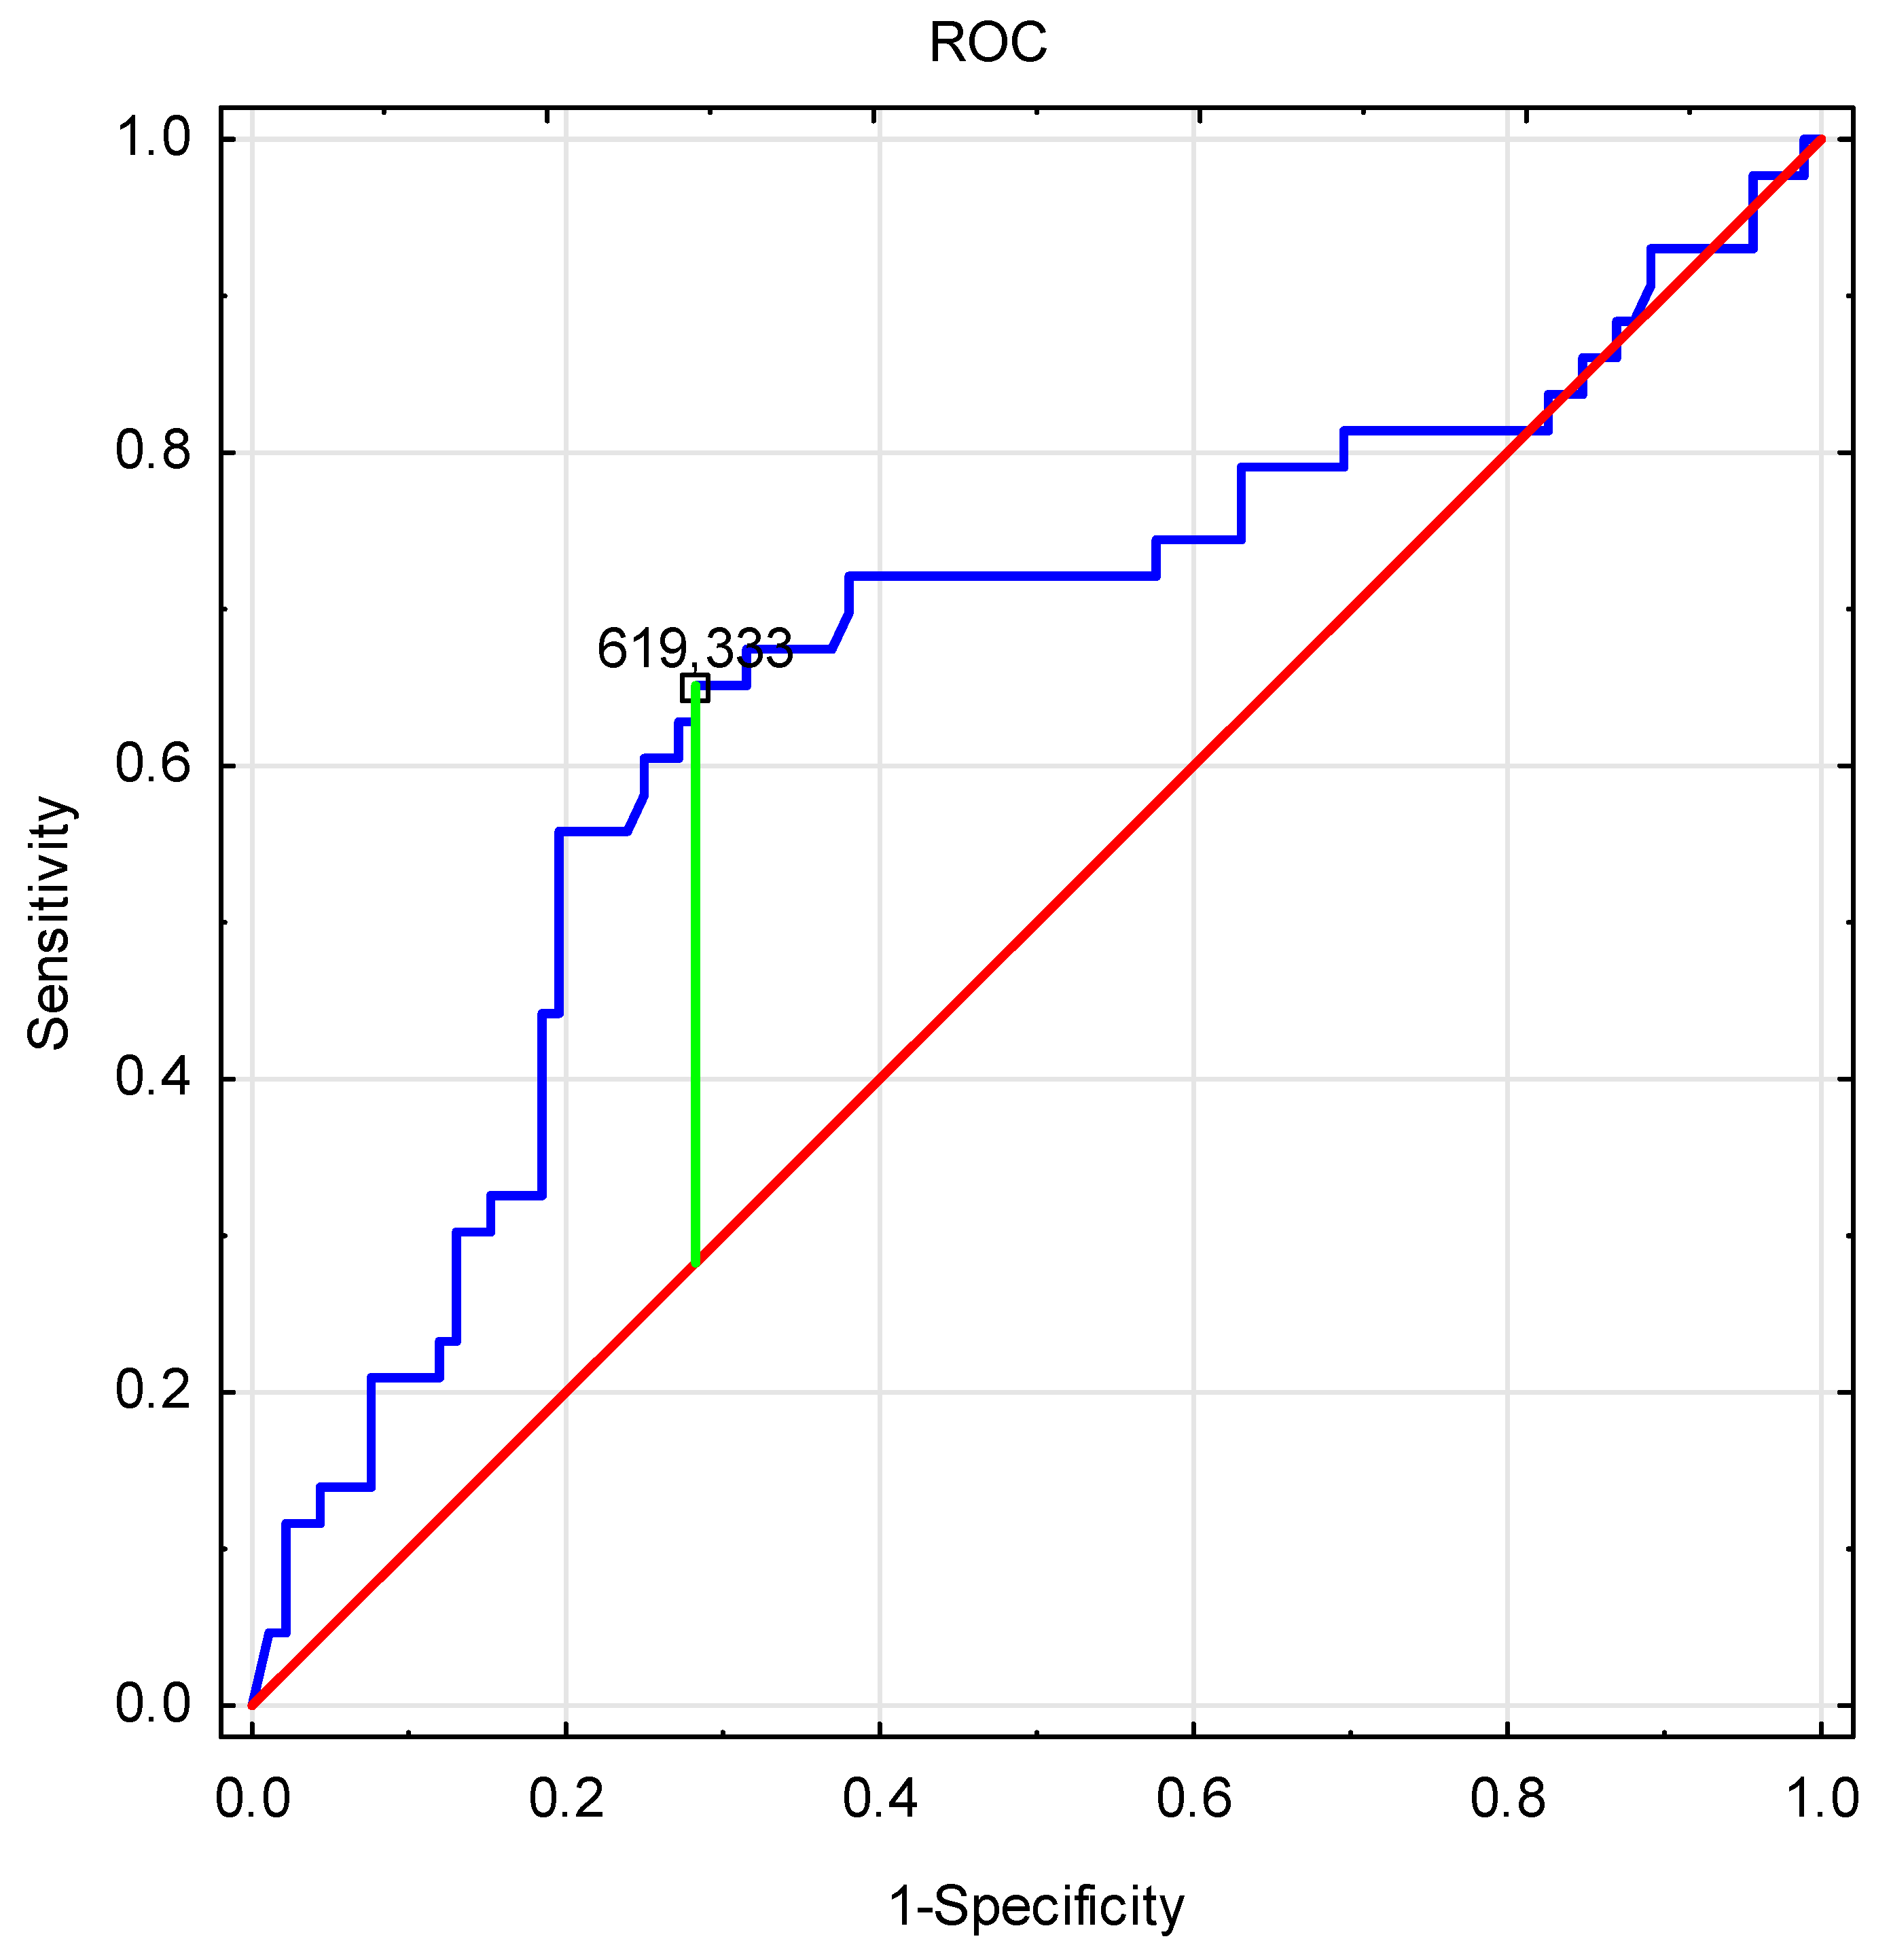
| PINP Levels <619.333 | PINP Levels >619.333 | p | PINP Levels <619.333 | PINP Levels >619.333 | p | |||||
| X ± SD | Me | X ± SD | Me | X ± SD | Me | X ± SD | Me | |||
| Hormonal parameters | ||||||||||
| TT ng/mL | 2.78 ± 0.82 | 3.14 | 2.87 ± 0.66 | 3.21 | 0.71 | 5.11 ± 1.52 | 4.57 | 6.15 ± 2.12 | 5.61 | 0.006 * |
| FT ng/mL | 0.07 ± 0.03 | 0.08 | 0.06 ± 0.03 | 0.06 | 0.29 | 0.09 ± 0.04 | 0.07 | 0.10 ± 0.04 | 0.09 | 0.216 |
| bioT ng/dl | 1.60 ± 0.75 | 1.66 | 1.31 ± 0.59 | 1.26 | 0.28 | 1.97 ± 0.84 | 1.73 | 2.30 ± 1.02 | 2.13 | 0.206 |
| E2 pg/mL | 57.91 ± 28.70 | 45.05 | 98.66 ± 41.69 | 95.77 | 0.01 * | 78.08 ± 42.82 | 73.56 | 99.33 ± 38.22 | 84.57 | 0.007 * |
| SHBG nmol/L | 29.66 ± 24.74 | 16.91 | 39.28 ± 23.32 | 30.04 | 0.11 | 57.83 ± 40.89 | 42.77 | 62.75 ± 45.12 | 48.12 | 0.590 |
| DHEA µg/mL | 0.86 ± 0.83 | 0.61 | 0.79 ± 0.85 | 0.51 | 0.74 | 0.86 ± 0.60 | 0.63 | 0.78 ± 0.57 | 0.70 | 0.480 |
| Bone mineral density | ||||||||||
| BMD [g/cm2] spine | 1.44 ± 0.25 | 1.45 | 1.37 ± 0.12 | 1.33 | 0.52 | 1.40 ± 0.29 | 1.31 | 1.49 ± 0.22 | 1.44 | 0.867 |
| BMD [g/cm2] hip | 1.09 ± 0.19 | 1.09 | 1.07 ± 0.15 | 1.07 | 0.93 | 1.05 ± 0.17 | 1.03 | 1.19 ± 0.17 | 1.16 | 0.235 |
| BMD [g/cm2] | 1.25 ± 0.19 | 1.24 | 1.23 ± 0.12 | 1.22 | 0.78 | 1.22 ± 0.16 | 1.26 | 1.29 ± 0.14 | 1.30 | 0.032 * |
© 2019 by the authors. Licensee MDPI, Basel, Switzerland. This article is an open access article distributed under the terms and conditions of the Creative Commons Attribution (CC BY) license (http://creativecommons.org/licenses/by/4.0/).
Share and Cite
Rył, A.; Szylińska, A.; Jurewicz, A.; Bohatyrewicz, A.; Miazgowski, T.; Rotter, I. Analysis of the Relationship between the Levels of Androgens and Biochemical Bone Markers in Men Aged 60–75 Years. Int. J. Environ. Res. Public Health 2020, 17, 106. https://doi.org/10.3390/ijerph17010106
Rył A, Szylińska A, Jurewicz A, Bohatyrewicz A, Miazgowski T, Rotter I. Analysis of the Relationship between the Levels of Androgens and Biochemical Bone Markers in Men Aged 60–75 Years. International Journal of Environmental Research and Public Health. 2020; 17(1):106. https://doi.org/10.3390/ijerph17010106
Chicago/Turabian StyleRył, Aleksandra, Aleksandra Szylińska, Alina Jurewicz, Andrzej Bohatyrewicz, Tomasz Miazgowski, and Iwona Rotter. 2020. "Analysis of the Relationship between the Levels of Androgens and Biochemical Bone Markers in Men Aged 60–75 Years" International Journal of Environmental Research and Public Health 17, no. 1: 106. https://doi.org/10.3390/ijerph17010106