Abstract
The mortality-to-incidence ratio (MIR) is associated with the clinical outcomes of different types of cancer as well as the ranking of health care systems. However, the association between MIRs for testicular cancer and health care disparities, including differences in expenditures and health system rankings, has not yet been reported. We used the Spearman’s rank correlation coefficient (CC) to analyze the correlation between testicular cancer MIRs and both total expenditures on health/gross domestic product (e/GDP) and the World Health Organization’s (WHO) health system rankings. After screening the data for quality and missing information, 57 countries were chosen for analysis. Generally, developed countries and regions had relatively high rates of incidence/mortality, but with a favorable MIR. Among the continents, Europe had the highest incidence rates, whereas the highest MIRs were in Africa. Globally, favorable testicular cancer MIRs were observed in countries with both a high e/GDP and a good WHO ranking (R2 = 0.325, p < 0.001 and CC = −0.568, p < 0.001; R2 = 0.367, p < 0.001 and CC = 0.655, p < 0.001, respectively). In conclusion, the MIR for testicular cancer varies in countries and regions based on both their total health expenditure and their health care system ranking.
1. Introduction
Testicular cancer is a relatively rare tumor type that comprises a mere 1% of all male cancers worldwide [1]. Testicular cancer not only has a distinctive age distribution, but is also a commonly diagnosed malignancy among men 15–40 years old [2]. Previous studies have predicted a steady rise in the cancer burden in the coming decades [3,4]. Despite an increase in its incidence, testicular cancer has the highest survival rate among male genital cancers: 95% of all patients will be cured, and they can expect long-term survival [5,6]. While cryptorchidism, family history, and ethnicity have been established as risk factors, the etiology of testicular cancer largely remains unclear [7].
In terms of geographic variation, the highest incidences of testicular cancer have been found in Western Europe (7.8%), Australia (6.5%), and North America (5.1%), where the Caucasian population predominates [8,9]. Nevertheless, the Africa region has the highest mortality-to-incidence ratio (MIR) [8]. In a large population-based analysis, non-Caucasians had poorer outcomes from testicular cancer (HR, 1.60; 95% CI, 1.22–2.10) [10] than did Caucasians. In addition to the disparity for ethnicity, previous studies in Africa have revealed that regions with high poverty, limited resources, and suboptimal health care systems face major challenges to disease management, which consequently lead to poorer prognoses [11]. Current MIRs can be calculated relatively easily from recent data sources. These data may be able to increase our understanding of those factors that lead to mortality rates that depart from incidence-based expectations [12].
Regarding socioeconomic status, a previously published review demonstrated that, for patients with a higher socioeconomic position, while the incidence of testicular cancer is higher, the survival rate is better than it is for patients with a lower socioeconomic status [13]. The World Health Organization’s (WHO) ranking of health systems has indicated an association between overall efficiency with resource inputs and the development ranking of a country, with industrialized countries dominant among the better performers [14]. However, some studies have provided no significant gradient for relative survival by deprivation category (1.3%; 95% CI, −0.3%–3.1%) [15]. Hence, the current inconsistencies imply the importance of deeply discerning the disparity in regions with different WHO rankings and socioeconomic statuses. In this study, we sought to analyze how regions with different WHO rankings and health care expenditures correlated with incidence and mortality rates for testicular cancer.
2. Methods
Cancer incidence and mortality data were obtained from the GLOBOCAN 2012 database, which is maintained by the International Agency for Research on Cancer (https://www.iarc.fr/). The WHO rankings were obtained from the World Health System’s report from the WHO, which was scored based on an index of factors including health, responsiveness, and fair financial contributions. Health expenditure and life expectancy data were obtained from the World Health Statistics of the WHO (https://www.who.int/). The percentage of total expenditures on health to gross domestic product (e/GDP) was calculated to indicate the total health expenditure. All data acquisition methods have been described previously [16,17].
The GLOBOCAN 2012 database contains data on 184 countries. We excluded countries with either missing or poor data quality. In total, 22 countries had no WHO ranking data. Up to 105 countries had low data availability, per the quality report of the GLOBOCAN 2012 database (either a ranking of E–G for incidence or a ranking of 4–6 for mortality). Ultimately, 57 countries were included in the analyses. The MIR has been defined previously as the ratio of the crude mortality rate to the incidence rate [16,18,19,20].
The statistical analysis methods that were used have been described previously [16,19,20,21]. We evaluated the association between the MIRs and the variables with the Spearman’s rank correlation coefficient (CC) using SPSS statistical software version 15.0 (SPSS, Inc., Chicago, IL, USA). p Values < 0.05 were considered statistically significant. Scatter plots were produced using Microsoft Excel 2016.
3. Results
3.1. Incidence and Mortality in Testicular Cancer Are Higher in More-Developed Regions than in Less-Developed Regions
To assess the global view of testicular cancer, we carried out an analysis of incidence and mortality based on region (Table 1). Overall, the world age-standardized rates (ASRs) for incidence and mortality were 1.5 and 0.3, respectively. Among more-developed regions, the ASR for incidence was higher than it was in less-developed regions (incidence: 5.2 vs 0.7, respectively). Nevertheless, there was no significant difference revealed in the ASR for mortality (mortality: 0.3 vs 0.3, respectively). Concerning the analysis that was based on WHO regions and continents, the ASR for incidence in the WHO’s European region and the continent of Europe exceeded those of other areas. Nevertheless, there was a gradual convergence of the ASR for mortality among all WHO regions and continents (ASR mortality: 0.1–0.5). These results indicate that testicular cancer in regions with high development and in Europe had higher incidence rates of testicular cancer, but there was a smaller difference for mortality.

Table 1.
Summary of the case numbers, rates, and MIRs of the incidence and mortality of testicular cancer per region.
3.2. The Mortality-to-Incidence Ratios for Prostate and Testicular Cancer Are High in Less-Developed Regions
Because the MIR has been proven useful for identifying disparities among cancers, regional differences in cancer MIRs were investigated. The world MIR for testicular cancer was 0.19. Contrary to the findings in the crude rate, both the less-developed regions and the regions with lower human development had higher MIRs (0.38 and 0.07, respectively) than other regions. Furthermore, higher MIRs were noted in the WHO’s East Mediterranean region, Africa region, and South-East Asia region (0.56, 0.50, and 0.50, respectively). Regarding continents, Africa had the highest MIR (0.67). Therefore, for the MIR of testicular cancer, less-developed regions, the East Mediterranean region, and the Africa region possessed higher MIRs.
3.3. A Country’s World Health Organization Ranking and Total Expenditure on Health/Gdp Have a Significant Association with Its Mortality-to-Incidence Ratio for Testicular Cancer
To further assess the epidemiologic differences among countries, we analyzed the countries of this study based on their position in the WHO’s rankings (Table 2). The information on the WHO ranking, the e/GDP, and life expectancy are also shown in Table 2. Among the included countries, France had the highest WHO ranking, and the United States of America had the highest e/GDP (17.0%). As for the ASR of incidence and mortality, the highest incidence was in Norway (12.2), and the highest mortality was in Chile (1.0). However, as for the MIR of individual countries, the Philippines, Fiji, and the South African Republic possessed the highest ratio (0.50).

Table 2.
Summary of selected countries’ World Health Organization rankings, total expenditures on health/GDP, life expectancies, testicular cancer incidences, mortality, and MIRs.
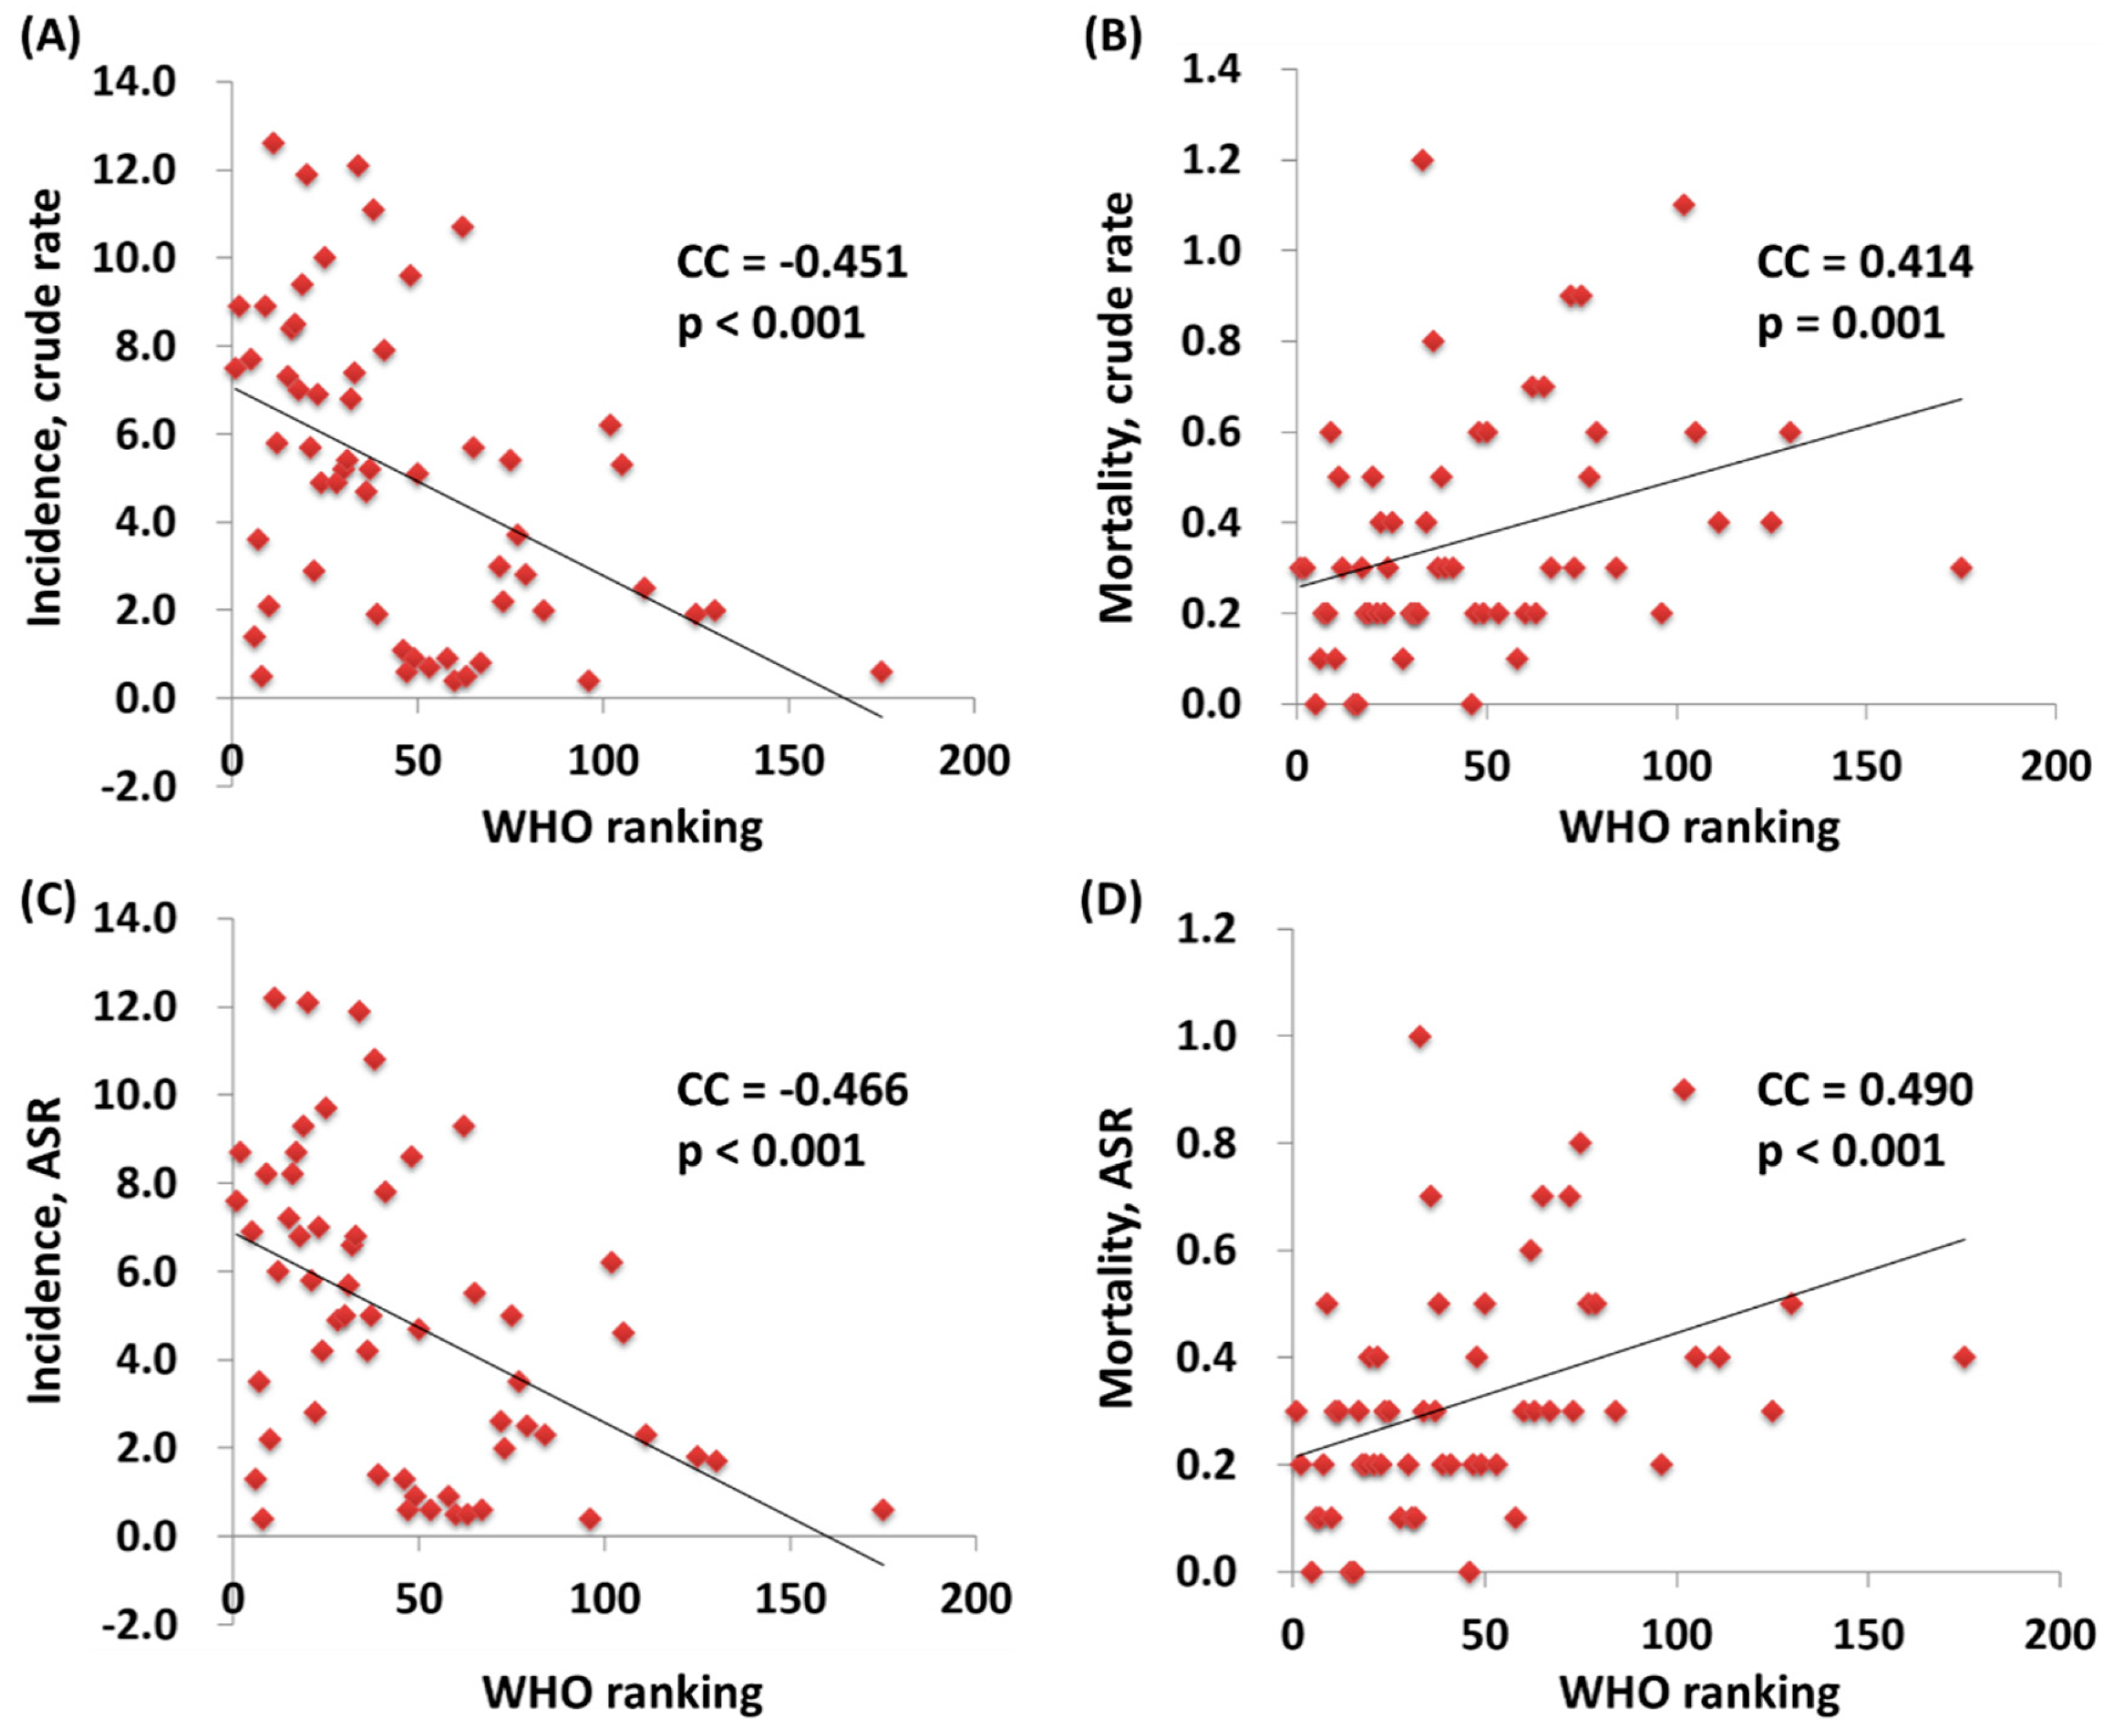
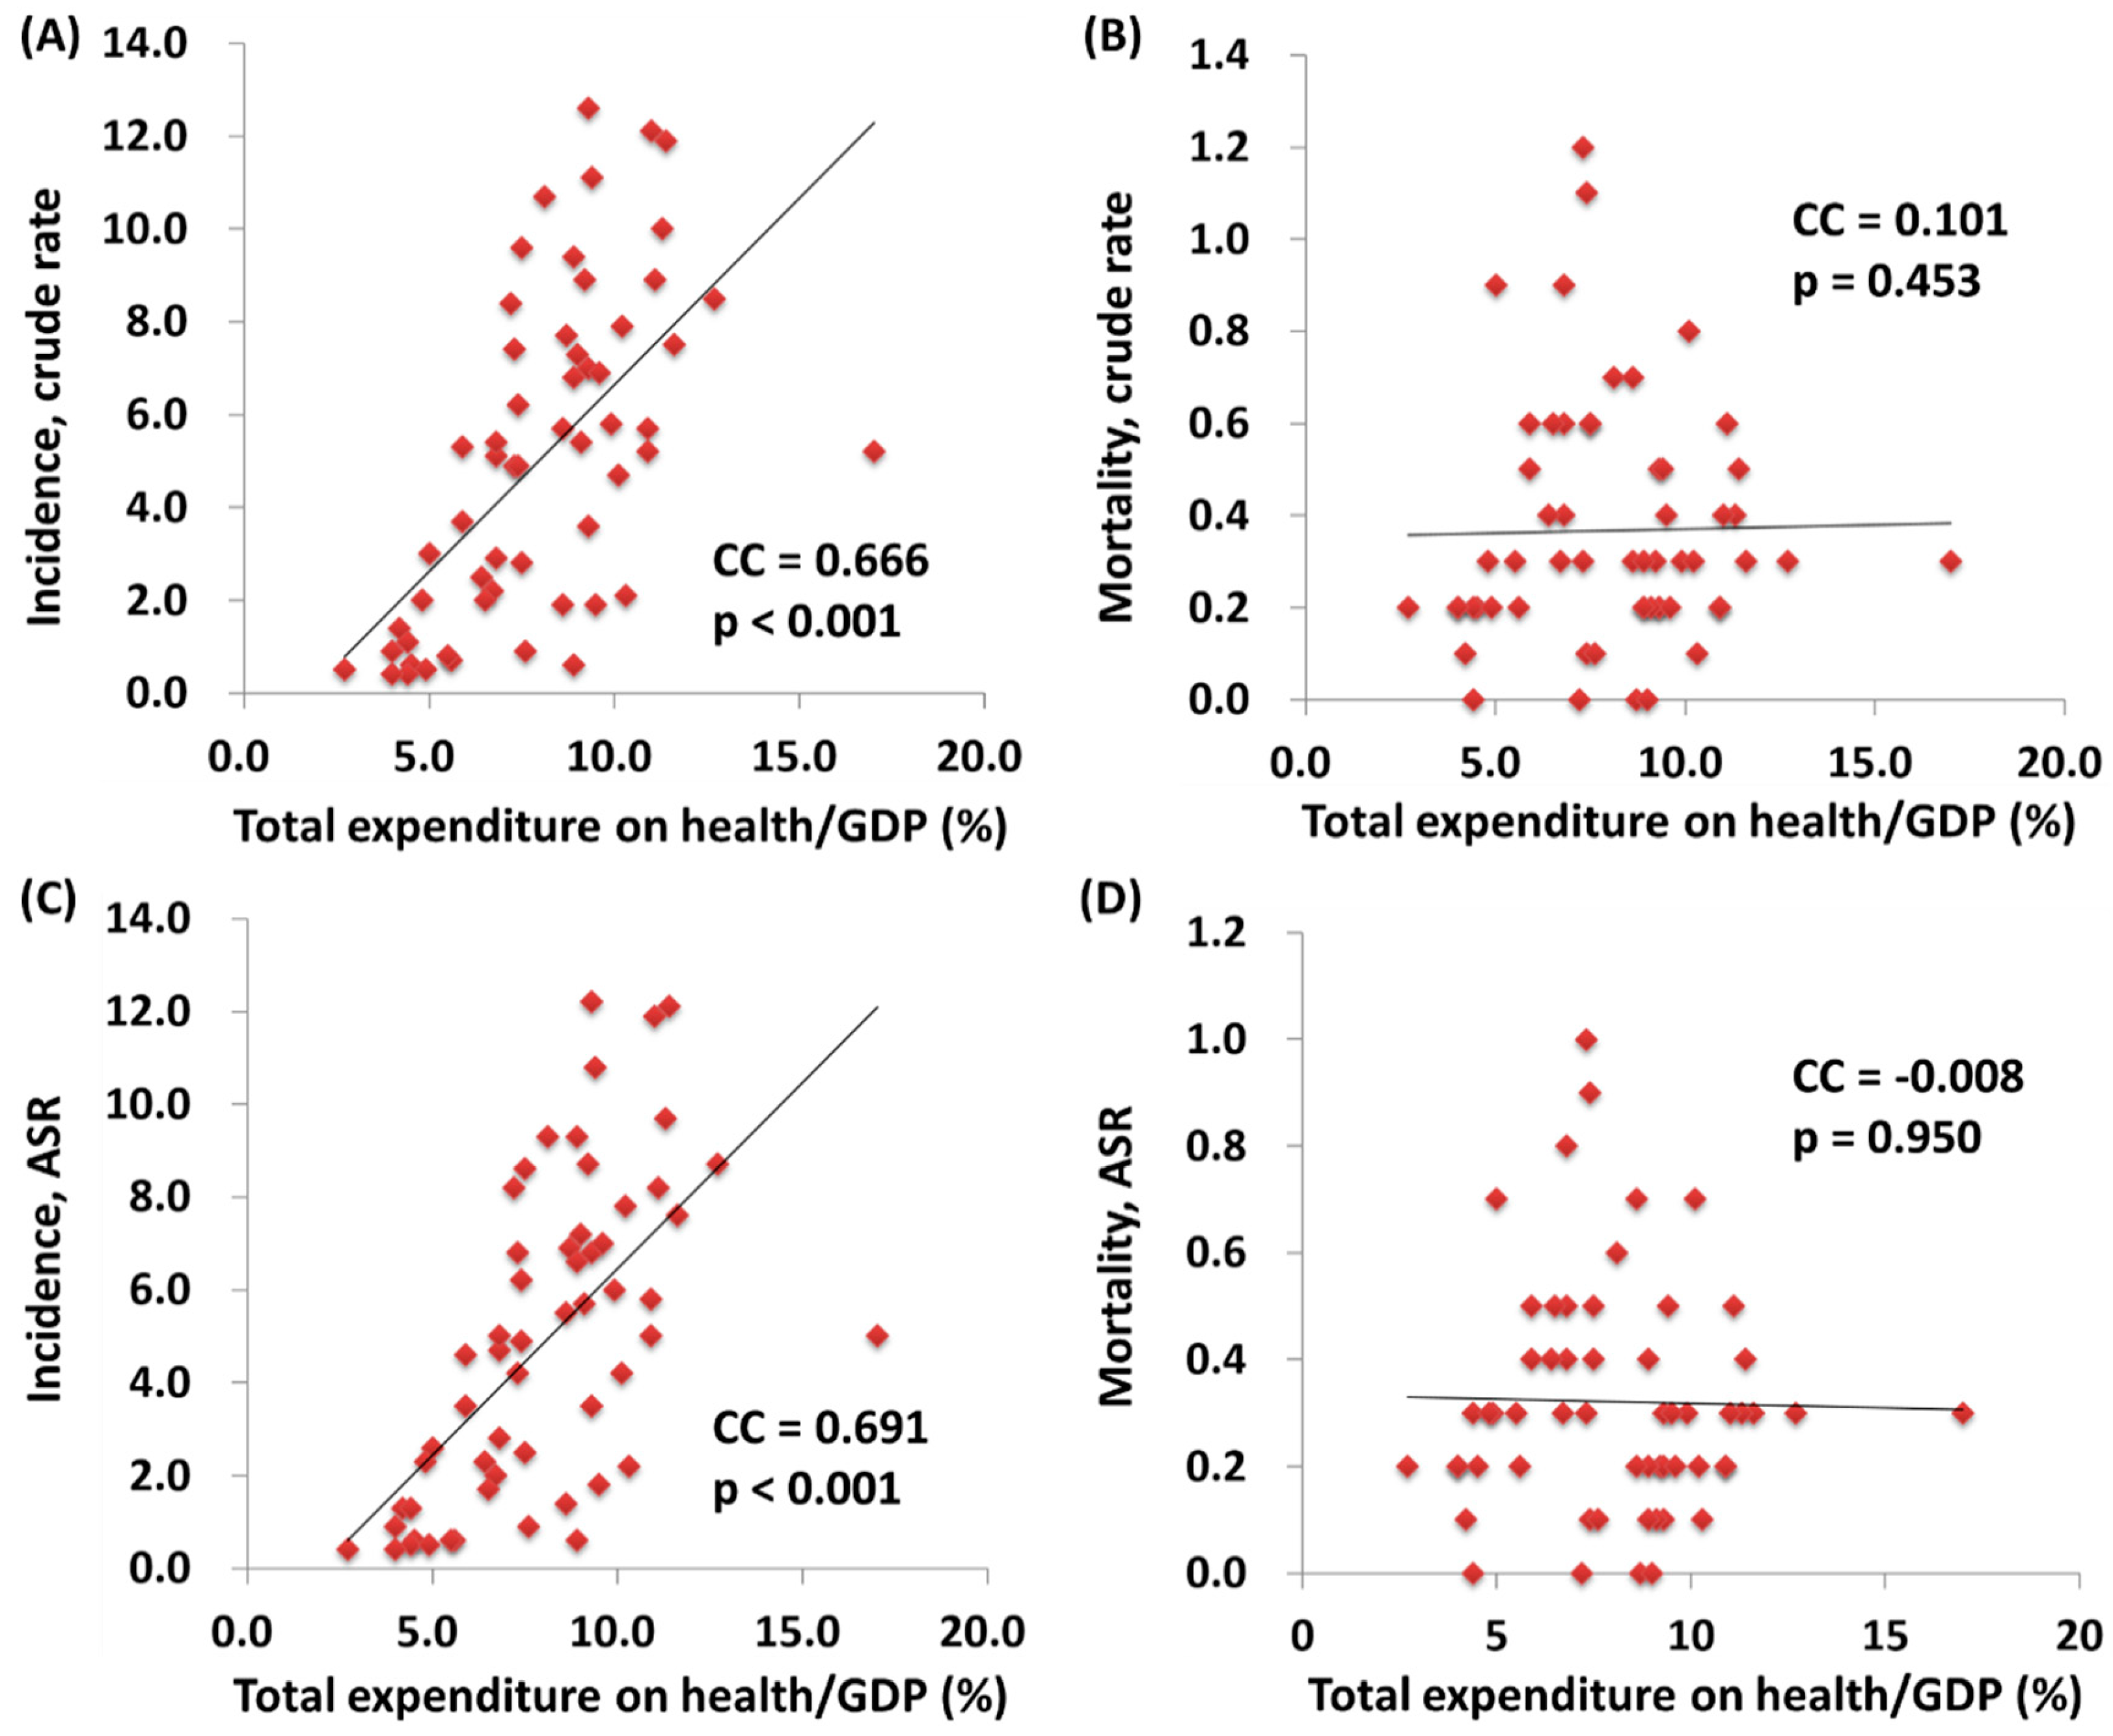
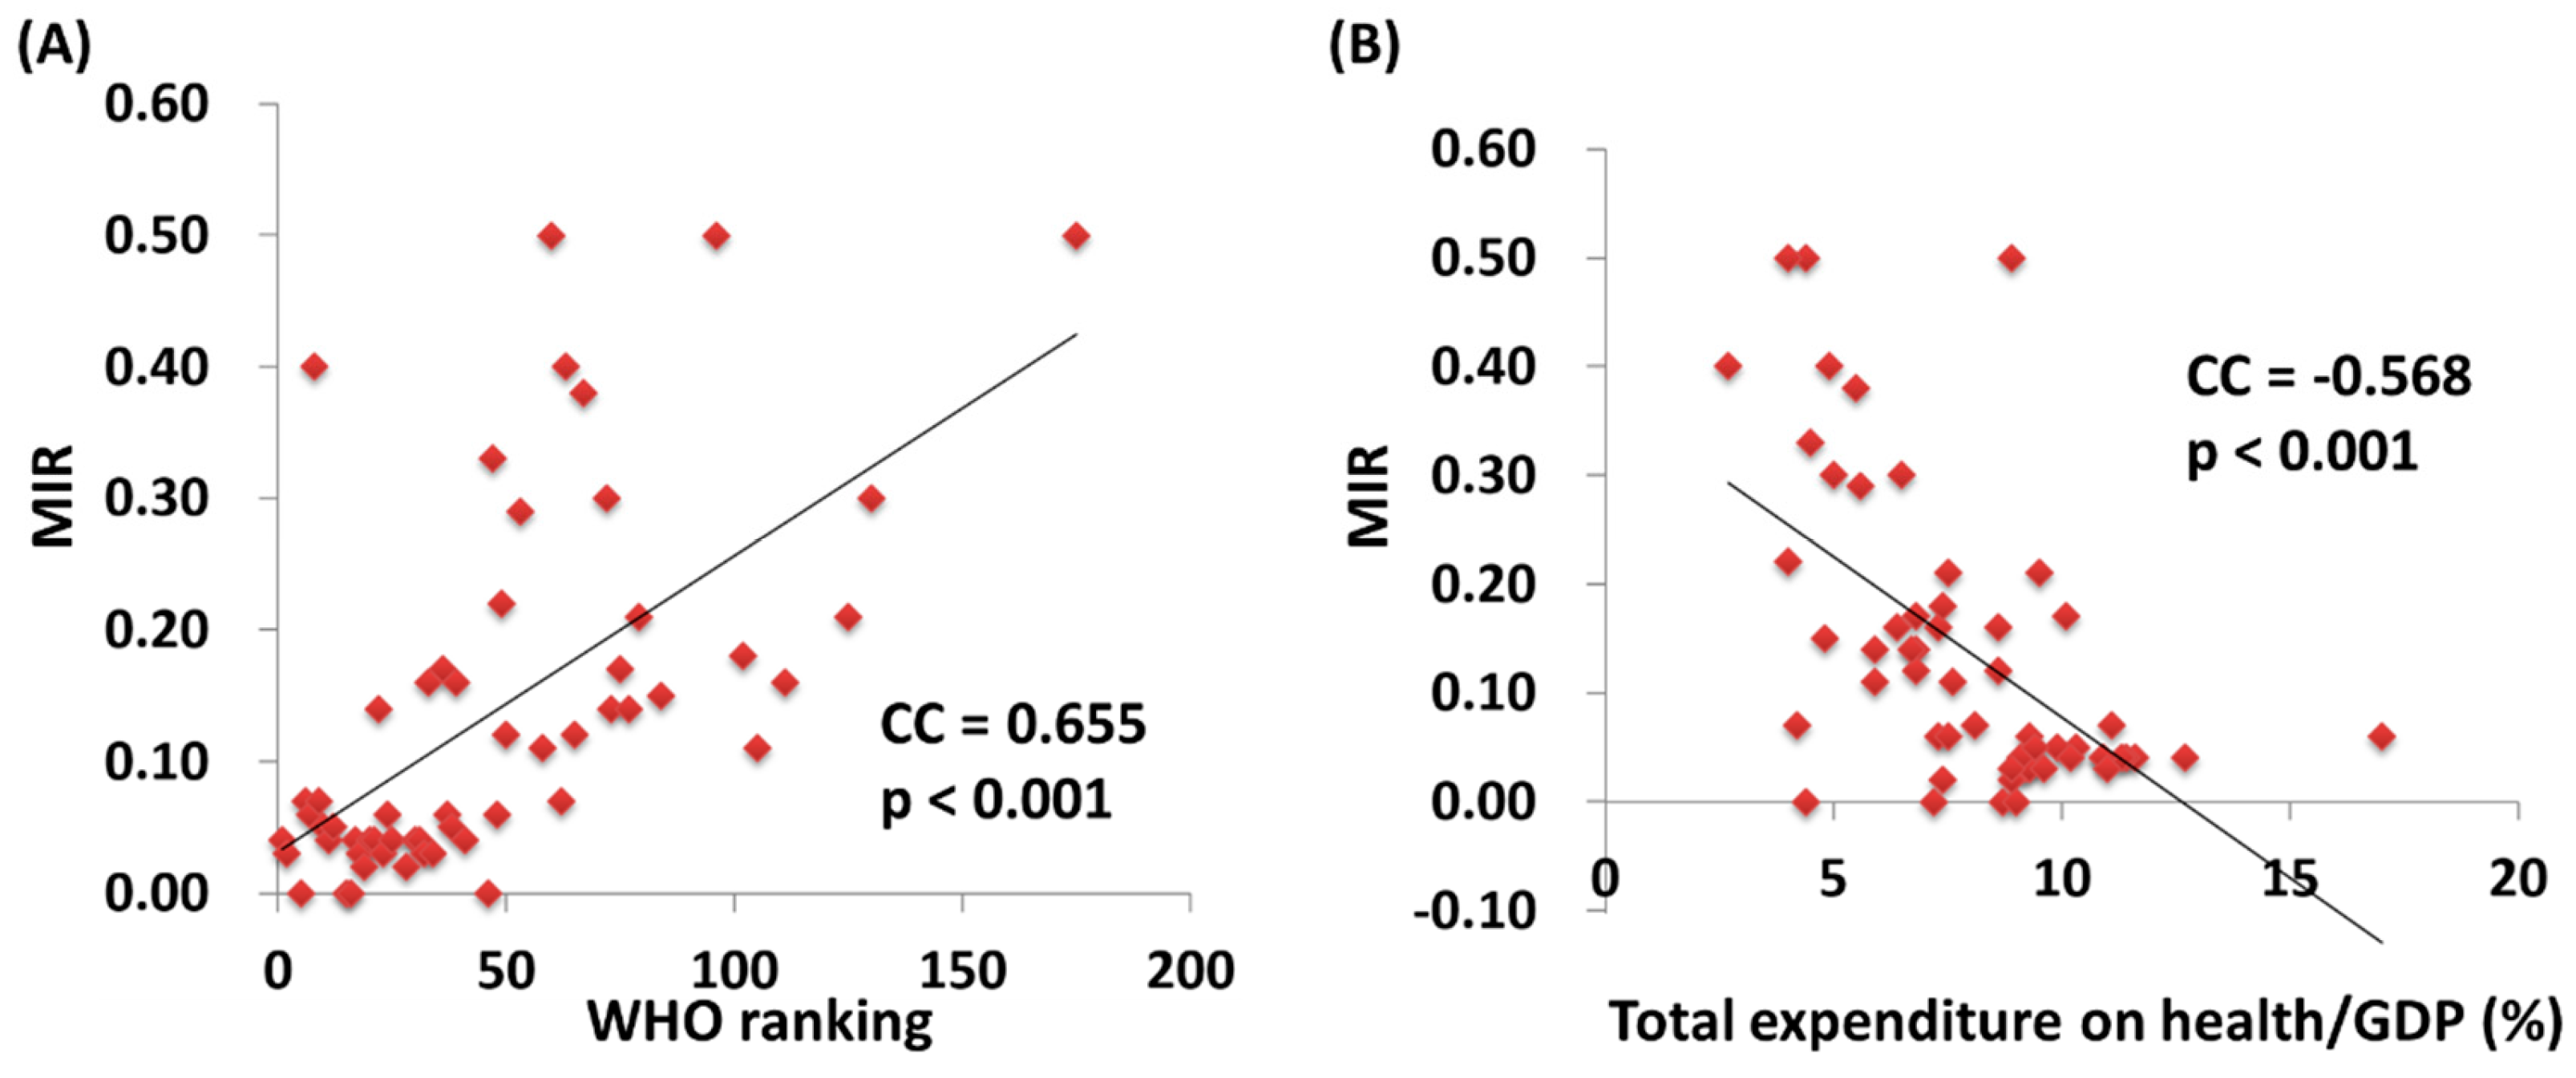
We further correlated the WHO ranking and the e/GDP with the ASR and MIR of testicular cancer by country. The WHO ranking reversely correlated to the e/GDP (R2 = 0.109, p = 0.12 and CC = −0.463, p < 0.001). Countries with a better WHO ranking had a higher crude rate and a higher ASR for incidence (R2 = 0.200, p < 0.001 and CC = −0.451, p < 0.001; R2 = 0.214, p < 0.001 and CC = −0.466, p < 0.001, respectively; Figure 1). Likewise, a higher crude rate and a higher ASR for incidence were noticed in countries with a higher e/GDP (R2 = 0.364, p < 0.001 and CC = 0.666, p < 0.001; R2 = 0.383, p < 0.001 and CC = 0.691, p < 0.001, respectively; Figure 2). Countries with a better WHO ranking had a lower crude rate and a lower ASR for mortality (R2 = 0.109, p = 0.012 and CC = 0.414, p = 0.001; R2 = 0.150, p = 0.003 and CC = 0.490, p < 0.001, respectively; Figure 1). Nevertheless, no statistically significant difference for either the crude rate or the ASR of mortality was shown among the countries with different e/GDPs (R2 < 0.001, p = 0.897 and CC = 0.101, p = 0.454; R2 < 0.001, p = 0.885 and CC = −0.008, p = 0.950, respectively; Figure 2). Regarding the MIR, a better WHO ranking and a higher e/GDP were associated with a favorable MIR (number of countries = 57; R2 = 0.367, p < 0.001 and CC = 0.655, p < 0.001; R2 = 0.325, p < 0.001 and CC = −0.568, p < 0.001, respectively; Figure 3), illustrating that a country’s WHO ranking and e/GDP are significantly associated with its MIR for testicular cancer. Furthermore, to confirm the influence of countries with a relatively small incidence or mortality case number, we analyzed their correlation after including a criteria of incidence or mortality case number larger than 10. The results in countries with incidence numbers larger than 10 continued to show that a better WHO ranking and a higher e/GDP were associated with a favorable MIR (number of countries = 52, R2 = 0.470, p < 0.001 and CC = 0.728, p < 0.001; R2 = 0.269, p < 0.001 and CC = −0.565, p < 0.001, respectively). As for those with mortality number larger than 10, a better WHO ranking and a higher e/GDP were associated with a favorable MIR (number of countries=37, R2 = 0.471, p < 0.001 and CC = 0.754, p < 0.001; R2 = 0.402, p < 0.001 and CC = –0.719, p < 0.001, respectively), as expected.
Figure 1.
The association between the World Health Organization’s rankings and crude rates of (A) incidence and (B) mortality, and the ASR (age-standardized rate) of (C) incidence and (D) mortality.
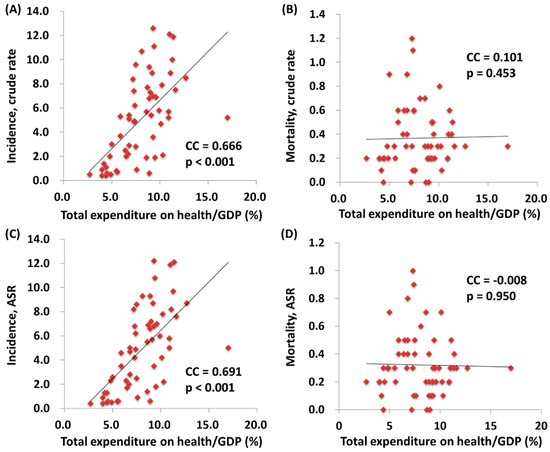
Figure 2.
The association between the total expenditures on health/GDP and the crude rates of (A) incidence and (B) mortality, and the ASR (age-standardized rate) of (C) incidence and (D) mortality.
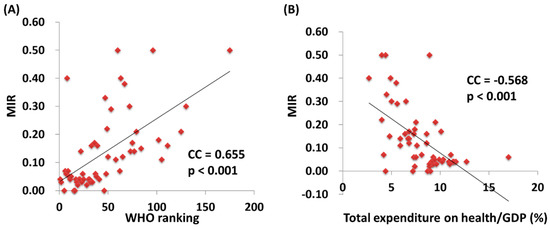
Figure 3.
The World Health Organization’s (A) rankings and (B) total expenditures on health/GDP are significantly associated with the MIR in testicular cancer.
4. Discussion
Testicular cancer is a relatively indolent disease. A high five-year survival rate of 74% with distant metastasis is significantly higher than the 6% for non-small cell lung cancer. This can be reflected by differences in MIRs. Globally, the MIR of lung cancer is 0.87 [21], while it is 0.19 for testicular cancer. Despite that, our study found a significant correlation between the MIR for testicular cancer and a country’s WHO ranking, echoing the findings of previous papers on colon cancer and lung cancer [18,21]. Therefore, it is clear that better health care programs can provide better detection and treatment for testicular cancer.
Unlike colon cancer, there is neither a standard nor a routine screening for testicular cancer. Furthermore, incidences of this disease are growing, and it is the most common malignancy in males aged 15–45 years [22]. Hence, a major part of the endeavor to increase detection must rely on public education to raise personal awareness. A study that was conducted in Northern Ireland found that only 17% of men within the at-risk age range had heard of a testicular self-examination, suggesting the urgent need for a more aggressive promotion of awareness by the health care system [23]. When considering that the United Kingdom has one of the lowest MIRs at 0.03, one can only imagine the scarcity of personal awareness promotion programs and education that are provided in countries with high MIRs.
Although most cases of testicular cancer are detected by a physical examination and a medical history check, a considerable proportion are detected incidentally. A retrospective study that was conducted in 2004 found that 11 of 150 patients who had undergone orchiectomy for testicular cancer had their cancer detected by a scrotal sonography examination that was intended for an infertility evaluation [24]. This technique enables the early diagnosis of small nonpalpable tumors. Such examinations may not be accessible in countries with poorer WHO rankings, which thus diminishes the possibility for earlier detection. A study that was conducted in Tanzania in 2014 found a stunning 39.3% of patients with stage IV diseases at presentation [11]. The treatment for testicular cancer consists of radical orchidectomy, cisplatin-based chemotherapy, radiotherapy, and retroperitoneal lymph node dissection. However, cisplatin-based chemotherapy is not routinely used in many African countries [11]. The higher costs of such regimens and a lack of adequate support from health care systems may contribute to such a phenomenon.
There are some limitations to our study. For example, we excluded countries with either poor data quality or little data from this study to avoid the possible production of misleading MIRs. However, this may lead to incompleteness in the data collection and a reduction in the generalizability of the results. Regardless of the consideration of data quality, as all countries are included, favorable testicular cancer MIRs were still observed in countries with both a high e/GDP and a good WHO ranking (N = 142, R2 = 0.138, p < 0.001 and CC = −0.391, p < 0.001; N = 145, R2 = 0.465, p < 0.001 and CC = 0.678, p < 0.001, respectively). Moreover, important risk factors for testicular cancer, such as undescending testis and infertility, were not documented. Another drawback is that this ecological study only analyzed data for one year, which may not have been enough to accurately reflect real trends for this disease. The generalizability of its findings at the individual level from the country level is the major limitation of this study. Also, the actual role of MIR is still conflicted, since the MIR would never replace the role of survival data from cohort survey [25]. Furthermore, since both the WHO ranking and e/GDP are indicators of infrastructure needed for cancer care, no causal relationship of these factors to the MIR was concluded.
Despite these limitations, our study was the first to identify a correlation between health care ranking and MIR for testicular cancer, suggesting that both the detection and the management of such an indolent disease can be examined and evaluated by MIRs. Although this is a novel indicator, we can also use it to assess the quality and accessibility of a health care system while urging worldwide advancement in medical practices.
5. Conclusions
A favorable MIR for testicular cancer was related to a high percentage of a country’s GDP going toward health care and a good ranking of their health care system. This makes it a potentially useful score for the global evaluation of health care systems and outcomes for testicular cancer.
Author Contributions
Conceptualization, W.-J.C., S.-L.C. and W.-W.S.; Data curation, Y.-H.H. and S.-C.W.; Formal analysis, W.-W.S.; Investigation, W.-J.C., C.-Y.H. and S.-C.W.; Resources, C.-Y.H. and T.-Y.H.; Supervision, S.-L.C., W.–W.S. and T.-H.L.; Writing–original draft, C.-Y.H. and W.-W.S.; Writing–review & editing, W.-J.C., Y.-H.H. and S.-C.W. All authors have read and agreed to the published version of the manuscript.
Funding
This research received no external funding.
Conflicts of Interest
The authors declare no conflict of interest.
Abbreviations
| ASR | age-standardized rate |
| CC | correlation coefficient |
| e/GDP | total expenditures on health/gross domestic product |
| MIR | mortality-to-incidence ratio |
| WHO | World Health Organization |
References
- Znaor, A.; Lortet-Tieulent, J.; Jemal, A.; Bray, F. International variations and trends in testicular cancer incidence and mortality. Eur. Urol. 2014, 65, 1095–1106. [Google Scholar] [CrossRef] [PubMed]
- Shanmugalingam, T.; Soultati, A.; Chowdhury, S.; Rudman, S.; Van Hemelrijck, M. Global incidence and outcome of testicular cancer. Clin. Epidemiol. 2013, 5, 417–427. [Google Scholar] [CrossRef] [PubMed]
- Toledano, M.B.; Jarup, L.; Best, N.; Wakefield, J.; Elliott, P. Spatial variation and temporal trends of testicular cancer in Great Britain. Br. J. Cancer 2001, 84, 1482–1487. [Google Scholar] [CrossRef]
- Le Cornet, C.; Lortet-Tieulent, J.; Forman, D.; Beranger, R.; Flechon, A.; Fervers, B.; Schuz, J.; Bray, F. Testicular cancer incidence to rise by 25% by 2025 in Europe? Model-based predictions in 40 countries using population-based registry data. Eur. J. Cancer 2014, 50, 831–839. [Google Scholar] [CrossRef]
- Hanna, N.H.; Einhorn, L.H. Testicular cancer—Discoveries and updates. N. Engl. J. Med. 2014, 371, 2005–2016. [Google Scholar] [CrossRef]
- Trama, A.; Foschi, R.; Larranaga, N.; Sant, M.; Fuentes-Raspall, R.; Serraino, D.; Tavilla, A.; Van Eycken, L.; Nicolai, N. Survival of male genital cancers (prostate, testis and penis) in Europe 1999–2007: Results from the EUROCARE-5 study. Eur. J. Cancer 2015, 51, 2206–2216. [Google Scholar] [CrossRef]
- Richiardi, L.; Vizzini, L.; Pastore, G.; Segnan, N.; Gillio-Tos, A.; Fiano, V.; Grasso, C.; Ciuffreda, L.; Lista, P.; Pearce, N.; et al. Lifetime growth and risk of testicular cancer. Int. J. Cancer 2014, 135, 695–701. [Google Scholar] [CrossRef]
- Rosen, A.; Jayram, G.; Drazer, M.; Eggener, S.E. Global trends in testicular cancer incidence and mortality. Eur. Urol. 2011, 60, 374–379. [Google Scholar] [CrossRef]
- Fossa, S.D.; Cvancarova, M.; Chen, L.; Allan, A.L.; Oldenburg, J.; Peterson, D.R.; Travis, L.B. Adverse prognostic factors for testicular cancer-specific survival: A population-based study of 27,948 patients. J. Clin. Oncol. Off. J. Am. Soc. Clin. Oncol. 2011, 29, 963–970. [Google Scholar] [CrossRef]
- Sui, W.; Morrow, D.C.; Bermejo, C.E.; Hellenthal, N.J. Trends in Testicular Cancer Survival: A Large Population-based Analysis. Urology 2015, 85, 1394–1398. [Google Scholar] [CrossRef]
- Chalya, P.L.; Simbila, S.; Rambau, P.F. Ten-year experience with testicular cancer at a tertiary care hospital in a resource-limited setting: A single centre experience in Tanzania. World J. Surg. Oncol. 2014, 12, 356. [Google Scholar] [CrossRef] [PubMed]
- Hebert, J.R.; Daguise, V.G.; Hurley, D.M.; Wilkerson, R.C.; Mosley, C.M.; Adams, S.A.; Puett, R.; Burch, J.B.; Steck, S.E.; Bolick-Aldrich, S.W. Mapping cancer mortality-to-incidence ratios to illustrate racial and sex disparities in a high-risk population. Cancer 2009, 115, 2539–2552. [Google Scholar] [CrossRef] [PubMed]
- Richardson, L.C.; Neri, A.J.; Tai, E.; Glenn, J.D. Testicular cancer: A narrative review of the role of socioeconomic position from risk to survivorship. Urol. Oncol. 2012, 30, 95–101. [Google Scholar] [CrossRef] [PubMed]
- Tandon, A.; Murray, C.J.; Lauer, J.A.; Evans, D.B. Measuring Overall Health System Performance for 191 Countries; World Health Organization: Geneva, Switzerland, 2000. [Google Scholar]
- Nur, U.; Rachet, B.; Parmar, M.K.; Sydes, M.R.; Cooper, N.; Stenning, S.; Read, G.; Oliver, T.; Mason, M.; Coleman, M.P. Socio-economic inequalities in testicular cancer survival within two clinical studies. Cancer Epidemiol. 2012, 36, 217–221. [Google Scholar] [CrossRef] [PubMed]
- Chen, S.L.; Wang, S.C.; Ho, C.J.; Kao, Y.L.; Hsieh, T.Y.; Chen, W.J.; Chen, C.J.; Wu, P.R.; Ko, J.L.; Lee, H.; et al. Prostate Cancer Mortality-To-Incidence Ratios Are Associated with Cancer Care Disparities in 35 Countries. Sci. Rep. 2017, 7, 40003. [Google Scholar] [CrossRef] [PubMed]
- Wang, S.C.; Sung, W.W.; Kao, Y.L.; Hsieh, T.Y.; Chen, W.J.; Chen, S.L.; Chang, H.R. The gender difference and mortality-to-incidence ratio relate to health care disparities in bladder cancer: National estimates from 33 countries. Sci. Rep. 2017, 7, 4360. [Google Scholar] [CrossRef]
- Sunkara, V.; Hebert, J.R. The colorectal cancer mortality-to-incidence ratio as an indicator of global cancer screening and care. Cancer 2015, 121, 1563–1569. [Google Scholar] [CrossRef]
- Wang, C.C.; Tsai, M.C.; Peng, C.M.; Lee, H.L.; Chen, H.Y.; Yang, T.W.; Sung, W.W.; Lin, C.C. Favorable liver cancer mortality-to-incidence ratios of countries with high health expenditure. Eur. J. Gastroenterol. Hepatol. 2017, 29, 1397–1401. [Google Scholar] [CrossRef]
- Tsai, M.C.; Wang, C.C.; Lee, H.L.; Peng, C.M.; Yang, T.W.; Chen, H.Y.; Sung, W.W.; Lin, C.C. Health disparities are associated with gastric cancer mortality-to-incidence ratios in 57 countries. World J. Gastroenterol. 2017, 23, 7881–7887. [Google Scholar] [CrossRef]
- Huang, C.Y.; Au, K.K.; Chen, S.L.; Wang, S.C.; Liao, C.Y.; Hsu, H.H.; Sung, W.W.; Wang, Y.C. Unfavorable Mortality-To-Incidence Ratio of Lung Cancer Is Associated with Health Care Disparity. Int. J. Environ. Res. Public Health 2018, 15, 2889. [Google Scholar] [CrossRef]
- Znaor, A.; Lortet-Tieulent, J.; Laversanne, M.; Jemal, A.; Bray, F. International testicular cancer incidence trends: Generational transitions in 38 countries 1900–1990. Cancer Causes Control 2015, 26, 151–158. [Google Scholar] [CrossRef] [PubMed]
- Roy, R.K.; Casson, K. Attitudes Toward Testicular Cancer and Self-Examination Among Northern Irish Males. Am. J. Men’s Health 2017, 11, 253–261. [Google Scholar] [CrossRef]
- Tal, R.; Holland, R.; Belenky, A.; Konichezky, M.; Baniel, J. Incidental testicular tumors in infertile men. Fertil. Steril. 2004, 82, 469–471. [Google Scholar] [CrossRef] [PubMed]
- Ellis, L.; Belot, A.; Rachet, B.; Coleman, M.P. The Mortality-to-Incidence Ratio Is Not a Valid Proxy for Cancer Survival. J. Glob. Oncol. 2019, 5, 1–9. [Google Scholar] [CrossRef] [PubMed]
© 2019 by the authors. Licensee MDPI, Basel, Switzerland. This article is an open access article distributed under the terms and conditions of the Creative Commons Attribution (CC BY) license (http://creativecommons.org/licenses/by/4.0/).

