Analysis of Well-Being and Anxiety among University Students

 ,
,  , , , , , , ,
  , ,
, ,
Abstract
:1. Introduction
2. Materials and Methods
3. Analysis and Presentation of Results
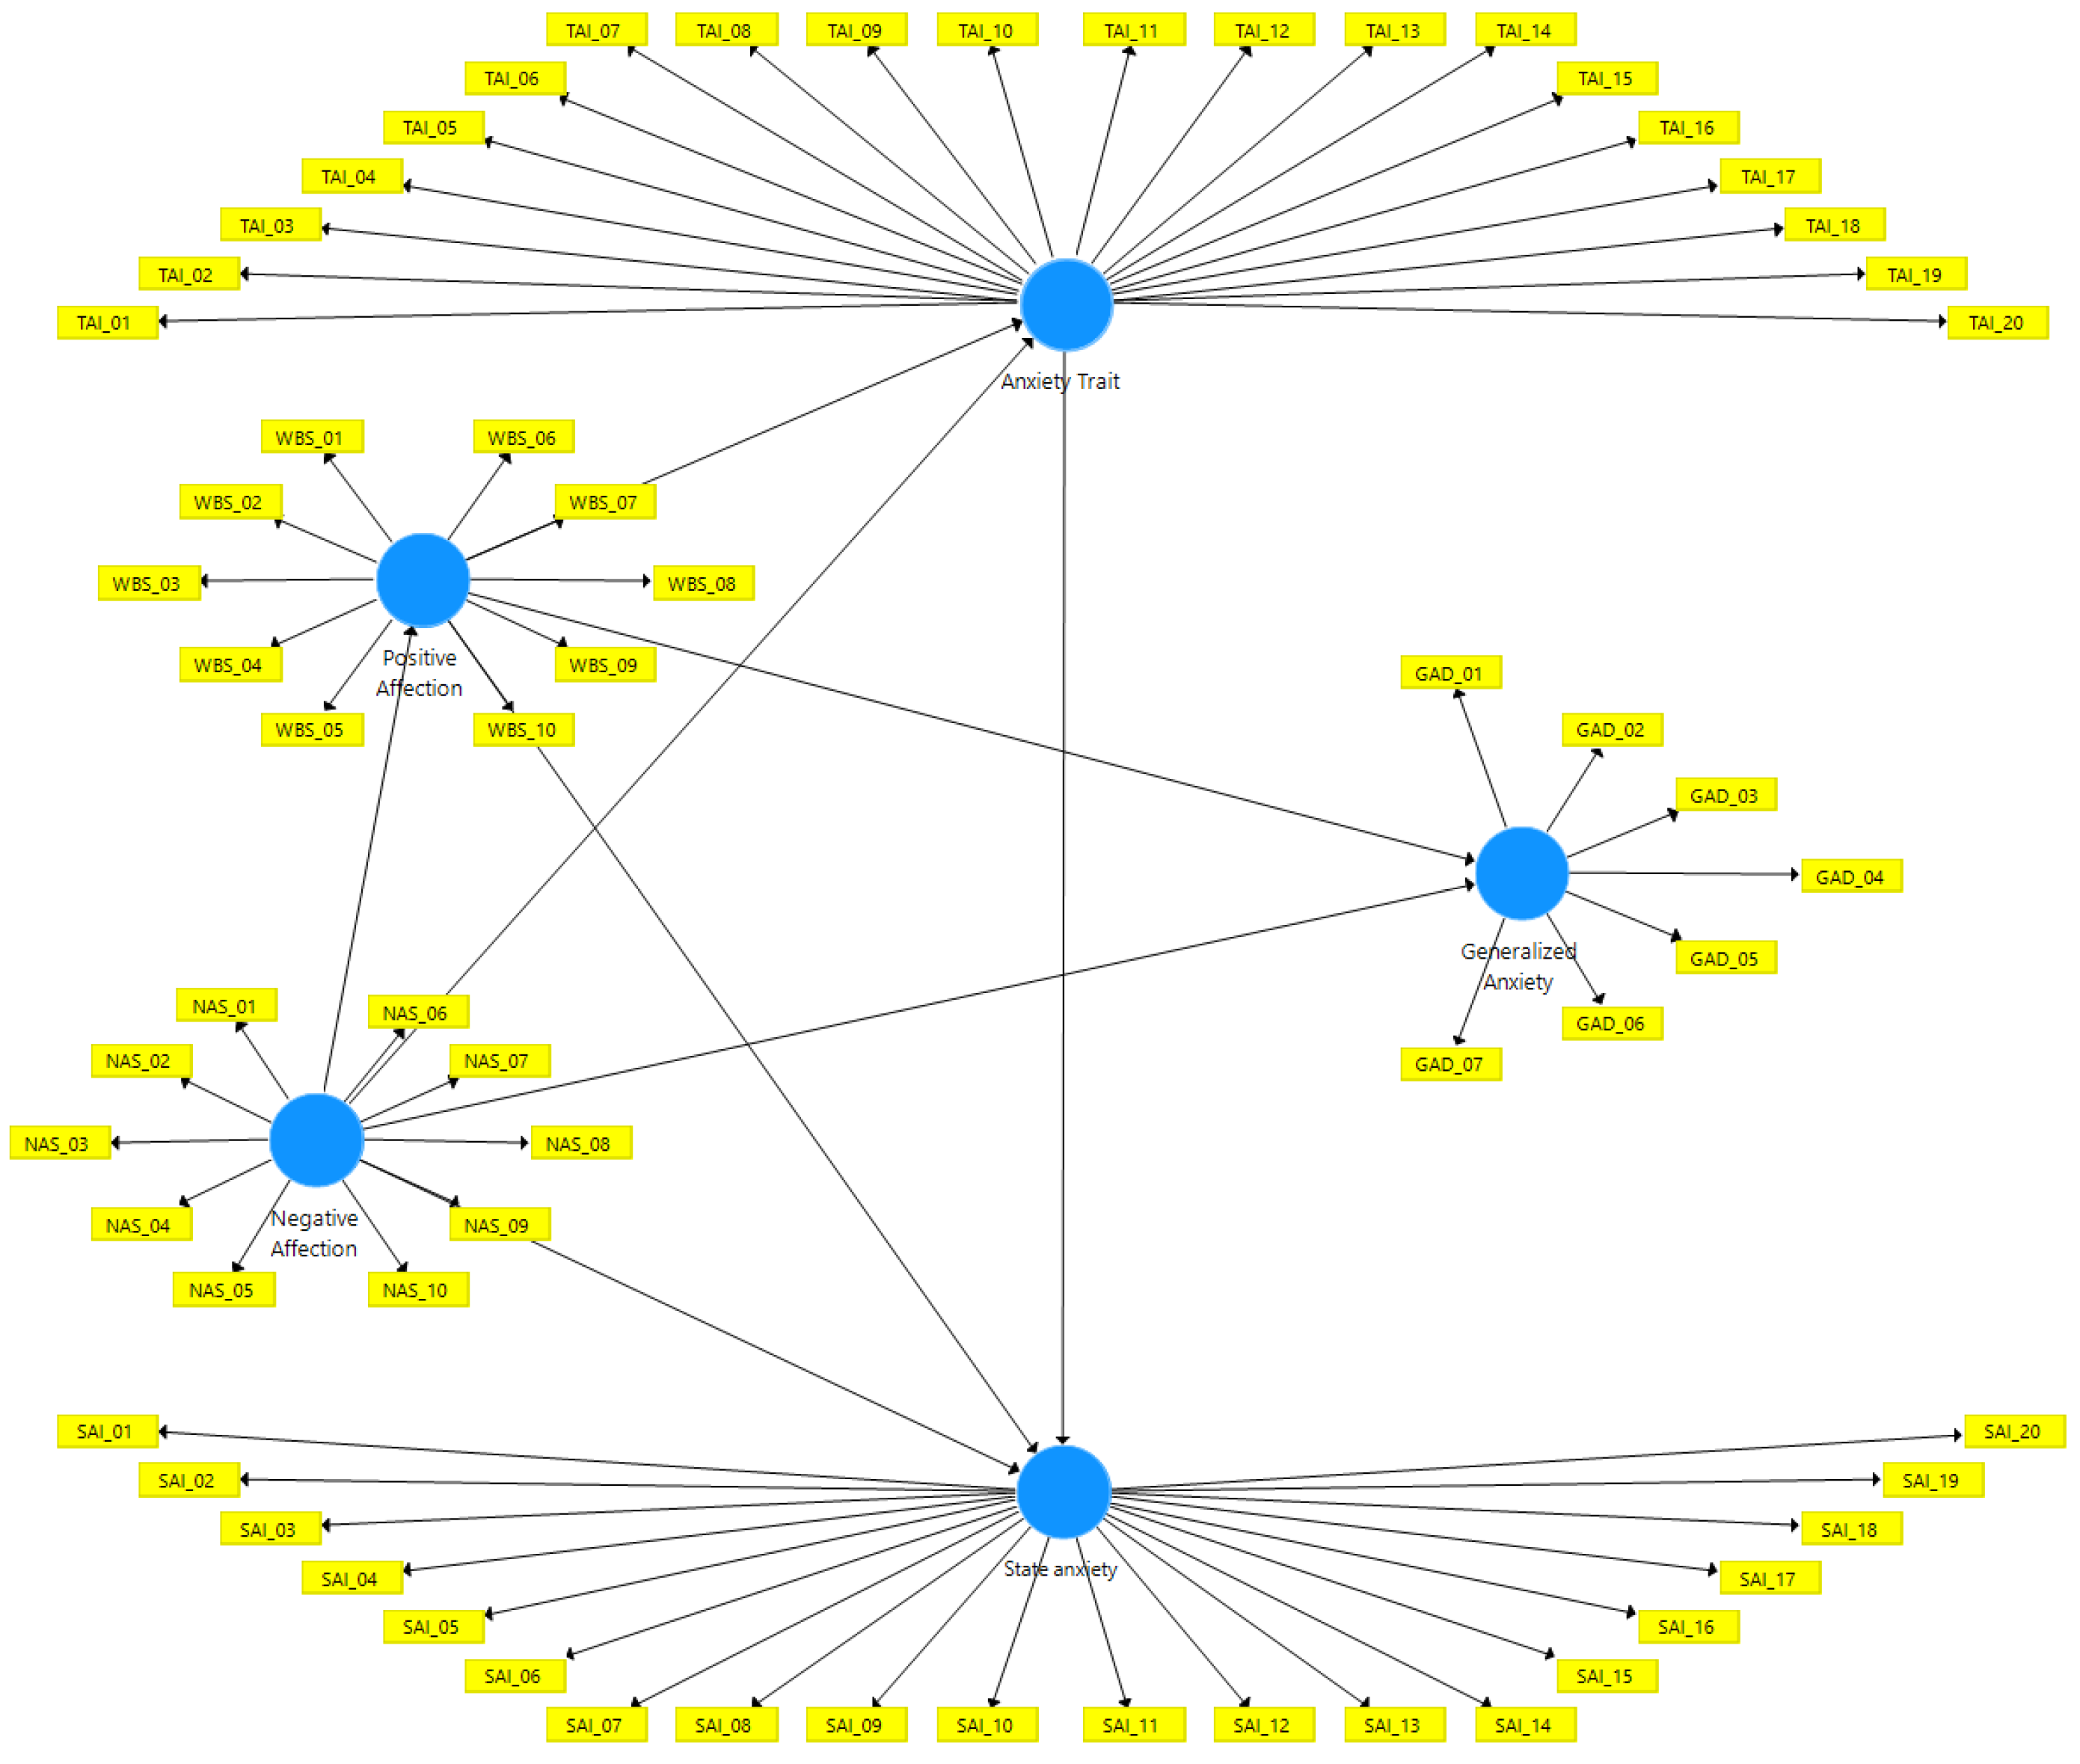
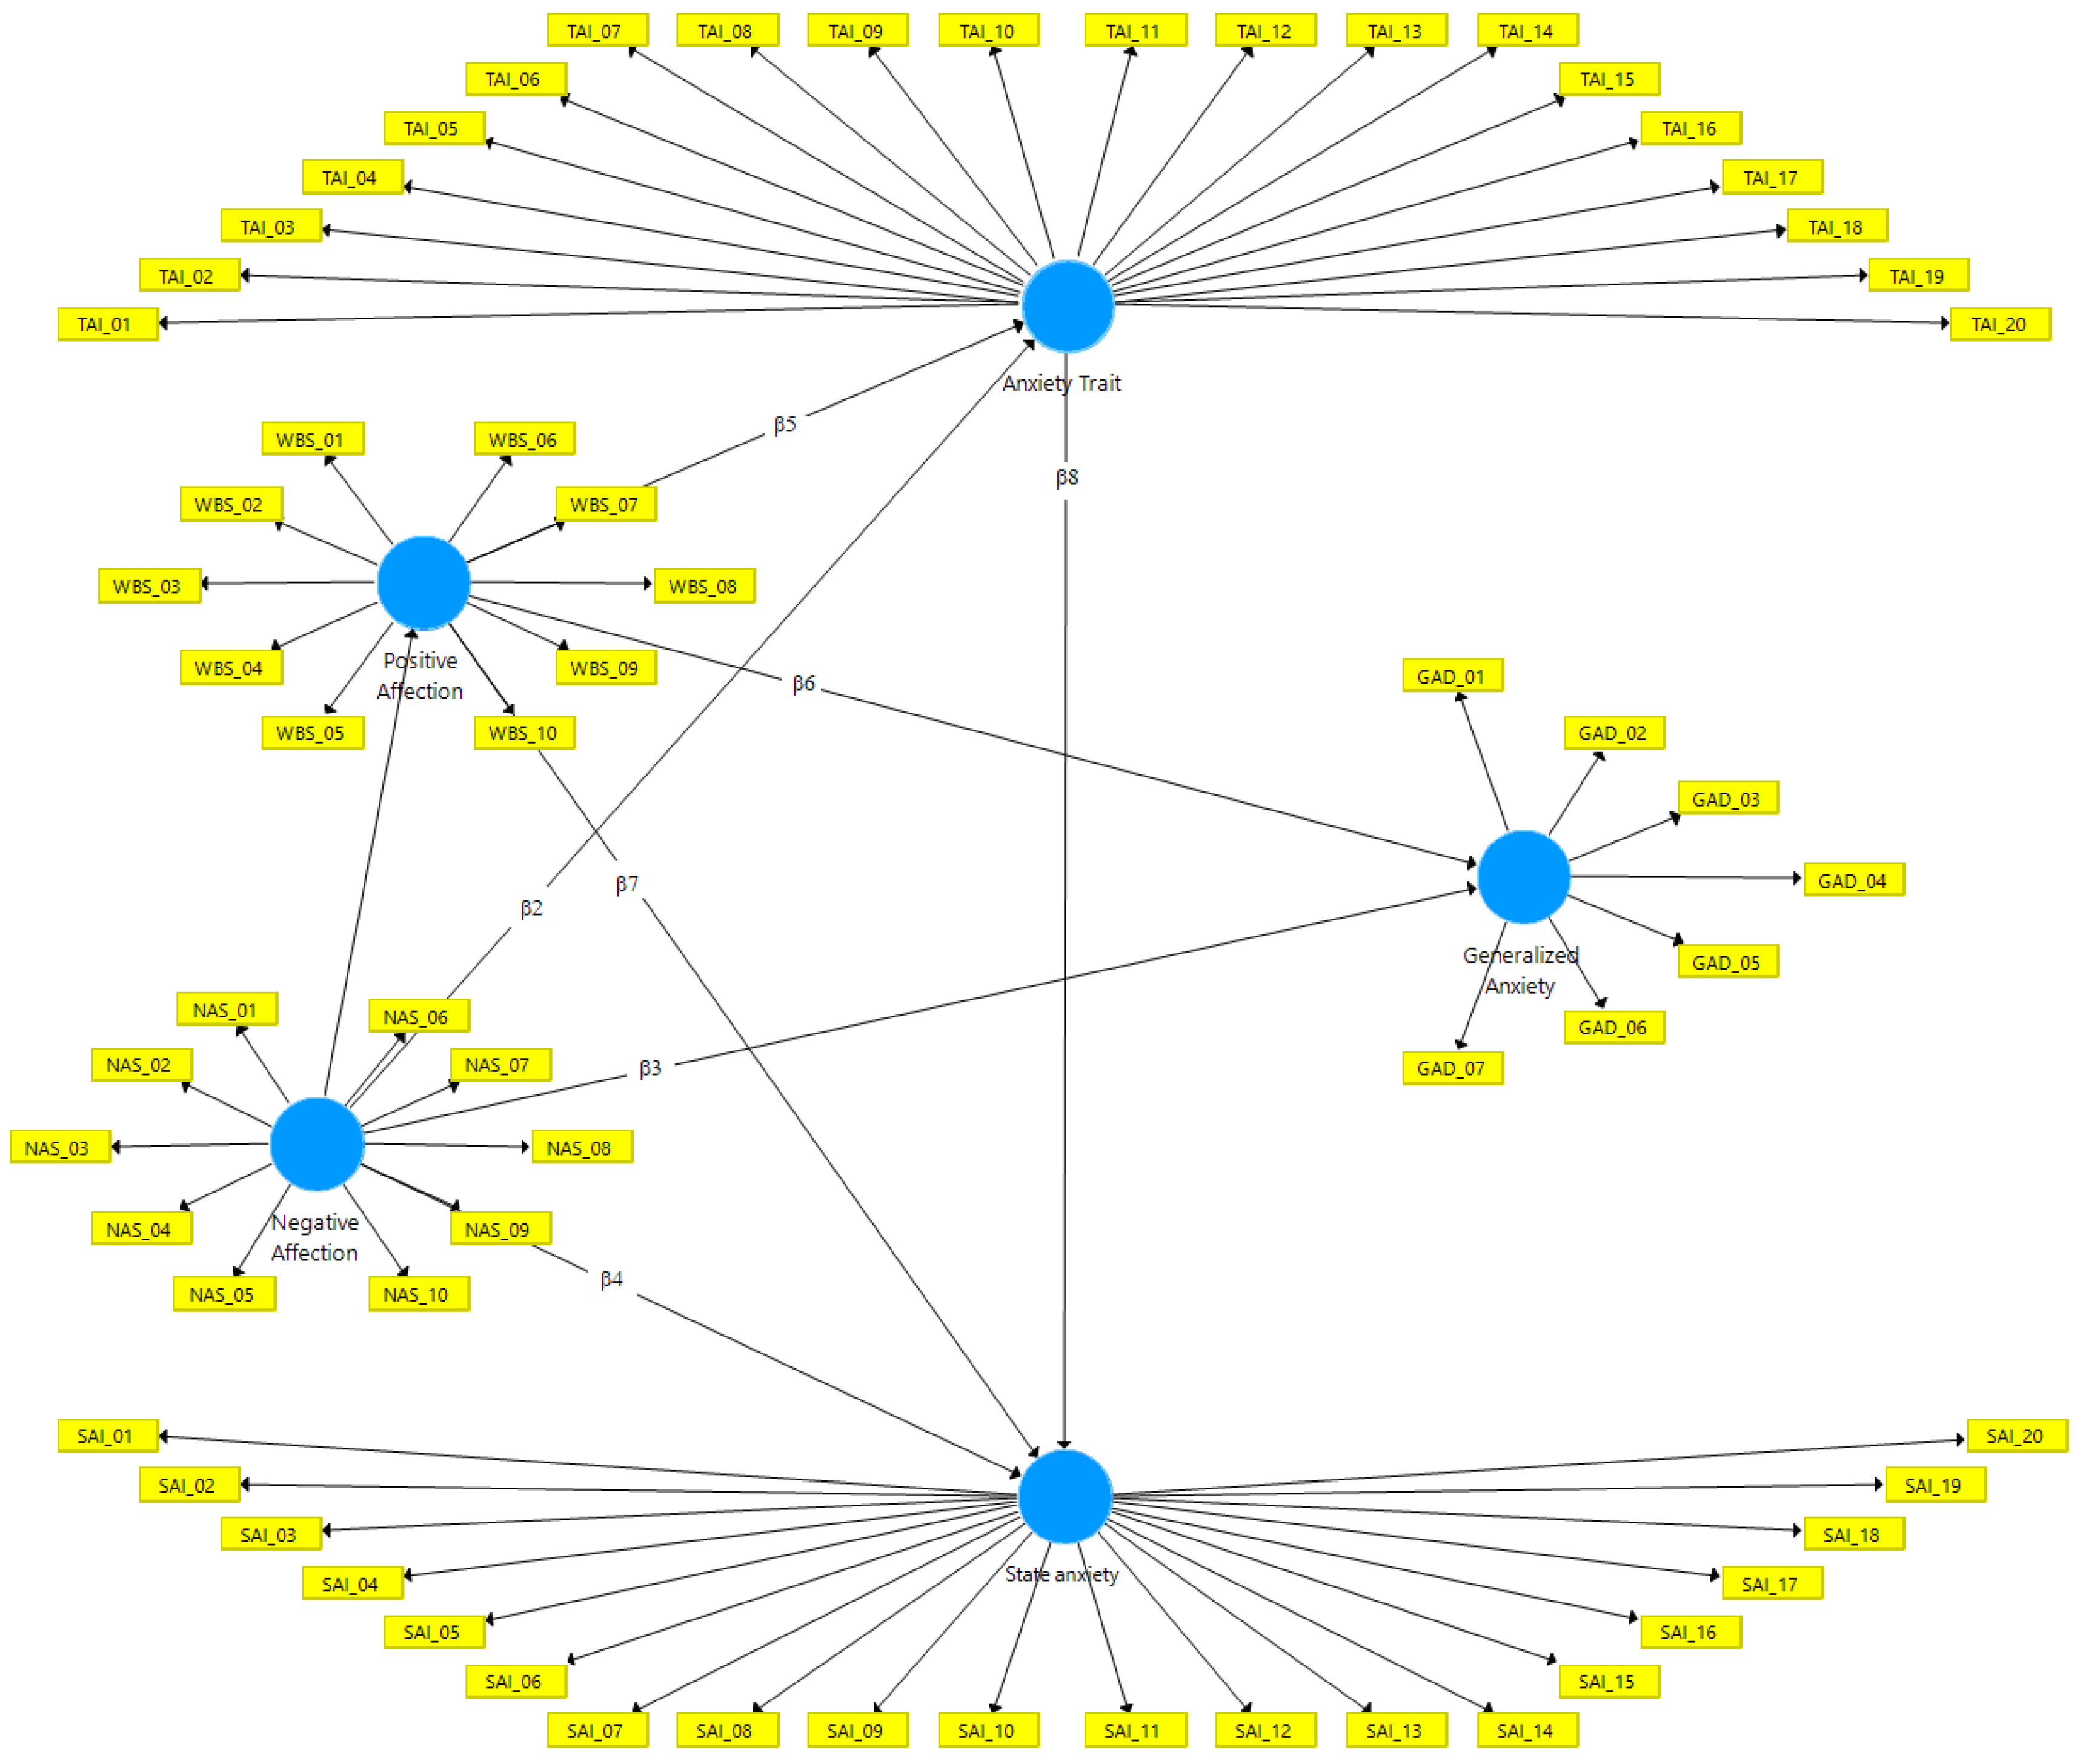
3.1. Structural Model Specification
3.2. Specification of the Measurement Model
3.3. Presentation of Data
3.4. PLS Path-Model Estimation
3.5. Evaluation of the Measurement Model
3.5.1. Internal Consistency and Composite Reliability
3.5.2. Convergent Validity
3.6. Evaluation of the Structural Model
3.6.1. Collinearity Assessment
3.6.2. Evaluation of the Coefficient of Determination (R2 Value (p-Value))
3.6.3. Evaluation of the f2 Effect
3.6.4. Blindfolding Assessment and Predictive Relevance (Q2)
3.7. Interpretation of Results and Final Considerations
4. Conclusions
4.1. Theoretical Implications
4.2. Practical/Managerial Implications
Author Contributions
Funding
Acknowledgments
Conflicts of Interest
Ethics Approval and Consent to Participate
References
- Bártolo, A.; Monteiro, S.; Pereira, A. Factor structure and construct validity of the Generalized Anxiety Disorder 7-item (GAD-7) among Portuguese college students. Cad. Saúde Pública 2017, 33, e00212716. [Google Scholar] [CrossRef] [PubMed] [Green Version]
- Paschoal, T.; Tamayo, A. Construção e validação da escala de bem-estar no trabalho. Avaliação Psicológica 2008, 7, 11–22. [Google Scholar]
- Bradburn, N.M. The Structure of Psychological Well-Being; Aldine: Oxford, UK, 1969. [Google Scholar]
- Andrews, F.M.; Withey, S.B. Social Indicators of Well-Being: America’s Perception of Life Quality; Plenum: New York, NY, USA, 1976. [Google Scholar]
- Campbell, A.; Converse, P.E.; Rodgers, W.L. The Quality of American Life. Perceptions, Evaluations; Sage Foundation: New York, NY, USA, 1976. [Google Scholar]
- Ryan, R.M.; Deci, E.L. On happiness and human potentials: A review of research on hedonic and eudaimonic well being. Annu. Rev. Psychol. 2001, 52, 141–166. [Google Scholar] [CrossRef] [PubMed]
- Silva, A.J.; Caetano, A. Validation of the Flourishing Scale and Scale of Positive and Negative Experience in Portugal. Soc. Indic. Res. 2013, 110, 469–478. [Google Scholar] [CrossRef]
- Diener, E.; Oishi, S.; Lucas, R.E. Personality, culture and subjective well-being: Emotional and cognitive evaluations of life. Annu. Rev. Psychol. 2003, 54, 403–425. [Google Scholar] [CrossRef]
- Watson, D.; Clarck, L.A.; Tellegen, A. Development and validation of brief measures of positive and negative affect: The PANAS Scales. J. Personal. Soc. Psychol. 1988, 54, 1063–1070. [Google Scholar] [CrossRef]
- Diener, E.; Suh, M.E. Subjective well-being and age: An international analysis. In Annual Review of Gerontology and Geriatrics; Schaiek, K.W., Lawton, M.P., Eds.; Springer: New York, NY, USA, 1998; Volume 17, pp. 304–324. [Google Scholar]
- Argyle, M. Causes and Correlates of Happiness. In Well-Being: The Foundations of Hedonic Psychology; Kahneman, D., Diener, E., Schwarz, N., Eds.; Russell Sage Foundation: New York, NY, USA, 1999; pp. 353–373. [Google Scholar]
- Diener, E. Subjective well being. Psychol. Bull. 1984, 95, 542–575. [Google Scholar] [CrossRef]
- Lucas, R.E.; Diener, E.; Suh, E. Discriminant validity of well-being measures. J. Personal. Soc. Psychol. 1996, 71, 616–628. [Google Scholar] [CrossRef]
- Schotanus-Dijkstra, M.; Pieterse, M.E.; Drossaert, C.H.; Westerhof, G.J.; De Graaf, R.; Ten Have, M.; Walburg, J.A.; Bohlmeijer, E.T. What Factors are Associated with Flourishing? Results from a Large Representative National Sample. J. Happiness Stud. 2016, 17, 1351–1370. [Google Scholar] [CrossRef] [Green Version]
- Waterman, A.S. Two Conceptions of Happiness: Contrasts of Personal Expressiveness (Eudaimonia) and Hedonic Enjoyment. J. Personal. Soc. Psychol. 1993, 64, 678–691. [Google Scholar] [CrossRef]
- Ryff, C.D. Happiness is everything, or is it? Explorations on the meaning of psychological well-being. J. Personal. Soc. Psychol. 1989, 57, 1069–1081. [Google Scholar] [CrossRef]
- Giannetti, E. Felicidade: Diálogos Sobre o Bem-Estar na Civilização; Companhia das Letras: São Paulo, Brazil, 2002. [Google Scholar]
- Keyes, C.L.M. The mental health continuum: From languishing to flourishing in life. J. Health Soc. Behav. 2002, 43, 207–222. [Google Scholar] [CrossRef] [PubMed] [Green Version]
- Ryan, R.M.; Huta, V.; Deci, E.L. Living well: A self-determination theory perspective on eudaimonia. J. Happiness Stud. 2008, 9, 139–170. [Google Scholar] [CrossRef]
- Schotanus-Dijkstra, M.; Tem Klooster, P.M.; Drossaert, C.H.C.; Pieterse, M.E.; Bolier, L.; Walburg, J.A.; Bohlmeijer, E.T. Validation of the Flourishing Scale in a sample of people with suboptimal levels of mental well-being. BMC Psychol. 2016, 4, 12. [Google Scholar] [CrossRef] [PubMed] [Green Version]
- Su, R.; Tay, L.; Dienifer, E. The development and validation of comprehensive inventory of thriving (CIT) and brief inventory of thriving (BIT). Appl. Psychol. Health Well Being 2014, 6, 251–279. [Google Scholar] [CrossRef] [PubMed]
- Seligman, M.E.P. Florescer: Uma Nova Compreensão Sobre a Natureza da Felicidade e do Bem-Estar; Objetiva: Rio de Janeiro, Brazil, 2011. [Google Scholar]
- Henderson, L.W.; Knight, T. Integrating the Hedonic and Eudemonic Perspectives to More Comprehensively Understand Wellbeing and Pathways to Wellbeing. Int. J. Wellbeing 2012, 2, 196–221. [Google Scholar] [CrossRef] [Green Version]
- King, L.A.; Napa, C.K. What makes a life good? J. Personal. Soc. Psychol. 1998, 75, 156–165. [Google Scholar] [CrossRef]
- McGregor, I.; Little, B.R. Personal projects, happiness, and meaning: On doing well and being yourself. J. Personal. Soc. Psychol. 1998, 74, 494–512. [Google Scholar] [CrossRef]
- Ryan, R.M.; Deci, E.L. A self-determination theory approach to psychotherapy: The motivational basis for effective change. Can. Psychol. 2008, 49, 186–193. [Google Scholar] [CrossRef] [Green Version]
- Allen, A.J.; Leonard, H.; Swedo, S.E. Current knowledge of medications for the treatment of childhood anxiety disorders. J. Am. Acad. Child Adolesc. Psychiatry 1995, 34, 976–986. [Google Scholar] [CrossRef]
- Organização Mundial da Saúde (OMS). CID-11–Classificação Internacional de Doenças, Décima Primeira Versão; Organização Mundial da Saúde: Genebra, Switzerland, 2018. [Google Scholar]
- Spielberger, C.D.; Gorsuch, R.L.; Lushene, R.E. Manual for the State-Trait Anxiety Inventory; Consulting Psychologist Press: Palo Alto, CA, USA, 1970. [Google Scholar]
- Souza, L.D.M. Transtorno de Ansiedade Generalizada em Jovens de 18 a 24 Anos–Prevalência, Fatores Associados, Comorbidades e Impacto na Qualidade de Vida. Porto Alegre. Ph.D. Thesis, Universidade Católica do Rio Grande do Sul, Porto Alegre, Brazil, 2010. [Google Scholar]
- Ladouceur, R.; Léger, É.; Dugas, M.; Freeston, M.H. Cognitive behavioral treatment of Generalized Anxiety Disorder (GAD) for older adults. Int. Psychogeriatr. 2004, 16, 195–207. [Google Scholar] [CrossRef]
- Fava, D.C.; Kristensen, C.H.; Melo, W.V.; Araujo, L.B. Construção e validação de tarefa de Stroop Emocional para avaliação de viés de atenção em mulheres com Transtorno de Ansiedade Generalizada. Paidéia 2009, 19, 159–165. [Google Scholar] [CrossRef] [Green Version]
- Castilloa, A.R.G.L.; Recondob, R.; Asbahrc, F.R.; Manfrod, G.G. Transtornos de ansiedade. Rev. Bras. Psiquiatr. 2000, 22, 20–23. [Google Scholar] [CrossRef] [Green Version]
- Costa, K.M.V.C.; Sousa, K.R.S.S.; Formiga, P.A.; Silva, W.S.; Bezerra, E.B.N. Ansiedade em Universitários na Área da Saúde. In Proceedings of the II Congresso Brasileiro das Ciências da Saúde, Campina Grande, Brazil, 2–16 June 2017. [Google Scholar]
- Mariondo, M.; Palma, P.; Medrano, L.A.; Murillo, P. Adaptación de la Escala de Afectividad Positiva y Negativa (PANAS) a la población de adultos de la ciudad de Córdoba: Análisis psicométricos preliminares. Univ. Psychol. 2011, 11, 187–196. [Google Scholar] [CrossRef] [Green Version]
- Spitzer, R.L.; Kroenke, K.; Williams, J.B.W.; Löwe, B. A brief measure for assessing generalized anxiety disorder: The GAD-7. Arch. Intern. Med. 2006, 166, 1092–1097. [Google Scholar] [CrossRef] [PubMed] [Green Version]
- García-Campayo, J.; Zamorano, E.; Ruiz, M.A.; Pardo, A.; Pérez-Páramo, M.; López-Gómez, V.; Freire, V.O.; Rejas, J. Cultural adaptation into Spanish of the generalized anxiety disorder-7 (GAD-7) scale as a scrrening tool. Heath Qual. Life Outcomes 2010, 8, 8. [Google Scholar] [CrossRef] [PubMed] [Green Version]
- Biaggio, A.M.B.; Natalicio, L. Manual Para o Inventário de Ansiedade Traço-Estado (IDATE); Centro Editor de Psicologia Aplicada-CEPA: Rio de Janeiro, Brazil, 1979. [Google Scholar]
- Fonseca, P.B.; Sepúlveda, A.G. Adaptación y Validación del Inventario Ansiedad Estado-Rasgo (STAI) en Población Universitaria de la Provincia de Nuble. Ph.D. Thesis, Universidad del Bío-Bío, Chillán, Chile, 2013. [Google Scholar]
- Hair, J.F., Jr.; Hult, G.T.M.; Ringle, C.; Sarstedt, M. A Primer on Partial Least Squares Structural Equation Modeling (PLS-SEM); Sage publications: Los Angeles, CA, USA, 2017. [Google Scholar]
- Kroenke, K.; Spitzer, R.L.; Williams, J.B.W.; Monahan, P.O.; Löwe, B. Anxiety disorders in primary care: Prevalence, impairment, comorbidity, and detection. Ann. Intern. Med. 2007, 146, 317–325. [Google Scholar] [CrossRef]
- Lopes, L.F.D. Métodos Quantitativos Aplicados ao Comportamento Organizacional; Voix: Santa Maria, CA, USA, 2018. [Google Scholar]
- Porto, A. Áreas da Vida no Trabalho Como Preditoras da síndrome de Burnout: Tradução, Adaptação Transcultural e Validação do Modelo AWS-MBIGS. Ph.D. Thesis, Universidade Federal de Santa Maria, Santa Maria, CA, USA, 2019. [Google Scholar]
- Ringle, C.M.; Wende, S.; Becker, J.M. SmartPLS 3; SmartPLS: Bönningstedt, Germany, 2015. [Google Scholar]
- Diener, E.; Emmons, R.A. The independence of positive and negative affect. J. Personal. Soc. Psychol. 1995, 47, 1105–1117. [Google Scholar] [CrossRef]
- Zanon, C.; Hutz, C.S. Relações entre bem-estar subjetivo, neuroticismo, ruminação, reflexão e sexo. Gerais Rev. Interinstitucional Psicol. 2009, 2, 118–127. [Google Scholar]
- Menezes, A.K.S.M.; Moura, L.F.; Mafra, V.R. Transtorno de ansiedade generalizada: Uma revisão da literatura e dados epidemiológicos. Rev. Amaz. Sci. Health 2017, 5, 42–49. [Google Scholar]
- Santos, M.D.L.; Galdeano, L.E. Traço e estado de ansiedade de estudantes de enfermagem na realização de uma prova prática. Rev. Min. Enferm. 2009, 13, 76–83. [Google Scholar]
- Fornell, C.; Larcker, D.F. Evaluating structural equation models with unobservable variables and measurement error. J. Mark. Res. 1981, 18, 39–50. [Google Scholar] [CrossRef]
- Chin, W.W. The partial least squares approach for structural equation modeling. In Modern Methods for Business Research; Marcoulides, G.A., Ed.; Lawrence Erlbaum Associates: London, UK, 1998; pp. 236–295. [Google Scholar]
- Henseler, J.; Ringle, C.M.; Sarstedt, M. A new criterion for assessing discriminant validity in variance-based structural equation modeling. J. Acad. Mark. Sci. 2015, 43, 115–135. [Google Scholar] [CrossRef] [Green Version]
- Cohen, J. Statistical Power Analysis for the Behavioral Sciences, 2nd ed.; Psychology Press: New York, NY, USA, 1988. [Google Scholar]
- Ringle, C.M.; Silva, D.; Bido, D.S. Modelagem de equações estruturais com utilização do SmartPLS. Rev. Bras. Mark. 2014, 13, 56–73. [Google Scholar] [CrossRef]
- Hair, J.F.; Celsi, M.W.; Ortinau, D.J.; Bush, R.P. Fundamentos de Pesquisa de Marketing; AMGH Editora: Porto Alegre, Brazil, 2014. [Google Scholar]
- Andriyani, A.; Himma, A.D.; Alizar, S.A.; Amin, Z.N.; Mulawarman. The Relationship of Anxiety, School Burnout and Well-Being in High School Students. Adv. Soc. Sci. Educ. Humanit. Res. 2017, 158, 130–135. [Google Scholar]
- Areba, E.M.; Duckett, L.; Robertson, C. Religious Coping, Symptoms of Depression and Anxiety, and Well-Being among Somali College Students. J. Relig. Health 2018, 57, 94–109. [Google Scholar] [CrossRef] [PubMed] [Green Version]
- Lew, B.; Huen, J.; Yu, P.; Yuan, L.; Wang, D.-F.; Ping, F.; Talib, M.A.; Lester, D.; Jia, C.-X. Associations between depression, anxiety, stress, hopelessness, subjective well-being, coping styles and suicide in Chinese university students. PLoS ONE 2019, 14, 1–10. [Google Scholar] [CrossRef]
- Machado, L.; Souza, C.T.N.; Nunes, R.O.; Santana, C.N.; Araújo, C.F.; Cantilino, A. Subjective well-being, religiosity and anxiety: A cross-sectional study applied to a sample of Brazilian medical students. Trends Psychiatry Psychother. 2018, 40, 185–192. [Google Scholar] [CrossRef] [Green Version]
- Silva, E.C.; Heleno, M.G.V. Qualidade de Vida e Bem-Estar Subjetivo de Estudantes Universitários. Rev. Psicol. Saúde 2012, 4, 69–76. [Google Scholar]
- Cunha, M.; Duarte, J.; André, S.; Sequeira, C.; Castro-Molina, F.-J.; Mota, M.; Pina, F.; Coelho, M.; Cunha, A.; Figueiredo, A.; et al. Bem-estar em estudantes do ensino superior. Rev. Millenium. 2017, 2, 21–38. [Google Scholar]
- Chaves, E.C.L.; Iunes, D.H.; Moura, C.C.; Carvalho, L.C.; Silva, A.M.; Carvalho, E.C. Anxiety and spirituality in university students: A cross-sectional study. Rev. Bras. Enferm. 2015, 68, 444–449. [Google Scholar]
- Gama, M.M.A.; Moura, G.S.; Araújo, R.F.; Teixeira-Silva, F. Ansiedade-traço em estudantes universitários de Aracajú (SE). Rev. Psiquiatr. Rio Gd. Sul 2008, 30, 19–24. [Google Scholar] [CrossRef]
- Almeida, J.S.P. A Saúde Mental Global, a Depressão, a Ansiedade e os Comportamentos de Risco nos Estudantes do Ensino Superior: Estudo de Prevalência e Correlação. Ph.D. Thesis, Faculdade de Ciências Médicas, Universidade Nova, Lisboa, Portugal, 2014. [Google Scholar]
- Reis, C.F.; Miranda, G.J.; Freitas, S.C. Ansiedade e Desempenho Acadêmico: Um estudo com alunos de Ciências Contábeis. Adv. Sci. Appl. Account. 2017, 10, 319–333. [Google Scholar]


| Score of the Original Instrument | Proposed Score (Ssi) | Classification |
|---|---|---|
| PANAS * | ||
| Positive Affection (PA) | 0 to 33.33 | Low |
| Negative Affection (NA) | High | |
| Positive and Negative Affection | 33.34 to 66.67 | Moderate |
| Positive Affection (PA) | 66.68 to 100.00 | High |
| Negative Affection (NA) | Low | |
| Subjective well-being ** | −40.00 to −15.00 | Low |
| −15.01 to 15.00 | Moderate | |
| 15.01 to 40.00 | High | |
| GAD-7 | ||
| 1 to 4 | 0.00 to 15.00 | Normal |
| 5 to 9 | 15.01 to 45.00 | Slight |
| 10 to 14 | 45.01 to 70.00 | Moderate |
| 15 to 21 | 70.01 to 100.00 | Severe |
| IDATE | ||
| 20 to 38 | 0.00 to 30.00 | Depression |
| 39 to 42 | 30.01 to 37.00 | Normal |
| 43 to 80 | 37.01 to 100.00 | Anxiety |
| Hypothesis | Definition |
|---|---|
| H1 | Negative affect directly and negatively influences positive affect. According to Diener and Emmons [45] the relationship between positive and negative affect differs according to the response time, in which the negative relationship is stronger when the reporting of emotions refers to shorter periods than with greater intensities. |
| H2 | Negative affect directly and positively influences anxiety: H2a: Negative affect directly and positively influences trait anxiety; H2b: Negative affect directly and positively influences generalized anxiety; H2c: Negative affect directly and positively influences state anxiety. According to Zanon and Hutz [46] the relationship between negative affect and anxiety is positive, since anguish, dissatisfaction, guilt and fear are closely related to danger, threats and daily concerns. |
| H3 | Positive affect directly and negatively influences anxiety; H3a: Positive affect directly and negatively influences trait anxiety; H3b: Positive affect directly and negatively influences generalized anxiety; H3c: Positive affect directly and negatively influences state anxiety. The relationship between positive affect and anxiety is reversed as enthusiasm, being excited, optimistic and in a good mood reflect the opposite of fear, dissatisfaction and daily concerns [46]. |
| H4 | According to Spielberg et al. [29] both types of anxiety (even if conceptualized differently, such as the state of anxiety and the trait of anxiety) differ as the first refers to a momentary, transient state, characterized by tension, apprehension and elevated autonomic nervous system activity, while the second relates to a person’s personality and refers to different reactions to situations perceived as threatening and an increased state of anxiety. Thus, people who have a pronounced anxiety trait tend to perceive a greater number of situations as dangerous or threatening and, consequently, to frequently respond to this increased state of anxiety. |
| Instrument | Latent Variables | Concepts |
|---|---|---|
| Positive and Negative Affect Schedule—PANAS | Positive Affection Scale (WBS) | Reflects how enthusiastic, active and alert a person is [9]. |
| Negative Affection Scale (NAS) | Reflects anguish and dissatisfaction, including a variety of aversive moods, including anger, guilt, heartbreak and fear. | |
| Generalized Anxiety Scale (Generalized Anxiety Disorder)—GAD-7 (GAD) | A state of exacerbated concern that can affect various activities or events in an individual’s life. With its symptoms (psychiatric and somatic), this can be considered a chronic and recurrent disorder [47]. | |
| State-Trait Anxiety Inventory Scale (STAI) | Trait Anxiety Inventory (STAI-T) (TAI) | People who have an anxiety trait tend to perceive a greater number of situations as dangerous or threatening and, consequently, to frequently respond with an increased state of anxiety [48]. |
| State Anxiety Inventory (STAI-E) (SAI) | Refers to a momentary, transient state, characterized by tension, apprehension and increased autonomic nervous system activity, depending on how a situation is perceived, with a heightened state of anxiety when the situation is perceived as threatening [48]. | |
| Endogenous Dimensions | = | Exogenous Dimensions | + | Error |
|---|---|---|---|---|
| WBS | = | β1 NAS | + | εWBS |
| TAI | = | β2 NAS + β5 WBS | + | εTAI |
| SAI | = | β4 NAS + β7 WBS + β8 TAI | + | εSAI |
| GAD | = | β3 NAS + β6 WBS | + | εGAD |
| Stage (e) Evaluation of the Measurement Model |
| - Cronbach’s alpha (α); - Composite reliability (ρc); - Average variance extracted (AVE); - Cross-factorial loads; - Fornell-Larcker criterion; - Heterotrait-monotrait ratio (HTMT) criteria, confirmed by the bootstrapping method. |
| Stage (f) Evaluation of the Structural Model |
| - Collinearity assessment (VIF); - Coefficient of determination (R2), confirmed by the bootstrapping method; - Effect size (f2), confirmed by the bootstrapping method; - Conformity of the hypotheses according to the Student’s t-test, determined by the bootstrapping method; - Predictive relevance (Q2), confirmed by the blindfolding method. |
| Dimensions | α | ρC | AVE |
|---|---|---|---|
| Negative Affection Scale (NAS) | 0.897 | 0.915 | 0.521 |
| Positive Affection Scale (WBS) | 0.875 | 0.899 | 0.502 |
| State Anxiety Inventory (SAI) | 0.902 | 0.920 | 0.535 |
| Generalized Anxiety (GAD) | 0.877 | 0.905 | 0.632 |
| Trait Anxiety Inventory (TAI) | 0.847 | 0.882 | 0.503 |
| Indicators | Dimensions | ||||
|---|---|---|---|---|---|
| NAS | WBS | SAI | GAD | TAI | |
| NAS_01 | 0.776 | −0.149 | 0.526 | 0.406 | 0.441 |
| NAS_02 | 0.763 | −0.167 | 0.502 | 0.397 | 0.416 |
| NAS_03 | 0.705 | −0.222 | 0.419 | 0.353 | 0.400 |
| NAS_04 | 0.678 | −0.189 | 0.417 | 0.327 | 0.386 |
| NAS_05 | 0.789 | −0.076 | 0.477 | 0.394 | 0.413 |
| NAS_06 | 0.600 | −0.152 | 0.364 | 0.295 | 0.318 |
| NAS_07 | 0.745 | −0.147 | 0.482 | 0.434 | 0.398 |
| NAS_08 | 0.645 | −0.200 | 0.386 | 0.368 | 0.425 |
| NAS_09 | 0.767 | −0.088 | 0.510 | 0.433 | 0.393 |
| NAS_10 | 0.730 | −0.101 | 0.479 | 0.392 | 0.409 |
| WBS_01 | −0.155 | 0.670 | −0.171 | −0.156 | −0.232 |
| WBS_03 | −0.240 | 0.756 | −0.272 | −0.215 | −0.281 |
| WBS_04 | −0.007 | 0.522 | −0.117 | −0.084 | −0.133 |
| WBS_05 | −0.217 | 0.838 | −0.238 | −0.186 | −0.315 |
| WBS_06 | −0.146 | 0.701 | −0.158 | −0.153 | −0.283 |
| WBS_07 | −0.042 | 0.691 | −0.115 | −0.031 | −0.198 |
| WBS_08 | −0.183 | 0.777 | −0.220 | −0.139 | −0.253 |
| WBS_09 | −0.099 | 0.729 | −0.189 | −0.131 | −0.267 |
| WBS_10 | −0.048 | 0.648 | −0.137 | −0.111 | −0.232 |
| SAI_01 | 0.365 | −0.263 | 0.690 | 0.475 | 0.605 |
| SAI_02 | 0.376 | −0.373 | 0.591 | 0.457 | 0.596 |
| SAI_04 | 0.501 | −0.113 | 0.783 | 0.558 | 0.561 |
| SAI_06 | 0.573 | −0.227 | 0.764 | 0.580 | 0.629 |
| SAI_07 | 0.465 | −0.168 | 0.737 | 0.532 | 0.575 |
| SAI_09 | 0.439 | −0.165 | 0.753 | 0.582 | 0.583 |
| SAI_12 | 0.545 | −0.151 | 0.798 | 0.579 | 0.611 |
| SAI_14 | 0.455 | −0.146 | 0.710 | 0.607 | 0.498 |
| SAI_17 | 0.511 | −0.203 | 0.793 | 0.539 | 0.606 |
| SAI_18 | 0.383 | −0.144 | 0.671 | 0.541 | 0.515 |
| GAD_01 | 0.422 | −0.116 | 0.626 | 0.794 | 0.535 |
| GAD_02 | 0.420 | −0.211 | 0.622 | 0.807 | 0.609 |
| GAD_03 | 0.367 | −0.131 | 0.527 | 0.753 | 0.465 |
| GAD_04 | 0.391 | −0.169 | 0.555 | 0.773 | 0.533 |
| GAD_05 | 0.268 | −0.088 | 0.443 | 0.641 | 0.368 |
| GAD_06 | 0.472 | −0.215 | 0.591 | 0.778 | 0.554 |
| GAD_07 | 0.427 | −0.125 | 0.570 | 0.758 | 0.535 |
| TAI_01 | 0.354 | −0.417 | 0.470 | 0.455 | 0.674 |
| TAI_03 | 0.419 | −0.120 | 0.564 | 0.587 | 0.658 |
| TAI_04 | 0.380 | −0.172 | 0.539 | 0.531 | 0.719 |
| TAI_08 | 0.471 | −0.232 | 0.608 | 0.478 | 0.726 |
| TAI_10 | 0.269 | −0.339 | 0.430 | 0.340 | 0.668 |
| TAI_15 | 0.478 | −0.221 | 0.609 | 0.507 | 0.783 |
| TAI_16 | 0.272 | −0.366 | 0.437 | 0.302 | 0.649 |
| TAI_20 | 0.386 | −0.170 | 0.685 | 0.553 | 0.672 |
| Dimensions | Pearson’s Correlation Matrix (F-L) | |||||
|---|---|---|---|---|---|---|
| NAS | WBS | SAI | GAD | TAI | ||
| NAS | 0.722 | 1.000 | ||||
| WBS | 0.709 | −0.204 | 1.000 | |||
| SAI | 0.731 | 0.636 | −0.267 | 1.000 | ||
| GAD | 0.795 | 0.529 | −0.204 | 0.725 | 1.000 | |
| TAI | 0.760 | 0.555 | −0.355 | 0.713 | 0.685 | 1.000 |
| HTMT | ||||||
| NAS | ||||||
| WBS | 0.220 | |||||
| SAI | 0.701 | 0.287 | ||||
| GAD | 0.626 | 0.415 | 0.893 | |||
| TAI | 0.586 | 0.215 | 0.835 | 0.775 | ||
| Dimension→Dimension | Original Sample (O) | Sample Average (A) | Confidence Interval (CI) | |
|---|---|---|---|---|
| IL2.5% | UL97.5% | |||
| WBP→NAS | 0.220 | 0.237 | 0.172 | 0.322 |
| SAI→NAS | 0.701 | 0.701 | 0.633 | 0.764 |
| SAI→WBS | 0.287 | 0.293 | 0.205 | 0.384 |
| GAD→NAS | 0.586 | 0.585 | 0.504 | 0.663 |
| GAD→WBS | 0.215 | 0.224 | 0.143 | 0.315 |
| GAD→SAI | 0.835 | 0.835 | 0.785 | 0.879 |
| TAI→NAS | 0.626 | 0.626 | 0.544 | 0.701 |
| TAI→WBS | 0.415 | 0.418 | 0.324 | 0.511 |
| TAI→SAI | 0.893 | 0.893 | 0.859 | 0.925 |
| TAI→GAD | 0.775 | 0.775 | 0.714 | 0.829 |
| Dimensions Exogenous | Dimensions Endogenous | |||
|---|---|---|---|---|
| WBS | SAI | GAD | TAI | |
| NAS | 1.000 | 1.446 | 1.044 | 1.044 |
| WBS | 1.145 | 1.044 | 1.044 | |
| TAI | 1.586 | |||
| Dimensions Endogenous | R2 (p-Value) | R2adjusted (p-Value) |
|---|---|---|
| Positive Affection Scale (WBS) | 0.042 (0.037) | 0.040 (0.048) |
| State Anxiety Inventory (SAI) | 0.684 (0.000) | 0.682 (0.000) |
| Generalized Anxiety (GAD) | 0.290 (0.000) | 0.286 (0.000) |
| Trait Anxiety Inventory (TAI) | 0.369 (0.000) | 0.367 (0.000) |
| Exogenous Dimension → Endogenous Dimension | Original Sample (O) | Sample Average (A) | T-Statistics | p-Value |
|---|---|---|---|---|
| NAS → WBS | 0.044 | 0.050 | 1.944 | 0.052 |
| NAS → TAI | 0.386 | 0.395 | 4.929 | 0.000 |
| NAS → GAP | 0.349 | 0.358 | 4.958 | 0.000 |
| NAS → SAI | 0.175 | 0.179 | 3.931 | 0.000 |
| WBS → GAD | 0.013 | 0.017 | 1.103 | 0.270 |
| WBS → SAI | 0.001 | 0.003 | 0.215 | 0.830 |
| WBS → TAI | 0.097 | 0.103 | 2.734 | 0.006 |
| TAI → SAI | 0.825 | 0.835 | 6.416 | 0.000 |
| Structural Relationship | Hypotheses | Original Sample (O) | St. Deviation (STDEV) | T-Statistic (|O/STDEV|) | p-Value | Significance (p < 0.05) |
|---|---|---|---|---|---|---|
| NAS → WBS | H1 | −0.204 | 0.047 | 4.353 | 0.000 | Accept |
| NAS → TAI | H2a | 0.504 | 0.036 | 13.803 | 0.000 | Accept |
| NAS → GAD | H2b | 0.509 | 0.037 | 13.759 | 0.000 | Accept |
| NAS → SAI | H2c | 0.283 | 0.033 | 8.504 | 0.000 | Accept |
| WPS → IAT | H3a | −0.252 | 0.041 | 6.158 | 0.000 | Accept |
| WPS → GAD | H3b | −0.100 | 0.041 | 2.418 | 0.016 | Accept |
WPS  * SAI * SAI | H3c | 0.019 | 0.029 | 0.643 | 0.520 | Reject |
| TAI → SAI | H4 | 0.643 | 0.033 | 19.713 | 0.000 | Accept |
| Endogenous Dimensions | SQO | SQE | |
|---|---|---|---|
| Positive Affection Scale | 4140.00 | 4071.32 | 0.017 |
| State Anxiety Inventory | 4600.00 | 2947.17 | 0.359 |
| Generalized Anxiety | 3220.00 | 2696.59 | 0.163 |
| Anxiety Trait Inventory | 3680.00 | 3037.06 | 0.175 |
| Endogenous Dimensions | = | Exogenous Dimensions | + | Error |
|---|---|---|---|---|
| WBS | = | 0.204 NAS | + | εWBS |
| TAI | = | 0.504 NAS − 0.252WBS | + | εTAI |
| SAI | = | 0.283 NAS + 0.643 TAI | + | εSAI |
| GAD | = | 0.509 NAS − 0.100 WBS | + | εGAD |
© 2020 by the authors. Licensee MDPI, Basel, Switzerland. This article is an open access article distributed under the terms and conditions of the Creative Commons Attribution (CC BY) license (http://creativecommons.org/licenses/by/4.0/).
Share and Cite
Dias Lopes, L.F.; Chaves, B.M.; Fabrício, A.; Porto, A.; Machado de Almeida, D.; Obregon, S.L.; Pimentel Lima, M.; Vieira da Silva, W.; Camargo, M.E.; da Veiga, C.P.; et al. Analysis of Well-Being and Anxiety among University Students. Int. J. Environ. Res. Public Health 2020, 17, 3874. https://doi.org/10.3390/ijerph17113874
Dias Lopes LF, Chaves BM, Fabrício A, Porto A, Machado de Almeida D, Obregon SL, Pimentel Lima M, Vieira da Silva W, Camargo ME, da Veiga CP, et al. Analysis of Well-Being and Anxiety among University Students. International Journal of Environmental Research and Public Health. 2020; 17(11):3874. https://doi.org/10.3390/ijerph17113874
Chicago/Turabian StyleDias Lopes, Luis Felipe, Bianca Michels Chaves, Adriane Fabrício, Adriana Porto, Damiana Machado de Almeida, Sandra Leonara Obregon, Mauren Pimentel Lima, Wesley Vieira da Silva, Maria Emilia Camargo, Claudimar Pereira da Veiga, and et al. 2020. "Analysis of Well-Being and Anxiety among University Students" International Journal of Environmental Research and Public Health 17, no. 11: 3874. https://doi.org/10.3390/ijerph17113874
APA StyleDias Lopes, L. F., Chaves, B. M., Fabrício, A., Porto, A., Machado de Almeida, D., Obregon, S. L., Pimentel Lima, M., Vieira da Silva, W., Camargo, M. E., da Veiga, C. P., de Moura, G. L., Costa Vieira da Silva, L. S., & Flores Costa, V. M. (2020). Analysis of Well-Being and Anxiety among University Students. International Journal of Environmental Research and Public Health, 17(11), 3874. https://doi.org/10.3390/ijerph17113874