Artificial Neural Network Modeling of Novel Coronavirus (COVID-19) Incidence Rates across the Continental United States


Abstract
:1. Introduction
2. Materials and Methods
2.1. Data Collection and Preparation
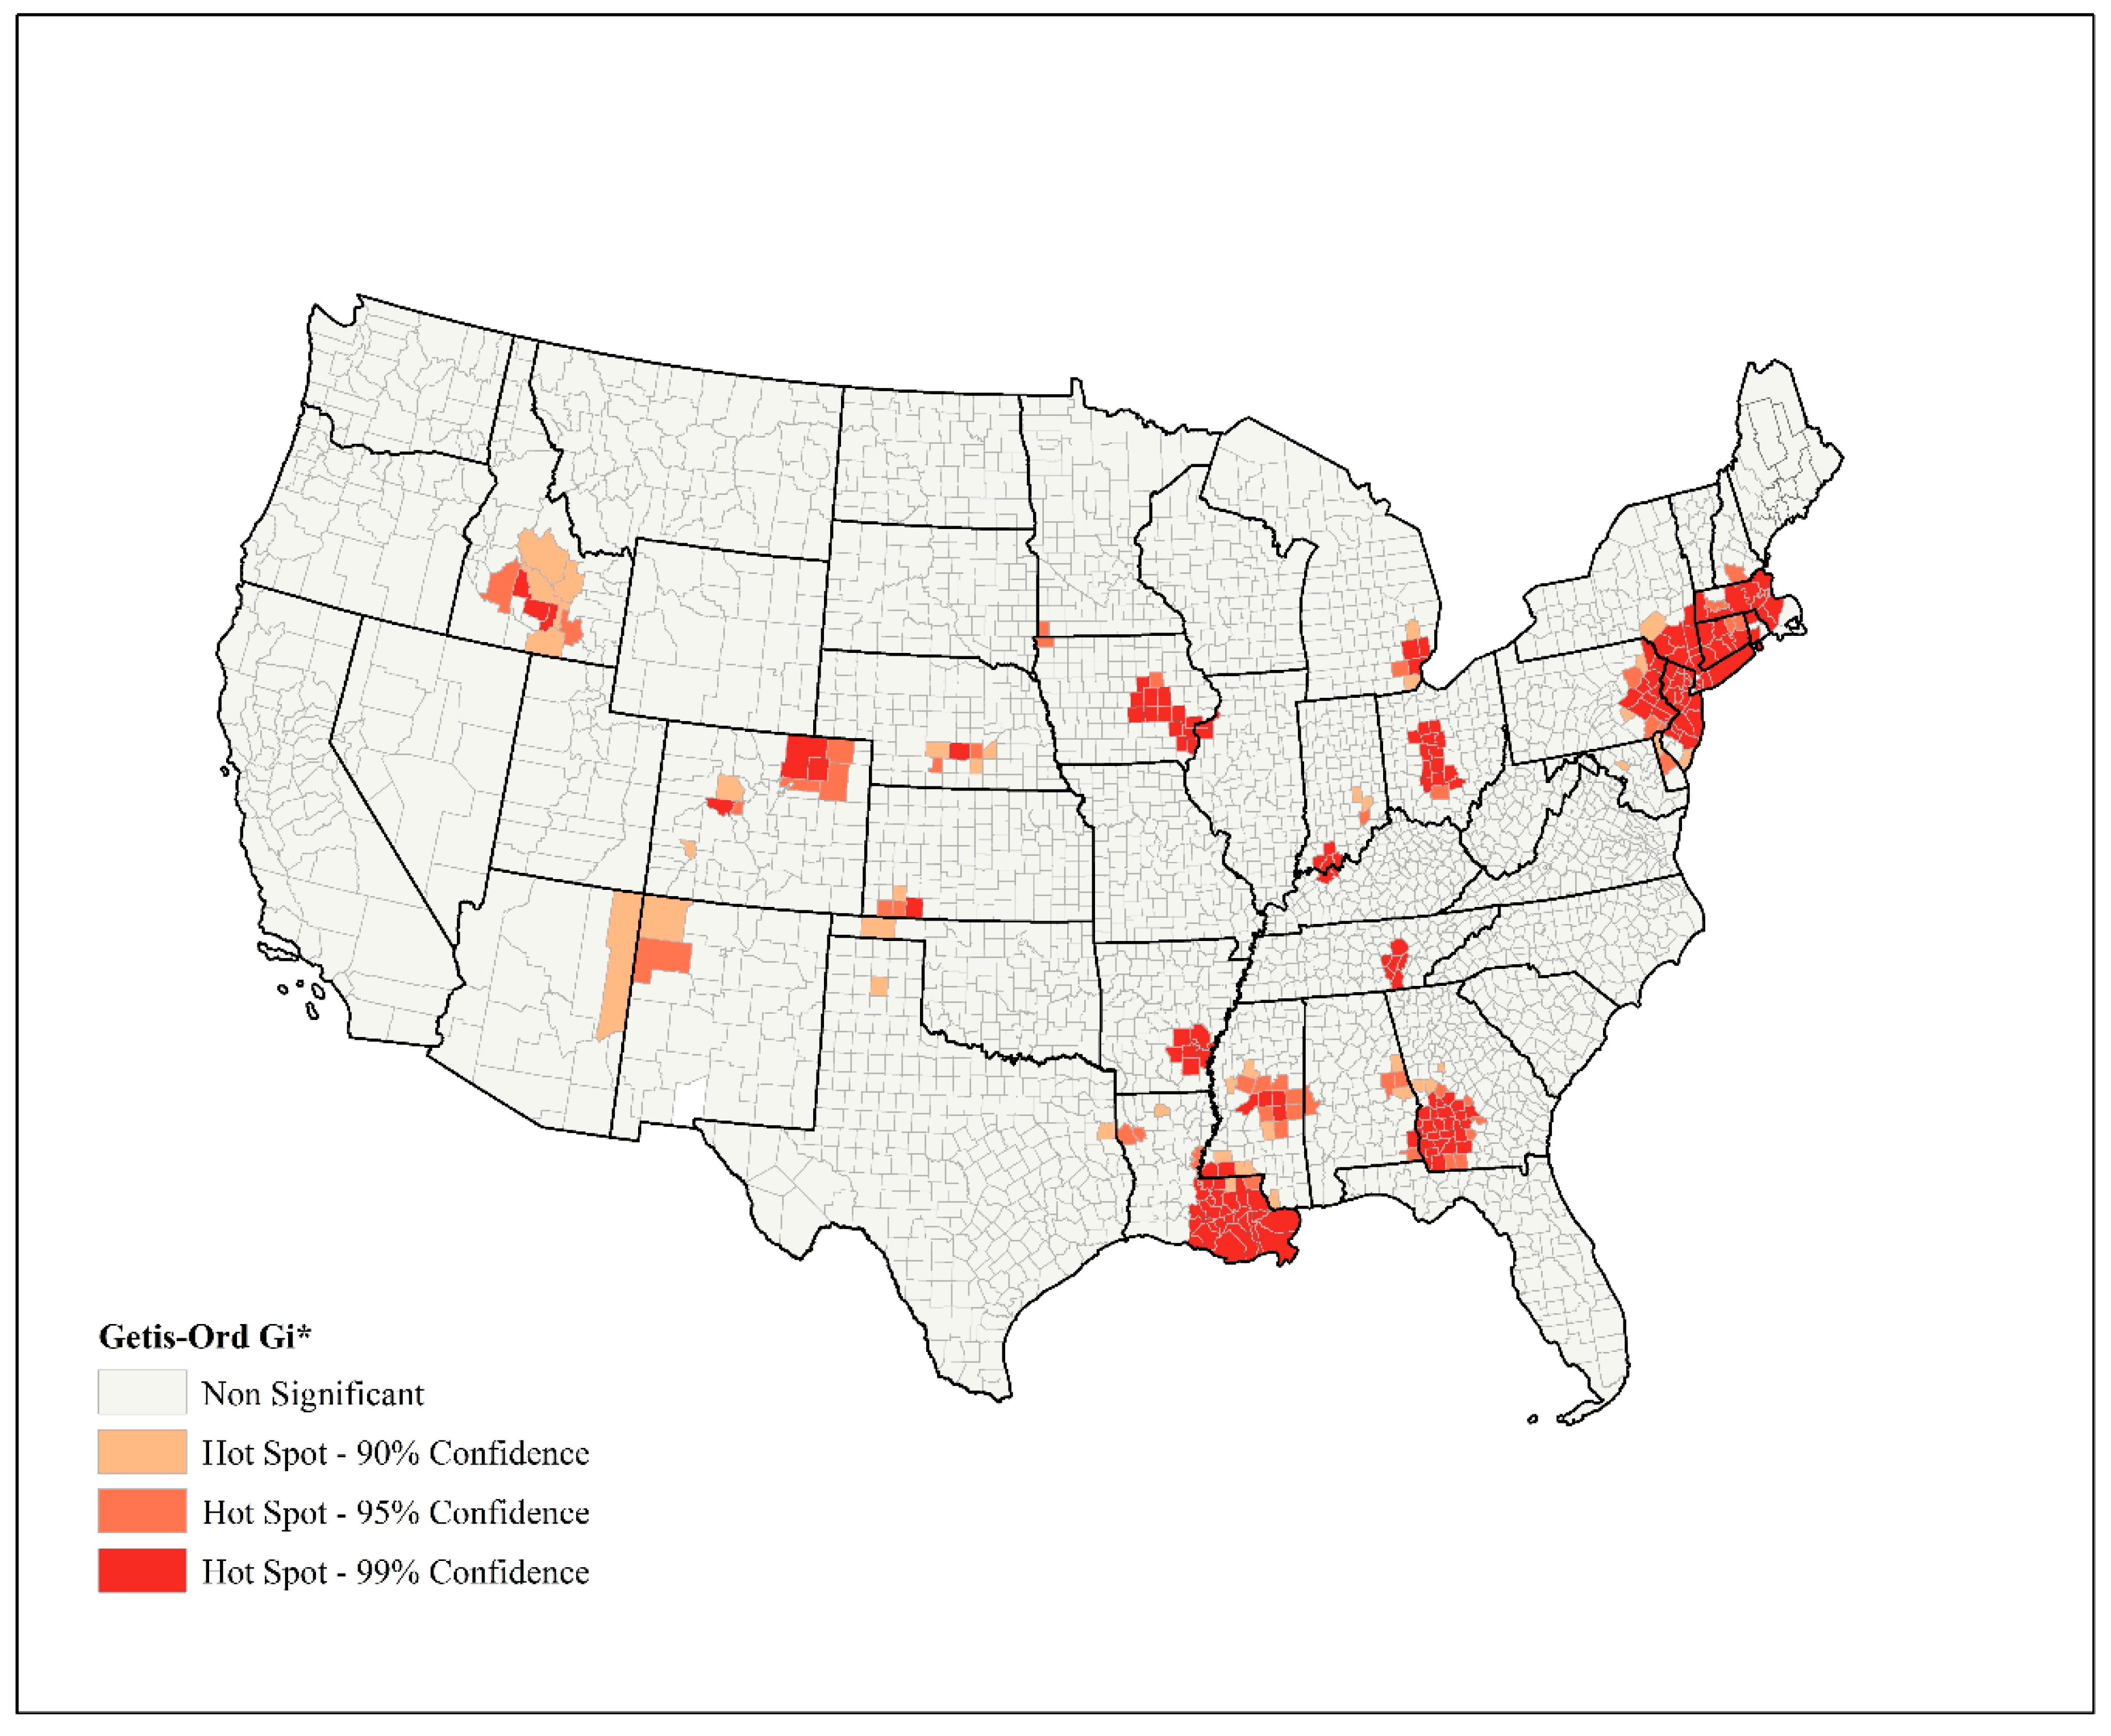
2.2. Spatial Analysis
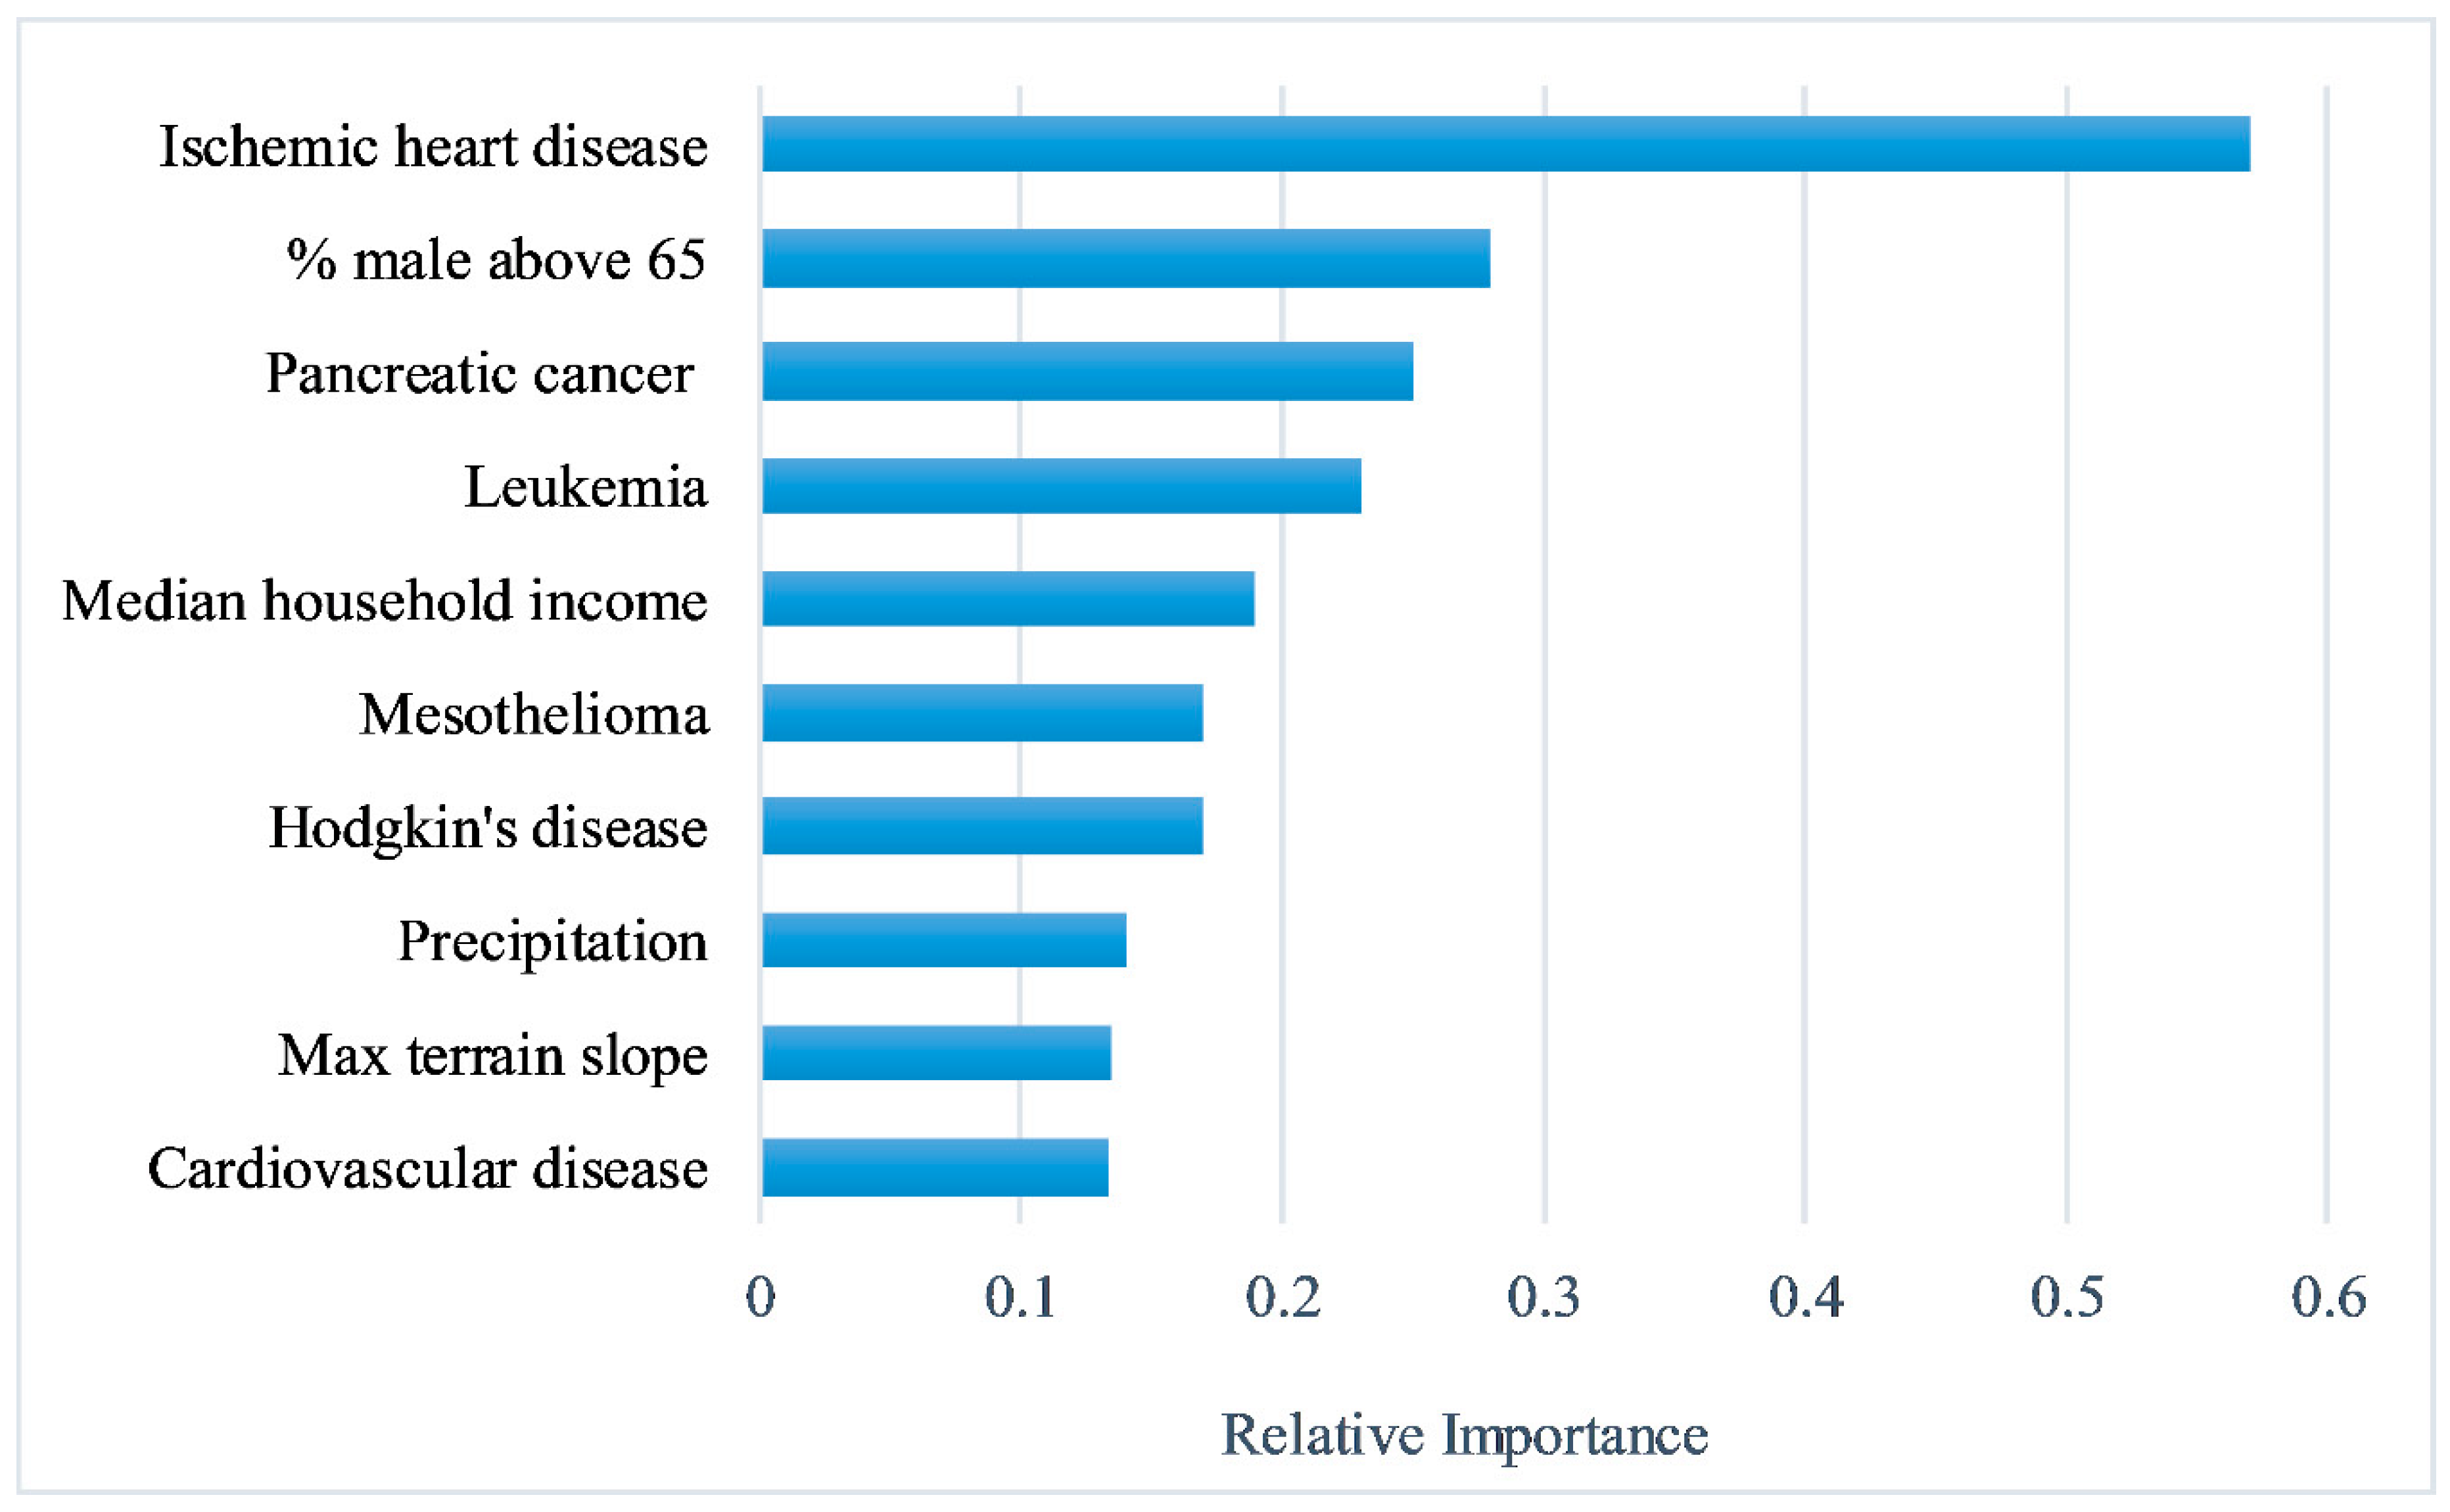
2.3. Feature Selection
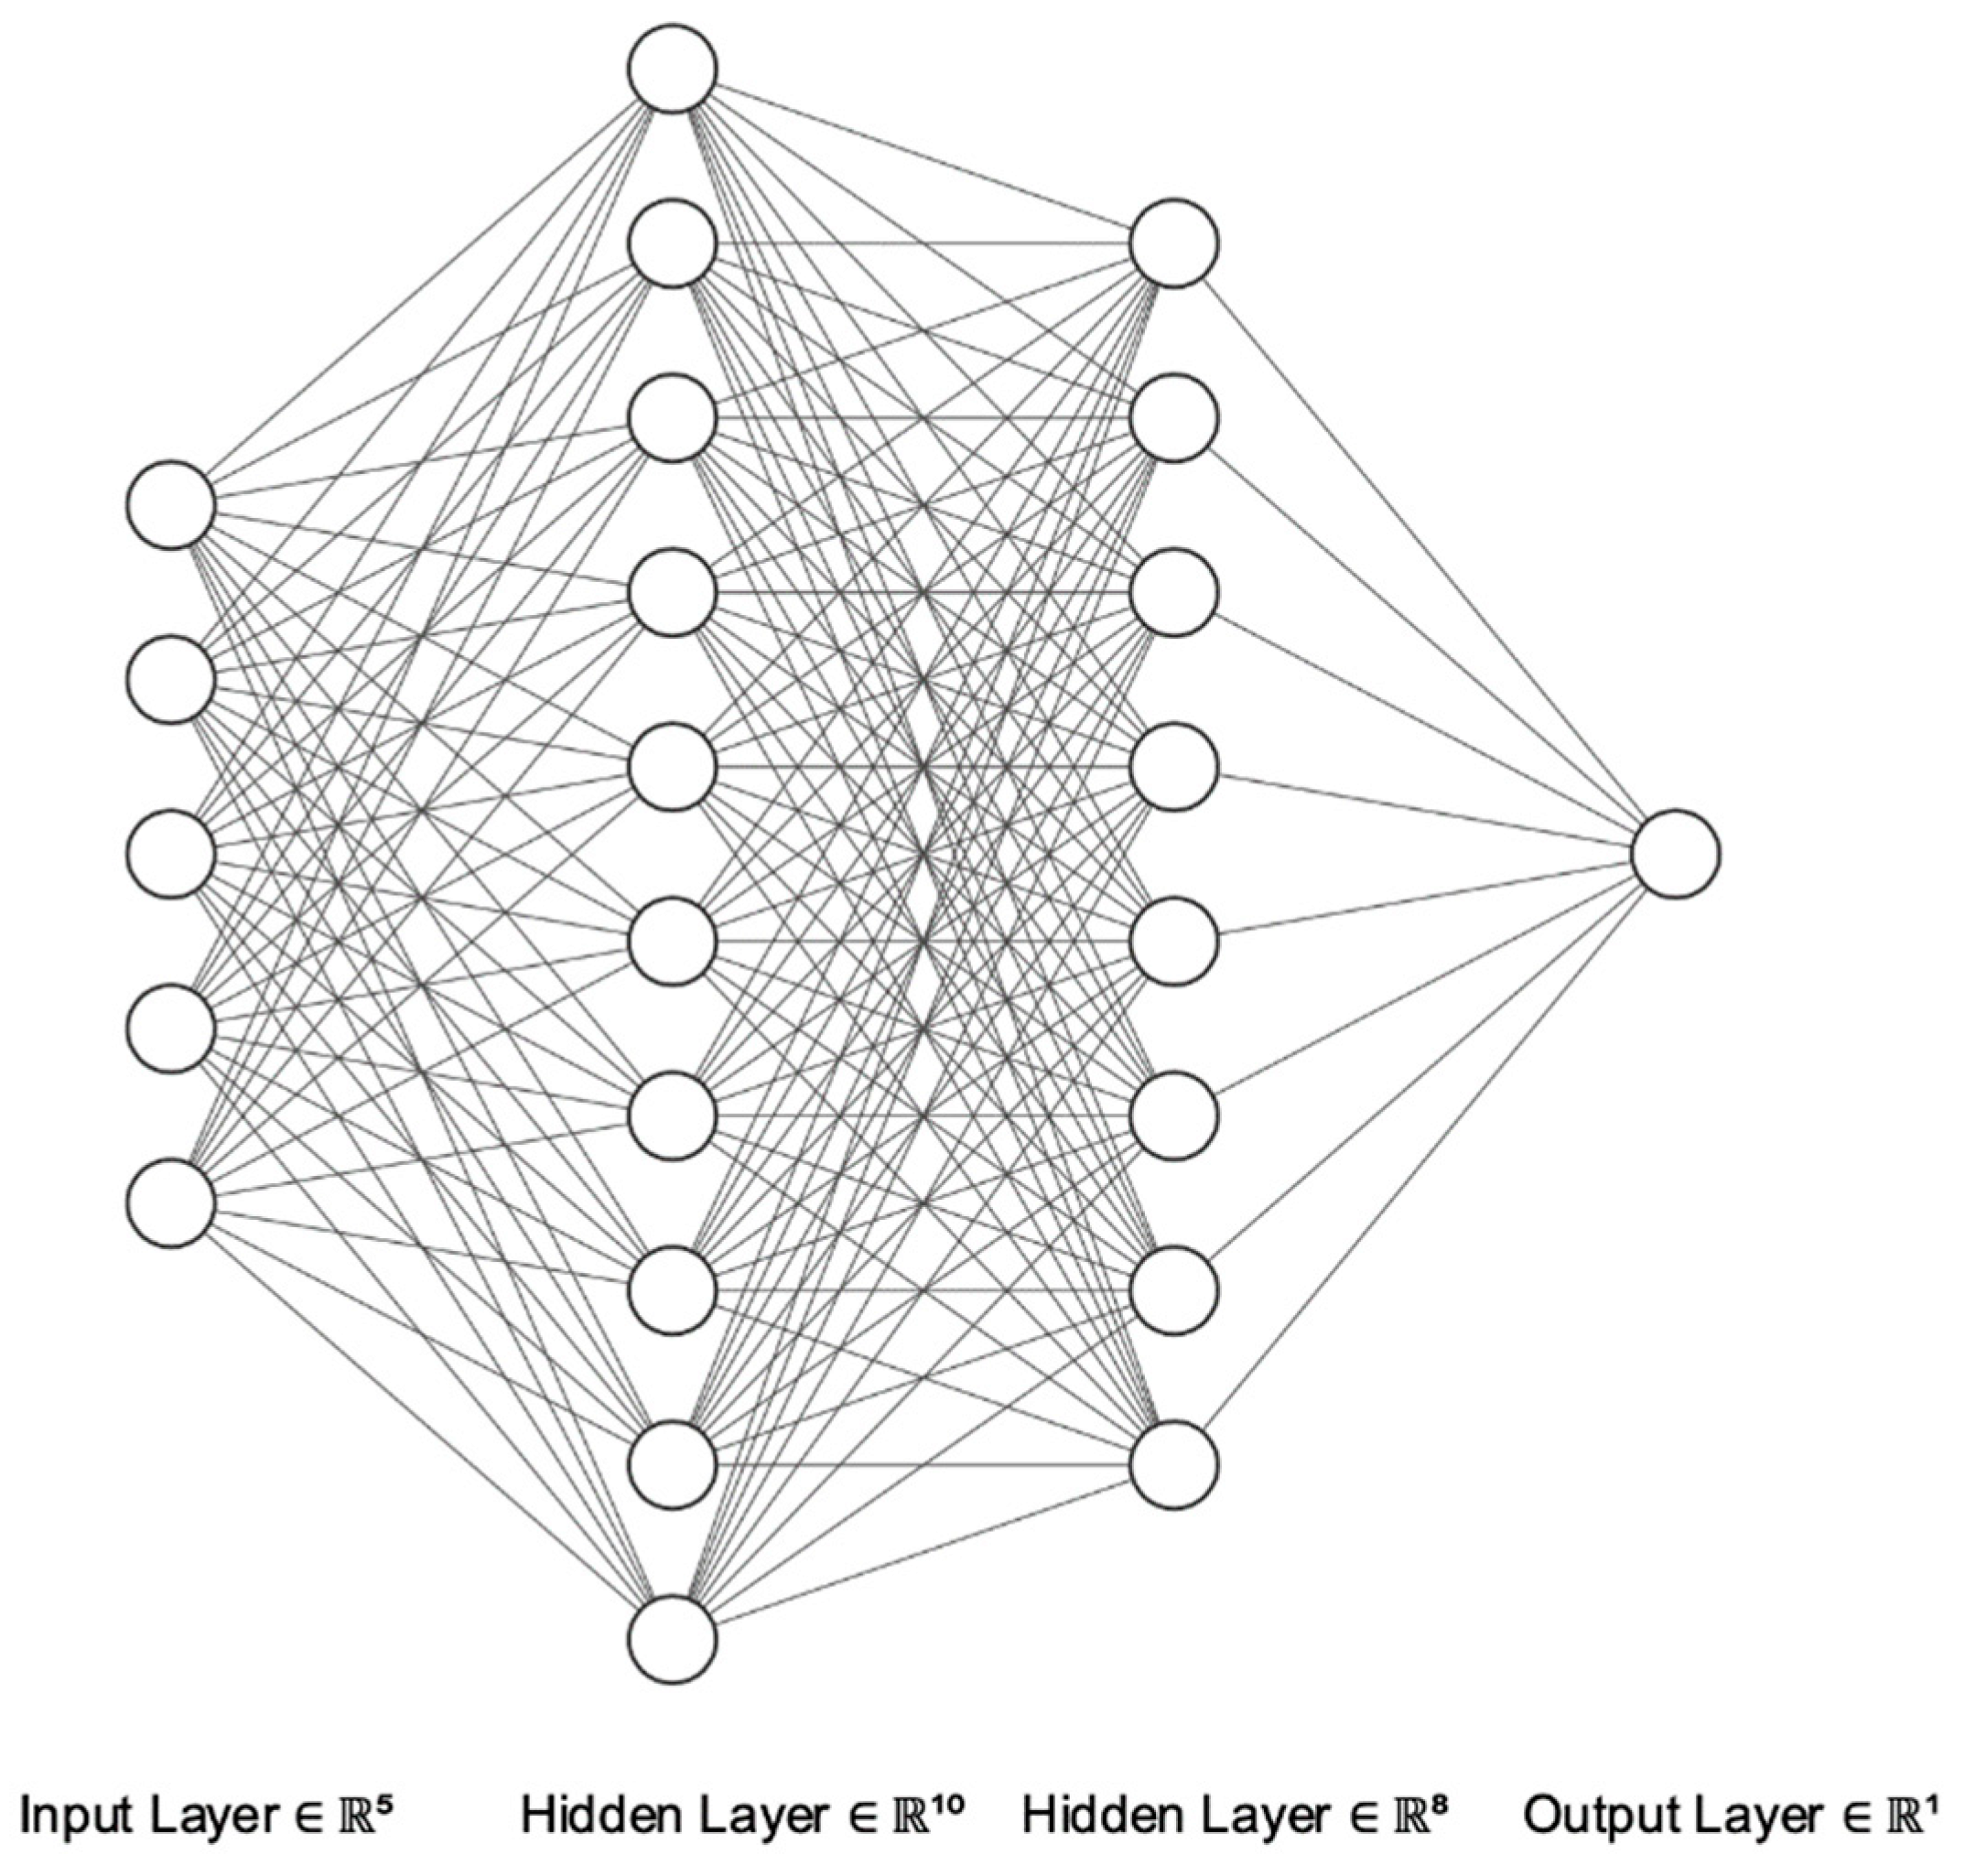
2.4. Artificial Neural Networks
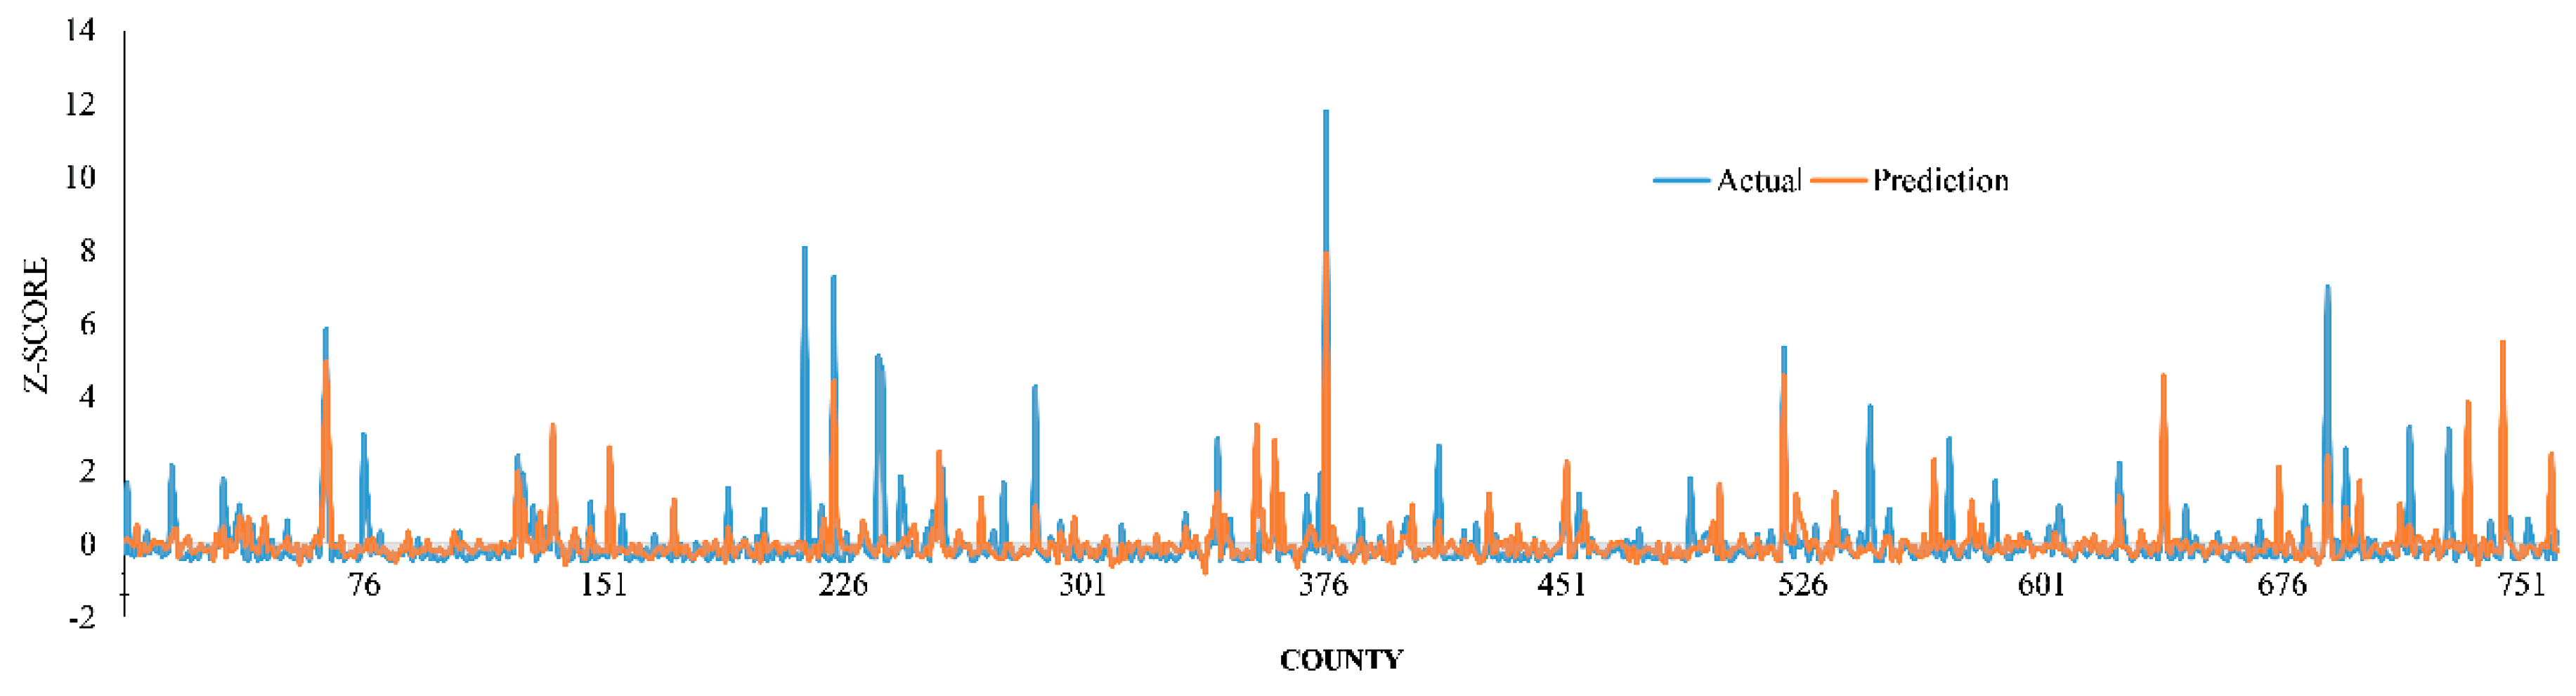
2.5. Model Performance
3. Results
4. Discussion
5. Conclusions
Supplementary Materials
Author Contributions
Funding
Acknowledgments
Conflicts of Interest
References
- Fauci, A.S.; Lane, H.C.; Redfield, R.R. Covid-19—Navigating the Uncharted. N. Engl. J. Med. 2020, 382, 1268–1269. [Google Scholar] [CrossRef]
- World Health Organization. WHO Timeline—COVID-19. Available online: https://www.who.int/news-room/detail/27-04-2020-who-timeline---covid-19 (accessed on 15 May 2020).
- World Health Organization. WHO Coronavirus Disease (COVID-19) Dashboard. Available online: https://covid19.who.int (accessed on 4 June 2020).
- National Institutes of Health. COVID-19, MERS & SARS. Available online: https://www.niaid.nih.gov/diseases-conditions/covid-19 (accessed on 15 May 2020).
- International Monetary Fund (IMF). World Economic Outlook Chapter 1: The Great Lockdown. Available online: https://www.imf.org/en/Publications (accessed on 15 May 2020).
- United Nations. Everyone Included: Social Impact of COVID-19. Available online: https://www.un.org/development/desa/dspd/everyone-included-covid-19.html (accessed on 15 May 2020).
- Cameron, E.E.; Nuzzo, J.B.; Bell, J.A. Global Health Security Index: Building Collective Action and Accountability; Johns Hopkins Bloomberg School of Public Health: Baltimore, MD, USA, 2019; Available online: https://www.ghsindex.org/wp-content/uploads/2019/10/2019-Global-Health-Security-Index.pdf (accessed on 2 May 2020).
- Johns Hopkins University Center for System Science and Engineering. COVID-19 Dashboard. Available online: https://coronavirus.jhu.edu/map.html (accessed on 15 May 2020).
- The COVID Tracking Project. Available online: https://covidtracking.com/data/us-daily (accessed on 4 June 2020).
- Johns Hopkins University & Medicine. Mortality Analyses. Available online: https://coronavirus.jhu.edu/data/mortality (accessed on 4 June 2020).
- Zheng, Y.Y.; Ma, Y.T.; Zhang, J.Y.; Xie, X. COVID-19 and the cardiovascular system. Nat. Rev. Cardiol. 2020, 17, 259–260. [Google Scholar] [CrossRef] [Green Version]
- Lippi, G.; Henry, B.M. Chronic obstructive pulmonary disease is associated with severe coronavirus disease 2019 (COVID-19). Respir. Med. 2020, 167, 105941. [Google Scholar] [CrossRef]
- You, B.; Ravaud, A.; Canivet, A.; Ganem, G.; Giraud, P.; Guimbaud, R.; Kaluzinski, L.; Krakowski, I.; Mayeur, D.; Grellety, T.; et al. The official French guidelines to protect patients with cancer against SARS-CoV-2 infection. Lancet Oncol. 2020, 21, 619–621. [Google Scholar] [CrossRef] [Green Version]
- Cox, V.; Wilkinson, L.; Grimsrud, A.; Hughes, J.; Reuter, A.; Conradie, F.; Nel, J.; Boyles, T. Critical changes to services for TB patients during the COVID-19 pandemic. Int. J. Tuberc. Lung Dis. 2020, 24, 542–544. [Google Scholar] [CrossRef] [PubMed]
- Marsden, J.; Darke, S.; Hall, W.; Hickman, M.; Holmes, J.; Humphreys, K.; Neale, J.; Tucker, J.; West, R. Mitigating and learning from the impact of COVID-19 infection on addictive disorders. Addiction 2020. [Google Scholar] [CrossRef] [Green Version]
- Wang, J.; Tang, K.; Feng, K.; Lv, W. High temperature and high humidity reduce the transmission of COVID-19. Available SSRN 2020, 3551767. [Google Scholar] [CrossRef] [Green Version]
- Mollalo, A.; Vahedi, B.; Rivera, K.M. GIS-based spatial modeling of COVID-19 incidence rate in the continental United States. Sci. Total Environ. 2020, 728, 138884. [Google Scholar] [CrossRef] [PubMed]
- Mollalo, A.; Mao, L.; Rashidi, P.; Glass, G.E. A GIS-based artificial neural network model for spatial distribution of tuberculosis across the continental United States. Int. J. Environ. Res. Public Health 2019, 16, 157. [Google Scholar] [CrossRef] [Green Version]
- Keshavarzi, A.; Sarmadian, F.; Sadeghnejad, M.; Pezeshki, P. Developing pedotransfer functions for estimating some soil properties using artificial neural network and multivariate regression approaches. ProEnviron. Promediu 2010, 3, 322–330. [Google Scholar]
- Marohasy, J.; Abbot, J. Assessing the quality of eight different maximum temperature time series as inputs when using artificial neural networks to forecast monthly rainfall at Cape Otway, Australia. Atmos. Res. 2015, 166, 141–149. [Google Scholar] [CrossRef]
- Abdipour, M.; Younessi-Hmazekhanlu, M.; Ramazani, S.H.R. Artificial neural networks and multiple linear regression as potential methods for modeling seed yield of safflower (Carthamus tinctorius L.). Ind. Crop. Prod. 2019, 127, 185–194. [Google Scholar] [CrossRef]
- Bae, J.K. Predicting financial distress of the South Korean manufacturing industries. Expert Syst. Appl. 2012, 39, 9159–9165. [Google Scholar] [CrossRef]
- Gordon, R. Applications of Artificial Neural Networks in Financial Market Forecasting. Ph.D. Thesis, University of Glasgow, Glasgow, Scotland, UK, 2019. [Google Scholar]
- Kang, B.H.; Bai, Q. AI 2016: Advances in Artificial Intelligence. In Proceedings of the 29th Australasian Joint Conference, Hobart, TAS, Australia, 5–8 December 2016; Springer: Berlin/Heidelberg, Germany, 2016; Volume 9992. [Google Scholar]
- Kiang, R.; Adimi, F.; Soika, V.; Nigro, J.; Singhasivanon, P.; Sirichaisinthop, J.; Leemingsawat, S.; Apiwathnasorn, C.; Looareesuwan, S. Meteorological, environmental remote sensing and neural network analysis of the epidemiology of malaria transmission in Thailand. Geospat. Health 2006, 1, 71–84. [Google Scholar] [CrossRef] [PubMed]
- Reddy, R.; Imler, T.D. Artificial Neural Networks are Highly Predictive for Hepatocellular Carcinoma in Patients with Cirrhosis. Gastroenterology 2017, 152, S1193. [Google Scholar] [CrossRef]
- Mollalo, A.; Sadeghian, A.; Israel, G.D.; Rashidi, P.; Sofizadeh, A.; Glass, G.E. Machine learning approaches in GIS-based ecological modeling of the sand fly Phlebotomus papatasi, a vector of zoonotic cutaneous leishmaniasis in Golestan province, Iran. Acta Trop. 2018, 188, 187–194. [Google Scholar] [CrossRef]
- Badnjević, A.; Gurbeta, L.; Cifrek, M.; Marjanovic, D. Classification of asthma using artificial neural network. In MIPRO, Proceedings of the International Convention, Proceedings of the 2016 39th International Convention on Information and Communication Technology, Electronics and Microelectronics (MIPRO), Opatija, Croatia, 30 May–3 June 2016; IEEE: Piscataway, NJ, USA, 2016; pp. 387–390. [Google Scholar]
- Allen, C.; Hervey, T.; Lafia, S.; Phillips, D.W.; Vahedi, B.; Kuhn, W. Exploring the notion of spatial lenses. In Geographic Information Science, Proceedings of the Annual International Conference on Geographic Information Science, Cham, Switzerland, September 2016; Springer: Berlin/Heidelberg, Germany, 2016; pp. 259–274. [Google Scholar]
- Vahedi, B.; Kuhn, W.; Ballatore, A. Question-based spatial computing—A case study. In Geospatial Data in a Changing World; Springer: Cham, Switzerland, 2016; pp. 37–50. [Google Scholar]
- Dong, E.; Du, H.; Gardner, L. An interactive web-based dashboard to track COVID-19 in real time. Lancet Infect. Dis. 2020, 20, 533–534. [Google Scholar] [CrossRef]
- Moran, P.A. Notes on continuous stochastic phenomena. Biometrika 1950, 37, 17–23. [Google Scholar] [CrossRef]
- Mollalo, A.; Alimohammadi, A.; Khoshabi, M. Spatial and spatio-temporal analysis of human brucellosis in Iran. Trans. R. Soc. Trop. Med. Hyg. 2014, 108, 721–728. [Google Scholar] [CrossRef]
- Mollalo, A.; Alimohammadi, A.; Shirzadi, M.R.; Malek, M.R. Geographic information system-based analysis of the spatial and spatio-temporal distribution of zoonotic cutaneous leishmaniasis in Golestan Province, north-east of Iran. Zoonoses Public Health 2015, 62, 18–28. [Google Scholar] [CrossRef]
- Mollalo, A.; Blackburn, J.K.; Morris, L.R.; Glass, G.E. A 24-year exploratory spatial data analysis of Lyme disease incidence rate in Connecticut, USA. Geospat. Health 2017, 12, 588. [Google Scholar] [CrossRef]
- Getis, A.; Ord, J.K. The analysis of spatial association by use of distance statistics. Geogr. Anal. 1992, 24, 189–206. [Google Scholar] [CrossRef]
- Mitchell, A. Spatial Measurements & Statistics; ESRI Press: Redlands, CA, USA, 2005. [Google Scholar]
- Kohavi, R.; John, G.H. Wrappers for feature subset selection. Artif. Intell. 1997, 97, 273–324. [Google Scholar] [CrossRef] [Green Version]
- Kursa, M.B.; Rudnicki, W.R. Feature selection with the Boruta package. J. Stat. Softw. 2010, 36, 1–13. [Google Scholar] [CrossRef] [Green Version]
- Nilsson, R.; Peña, J.M.; Björkegren, J.; Tegnér, J. Consistent feature selection for pattern recognition in polynomial time. J. Mach. Learn. Res. 2007, 8, 589–612. [Google Scholar]
- LeCun, Y.; Bengio, Y.; Hinton, G. Deep learning. Nature 2015, 521, 436–444. [Google Scholar] [CrossRef]
- Bishop, C.M. Neural Networks for Pattern Recognition; Oxford University Press: Oxford, UK, 1995. [Google Scholar]
- Hassoun, M.H. Fundamentals of Artificial Neural Networks; MIT Press: Cambridge, MA, USA, 1995. [Google Scholar]
- Graupe, D. Principles of Artificial Neural Networks; World Scientific, Publishing Company: Singapore, 2013; Volume 7. [Google Scholar]
- Rosenblatt, F. The perceptron: A probabilistic model for information storage and organization in the brain. Psychol. Rev. 1958, 65, 386. [Google Scholar] [CrossRef] [Green Version]
- Guresen, E.; Kayakutlu, G.; Daim, T.U. Using artificial neural network models in stock market index prediction. Expert Syst. Appl. 2011, 38, 10389–10397. [Google Scholar] [CrossRef]
- Mou, L.; Ghamisi, P.; Zhu, X.X. Deep recurrent neural networks for hyperspectral image classification. IEEE Trans. Geosci. Remote Sens. 2017, 55, 3639–3655. [Google Scholar] [CrossRef] [Green Version]
- Gardner, M.W.; Dorling, S.R. Artificial neural networks (the multilayer perceptron)—A review of applications in the atmospheric sciences. Atmos. Environ. 1998, 32, 2627–2636. [Google Scholar] [CrossRef]
- Cascella, M.; Rajnik, M.; Cuomo, A.; Dulebohn, S.C.; Di Napoli, R. Features, evaluation and treatment coronavirus (COVID-19). In StatPearls; StatPearls Publishing: Petersburg, FL, USA, 2020. [Google Scholar]
- Lai, A.G.; Pasea, L.; Banerjee, A.; Denaxas, S.; Katsoulis, M.; Chang, W.H.; Williams, B.; Pillay, D.; Noursadeghi, M.; Linch, D.; et al. Estimating excess mortality in people with cancer and multimorbidity in the COVID-19 emergency. medRxiv 2020. [Google Scholar] [CrossRef]
- Hanff, T.C.; Harhay, M.O.; Brown, T.S.; Cohen, J.B.; Mohareb, A.M. Is There an Association Between COVID-19 Mortality and the Renin-Angiotensin System—A Call for Epidemiologic Investigations. Clin. Infect. Dis. 2020, ciaa329. [Google Scholar] [CrossRef] [PubMed] [Green Version]
- Alimadadi, A.; Aryal, S.; Manandhar, I.; Munroe, P.B.; Joe, B.; Cheng, X. Artificial intelligence and machine learning to fight COVID-19. Physiol. Genom. 2020, 52, 200–202. [Google Scholar] [CrossRef] [PubMed]
- Kavanagh, N.M.; Goel, R.R.; Venkataramani, A.S. Association of County-Level Socioeconomic and Political Characteristics with Engagement in Social Distancing for COVID-19. medRxiv 2020. [Google Scholar] [CrossRef] [Green Version]
- Qu, G.; Li, X.; Hu, L.; Jiang, G. An Imperative Need for Research on the Role of Environmental Factors in Transmission of Novel Coronavirus (COVID-19). Environ. Sci. Technol. 2020, 54, 3730–3732. [Google Scholar] [CrossRef]


| Model | Accuracy Assessment | ||
|---|---|---|---|
| RMSE | r | MAE | |
| Linear Regression | 0.992517 | 0.295885 | 0.577808 |
| MLP (1 hidden layer) | 0.722409 | 0.645481 | 0.355843 |
| MLP (2 hidden layers) | 0.839806 | 0.466981 | 0.39755 |
| Coefficient (B) | Standard Error | Wald Test | Degree of Freedom | Significance | Exp (B) | |
|---|---|---|---|---|---|---|
| Constant | −2.763 | 0.086 | 1036.109 | 1 | 0.000 | 0.063 |
| Median household income | 0.403 | 0.079 | 26.139 | 1 | 0.000 | 1.497 |
| Max terrain slope | −0.270 | 0.093 | 8.432 | 1 | 0.004 | 0.763 |
| Precipitation | 0.337 | 0.080 | 17.817 | 1 | 0.000 | 1.400 |
| Pancreatitis cancer | 0.636 | 0.095 | 44.672 | 1 | 0.000 | 1.889 |
| Hodgkin’s Disease | 0.409 | 0.100 | 16.596 | 1 | 0.000 | 1.505 |
| Leukemia | −0.550 | 0.089 | 38.241 | 1 | 0.000 | 0.577 |
| Cardiovascular | −0.414 | 0.118 | 12.350 | 1 | 0.000 | 0.661 |
© 2020 by the authors. Licensee MDPI, Basel, Switzerland. This article is an open access article distributed under the terms and conditions of the Creative Commons Attribution (CC BY) license (http://creativecommons.org/licenses/by/4.0/).
Share and Cite
Mollalo, A.; Rivera, K.M.; Vahedi, B. Artificial Neural Network Modeling of Novel Coronavirus (COVID-19) Incidence Rates across the Continental United States. Int. J. Environ. Res. Public Health 2020, 17, 4204. https://doi.org/10.3390/ijerph17124204
Mollalo A, Rivera KM, Vahedi B. Artificial Neural Network Modeling of Novel Coronavirus (COVID-19) Incidence Rates across the Continental United States. International Journal of Environmental Research and Public Health. 2020; 17(12):4204. https://doi.org/10.3390/ijerph17124204
Chicago/Turabian StyleMollalo, Abolfazl, Kiara M. Rivera, and Behzad Vahedi. 2020. "Artificial Neural Network Modeling of Novel Coronavirus (COVID-19) Incidence Rates across the Continental United States" International Journal of Environmental Research and Public Health 17, no. 12: 4204. https://doi.org/10.3390/ijerph17124204
APA StyleMollalo, A., Rivera, K. M., & Vahedi, B. (2020). Artificial Neural Network Modeling of Novel Coronavirus (COVID-19) Incidence Rates across the Continental United States. International Journal of Environmental Research and Public Health, 17(12), 4204. https://doi.org/10.3390/ijerph17124204