Annual Prevalence, Health Expenditures, and Co-Morbidities Trend of Iron Deficiency Anemia in Korea: National Health Insurance Service Data from 2002 to 2013


Abstract
:1. Introduction
2. Materials and Methods
2.1. Study Subjects
2.2. Data Resources
2.2.1. The National Health Information Database
2.2.2. The Korean National Health and Nutritional Examination Survey (KNHANES)
2.2.3. Korean Statistical Information Service (KOSIS)
2.2.4. Prevalence of IDA
2.2.5. Health Expenditures of IDA
2.2.6. Direct Medical Cost
2.2.7. Direct Non-Medical Cost
2.2.8. Co-Morbidities of IDA
2.3. Statistical Analyses
3. Results
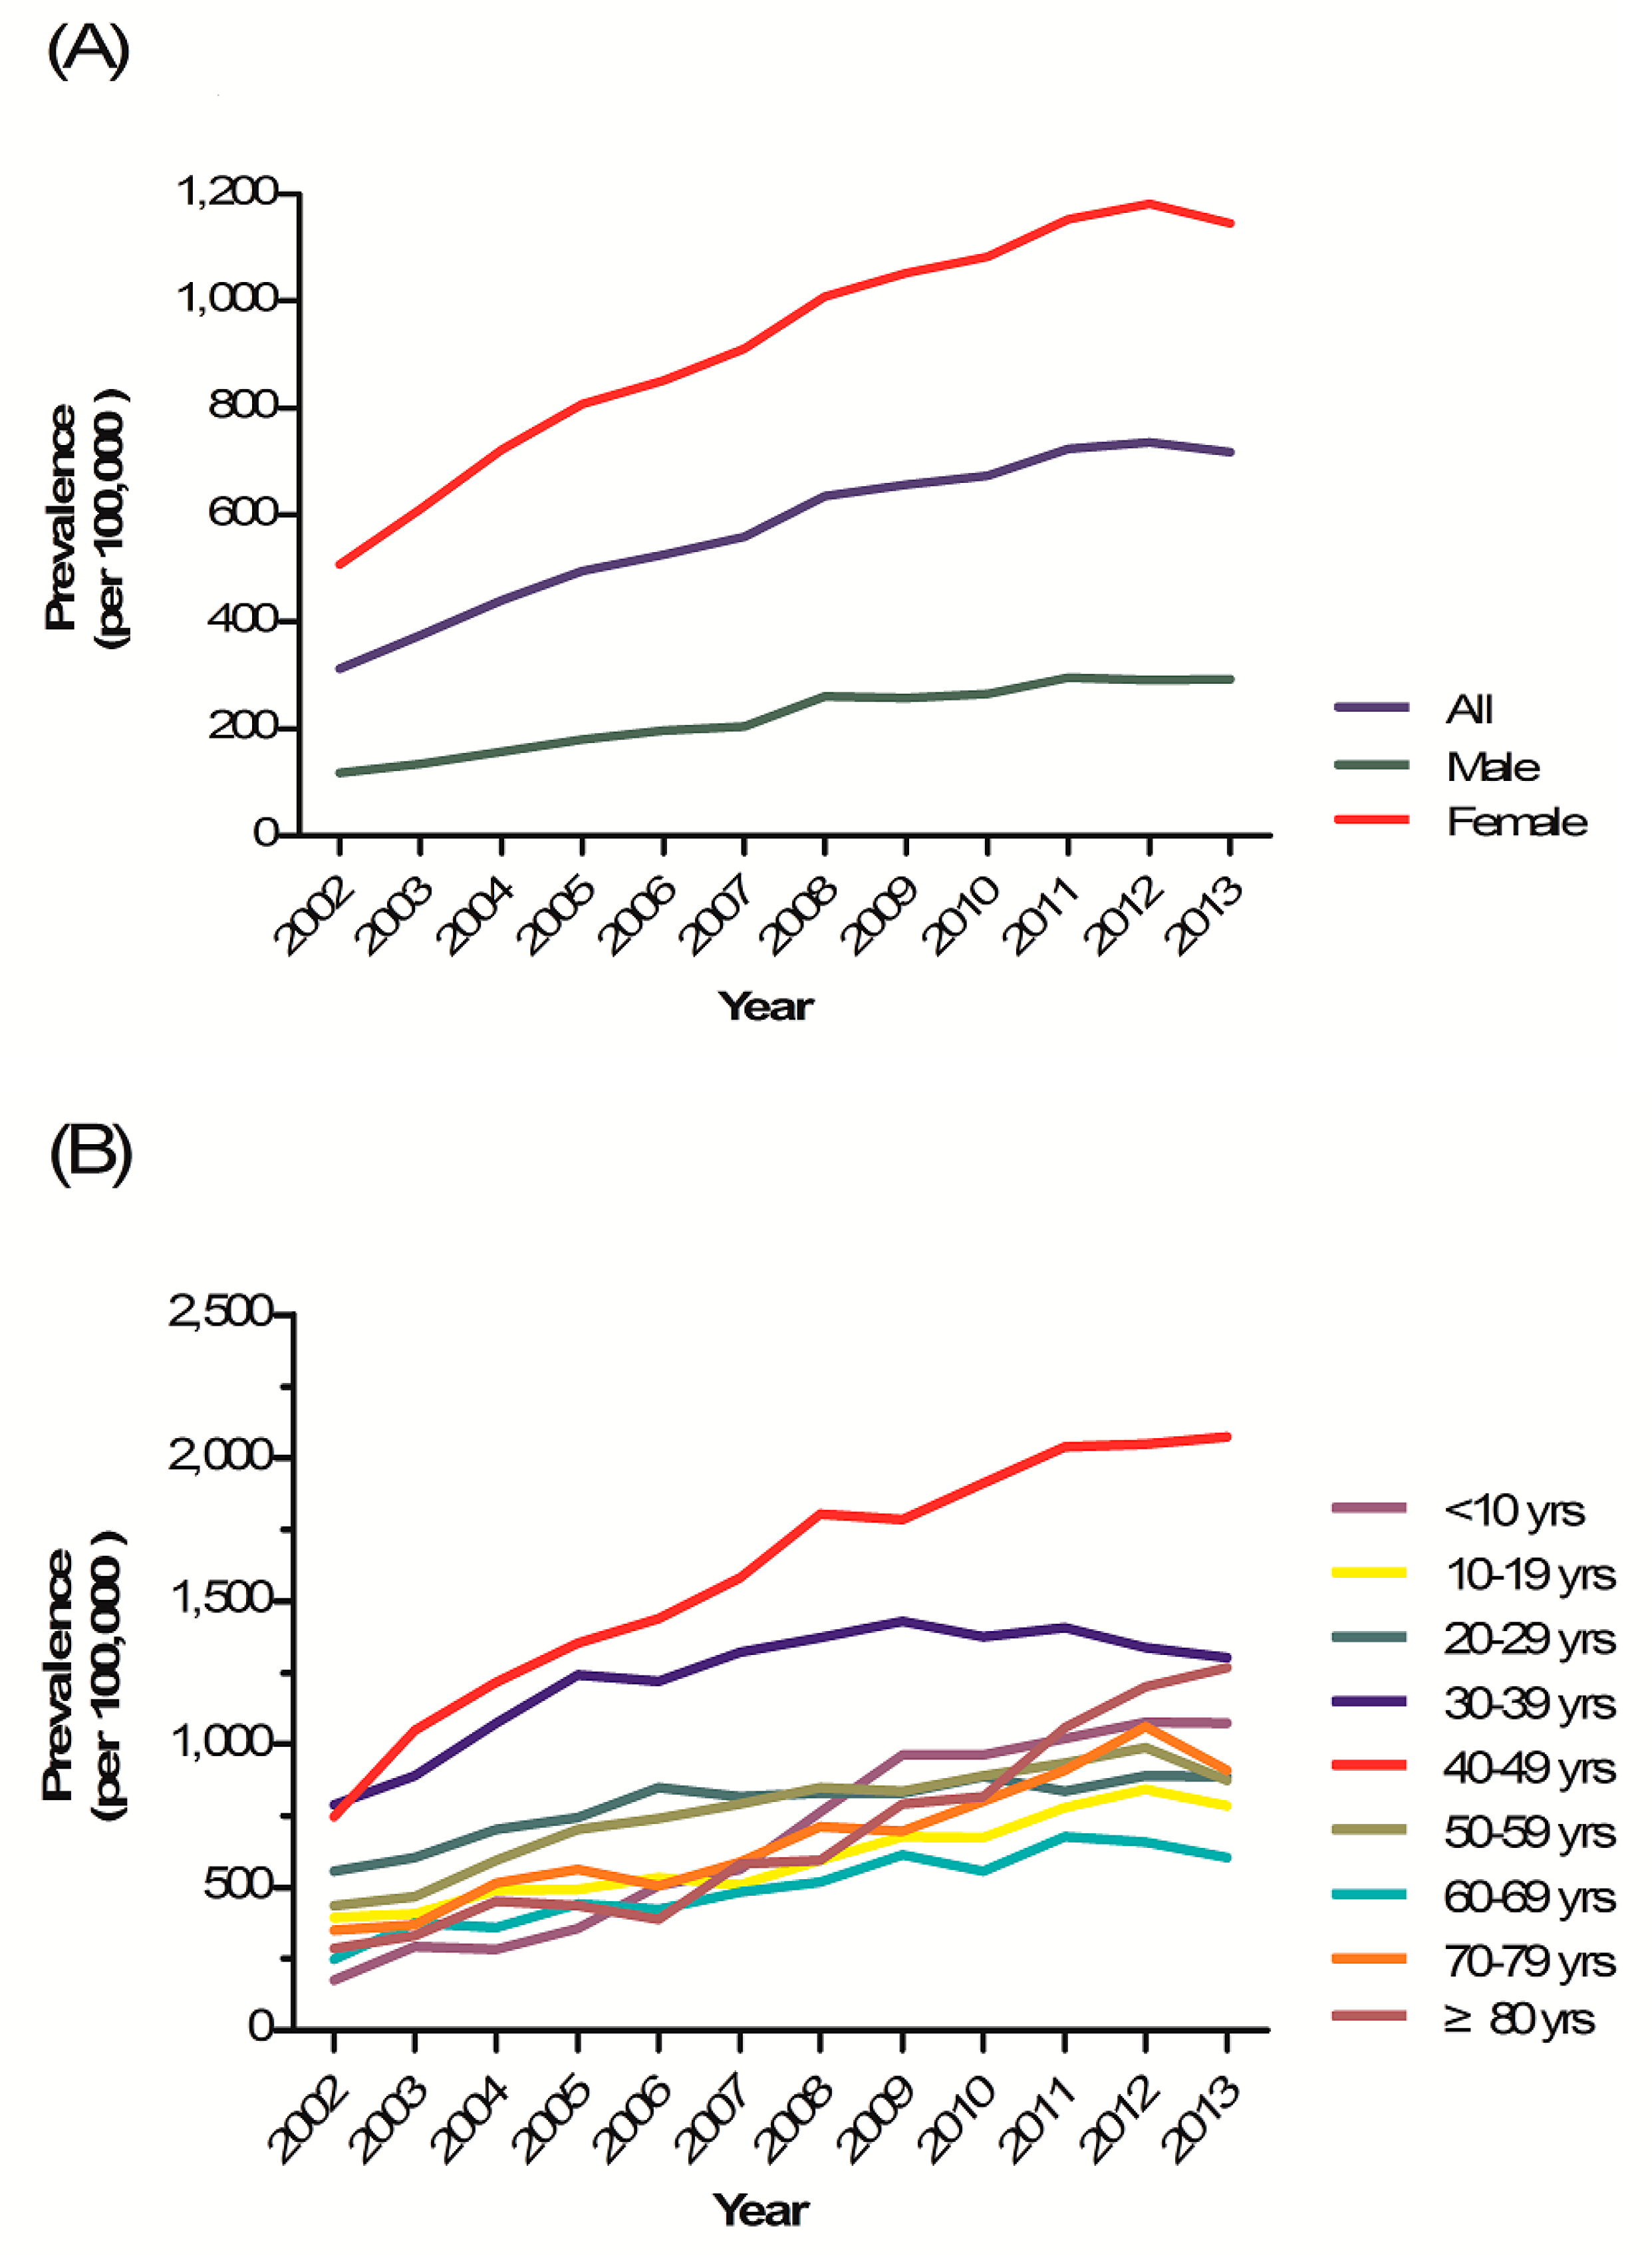
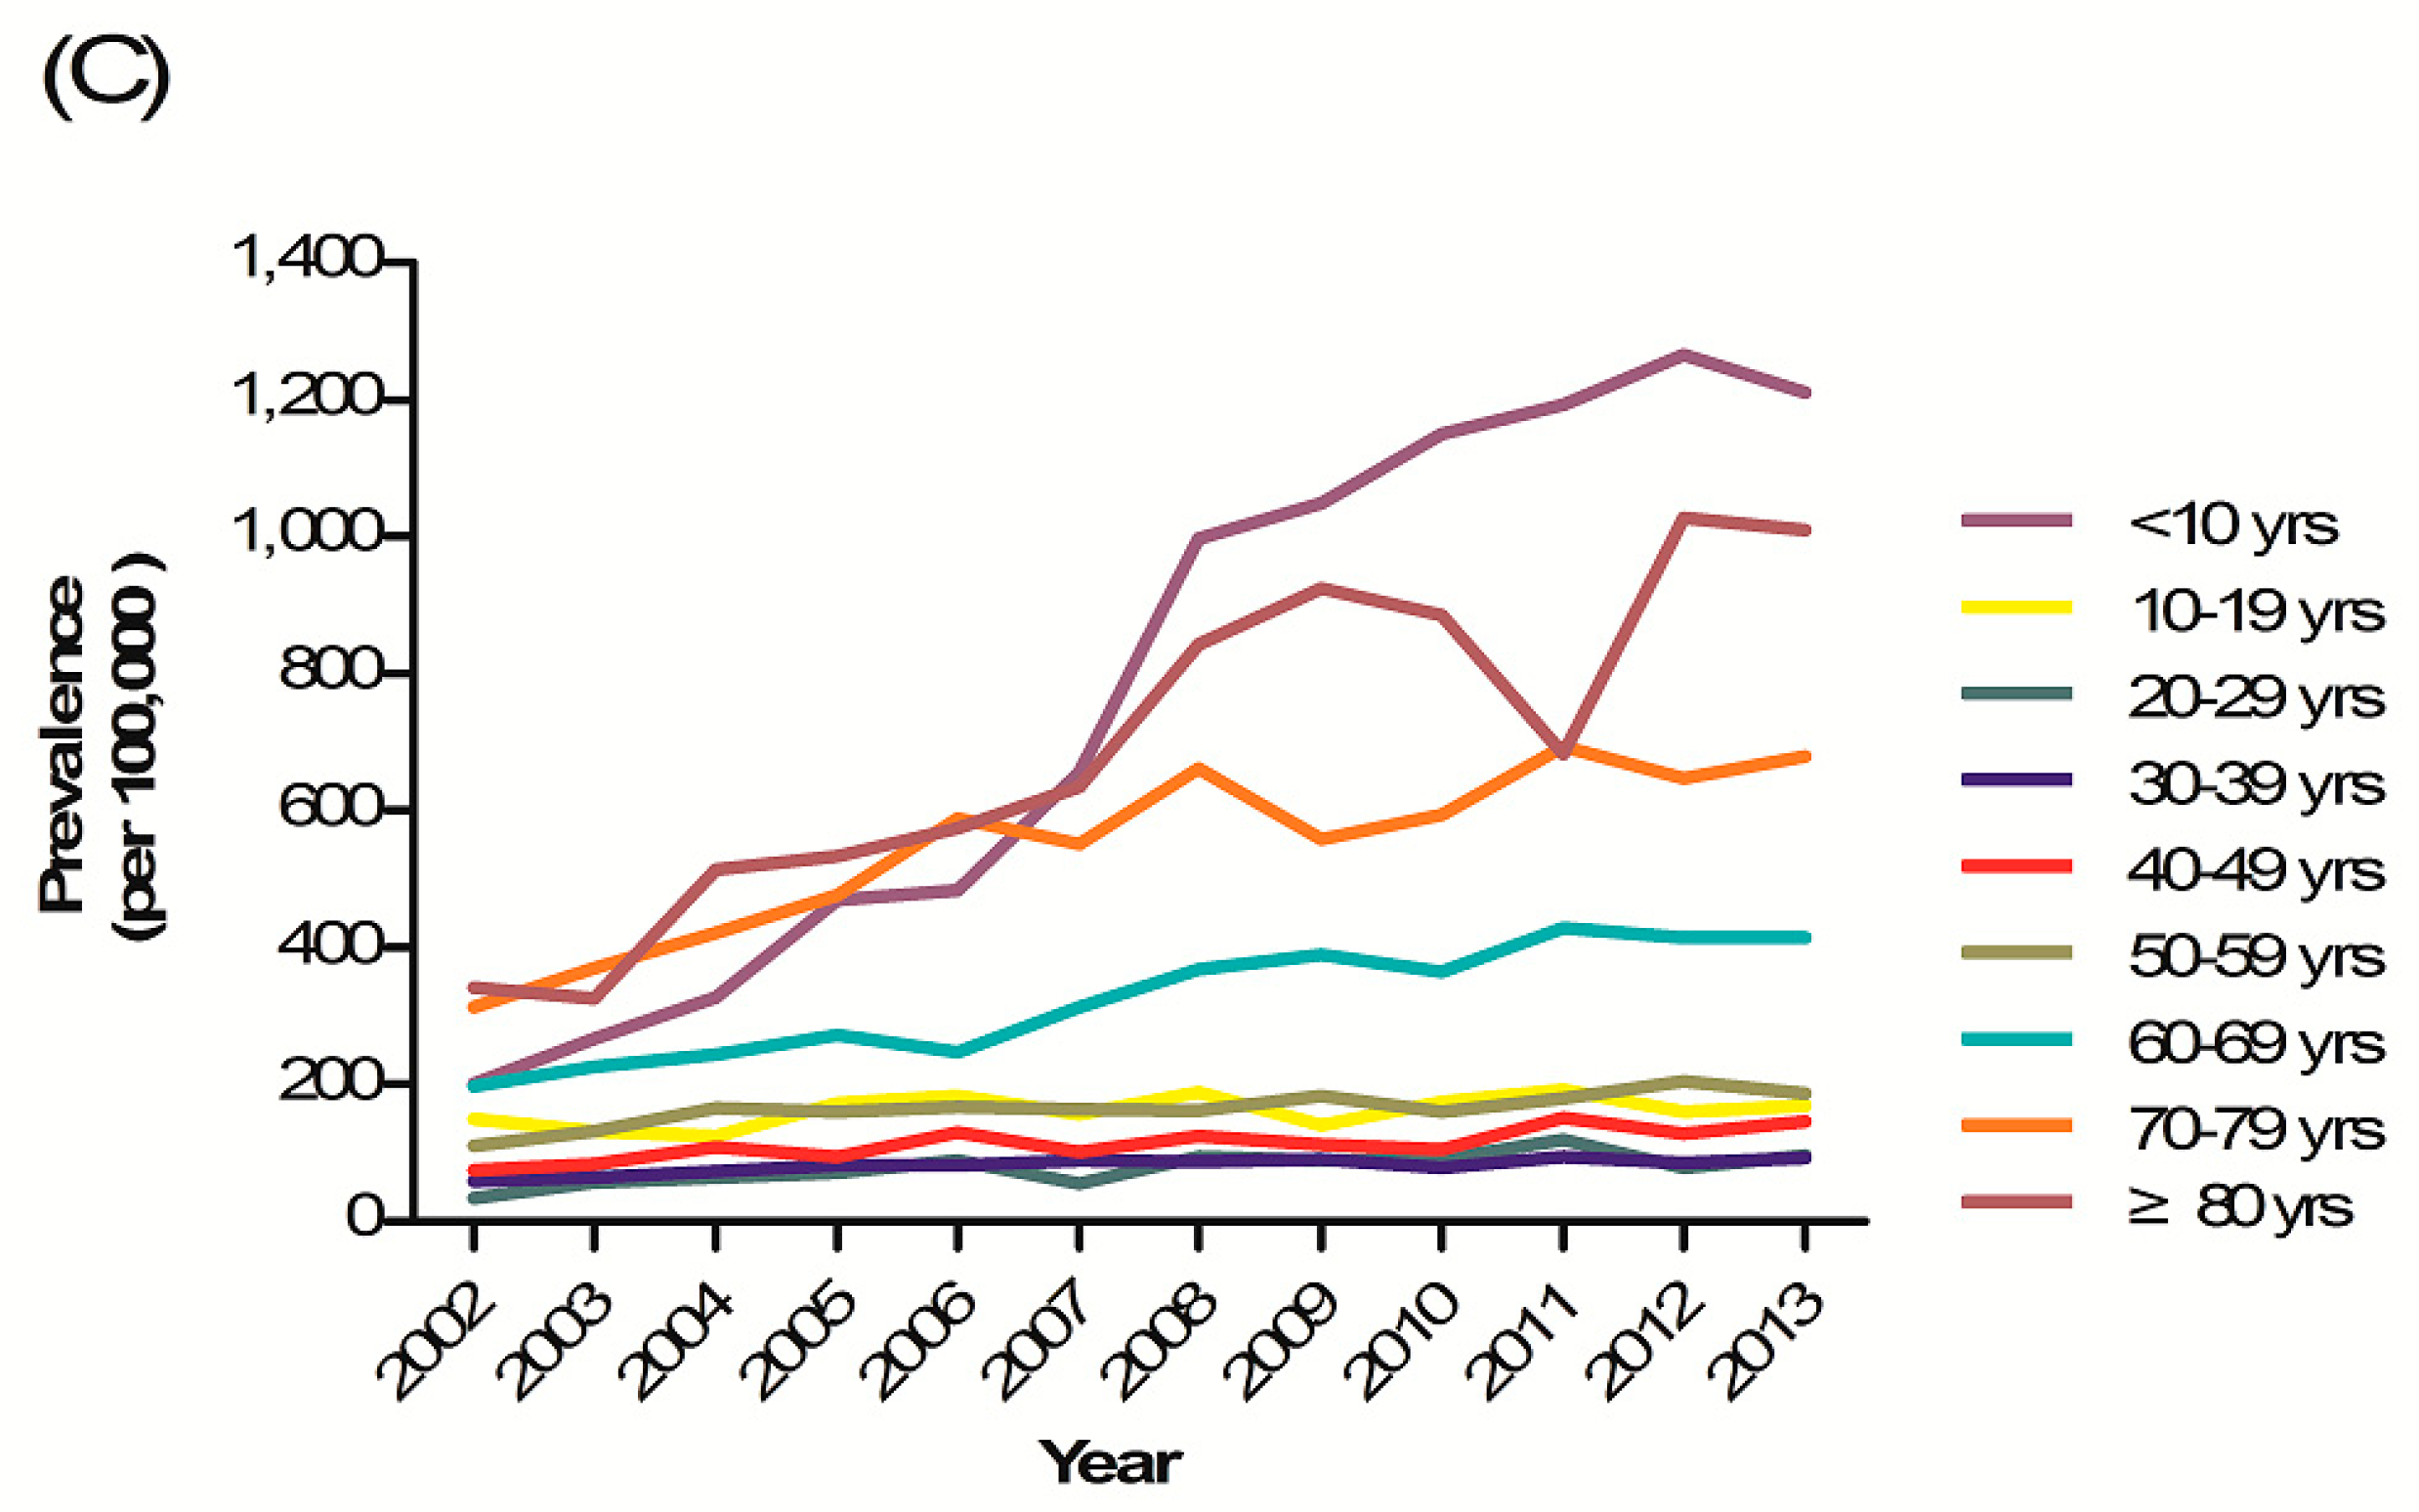
3.1. Prevalence of IDA
3.1.1. Prevalence by Sex
3.1.2. Prevalence by Age
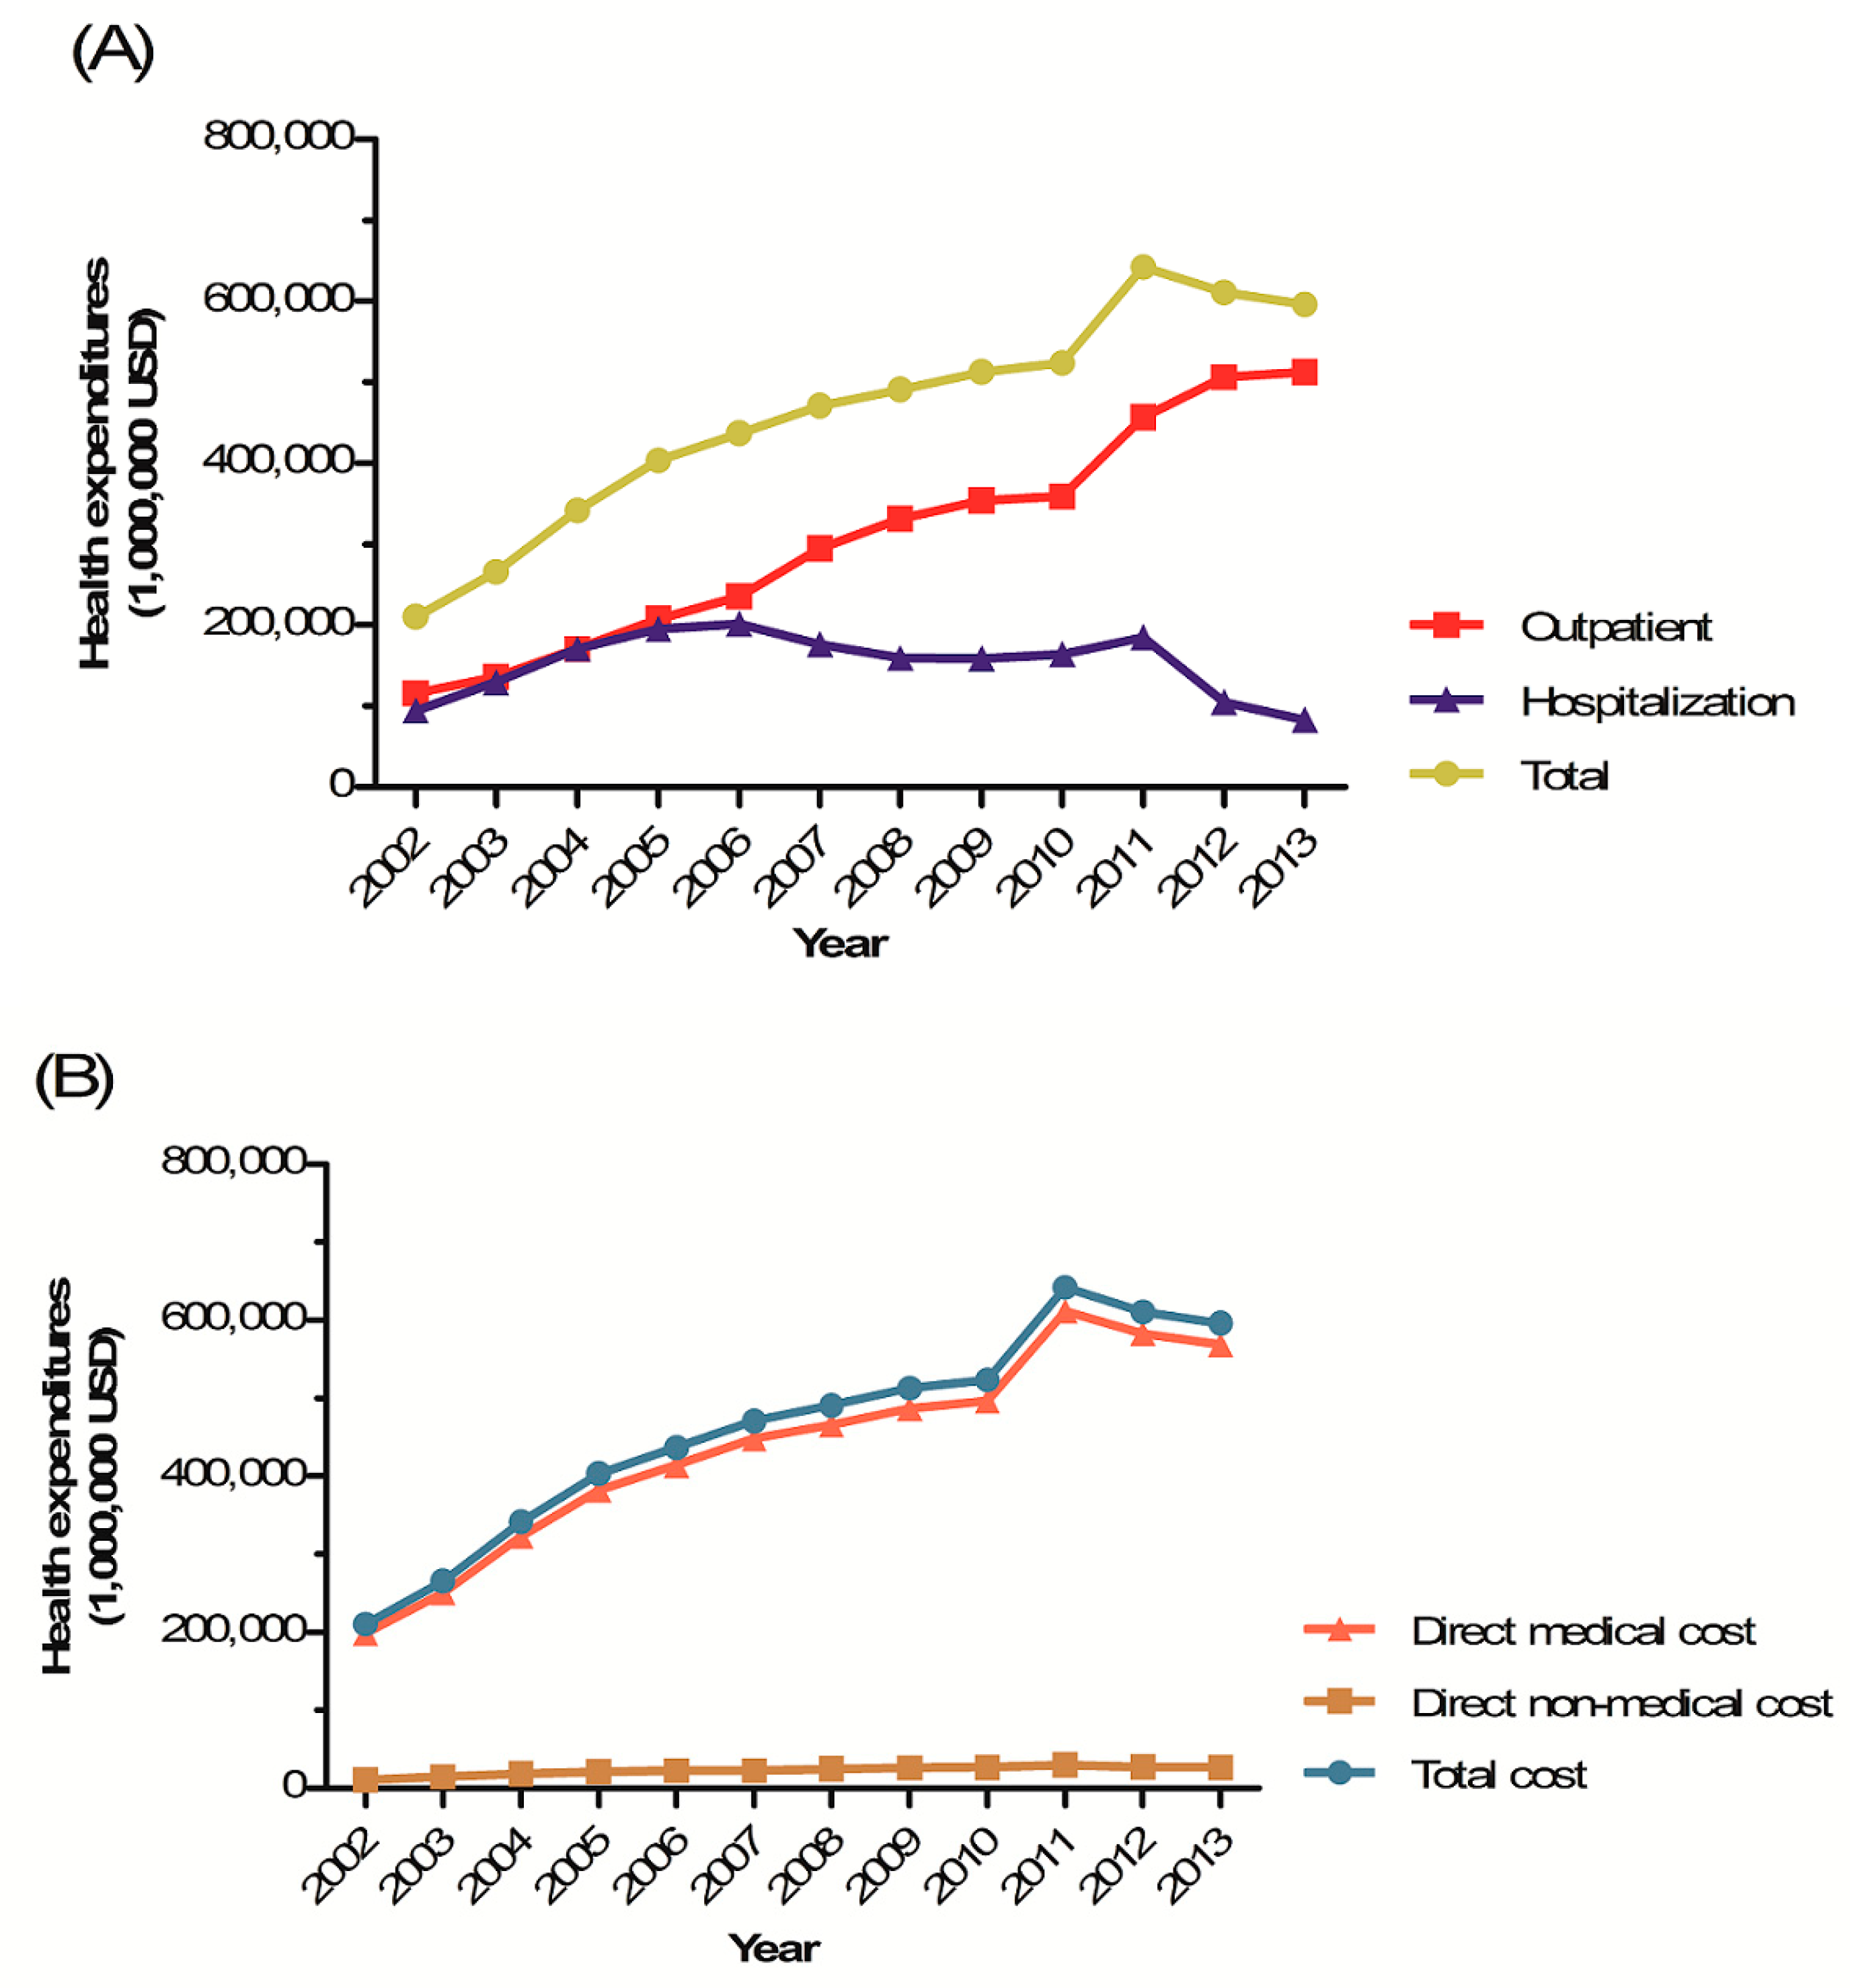
3.2. Health Expenditures of IDA
3.2.1. Total Treatment Costs
3.2.2. Direct Medical Costs
3.2.3. Direct Non-Medical Costs
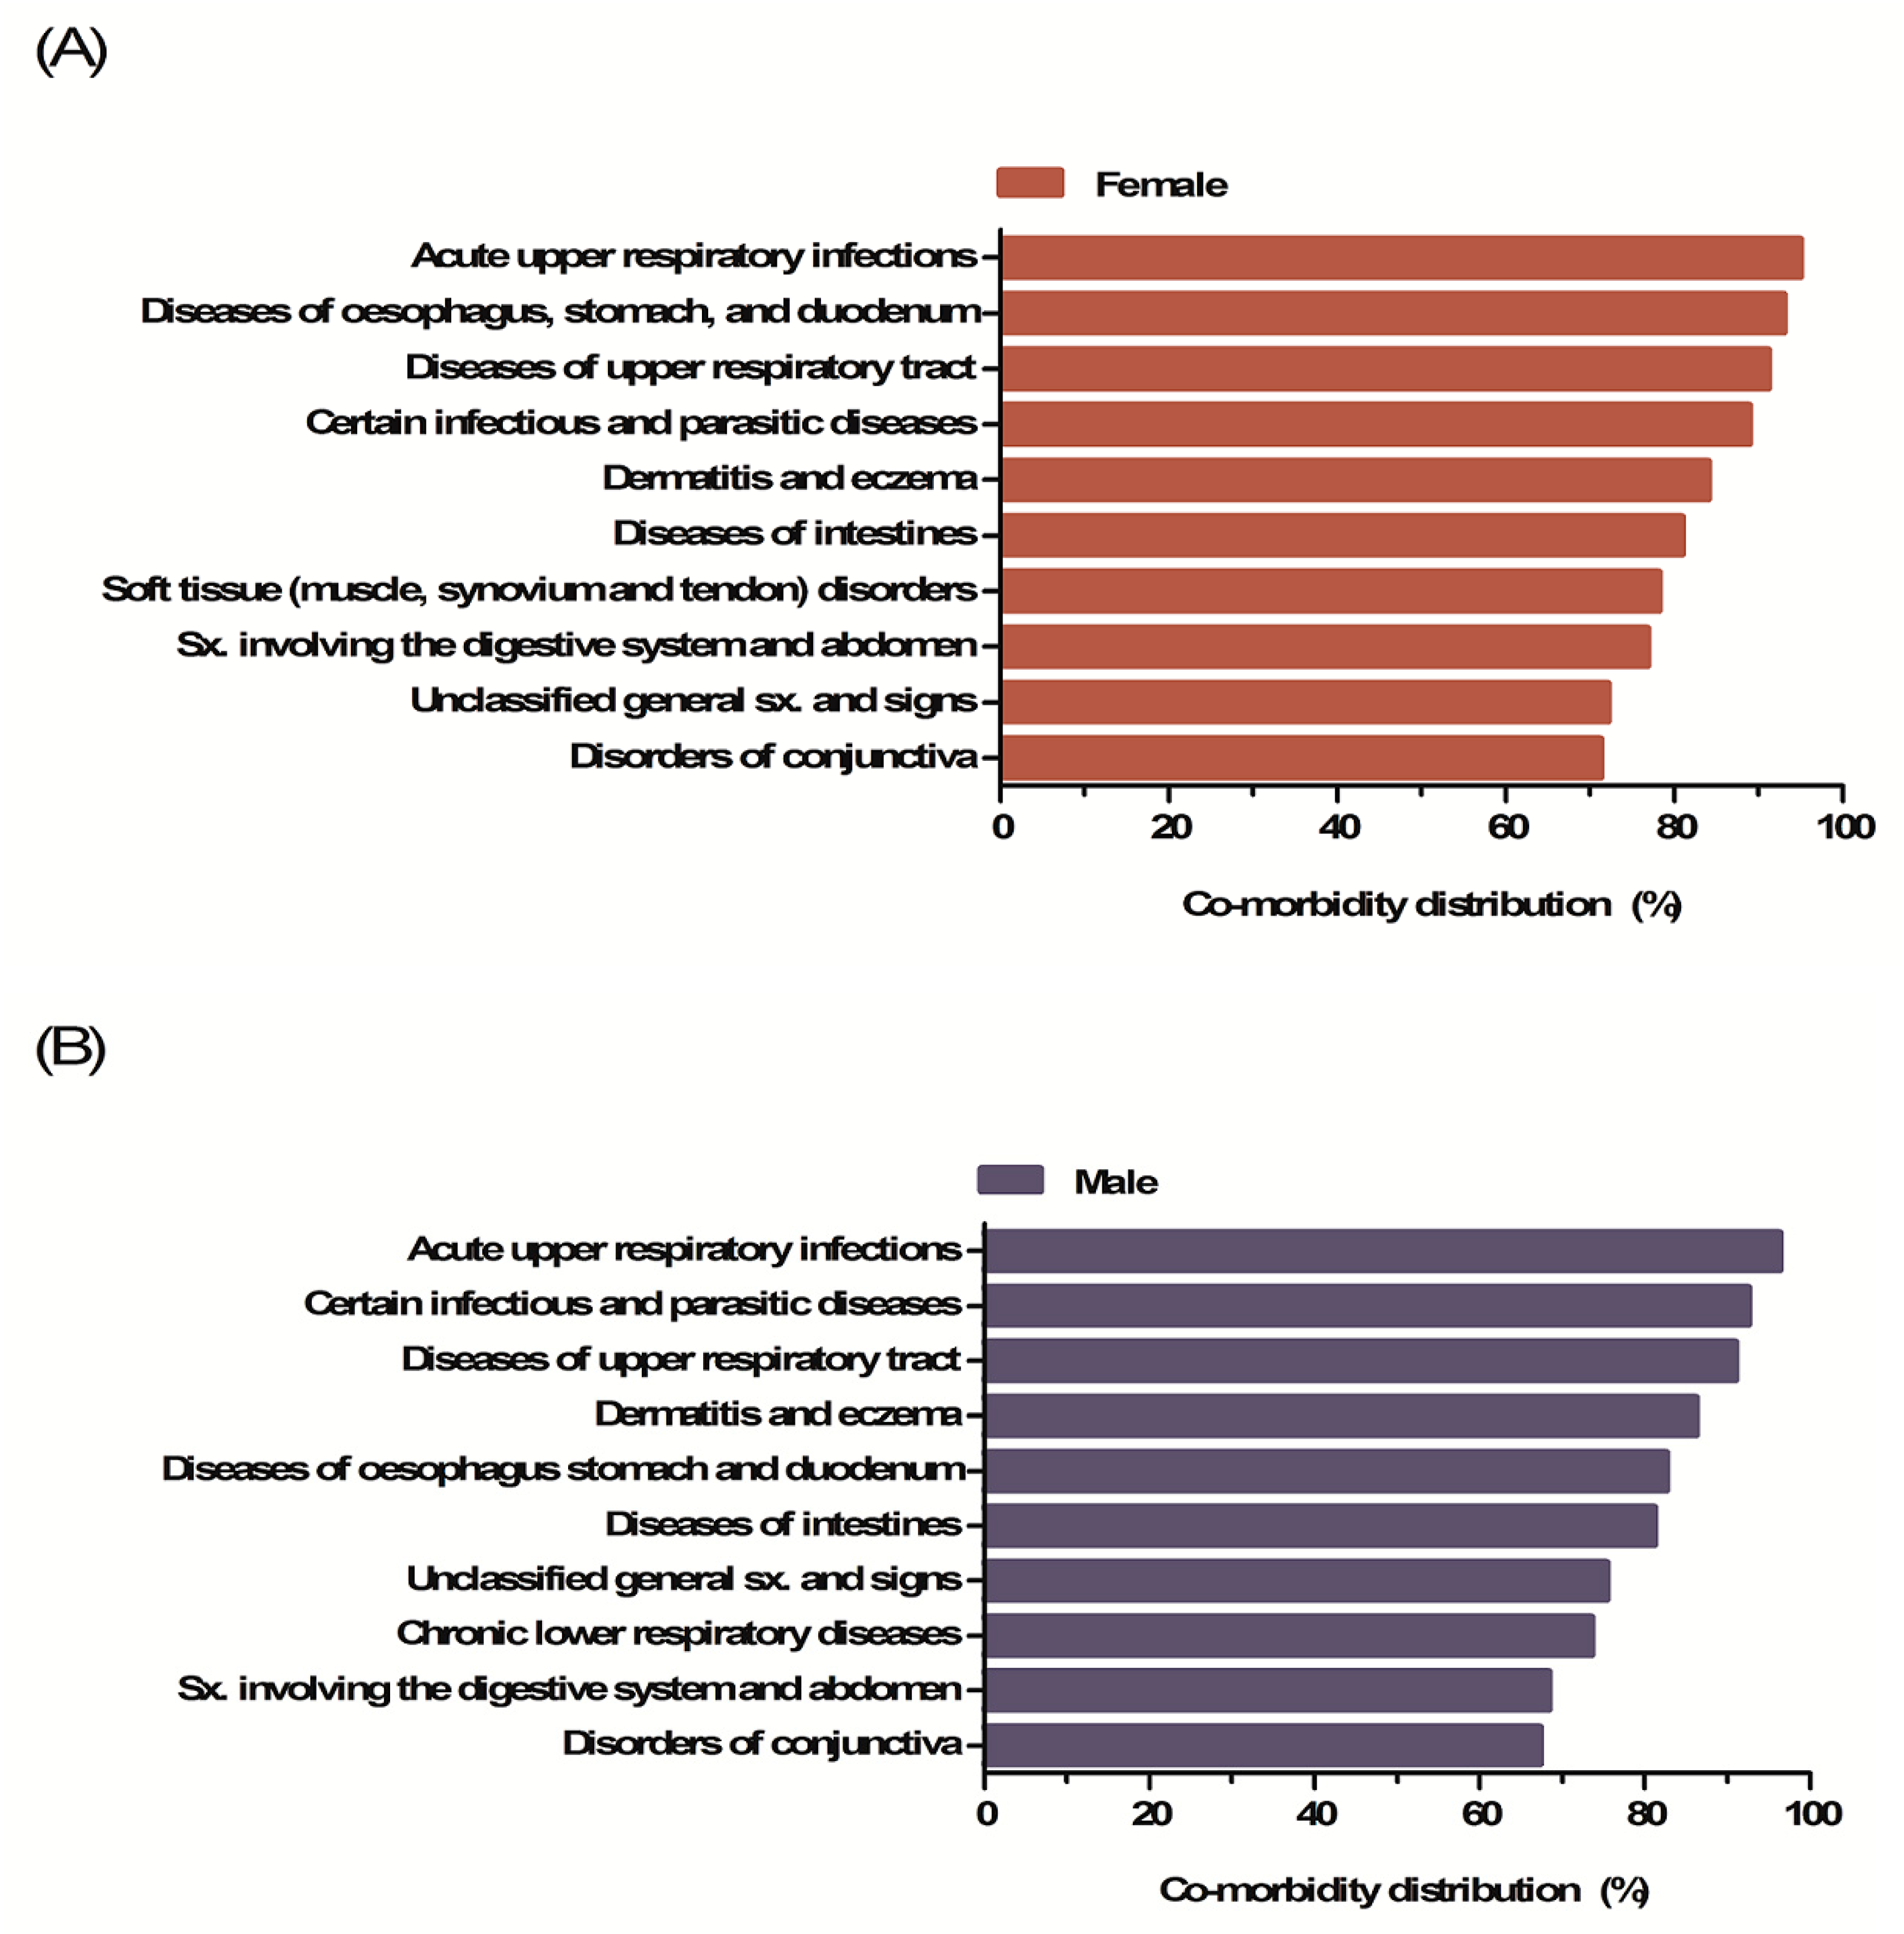
3.3. Co-Morbidities
4. Discussion
Author Contributions
Funding
Acknowledgments
Conflicts of Interest
References
- Organization WH. Global Nutrition Targets 2025: Anaemia Policy Brief; Organization WH: Geneva, Switzeland, 2014. [Google Scholar]
- De Benoist, B.; McLean, E.; Egli, I.; Cogswell, M. Worldwide Prevalence of Anaemia 1993–2005; WHO Global Database on Anaemia: Geneva, Switzerland, 2008. [Google Scholar]
- Stoltzfus, R.J.; Mullany, L.; Black, R.E. Iron deficiency anaemia. In Comparative Quantification of Health Risks: Global and Regional Burden of Disease Attributable to Selected Major Risk Factors; World Health Organization: Geneva, Switzeland, 2004. [Google Scholar]
- Kim, S.K.; Kang, H.S.; Kim, C.S.; Kim, Y.T. The prevalence of anemia and iron depletion in the population aged 10 years or older. Korean J. Hematol. 2011, 46, 196–199. [Google Scholar] [CrossRef] [PubMed] [Green Version]
- Kumar, V.; Choudhry, V.P. Iron deficiency and infection. Indian J. Pediatr. 2010, 77, 789–793. [Google Scholar] [CrossRef] [PubMed]
- Allen, L.H. Anemia and iron deficiency: Effects on pregnancy outcome. Am. J. Clin. Nutr. 2000, 71, 1280S–1284S. [Google Scholar] [CrossRef]
- Thomas, D.; Frankenberg, E. Health, nutrition and prosperity: A microeconomic perspective. Bull. World Heal. Organ. 2002, 80, 106–113. [Google Scholar]
- Lee, J.O.; Lee, J.H. Prevalence and risk factors for iron deficiency anemia in the Korean population: Results of the fifth Korea National Health and Nutrition Examination Survey. J. Korean Med. Sci. 2014, 29, 224–229. [Google Scholar] [CrossRef] [Green Version]
- Choi, C.W.; Park, K.H.; Yoon, S.Y.; Paek, C.W.; Seo, J.H.; Choi, K.M.; Kim, B.S.; Baik, S.H.; Shin, S.W.; Kim, Y.H.; et al. Prevalence of anemia in the elderly. Korean J. Med. 2001, 60, 249–253. [Google Scholar]
- Yhim, H.-Y.; Kwak, J.-Y. Treatment of iron-deficiency anemia. Korean J. Med. 2015, 89, 43. [Google Scholar] [CrossRef]
- Song, Y.J. The South Korean health care system. JMAJ 2009, 52, 206–209. [Google Scholar]
- Lee, Y.-H.; Han, K.; Ko, S.-H.; Ko, K.S.; Lee, K.-U. Taskforce team of diabetes fact sheet of the Korean diabetes association data analytic process of a nationwide population-based study using national health information database established by national health insurance service. Diabetes Metab. J. 2016, 40, 79–82. [Google Scholar] [CrossRef]
- Seong, S.C.; Kim, Y.-Y.; Khang, Y.-H.; Park, J.H.; Kang, H.-J.; Lee, H.; Do, C.-H.; Song, J.-S.; Bang, J.H.; Ha, S.; et al. Data resource profile: The national health information database of the national health insurance service in South Korea. Int. J. Epidemiol. 2017, 46, 799–800. [Google Scholar] [CrossRef] [Green Version]
- Kweon, S.; Kim, Y.; Jang, M.-J.; Kim, Y.; Kim, K.; Choi, S.; Chun, C.; Khang, Y.-H.; Oh, K. Data resource profile: The Korea National Health and Nutrition Examination Survey (KNHANES). Int. J. Epidemiology 2014, 43, 69–77. [Google Scholar] [CrossRef] [PubMed] [Green Version]
- Korean Statistical Information Service Korea National Statistical Office. Available online: http://kosis.kr/statisticsList/statisticsList_01List.jsp?vwcd=MT_ZTITLE&parentId=A (accessed on 16 March 2017).
- Park, Y.J.; Kim, J.M.; Lee, B.R.; Kim, T.H.; Lee, E.G. Annual prevalence and economic burden of genital warts in Korea: Health insurance review and assessment (HIRA) service data from 2007 to 2015. Epidemiol. Infect. 2017, 146, 177–186. [Google Scholar] [CrossRef] [PubMed] [Green Version]
- Jung, Y.-H.; Ko, S. The socioeconomic cost of diseases in Korea. J. Prev. Med. Public Health 2006, 39, 499–504. [Google Scholar] [CrossRef] [Green Version]
- Park, C.S.; Kang, H.-Y.; Kwon, I.; Kang, D.R.; Jung, H.Y. Cost-of-illness study of asthma in Korea: Estimated from the Korea National Health insurance claims database. J. Prev. Med. Public Health 2006, 39, 397–403. [Google Scholar]
- National Health Insurance Corporation. Survey of Medical Charges Paid by Patients with Health Insurance in 2010; National Health Insurance Corporation: Seoul, Korea, 2010. [Google Scholar]
- Korea Institute for Health and Social Affairs (KIHASA). The Basic Analysis Report of Korean Health Panel Survey in 2008. Available online: https://www.kihasa.re.kr/web/activity/research/view.do?menuId=39&tid=72&bid=93&division=003&ano=545 (accessed on 1 April 2017).
- Chaparro, C.M. Setting the stage for child health and development: Prevention of iron deficiency in early infancy. J. Nutr. 2008, 138, 2529–2533. [Google Scholar] [CrossRef] [Green Version]
- Joo, E.Y.; Kim, K.Y.; Kim, D.H.; Lee, J.-E.; Kim, S.K. Iron deficiency anemia in infants and toddlers. Blood Res. 2016, 51, 268–273. [Google Scholar] [CrossRef] [Green Version]
- Ministry of Health and Welfare. Korea Health Statistics 2014: Korea National Health and Nutrition Examination Survey (KNHANES VI-2); Korea Centers for Disease Control and Prevention: Cheongju, Korea, 2015. [Google Scholar]
- Kim, Y.H.; Lee, S.G.; Kim, S.H.; Song, Y.J.; Chung, J.Y.; Park, M.J. Nutritional status of Korean toddlers: From the Korean national health and nutrition examination survey 2007~2009. Korean J. Pediatr. Gastroenterol. Nutr. 2011, 14, 161. [Google Scholar] [CrossRef] [Green Version]
- Korea Health Industry Development Institute. Report on 2001 National Health and Nutrition Survey—Nutrition Survey; Korea Health Industry Development Institmdute: Seoul, Korea, 2002. [Google Scholar]
- Lim, H.S.; Kim, H.A. Effects of maternal anemia on the iron status of the cord blood and pregnancy outcomes. Korean J. Commun. Nutr. 1998, 3, 565–573. [Google Scholar]
- Yu, K.; Yoon, J.; Hahm, Y. A cross-sectional study of biochemical analysis and assessment of iron deficiency by gestational age (II). Korean J. Nutr. 1999, 32, 887–896. [Google Scholar]
- Guralnik, J.M.; Eisenstaedt, R.S.; Ferrucci, L.; Klein, H.G.; Woodman, R.C. Prevalence of anemia in persons 65 years and older in the United States: Evidence for a high rate of unexplained anemia. Blood 2004, 104, 2263–2268. [Google Scholar] [CrossRef] [Green Version]
- Artz, A.S.; Thirman, M.J. Unexplained anemia predominates despite an intensive evaluation in a racially diverse cohort of older adults from a referral anemia clinic. J. Gerontol. Ser. A Boil. Sci. Med. Sci. 2011, 66, 925–932. [Google Scholar] [CrossRef] [PubMed]
- Shin, H.-J. Clinical characteristics of hematologic diseases in the elderly. Korean J. Med. 2013, 85, 33. [Google Scholar] [CrossRef]
- Lee, J.H. Anemia in elderly Koreans. Yonsei Med. J. 2011, 52, 909–913. [Google Scholar] [CrossRef] [PubMed]
- Stoltzfus, R.J.; Dreyfuss, M.L. Guidelines for the Use of Iron Supplements to Prevent and Treat Iron Deficiency Anemia; Ilsi Press: Washington, DC, USA, 1998. [Google Scholar]
- Milman, N. Oral iron prophylaxis in pregnancy: Not too little and not too much! J. Pregnancy 2012, 2012, 1–8. [Google Scholar] [CrossRef] [Green Version]
- Milman, N. Anemia—Still a major health problem in many parts of the world! Ann. Hematol. 2011, 90, 369–377. [Google Scholar] [CrossRef] [Green Version]
- Marret, H.; Fauconnier, A.; Chabbert-Buffet, N.; Cravello, L.; Golfier, F.; Gondry, J.; Agostini, A.; Bazot, M.; Brailly-Tabard, S.; Brun, J.-L.; et al. Clinical practice guidelines on menorrhagia: Management of abnormal uterine bleeding before menopause. Eur. J. Obstet. Gynecol. Reprod. Boil. 2010, 152, 133–137. [Google Scholar] [CrossRef]
- Albers, J.R.; Hull, S.K.; Wesley, R.M. Abnormal uterine bleeding. Am. Fam. Phys. 2004, 69, 1915–1926. [Google Scholar]
- Brigham, E.P.; McCormack, M.C.; Takemoto, C.M.; Matsui, E.C. Iron status is associated with asthma and lung function in US women. PLoS ONE 2015, 10, e0117545. [Google Scholar] [CrossRef] [Green Version]
- Bucca, C.; Culla, B.; Brussino, L.; Ricciardolo, F.L.; Cicolin, A.; Heffler, E.; Bugiani, M.; Rolla, G. Effect of iron supplementation in women with chronic cough and iron deficiency. Int. J. Clin. Pr. 2012, 66, 1095–1100. [Google Scholar] [CrossRef]
- Ramakrishnan, K.; Harish, P.S. Hemoglobin level as a risk factor for lower respiratory tract infections. Indian J. Pediatr. 2006, 73, 881–883. [Google Scholar] [CrossRef]
- Rennie, J.S.; Macdonald, D.G.; Dagg, J.H. Quantitative analysis of human buccal epithelium in iron deficiency anaemia. J. Oral Pathol. Med. 1982, 11, 39–46. [Google Scholar] [CrossRef] [PubMed]
- Bermejo, F.; García-López, S. A guide to diagnosis of iron deficiency and iron deficiency anemia in digestive diseases. World J. Gastroenterol. 2009, 15, 4638–4643. [Google Scholar] [CrossRef] [PubMed]
- Kepczyk, M.T.; Kadakia, C.S.C. Prospective evaluation of gastrointestinal tract in patients with iron-deficiency anemia. Dig. Dis. Sci. 1995, 40, 1283–1289. [Google Scholar] [CrossRef] [PubMed]


| Variable | 2002 | 2003 | 2004 | 2005 | 2006 | 2007 | 2008 | 2009 | 2010 | 2011 | 2012 | 2013 |
|---|---|---|---|---|---|---|---|---|---|---|---|---|
| No. of Total population * | ||||||||||||
| All | 1,025,340 | 1,017,468 | 1,016,580 | 1,016,820 | 1,002,005 | 1,020,743 | 1,000,785 | 998,527 | 1,006,481 | 1,011,123 | 1,014,730 | 1,014,730 |
| Male | 513,258 | 509,212 | 508,223 | 508,317 | 500,808 | 510,009 | 501,019 | 499,689 | 503,428 | 505,614 | 507,289 | 507,289 |
| Female | 512,082 | 508,256 | 508,357 | 508,503 | 501,197 | 510,734 | 499,766 | 498,838 | 503,053 | 505,509 | 507,441 | 507,441 |
| No. of IDA population ** | ||||||||||||
| All | 3188 | 3806 | 4467 | 5049 | 5289 | 5730 | 6390 | 6575 | 6757 | 7286 | 7468 | 7325 |
| Male | 579 | 671 | 780 | 917 | 981 | 1047 | 1325 | 1298 | 1331 | 1493 | 1497 | 1523 |
| Female | 2609 | 3135 | 3687 | 4132 | 4308 | 4683 | 5065 | 5277 | 5426 | 5793 | 5971 | 5802 |
| Variable | Age-Standardized Prevalence Rates per 100,000 * (%) | ||||||||||||||
|---|---|---|---|---|---|---|---|---|---|---|---|---|---|---|---|
| 2002 | 2003 | 2004 | 2005 | 2006 | 2007 | 2008 | 2009 | 2010 | 2011 | 2012 | 2013 | APC | (95% CI) | p-Value | |
| No. of IDA patients (%) | |||||||||||||||
| All | 313.6 | 374.0 | 440.9 | 495.6 | 525.1 | 559.2 | 635.2 | 656.1 | 674.3 | 724.4 | 736.1 | 718.9 | 7.6 | (5.9, 9.4) | <0.001 |
| Male | 117.7 | 134.7 | 157.0 | 180.7 | 197.4 | 204.6 | 261.6 | 258.2 | 265.5 | 296.6 | 291.7 | 293.9 | 8.9 | (7.1, 10.8) | <0.001 |
| Female | 507.6 | 611.9 | 722.5 | 808.5 | 851.6 | 911.8 | 1008.5 | 1053.7 | 1083.7 | 1153.6 | 1182.9 | 1145.8 | 7.4 | (5.6, 9.2) | <0.001 |
| <10 | 188.9 | 279.0 | 306.5 | 415.2 | 494.4 | 610.0 | 885.5 | 1007.5 | 1057.9 | 1109.3 | 1173.1 | 1142.6 | 18.7 | (14.6, 22.8) | <0.001 |
| 10–19 | 266.3 | 261.2 | 296.3 | 322.9 | 347.1 | 321.5 | 379.9 | 392.9 | 409.7 | 469.0 | 481.9 | 460.2 | 5.9 | (4.9, 6.9) | <0.001 |
| 20–29 | 292.7 | 328.9 | 381.7 | 402.7 | 463.9 | 429.9 | 455.6 | 451.2 | 478.2 | 465.4 | 468.5 | 474.5 | 3.8 | (2.1, 5.5) | <0.001 |
| 30–39 | 415.0 | 469.8 | 564.2 | 651.9 | 643.8 | 694.8 | 715.1 | 746.8 | 714.2 | 739.6 | 699.4 | 686.1 | 4.3 | (2, 6.6) | 0.002 |
| 40–49 | 405.2 | 555.6 | 652.8 | 708.7 | 768.8 | 827.9 | 949.1 | 934.3 | 991.2 | 1075.5 | 1067.5 | 1094.1 | 8.3 | (6.1, 10.5) | <0.001 |
| 50–59 | 273.9 | 300.1 | 379.4 | 430.4 | 454.1 | 476.3 | 502.4 | 506.5 | 523.8 | 555.7 | 594.0 | 526.7 | 6.3 | (4.2, 8.4) | <0.001 |
| 60–69 | 225.1 | 305.9 | 305.4 | 363.0 | 341.3 | 402.9 | 446.4 | 506.4 | 464.7 | 556.5 | 540.1 | 511.6 | 7.6 | (5.6, 9.6) | <0.001 |
| 70–79 | 336.5 | 369.6 | 480.9 | 528.6 | 536.9 | 572.1 | 690.9 | 638.7 | 714.7 | 819.4 | 885.3 | 811.7 | 8.6 | (6.8, 10.3) | <0.001 |
| ≥80 | 302.7 | 328.7 | 469.7 | 465.2 | 443.9 | 595.6 | 668.1 | 829.9 | 837.1 | 946.0 | 1149.7 | 1191.0 | 13.5 | (11.7, 15.3) | <0.001 |
| No. of IDA patients among males (%) | |||||||||||||||
| <10 | 201.6 | 267.1 | 327.1 | 468.0 | 483.7 | 655.4 | 996.9 | 1048.3 | 1148.2 | 1193.1 | 1264.1 | 1209.5 | 19.1 | (14.8, 23.6) | <0.001 |
| 10–19 | 149.1 | 130.7 | 124.0 | 172.4 | 182.6 | 156.8 | 187.9 | 140.1 | 174.7 | 191.6 | 159.3 | 168.4 | 2.0 | (−0.4, 4.5) | 0.098 |
| 20–29 | 34.7 | 58.2 | 65.2 | 71.4 | 89.2 | 55.6 | 95.3 | 89.6 | 91.6 | 118.7 | 78.6 | 95.9 | 7.2 | (2.8, 11.8) | 0.004 |
| 30–39 | 58.4 | 64.4 | 73.5 | 81.0 | 82.4 | 87.7 | 86.9 | 90.1 | 78.2 | 95.2 | 85.3 | 93.1 | 3.4 | (1.7, 5.1) | 0.001 |
| 40–49 | 74.7 | 83.6 | 109.5 | 93.9 | 130.2 | 101.7 | 123.8 | 112.6 | 104.9 | 151.0 | 127.6 | 147.0 | 4.9 | (2.4, 7.6) | 0.001 |
| 50–59 | 109.8 | 131.6 | 164.6 | 159.7 | 167.4 | 164.0 | 161.5 | 182.0 | 160.9 | 178.8 | 203.4 | 186.6 | 3.8 | (1.9, 5.7) | 0.001 |
| 60–69 | 197.9 | 226.3 | 242.9 | 272.6 | 247.0 | 313.8 | 367.9 | 389.5 | 363.5 | 428.3 | 415.2 | 413.8 | 7.4 | (5.8, 9.1) | <0.001 |
| 70–79 | 311.6 | 369.8 | 422.2 | 475.5 | 587.4 | 550.4 | 660.9 | 557.4 | 593.3 | 693.0 | 647.3 | 679.3 | 6.6 | (4.2, 9) | <0.001 |
| ≥80 | 341.4 | 324.4 | 512.8 | 532.1 | 573.2 | 633.8 | 841.4 | 922.9 | 884.7 | 682.7 | 1027.2 | 1010.2 | 10.5 | (7.1, 14) | 0.001 |
| No. of IDA patients among females (%) | |||||||||||||||
| <10 | 174.8 | 292.1 | 283.8 | 357.4 | 506.1 | 560.5 | 764.3 | 963.4 | 960.6 | 1019.3 | 1075.9 | 1071.3 | 18.2 | (14.2, 22.3) | <0.001 |
| 10–19 | 395.6 | 406.5 | 489.3 | 491.8 | 532.6 | 506.7 | 595.0 | 676.9 | 672.9 | 778.7 | 841.1 | 783.4 | 7.2 | (6, 8.3) | <0.001 |
| 20–29 | 556.3 | 605.1 | 703.6 | 742.5 | 848.8 | 815.8 | 831.1 | 829.8 | 886.9 | 836.3 | 889.1 | 887.5 | 3.8 | (2.2, 5.4) | <0.001 |
| 30–39 | 787.7 | 890.6 | 1072.1 | 1241.4 | 1220.6 | 1320.9 | 1370.9 | 1430.9 | 1375.4 | 1408.0 | 1335.8 | 1303.2 | 4.3 | (2, 6.7) | 0.002 |
| 40–49 | 747.5 | 1048.7 | 1218.5 | 1351.4 | 1439.3 | 1582.3 | 1804.0 | 1784.5 | 1911.5 | 2038.7 | 2045.9 | 2072.5 | 8.5 | (6.2, 10.9) | <0.001 |
| 50–59 | 435.9 | 467.8 | 595.4 | 700.5 | 740.9 | 789.8 | 847.1 | 834.9 | 889.1 | 934.5 | 987.7 | 872.5 | 6.9 | (4.6, 9.3) | <0.001 |
| 60–69 | 247.8 | 373.8 | 359.0 | 441.3 | 424.2 | 482.0 | 516.9 | 612.5 | 557.9 | 675.4 | 656.9 | 603.4 | 7.9 | (5.5, 10.3) | <0.001 |
| 70–79 | 350.9 | 369.5 | 516.5 | 561.7 | 505.1 | 586.2 | 711.2 | 695.0 | 800.2 | 910.0 | 1060.3 | 910.4 | 9.8 | (7.9, 11.9) | <0.001 |
| ≥80 | 287.1 | 330.5 | 451.5 | 437.2 | 389.3 | 579.6 | 595.5 | 790.7 | 816.9 | 1057.2 | 1201.5 | 1268.0 | 14.7 | (12.4, 17) | <0.001 |
| Variable | PRR | ||||||||||||||
|---|---|---|---|---|---|---|---|---|---|---|---|---|---|---|---|
| 2002 | 2003 | 2004 | 2005 | 2006 | 2007 | 2008 | 2009 | 2010 | 2011 | 2012 | 2013 | Slope | (95% CI) | p-Value | |
| No. of IDA patients (%) | |||||||||||||||
| All | 4.52 | 4.68 | 4.73 | 4.50 | 4.39 | 4.47 | 3.83 | 4.07 | 4.08 | 3.88 | 3.99 | 3.81 | −0.08 | (−0.11, −0.05) | <0.001 |
| <10 | 0.87 | 1.09 | 0.87 | 0.76 | 1.05 | 0.86 | 0.77 | 0.92 | 0.84 | 0.85 | 0.85 | 0.89 | −0.01 | (−0.03, 0.01) | 0.378 |
| 10–19 | 2.65 | 3.11 | 3.95 | 2.85 | 2.92 | 3.23 | 3.17 | 4.83 | 3.85 | 4.07 | 5.28 | 4.65 | 0.19 | (0.08, 0.29) | 0.003 |
| 20–29 | 16.01 | 10.39 | 10.80 | 10.40 | 9.52 | 14.68 | 8.73 | 9.26 | 9.68 | 7.05 | 11.31 | 9.25 | −0.36 | (−0.78, 0.06) | 0.083 |
| 30–39 | 13.49 | 13.82 | 14.59 | 15.33 | 14.81 | 15.06 | 15.78 | 15.89 | 17.58 | 14.79 | 15.65 | 14.01 | 0.14 | (−0.06, 0.33) | 0.151 |
| 40–49 | 10.00 | 12.55 | 11.13 | 14.39 | 11.05 | 15.56 | 14.58 | 15.85 | 18.22 | 13.51 | 16.03 | 14.09 | 0.44 | (0.09, 0.79) | 0.02 |
| 50–59 | 3.97 | 3.55 | 3.62 | 4.39 | 4.43 | 4.82 | 5.25 | 4.59 | 5.52 | 5.23 | 4.86 | 4.68 | 0.13 | (0.05, 0.21) | 0.005 |
| 60–69 | 1.25 | 1.65 | 1.48 | 1.62 | 1.72 | 1.54 | 1.40 | 1.57 | 1.53 | 1.58 | 1.58 | 1.46 | 0.00 | (−0.02, 0.03) | 0.667 |
| 70–79 | 1.13 | 1.00 | 1.22 | 1.18 | 0.86 | 1.07 | 1.08 | 1.25 | 1.35 | 1.31 | 1.64 | 1.34 | 0.04 | (0.01, 0.07) | 0.016 |
| ≥80 | 0.84 | 1.02 | 0.88 | 0.82 | 0.68 | 0.91 | 0.71 | 0.86 | 0.92 | 1.55 | 1.17 | 1.26 | 0.04 | (0.00, 0.08) | 0.048 |
| Year | Category | Direct Medical Cost (①) | Direct Non-Medical Cost (②) | Total Cost | ||||
|---|---|---|---|---|---|---|---|---|
| Paid by Insurer and Patients | Prescribed Pharmaceuticals (Hospital) | Prescribed Pharmaceuticals (Pharmacy) | Total Direct Medical Cost | Traffic Expense | Total Cost (① + ②) | Per Capita | ||
| Outpatient | 78,081 | 850 | 31,957 | 110,888 | 4760 | 115,648 | 42 | |
| 2002 | Hospitalization | 71,137 | 4194 | 12,763 | 88,094 | 6461 | 94,555 | 100 |
| Total | 149,218 | 5044 | 44,720 | 198,982 | 11,221 | 210,203 | 66 | |
| Outpatient | 89,058 | 2050 | 38,954 | 130,062 | 5978 | 136,040 | 43 | |
| 2003 | Hospitalization | 94,958 | 5003 | 20,650 | 120,611 | 8781 | 129,392 | 101 |
| Total | 184,017 | 7054 | 59,604 | 250,675 | 14,760 | 265,435 | 70 | |
| Outpatient | 111,484 | 2730 | 49,281 | 163,495 | 7640 | 171,135 | 46 | |
| 2004 | Hospitalization | 124,980 | 9985 | 24,609 | 159,574 | 11,257 | 170,831 | 116 |
| Total | 236,464 | 12,715 | 73,891 | 323,070 | 18,898 | 341,968 | 77 | |
| Outpatient | 137,784 | 2571 | 58,248 | 198,603 | 9316 | 207,919 | 48 | |
| 2005 | Hospitalization | 148,801 | 10,436 | 24,223 | 183,460 | 12,198 | 195,658 | 126 |
| Total | 286,585 | 13,008 | 82,472 | 382,065 | 21,514 | 403,579 | 80 | |
| Outpatient | 153,628 | 3997 | 67,726 | 225,351 | 10,517 | 235,868 | 52 | |
| 2006 | Hospitalization | 152,398 | 9168 | 27,536 | 189,102 | 12,347 | 201,449 | 131 |
| Total | 306,027 | 13,165 | 95,262 | 414,454 | 22,865 | 437,319 | 83 | |
| Outpatient | 188,227 | 9566 | 83,559 | 281,352 | 13,691 | 295,043 | 57 | |
| 2007 | Hospitalization | 138,447 | 9040 | 19,244 | 166,731 | 9481 | 176,212 | 156 |
| Total | 326,674 | 18,607 | 102,803 | 448,084 | 23,172 | 471,256 | 82 | |
| Outpatient | 207,482 | 7186 | 99,692 | 314,360 | 17,109 | 331,469 | 56 | |
| 2008 | Hospitalization | 126,886 | 11,622 | 13,359 | 151,867 | 7576 | 159,443 | 199 |
| Total | 334,368 | 18,808 | 113,052 | 466,228 | 24,686 | 490,914 | 77 | |
| Outpatient | 226,668 | 7983 | 101,786 | 336,437 | 17,975 | 354,412 | 58 | |
| 2009 | Hospitalization | 128,694 | 7186 | 14,725 | 150,605 | 8127 | 158,732 | 186 |
| Total | 355,363 | 15,170 | 116,512 | 487,045 | 26,103 | 513,148 | 78 | |
| Outpatient | 229,509 | 2788 | 108,159 | 340,456 | 18,623 | 359,079 | 57 | |
| 2010 | Hospitalization | 131,289 | 8186 | 16,737 | 156,212 | 8386 | 164,598 | 201 |
| Total | 360,799 | 10,974 | 124,896 | 496,669 | 27,009 | 523,678 | 78 | |
| Outpatient | 299,233 | 12,686 | 122,536 | 434,455 | 22,540 | 456,995 | 67 | |
| 2011 | Hospitalization | 152,304 | 11,759 | 13,164 | 177,227 | 7835 | 185,062 | 240 |
| Total | 451,538 | 24,445 | 135,700 | 611,683 | 30,375 | 642,058 | 88 | |
| Outpatient | 338,735 | 11,575 | 129,016 | 479,326 | 26,847 | 506,173 | 68 | |
| 2012 | Hospitalization | 96,617 | 7167 | 34 | 103,818 | 1042 | 104,860 | 1008 |
| Total | 435,353 | 18,743 | 129,050 | 583,146 | 27,890 | 611,036 | 82 | |
| Outpatient | 356,314 | 11,739 | 118,925 | 486,978 | 26,093 | 513,071 | 71 | |
| 2013 | Hospitalization | 78,594 | 3576 | 7 | 82,177 | 1005 | 83,182 | 990 |
| Total | 434,909 | 15,316 | 118,932 | 569,157 | 27,099 | 596,256 | 81 | |
© 2020 by the authors. Licensee MDPI, Basel, Switzerland. This article is an open access article distributed under the terms and conditions of the Creative Commons Attribution (CC BY) license (http://creativecommons.org/licenses/by/4.0/).
Share and Cite
Park, Y.-J.; Lim, H.-S.; Kim, T.-H. Annual Prevalence, Health Expenditures, and Co-Morbidities Trend of Iron Deficiency Anemia in Korea: National Health Insurance Service Data from 2002 to 2013. Int. J. Environ. Res. Public Health 2020, 17, 4433. https://doi.org/10.3390/ijerph17124433
Park Y-J, Lim H-S, Kim T-H. Annual Prevalence, Health Expenditures, and Co-Morbidities Trend of Iron Deficiency Anemia in Korea: National Health Insurance Service Data from 2002 to 2013. International Journal of Environmental Research and Public Health. 2020; 17(12):4433. https://doi.org/10.3390/ijerph17124433
Chicago/Turabian StylePark, Yoo-Jin, Hee-Sook Lim, and Tae-Hee Kim. 2020. "Annual Prevalence, Health Expenditures, and Co-Morbidities Trend of Iron Deficiency Anemia in Korea: National Health Insurance Service Data from 2002 to 2013" International Journal of Environmental Research and Public Health 17, no. 12: 4433. https://doi.org/10.3390/ijerph17124433
APA StylePark, Y.-J., Lim, H.-S., & Kim, T.-H. (2020). Annual Prevalence, Health Expenditures, and Co-Morbidities Trend of Iron Deficiency Anemia in Korea: National Health Insurance Service Data from 2002 to 2013. International Journal of Environmental Research and Public Health, 17(12), 4433. https://doi.org/10.3390/ijerph17124433