Article

Effects of Climate Change on Land Cover Change and Vegetation Dynamics in Xinjiang, China

1
School of Environment Science and Spatial Informatics, China University of Mining and Technology, Xuzhou 221116, China
2
School of Public Policy and Management, China University of Mining and Technology, Xuzhou 221116, China
3
Low Carbon Energy Institute, China University of Mining and Technology, Xuzhou 221008, China
*
Authors to whom correspondence should be addressed.
Int. J. Environ. Res. Public Health 2020, 17(13), 4865; https://doi.org/10.3390/ijerph17134865
Submission received: 18 June 2020 / Revised: 2 July 2020 / Accepted: 3 July 2020 / Published: 6 July 2020
(This article belongs to the Section Environment and Applied Ecology)

Abstract

:
Since the Silk-road Economic belt initiatives were proposed, Xinjiang has provided a vital strategic link between China and Central Asia and even Eurasia. However, owing to the weak and vulnerable ecosystem in this arid region, even a slight climate change would probably disrupt vegetation dynamics and land cover change. Thus, there is an urgent need to determine the Normalized Difference Vegetation Index (NDVI) and Land-use/Land-cover (LULC) responses to climate change. Here, the extreme-point symmetric mode decomposition (ESMD) method and linear regression method (LRM) were applied to recognize the variation trends of the NDVI, temperature, and precipitation between the growing season and other seasons. Combining the transfer matrix of LULC, the Pearson correlation analysis was utilized to reveal the response of NDVI to climate change and climate extremes. The results showed that: (1) Extreme temperature showed greater variation than extreme precipitation. Both the ESMD and the LRM exhibited an increased volatility trend for the NDVI, with the significant improvement regions mainly located in the margin of basins. (2) Since climate change had a warming trend, the permanent snow has been reduced by 20,436 km2. The NDVI has a higher correlation to precipitation than temperature. Furthermore, the humid trend could provide more suitable conditions for vegetation growth, but the warm trend might prevent vegetation growth. Spatially, the response of the NDVI in North Xinjiang (NXC) was more sensitive to precipitation than that in South Xinjiang (SXC). Seasonally, the NDVI has a greater correlation to precipitation in spring and summer, but the opposite occurs in autumn. (3) The response of the NDVI to extreme precipitation was stronger than the response to extreme temperature. The reduction in diurnal temperature variation was beneficial to vegetation growth. Therefore, continuous concentrated precipitation and higher night-time-temperatures could enhance vegetation growth in Xinjiang. This study could enrich the understanding of the response of land cover change and vegetation dynamics to climate extremes and provide scientific support for eco-environment sustainable management in the arid regions.

1. Introduction

Arid and semi-arid regions encompass nearly 40% of the Earth’s land surface, where about 20% of the human population of the world live [1]. As one of the largest arid and semi-arid regions in the Northern hemisphere, Central Asia is particularly influenced by drought [2,3,4]. Vegetation dynamics could reflect the changes in the ecological environment to some extent [5,6,7], and it might be extremely sensitive to climate change in fragile eco-environment [8,9,10]. As a previous study has found, the contribution of climate change to grassland degradation could reach up to 47.9% in the arid and semi-arid regions of China [11]. Therefore, research on vegetation dynamics and its response to climate change remains a vital strategic task in arid and semi-arid regions [12,13,14,15,16].
The Normalized Difference Vegetation Index (NDVI) has been regarded as a reliable index to monitor vegetation dynamics [17,18,19]. Additionally, the NDVI product supported by the Moderate-resolution Imaging Spectroradiometer (MODIS) has been used to widely prove the effectiveness of vegetation data collection and analysis from regional to global scales [20,21,22]. Consequently, a considerable amount of research has been conducted to quantitatively analyze the responses of vegetation activity and climate change, and great progress has been achieved in this area [23]. Recent studies point out that precipitation is considered to be the vital limiting factor in vegetation growth in Central Asia [8,24]. Furthermore, some studies have also suggested that the temperature decrease in spring or autumn could limit vegetation growth [25,26,27]. However, the responses of different vegetation types to climate change show great disparity, which undoubtedly increases the difficulty of quantitative analysis [28,29,30].
Over the past few decades, some researchers have found a warmer and more humid pattern displayed in the arid regions of Central Asia [24,31], but some studies have come to the opposite conclusion [32,33]. Meanwhile, some studies have also proposed the presence of enhanced vegetation greenness in Central Asia [28], and further studies have documented a significant spatial heterogeneity [31,34] and seasonal diversity [25,35] in the vegetation greenness. Several studies have tried to reveal the trends in climate indicators and NDVI based on linear trend regression [1,34]. However, this approach might be insufficient to reveal variations in nonlinear and non-stationary trends, so Extreme-Point Symmetric Mode Decomposition (ESMD) was proposed, which has been proven to be effective in revealing nonlinear trends such as those of climate and vegetation [36,37].
Previous studies have mainly focused on the fluctuation and trends of temperature and precipitation. However, both the frequency or severity of climate extremes have the potential to have widespread impacts on the natural ecology [38]. Particularly, the occurrence of climate extremes might threaten vegetation growth, which has attracted widespread attention [39,40]. Related studies show an intensifying trend in climate extremes in recent decades around the world, including in Europe [41], North America [42], Central Asia [43], East Asia [44,45], and Oceania [46]. Nevertheless, many unknowns remain regarding the correlation between vegetation dynamics and climate extremes. Thus, as for arid and semi-arid regions, the response of vegetation dynamics to climate change should give priority to climate extremes.
As the core area of the Silk Road Economic Belt, Xinjiang occupies a vital strategic position in China’s economic development. However, the vegetation could be very sensitive to climate change in such a weak ecological environment, which has attracted widespread attention from scientists, governments, and the public [24]. Therefore, the goals of this study were to: (1) monitor the spatiotemporal change of NDVI and Land-use/Land-cover (LULC); (2) analyze the effects on the NDVI and LULC by the climate change; and (3) reveal the response of NDVI to climate extremes.

2. Material and Methods
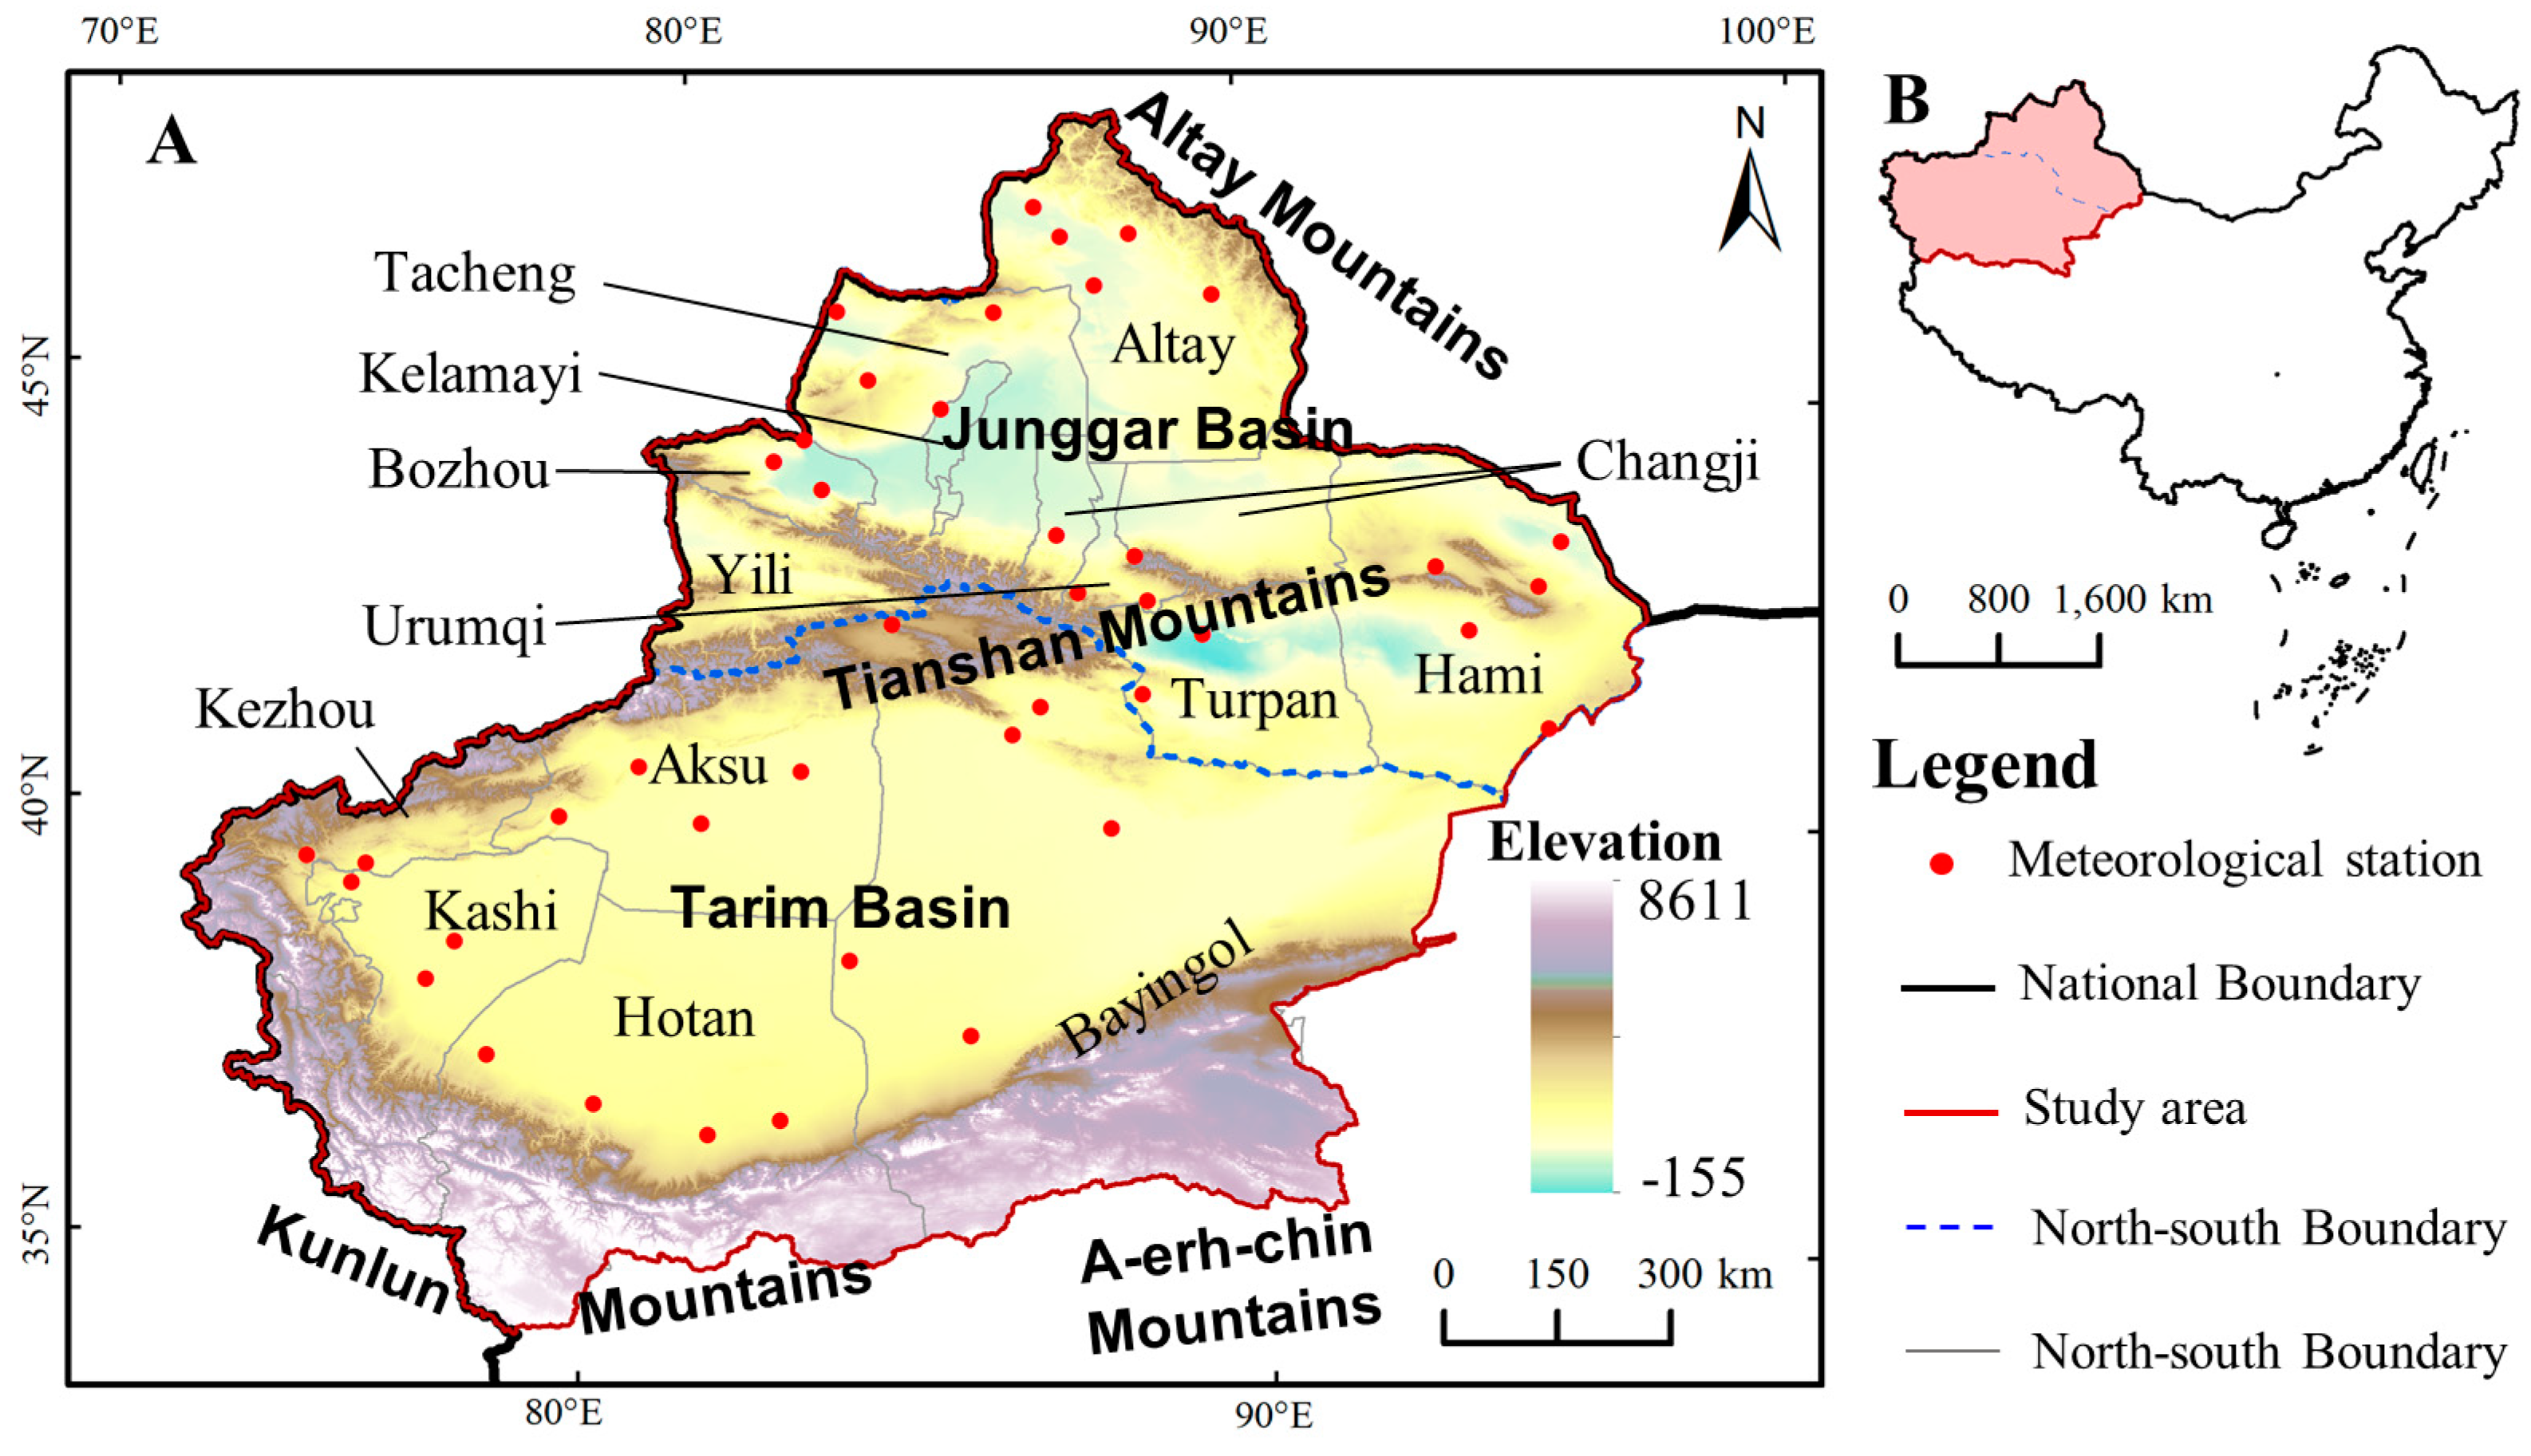
2.1. Study Area

The study site was the Xinjiang Uygur Autonomous Region of China (Xinjiang, for short), located on China’s northwest at 73.40°–96.18° E and 34.25°–48.10° N, see in Figure 1. The total land area is 1.66 million km2, accounting for almost one-sixth of China’s land area. Owing to its deep inland location on the border of Central Asia, Xinjiang is a typical arid region, with a long-term average annual precipitation of 150 mm, only about 25% of the average level in China. There are two main basins lying between three high mountains, with the order from north to south being Altay Mountains, Junggar Basin, Tianshan Mountains, Tarim Basin, Kunlun and A-erh-chin Mountains [47]. These high mountains could block the entrance of water vapor into the large basins [31]. Tianshan mountain lies in the central part of Xinjiang and divides it into North Xinjiang (NXC, for short) and South Xinjiang (SXC, for short) [39].
The vegetation is mainly distributed in the mountains and oases [17], while there is significant spatial heterogeneity between NXC (Grassland and Desert Vegetation dominant) and South Xinjiang (Alpine and Desert Vegetation dominant). Most vegetation stops growing in winter. So, we chose May to September as the vegetation growing season, and divided it into Spring (May), Summer (from June–August), and Autumn (September).

2.2. Data Collection and Processing

The data processing roadmap is shown in Figure 2i.

2.2.1. MODIS Time-Series Datasets

The MODIS-NDVI-16 day-1 km product (MOD13A2, with a spatial resolution of 1 km and a temporal resolution of 16 days) could be downloaded in the National Aeronautics and Space Administration (NASA, https://search.earthdata.nasa.gov). In total 1140 remote sensing images with orbit numbers H23V04, H23V05, H24V04, H24V05, H25V04, and H25V05 and covering the period from 2000–2018 were downloaded. Then the data were spliced and the coordinate system was registered to the World Geodetic System 1984 (WGS 84) in batches by the MODIS Reprojection Tool (MRT for short, NASA, Washington, DC, USA). The images were clipped using the boundary vector file of the study area. Furthermore, the NDVI value unit of the original data was 10−4, so they still needed to be multiplied by 10−4.
The Monthly Maximum NDVI (MjNDVI i) could be obtained by the tools of Maximum Value Composite in ENVI 5.3. The equation is shown in formula (1):
M j NDVI i = max ( NDVI i j 1 , NDVI i j 2 )
where NDVIij1 and NDVIij2 represent the NDVI in the first and second halves of month j in year i, respectively; M jNDVIi denotes the maximum NDVI of month j in year i. The i represents 1 for the year 2000, 2 for the year 2001, and so on, while j is 5 for May, 6 for June, and so on.
Furthermore, MjNDVI i was averaged to obtain the average seasonal NDVI (SkNDVIi, k = 1,2,3 represents spring, summer, and autumn respectively) and the average NDVI in the growing season (GNDVIi). The i indicates the year from 2000–2018. Previous studies regarded areas of NDVI being less than 0.1 as non-vegetation covered areas (NVCA) [17,39], which could be extracted by Mask using ArcGIS 10.6 (Environmental Systems Research Institute, Redlands, CA, USA).
The continuously observed daily meteorological data in 2000–2018 were obtained from the National Meteorological Data Center of China (http://data.cma.cn/). The climate indices in the year i could be calculated based on daily data, including the yearly average temperature in spring (S1Temi), Summer (S2Temi), Autumn (S3Temi) and the Growing Season (GTemi); and the yearly precipitation in Spring (S1Prei), Summer (S2Prei), Autumn (S3Prei) and the Growing Season (GPrei). Then the climate indices from 42 meteorological stations (MS) were interpolated into planar raster by Inverse Distance Weighting (IDW). Notably, temperature could be affected by latitude, longitude, and altitude. Therefore, the interpolation of temperature should be combined the IDW modify with Digital Elevation Model (DEM) [48] by Equation (2):
{ T h = T 0 + A × H T d e m = T s A × H d e m
where Th is the temperature modified to DEM = 0; T0 and H are the temperature and DEM of MS. A is temperature drop rate (= 0.491 °C/100 m) [48]. Ts is the results of IDW of Th. Hdem is the DEM raster data, which could be download from Resource and Environment Data Cloud Platform of China (http://www.resdc.cn/AchievementList1.aspx). Tdem is the results of temperature interpolation by IDW modified with DEM.

2.2.2. Land-Use/Land-Cover (LULC) Datasets

The LULC Dataset was collected from the Resource and Environment Data Cloud Platform (http://www.resdc.cn/data/), which was released by the Chinese Academy of Sciences. Then, we download the LULC datasets in 2000 and 2018, and extracted the study area by Mask using ArcGIS 10.6. The raster dataset had 25 types, with a spatial resolution of 1 km. For the actual situation in Xinjiang, the LULC types were re-divided into twelve types, including Forest, Shrub, Water, Grassland (high coverage), Grassland (moderated coverage), Grassland (low coverage), Permanent snow, Cultivated land, Construction land, Sandy desert, Gobi desert, and Bare land.

2.3. Methods

The technology roadmap is shown in Figure 2ii,iii.

2.3.1. Inter-Annual Change Analysis and Mann–Kendall Test

The Extreme-point Symmetric Mode Decomposition (ESMD) is an adaptive signal decomposition method developed by Hilbert-Huang transformation [37]. The data could be decomposed from high to low frequency to generate a series of intrinsic mode functions together with an adaptive global mean curve. [14]. The ESMD could separate the interannual and general climate trends [36]. The ESMD was implemented with the Java-based ESMD4j v1.8 software (Qingdao University of Technology, Qingdao, PRC). The main steps of the software: (1) Set the sampling interval equal to 1. (2) Select the minimum number of residual mode extremum points and the maximum number (≤40) of iterations, and then calculate the variance ratio to determine the optimal number of filters. (3) Decompose and calculate the mode and generate the adaptive global average (ESMD trend). Besides the ESMD, the Linear Regression Method (LRM) was used to analyze the trends of climate and NDVI [49].
The Mann–Kendall Test is a non-parametric method that is used to detect trends in a time series; it can eliminate outliers and reduce the impact of missing data [13,20]. Therefore, it has been widely used to test long time series trends [50].
For the sequence X = (x1, x2, …, xn ), the magnitude relation of xi and xj was first determined for all dual values. Then the null hypothesis denotes the data in the sequence are randomly arranged, with no significant trend. Otherwise, the alternative hypothesis denotes the sequence has a trend of increasing or decreasing. In this study, trends with p values less than 0.05 were considered to be significant. The Mann–Kendall statistic S is given by Equation (3):
S = i = 1 n 1 j = i + 1 n s i g n ( x j x i )
where n is the number of sequence samples, and xi and xj are time points i and j, respectively. sign(xjxi) is a sign function calculated by Equation (4):
s i g n ( x j x i ) = { 1 ( x j x i ) > 0 0 ( x j x i ) = 0 1 ( x j x i ) < 0
The results of the Mann–Kendall statistic Z approximately follow a standard normal distribution and can be applied to test the significance of the trend. The Z value is given by Equation (5):
Z = { ( S 1 ) / V a r ( S ) i f   S > 0 0 i f   S = 0 ( S + 1 ) / V a r ( S ) i f   S < 0
where Var(S) is expressed by Equation (6).
V a r ( S ) = 1 18 [ n ( n 1 ) ( 2 n + 5 ) i = 1 m t i ( t i 1 ) ( 2 t i + 5 ) ]
where m is the number of tied groups, and ti is the number of observations in the mth group.
In a bilateral trend test for a given confidence level α, if |Z| < Z1-α/2, then the null hypothesis is accepted, which indicates that the variation trend of the time series data is not significant at α. Conversely, the null hypothesis is rejected, which indicates that there is a significant increasing (Z > 0) or decreasing (Z < 0) trend at α.

2.3.2. Spatial Change Analysis

The NDVI’s slope (θslope) was the interannual variability of seasonally integrated NDVI over a specific time period using least-squares line fitting [26,51]. The equation is shown in formula (7):
θ slope = n × i = 1 n ( i × NDVI i q ) i = 1 n i × i = 1 n NDVI i q n × i = 1 n i 2 ( i = 1 n i ) 2
where i is 1 for the year 2000, 2 for the year 2001, and so on. n is the total years (n = 19). NDVIiq is the NDVI of pixel q in year i, including the GNDVI, and SkNDVI. If θslope > 0, this indicates that NDVI increased in 2000–2018. Otherwise, it indicates a decreasing trend.
Similarly, the yearly spatial change of temperature and precipitation could also be calculated with the Equation (8):
C slope = n × i = 1 n ( i × C i q ) i = 1 n i × i = 1 n C i q n × i = 1 n i 2 ( i = 1 n i ) 2
where C denotes the interpolation result of temperature or precipitation by Inverse Distance Weighting (IDW), including the GTem, GPre, SkTem, and SkPre. Ciq is the C of pixel q in year i. If Cslope > 0, this indicates that climate indices increased in 2000–2018. Otherwise, it indicates a decreasing trend.
The F test was applied to test the trend’s significance. We referred to the critical value table of F-distribution and calculated an F value equal to 4.38 at the level of α = 0.05. Combined with the results of θslope and F tests, the trend of the NDVI could be divided into four types: improved significantly (θslope > 0, p < 0.05), improved but not significantly (θslope > 0, p > 0.05), degraded but not significantly(θslope < 0, p > 0.05), degraded significantly (θslope < 0, p < 0.05).

2.3.3. Climate Extremes

In total, twenty-seven core indices have been defined exactly by the Expert Team on Climate Change Detection and Indices (ETCCDI) (http://etccdi.pacificclimate.org/) [20,44]. These indices could reflect the different aspects of extreme climate in different regions [43,52]. As not all indices were meaningful, some indices were eliminated and fifteen extreme climate indices were selected for analysis in this study (see Table 1). The definitions could be seen in the report by the ETCCDI (http://etccdi.pacificclimate.org/definition.shtml).
The extreme climate indices for each year were calculated by RClimdex 1.0 (Climate Research Branch of Meteorological Service of Canada, Downsview, ON, Canada), an R editor-based software. Moreover, to ensure the credibility of the results, the data were strictly quality controlled by RClimdex 1.0 before calculating.

2.3.4. Pearson Correlation Coefficient

Each pixel was analyzed spatially to obtain the correlation between the GNDVI and climate change, the GNDVI and extreme climate indices, respectively. The Pearson Correlation Coefficient (rxy) was measured using formula (9):
r x y = i = 1 n ( x i x ¯ ) ( y i y ¯ ) i = 1 n ( x i x ¯ ) 2 i = 1 n ( y i y ¯ ) 2
where xi and yi are the NDVI and climate index values in the growing season of the year i, respectively. x ¯ and y ¯ are the long-time average annual value of the GNDVI and climate index values, respectively. n is the time series length. The r values range from (−1)–1, and the larger the absolute value of r is, the stronger the correlation.
Then, student’s t-tests (two-tailed) could be applied using SPSS Statistics 22 (IBM Corp., Armonk, NY, USA) [5], so as to detect whether rxy was significant or not.

3. Results

3.1. Spatiotemporal Distribution of Climate
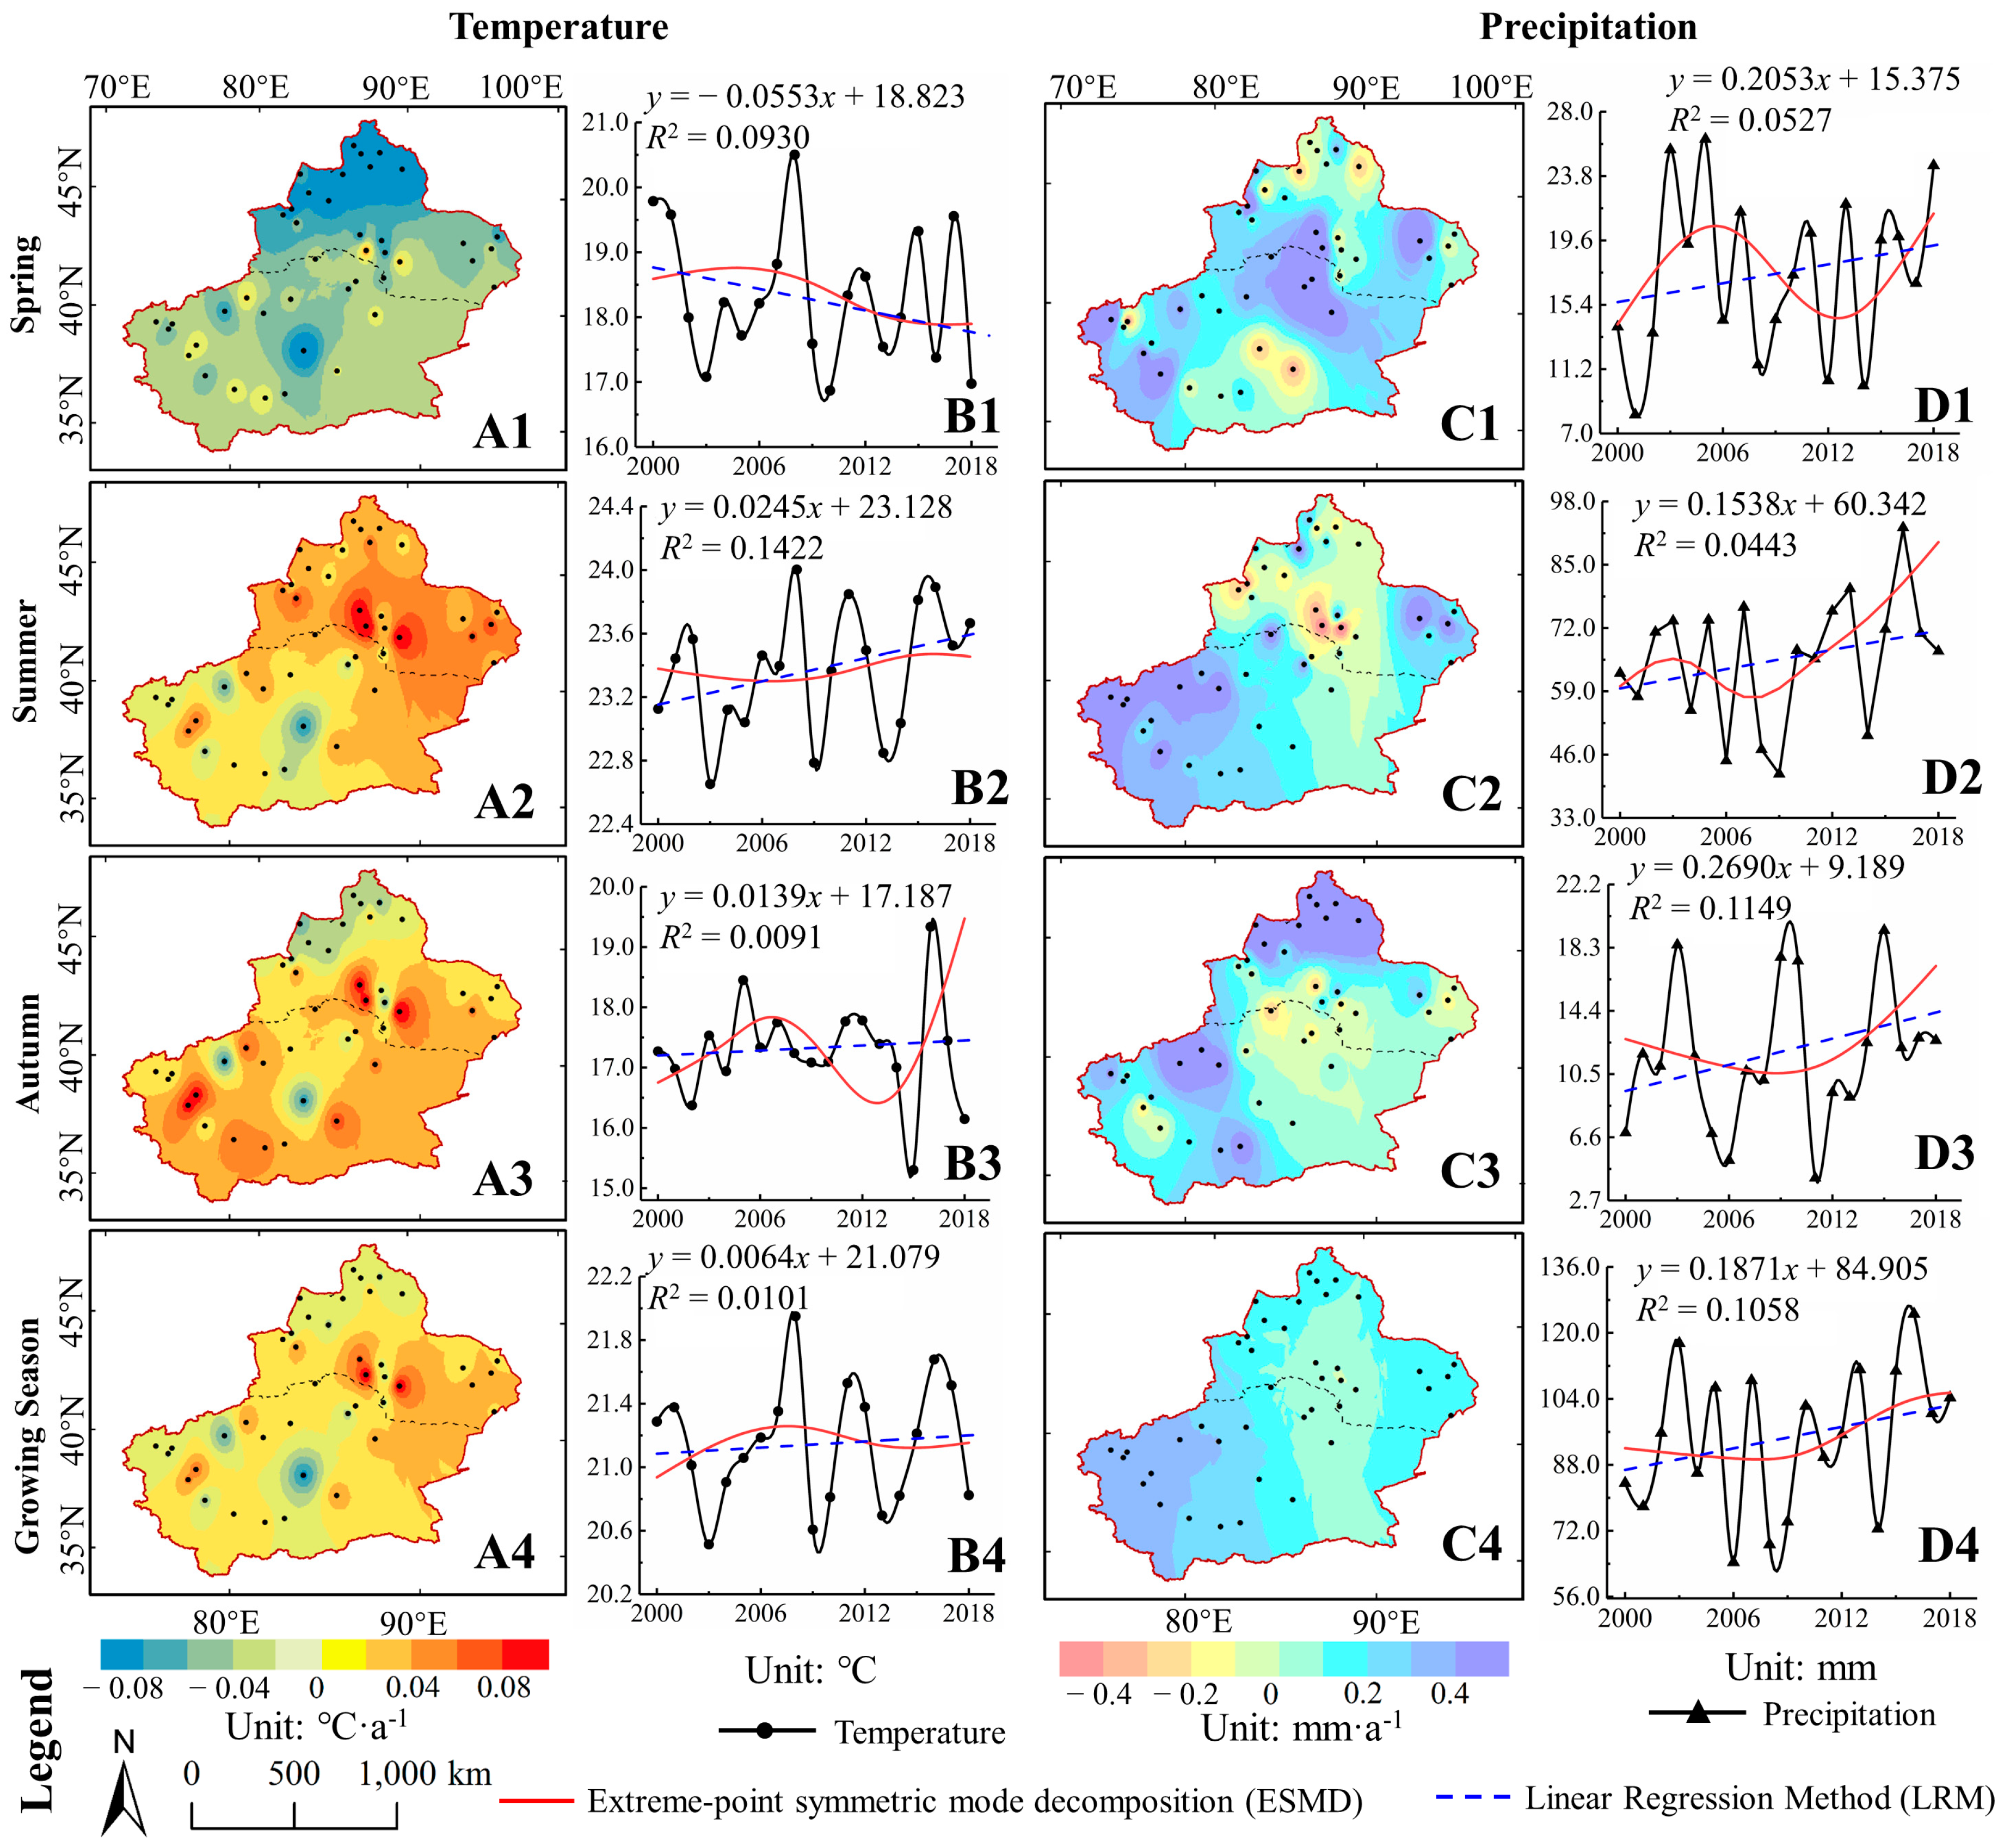
3.1.1. Temperature

Figure 3A shows the average temperature in the growing season (GTem) of 2000–2018 in Xinjiang. Owing to the large altitude span, the distribution shows the characteristics of low GTem in mountains and high Gtem in basins, ranging from (−12.5 °C)–30.4 °C. Thereinto, the GTem were below 10 °C in most areas of Tianshan, Kunlun and A-erh-chin Mountains. The area of GTem exceeding 20 °C in Tarim Basin and Junggar Basin reached 89.26% and 64.25%, respectively.
The variation trends of temperature had different spatial pattern in different seasons, as presented in Figure 4A1–A4. For growing seasons, a high proportion of the area where the GTem has increased, accounted for about 70.93% of the total area of Xinjiang. The GTem of the Altai Mountains, the central Tarim Basin, and the western Kunlun Mountains showed decreasing trends, while the Junggar Basin, the Tianshan mountains, and the A-erh-chin Mountains showed increasing trends. Among these, Urumqi, Turpan, and Kashi had obvious increases in GTem, with growth rates of 0.11, 0.10, and 0.06 °C·a−1, respectively. In spring, the average temperature in spring (S1Tem) has decreased, with higher decreasing trend in NXC but lower in SXC. In summer, the increasing trend of average temperature in summer (S2Tem) in NXC was stronger than that in SXC. And the distribution of the average temperature in autumn (S3Tem) trend was approximately consistent with that of the GTem.
Figure 4B1–B4 display the temporal variation of temperature in 2000–2018. Both the ESMD and LRM showed increasing trends in the GTem. Furthermore, the ESMD observed that the GTem variation fluctuates, with a trend of first increasing (in 2000–2007 with a rate of 0.047 °C·a−1) and then decreasing (in 2008–2014, with a rate of −0.024 °C·a−1) and then increasing (in 2015–2018, with a rate of 0.012 °C·a−1). As for different seasons, the S1Tem showed a significant decline trend with a rate of 0.0553 °C·a−1 (p < 0.1), whereas the S2Tem and the S3Tem increased by 0.0245 °C·a−1 (p < 0.1) and 0.0139 °C·a−1, respectively.

3.1.2. Precipitation

The average precipitation in the growing season (GPre) of North Xinjiang (NXC) was higher than that of South Xinjiang (SXC), as illustrated in Figure 3B. In SXC, the proportion of area with GPre ≤ 100 mm accounted for about 87.65%, while the proportion of area with GPre ≤ 50 mm accounted for about 39.62%. By contrast, the GPre in NXC was mostly in the range of 100–150 mm. Moreover, the GPre around Urumqi and Tianchi reached the highest (426.86 mm).
Figure 4C depicts the change of the precipitation spatial pattern in 2000–2018. The GPre in Kezhou, Aksu, and Kashi increased significantly, reaching 0.6685, 0.6315, and 0.6173 mm·a−1, respectively. The GPre of Urumqi in NXC showed a decreasing trend, with a rate of 0.3251 mm·a−1.
However, the spatial variation of precipitation are different in different seasons.
(a)
The S1Pre in the vicinity of the Tianshan Mountains tended to increase, while other distribution characteristics were similar to those in the growing season.
(b)
The increasing trend of S2Pre in Xinjiang resembled that of GPre.
(c)
The area with an increasing trend in S3Pre in Xinjiang, NXC, and SXC was roughly the same, with proportions of 81.62%, 82.93%, and 80.48%, respectively. Unlike other seasons, there was an obviously high value for the increasing trend of S3Pre around the Altai Mountains (1.476 mm·a−1).
The interannual variation in precipitation for Xinjiang in 2000–2018 is shown in Figure 4D. The GPre showed an increasing trend with a linear rate of 0.1871 mm·a−1. Moreover, the ESMD curve showed that the trend of GPre was smooth with a slight decrease from 2000–2007 and an increase from 2008–2018 (with a rate of 0.3483 mm·a−1). As for different seasons, the average precipitation for each year in Spring (S1Pre), Summer (S2Pre), and Autumn(S3Pre) indicated an increasing trend, among which the S3Pre increased by 0.2690 mm·a−1 (p < 0.1). The trend rates of S1Pre and S2Pre were 0.2053 and 0.1538 mm·a−1, respectively.

3.1.3. Climate Extremes

Figure 5 shows the average value of the 15 extreme climate indices during 2000–2018. The A1–A8 were temperature extremes. Thereinto, the distribution of TMINmean, SU25, and GSL was consistent with that of GTem, while the FD0 was opposite to that of GTem. The TMINmean has great spatial differentiation in Xinjiang, with the highest value of 11.33 °C and lowest value of −29.36 °C. Besides the high-altitude mountainous areas, the FD0 was mostly 120 d–180 d, with the frost period generally from November–March of the next year. The SU25 of NXC was mostly 60 d–120 d, and only the Turpan and Hami were more than 150 d. However, the SU25 varied greatly in SXC, ranging from 0 d–193 d with greater values in the Tarim Basin and lower values in the high-altitude mountainous areas. The DTR showed a large temperature difference between day and night in Xinjiang ranging from 9.04–18.31 °C, with the DTR of SXC was higher than that of NXC. There was no obvious difference (<1 d) for TN90p. Furthermore, it showed an east-west difference for the distribution of both the WSDI and the CSDI.
As for precipitation extremes (see B1–B7 in Figure 5), there was little difference between SDII (6.07 mm·d−1) and CWD (4.69 d), indicating the overall drought in the study area. The results of CDD indicated that SXC was drier than NXC, with higher than 100 d in most area of SXC and lower than 100 d in most area of NXC. Furthermore, the distribution of R10mm, R × 1day, PRCPTOT, and R95 was consistent with that of GPre. The results show that SXC had not only the lower precipitation but also the lower rainfall intensity than NXC. The areas with high rainfall intensity were mainly located around Urumqi.
Table 2 illustrates the variation in extreme indices of temperature was stronger than that of precipitation. The Mann–Kendall test showed that the number of frost days (FD0) significantly decreased (p < 0.05), the simple daily intensity index (SDII) significantly increased (p < 0.05), and the number of warm nights (TN90p) significantly increased (p < 0.1). These three indices—FD0, SDII, and TN90p—varied at rates of −4.221 d·(10a)−1, 0.315 mm·(d·10a)−1, and 0.744 d·(10a)−1, respectively. Furthermore, the trends in the extreme precipitation indices of wet day precipitation (PRCPTOT) and very wet day precipitation (R95p) also displayed quick but insignificant rates of increase, with rates of 13.909 mm·(10a)−1 and 7.318 mm·(10a)−1, respectively.

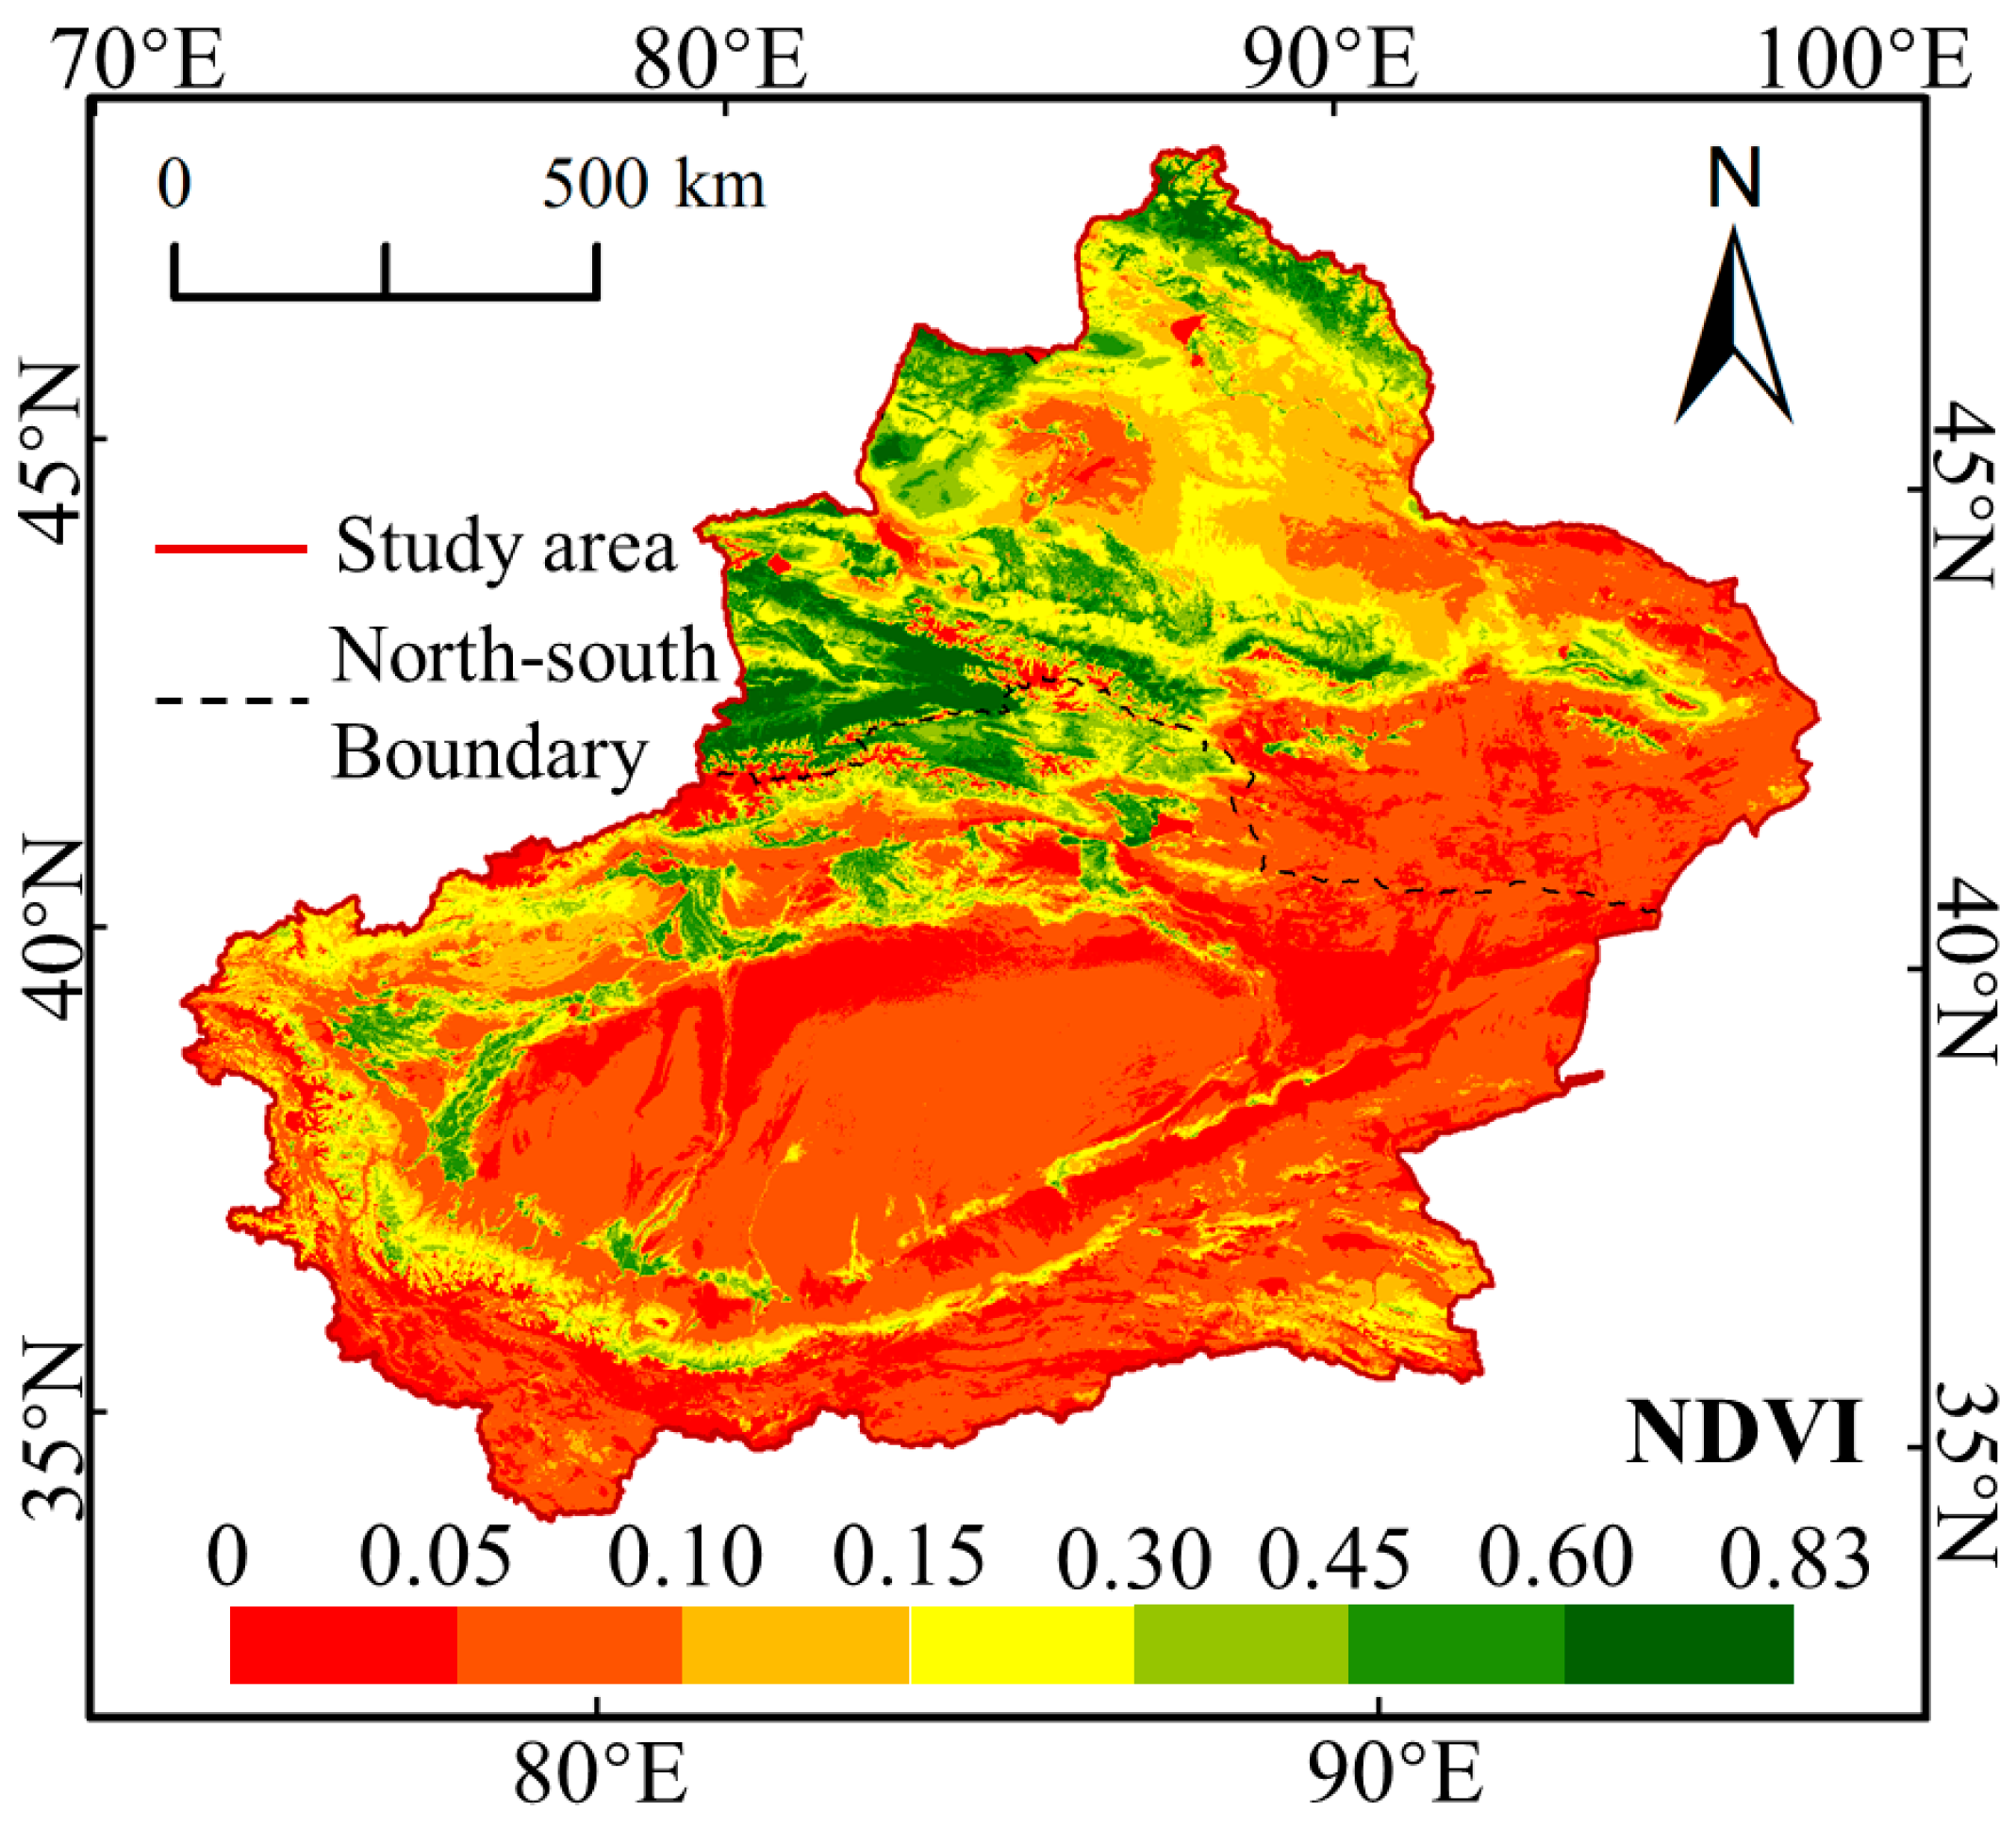
3.2. Spatiotemporal Distribution of NDVI

Figure 6 reveal evident variations in average NDVI in the Growing Season (GNDVI) in Xinjiang during 2000–2018, ranging from 0–0.83 with greater values in the north and lower values in the southwest. Areas with high vegetation coverage generally exhibited an NDVI of over 0.6. However, these areas only covered 2.61% of the total study area, which primarily found in Altay and Tianshan Mountains, such as Yili, Bozhou, Altay, and Tarbagatay. Furthermore, the NDVI of less than 0.1 could be regarded as the non-vegetation covered areas (NVCA), which accounted for 58.01% of the total area, mainly located in Tarim Basin and east of Junggar Basin.
Figure 7A,B presents the spatial map of NDVI variation trend and its significance (p < 0.05), respectively. The part of the study area except NVCA was vegetation coverage area (VCA). Overall, the tendency of NDVI were heterogeneous for the spatial patterns, but homogeneous for different seasons. In NXC, the areas with significantly improved GNDVI were mainly distributed in the northern margin of Tarim Basin and the southern margin of Junggar Basin, accounting for 29.90% and 33.54% of the VCA. In addition, the proportion of significantly degraded areas of GNDVI accounted for 1.72% of the VCA; these areas were scattered in the northern foothills of the Tianshan Mountains and at the edge of the Altai Mountains. The degraded areas were mainly located in the transition zone between desert and oasis. Owing to the Taklimakan Desert located in the Tarim Basin, the VCA of SXC was low, with area proportions of 29.84% for GNDVI. Even so, there was still a high proportion of improved areas GNDVI (90.63%) in SXC. Among them, significant increases (p < 0.05) in GNDVI (60.47%) also accounted for a high proportion of the area, which mainly distributed at the margin of Tarim Basin, especially along the Tarim River.
Figure 7C shows the temporal variation of NDVI in 2000–2018. Both LRM and ESMD displayed an increasing trend of GNDVI, with linear slopes of 0.0014 a−1 (p < 0.01). Additionally, The ESMD curve depicted an interannual growth trend was observed in all other years except for the slight decreases in 2006–2008 and 2013–2014. For different seasons, the average seasonal NDVI all increased and reached 1% significance level. The ESMD curves exhibited increasing but fluctuant trends in S1NDVI, S2NDVI, and S3NDVI, with the linear rates of 0.001, 0.0016, and 0.0012 a−1, respectively.

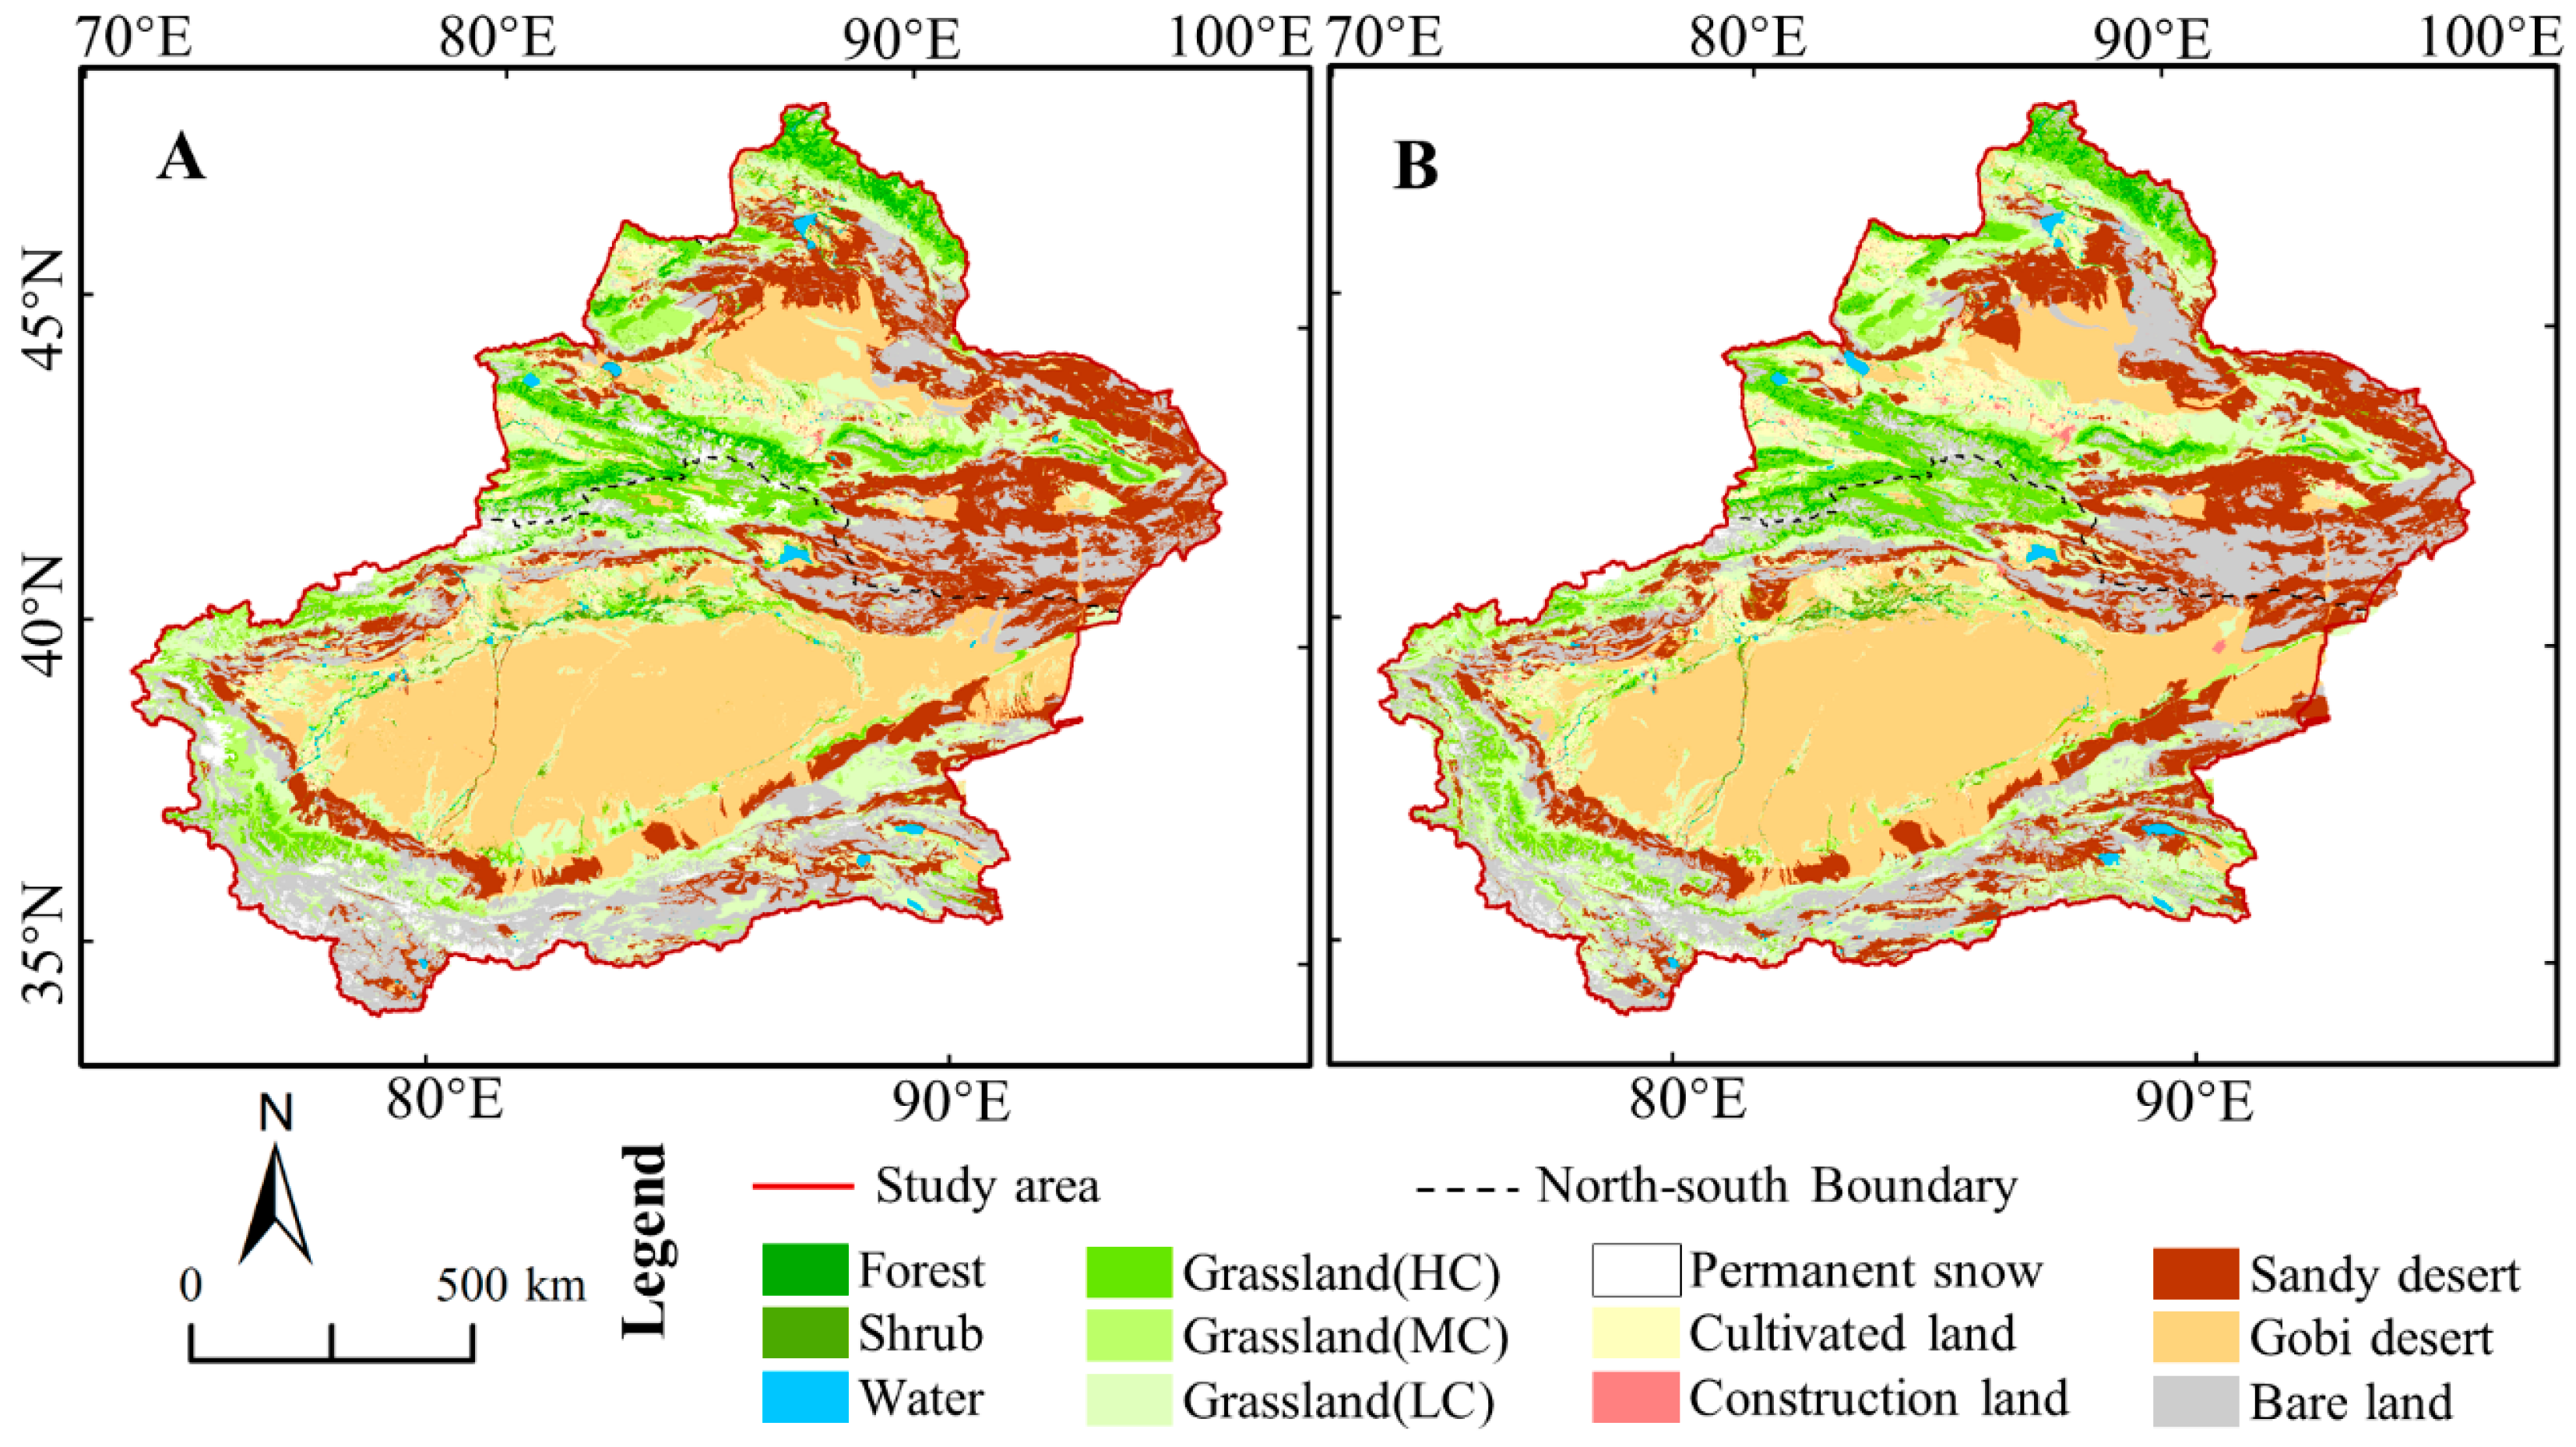
3.3. Spatiotemporal Distribution of LULC

Figure 8 and Table 3 shows the LULC of Xinjiang in 2000 (A) and 2018(B). Xinjiang had the highest proportion of grassland, accounting for about 1/3 of the total area. Among them, the grassland coverage of NXC (about 35%) was higher than that of SXC (about 26%). Low coverage grassland was mainly distributed in SXC. Additionally, the total area of Sandy desert, Gobi desert and Bare land accounted for about 2/3 of the total. Notably, the Sandy desert was mainly distributed in the Tarim Basin of SXC, while the area of Gobi Desert was mainly distributed in the Junggar Basin of NXC.
Table 4 depicted the transfer matrix of LULC during 2000–2018. The area of Cultivated land changed the most in Xinjiang, increasing by 30,834 km2 in 2000–2018, which indicated the rapid development of agriculture in Xinjiang. The area of Construction land had doubled, which mainly concentrated in NXC. Notably, the area of Permanent snow has been reduced by 20,436 km2 and more than 80% of them were in SXC. The proportion of Permanent snow transferred into Bare land and Grassland accounted for 71.5% and 28.0%, respectively. The Grassland (LC) was both the largest area of transfer-in and transfer-out for all LULC types in Xinjiang and SXC. Furthermore, the area of Grassland (HC) increased by 17,984 km2 with three main sources, including the transfer of Grassland (MC) and Grassland (LC), the transfer of Permanent snow and bare land from SXC, the transfer of Forest from NXC. The Sandy Desert and Gobi Desert areas seemed to be stable in Xinjiang, but the equilibrium is an illusion of due to the sharply decrease in SXC and great increase in NXC.

3.4. Climate Changes Affects on NDVI and LULC

3.4.1. Climate Change influences on NDVI

The NDVI responded differently to temperature and precipitation for different seasons in Xinjiang, as presented in Table 5. The GNDVI was positively correlated with temperature and precipitation in Xinjiang. However, NDVI had a stronger response to precipitation in the growing season, which indicates that the improvement of vegetation was mainly affected by the increase in precipitation. Furthermore, the response of NDVI to precipitation was much higher than that of temperature in spring and summer. The correlation between S1NDVI and temperature was very low in spring. This means the increase in precipitation in spring and summer was beneficial to the growth of vegetation. For autumn, the correlations between S3NDVI and temperature increased (p < 0.1). Meanwhile, the response of S3NDVI to temperature was slightly higher than that of precipitation.
Figure 9A illustrates that the GNDVI was insignificantly correlated to the inter-annual variability of GTem in the majority of the study area, with the average coefficient of 0.082. The correlation coefficients between GNDVI and GTem were negative in the majority of VCA and were significant negative, especially in the VCA of SXC. Conversely, the regions with significant positive correlation were mainly located in Tianshan, Hami and Aksu.
In the majority of the VCA, the GNDVI had significant and positive correlations to precipitation, as presented in Figure 9B, but it had weak and negatively correlations to temperature, indicating that the precipitation affected strongly on GNDVI than temperature during the past 19 years. Concretely, the significant and positive correlations of GNDVI and precipitation was observed greatly in the mountains and basins, such as in the Aksu, Hotan, Kashi, Hami, Bozhou, and Altay. Therefore, the restrain of rising temperature on vegetation will weaken the promoting of increasing precipitation, with the warming and wetting evolvement trend of the climate for Xinjiang in the future.

3.4.2. Climate Change influences on LULC

With the climate warming, the Permanent snow have melted in large area, resulting in an increase of 14,628 km2 of Bare land, 77.5% of which was located in SXC. Furthermore, the area of grassland increased by 5720 km2 due to the water nourishment of melting ice and snow. However, these areas were mainly located in the mountainous region of high altitude, such as Tianshan and Kunlun Mountains. Due to the increase of precipitation, the desert ecosystems such as sandy land, Gobi and bare land have also been improved, with a total of 12,863 km2 transferred into grassland. Moreover, the desert ecosystem seems to have become more suitable for cultivation, with 10,452 km2 converted into cultivated land.

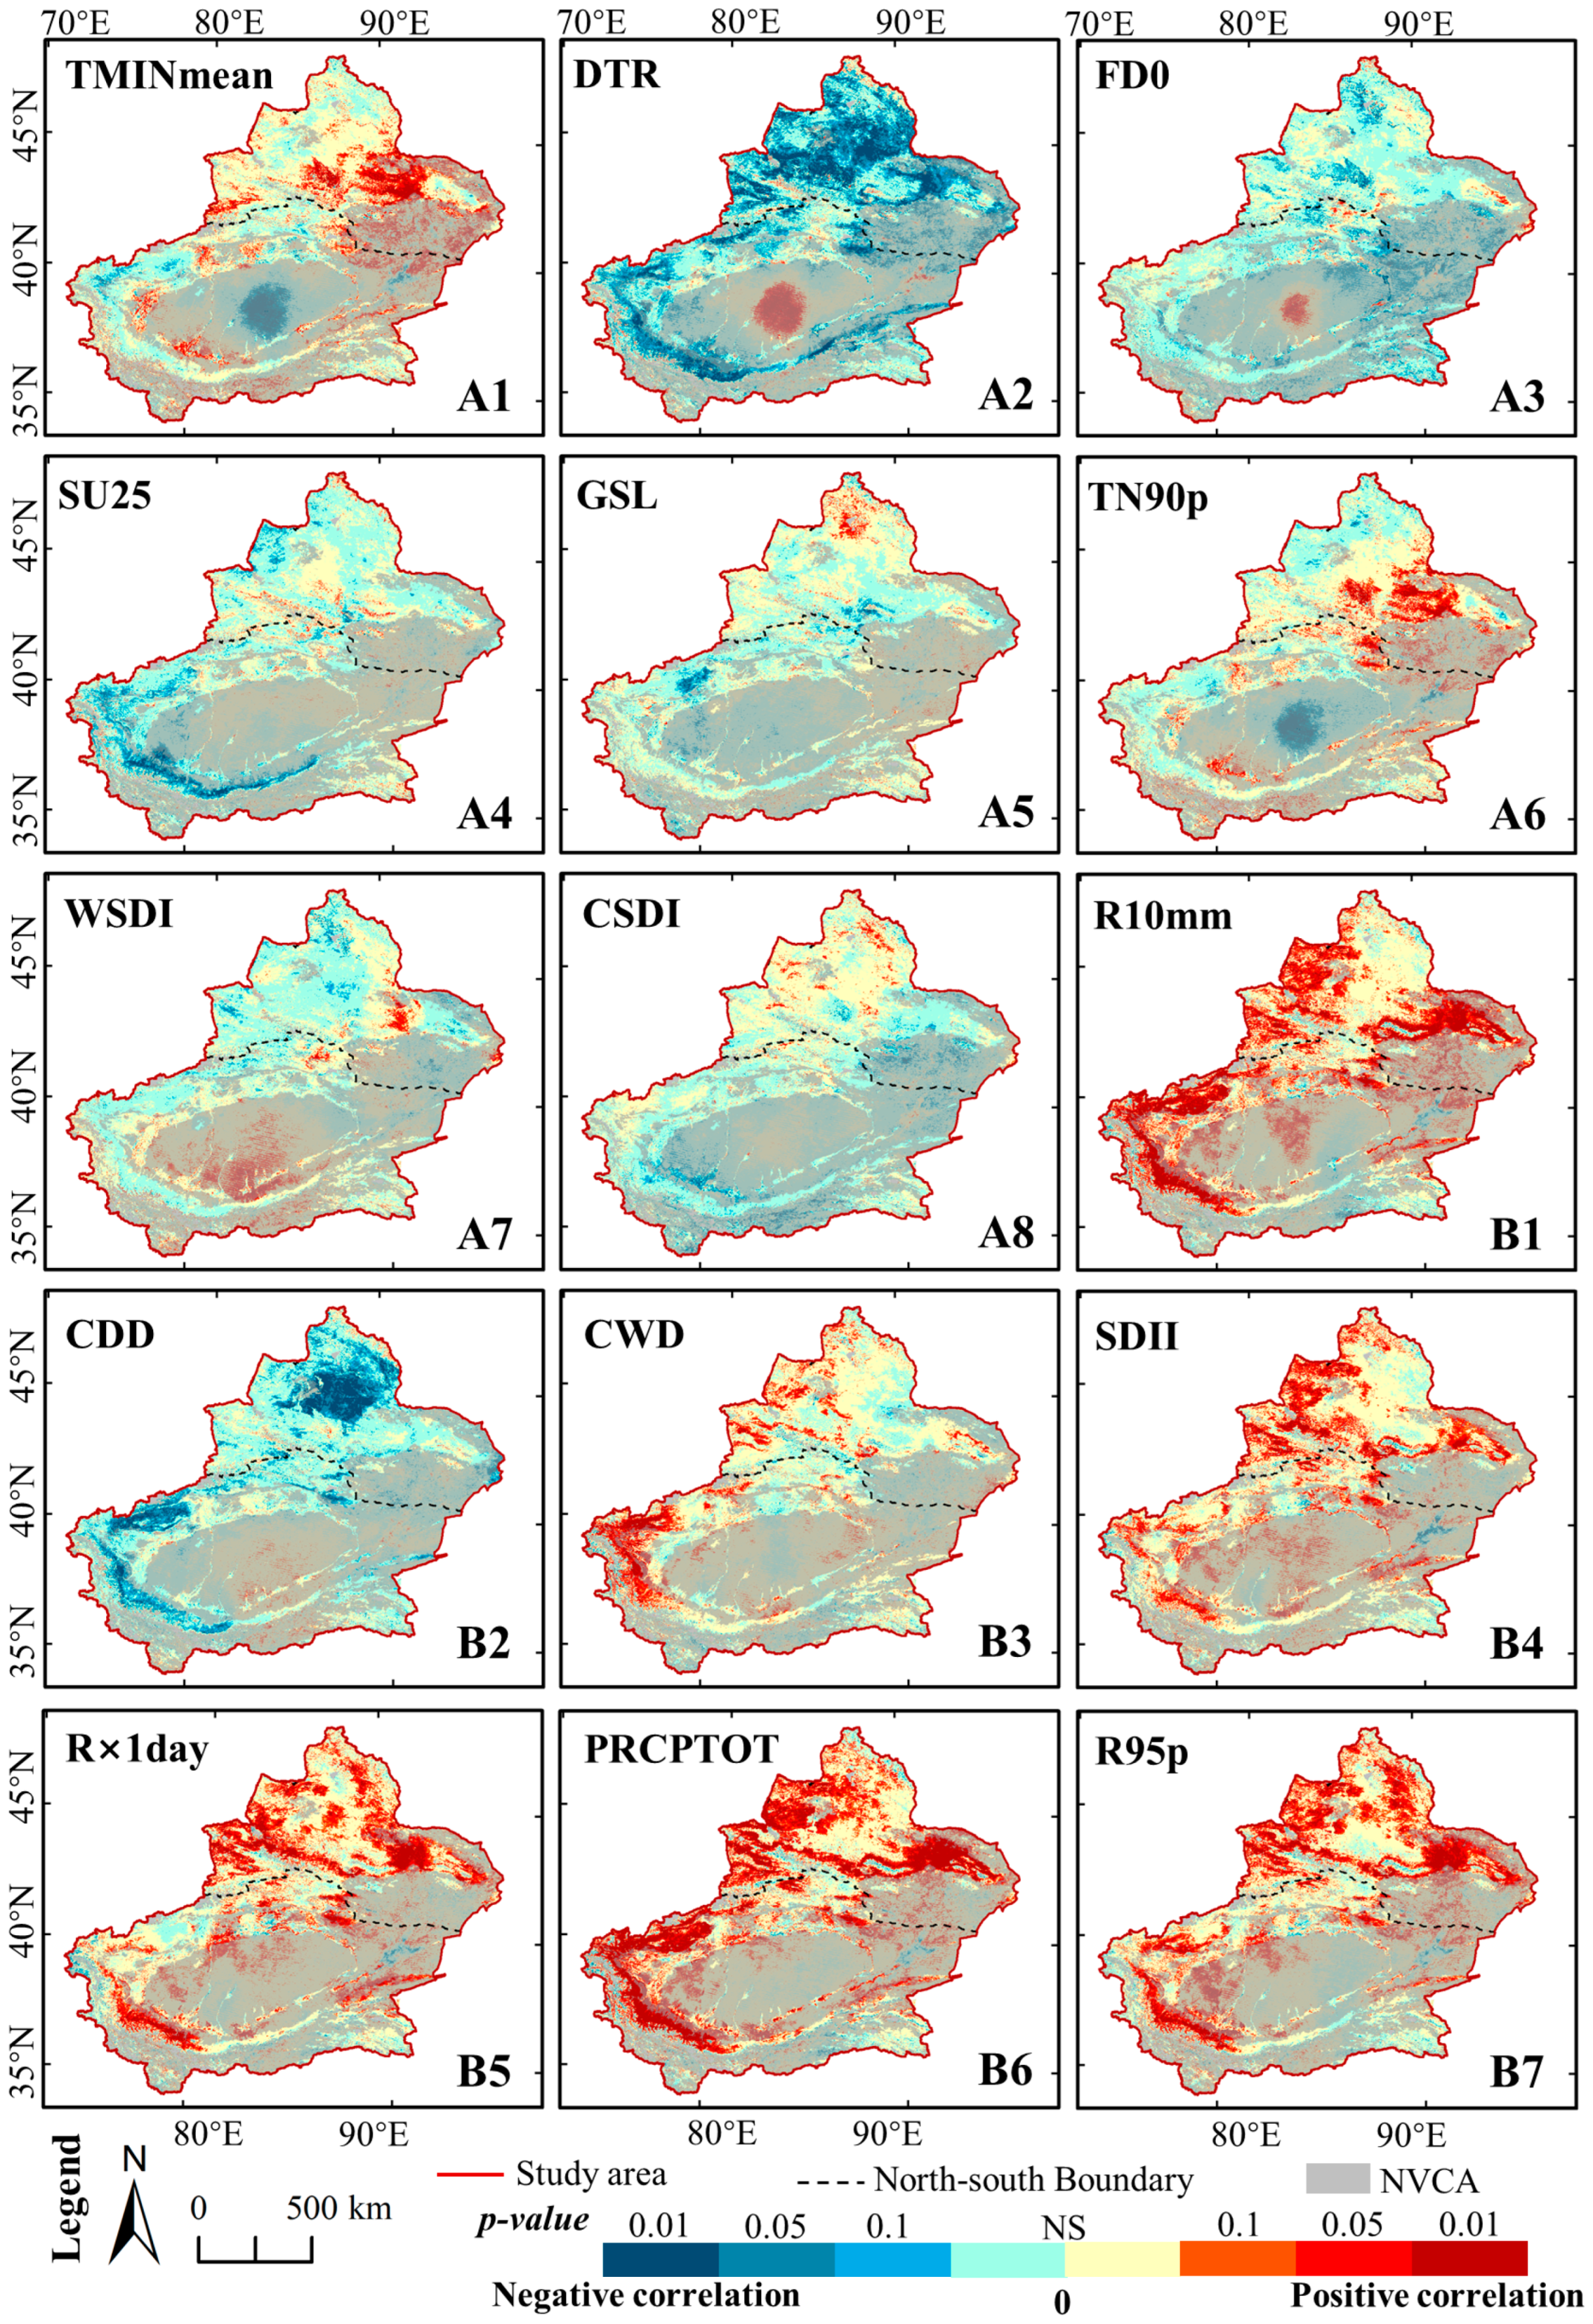
3.4.3. Climate Extremes Influences on NDVI

Table 6 and Figure 10 show the correlation between GNDVI and climate extremes. As for the temperature extremes, the DTR was significantly negatively correlated with NDVI (with a correlation coefficient of 0.634), reaching a significance level of 0.01. Spatially, the DTR with higher negative correlations were mainly located in NXC, indicating that an increase in the temperature difference between day and night could have a bad effect on vegetation growth in NXC. Moreover, the TMINmean was significantly positively correlated with NDVI, reaching a significance level of 0.1 with coefficients of 0.429. These results indicate that night temperature is critical to vegetation growth in Xinjiang. The correlations between the NDVI and the other five extreme temperature indices were insignificant. Notably, the FD0 and TN90p showed negative correlations with NDVI, where the coefficient was equal to −0.341 and 0.311, respectively. It could support the view that the decrease in the frost period favored the growth of vegetation. The SU25 with higher negative correlations were mainly located in the southern margin of Tarim Basin, illustrating that the longer time of summer could inhibit the vegetation growth especially in SXC.
The GNDVI had a stronger correlation to extreme indices of precipitation than that of temperature. Six extreme precipitation indices were significantly positively correlated with NDVI, of which five indices (SDII, R10mm, R × 1day, R95p, and PRCPTOT) reached a significance level of 0.01. Among these, the indices SDII was the most closely correlated with the NDVI, with correlation coefficients of 0.772. Furthermore, the correlation coefficients between the NDVI and the indices of R × 1day, R10mm, R95p, and PRCPTOT were 0.758, 0.751, 0.721, and 0.689, respectively. Spatially, these areas were mainly located in the Tianshan mountain, the southern margin of Tarim Basin, and the western and eastern margin of Junggar Basin.
These values suggest that the concentrated rainfall could be conducive to vegetation growth in Xinjiang. One index (CWD) reached a significance level of 0.1 with a correlation coefficient of 0.267. This indicates that a continuous humid environment is more suitable for vegetation growth in Xinjiang.

4. Discussion

4.1. Response of NDVI and LULC to Climate Change

The variation in climate extremes was enhanced over the past 19 years, with the characteristics of more concentrated precipitation and higher temperatures at night. These results confirm that the climate gradually developed a warmer and more humid pattern in Xinjiang, which confirms previous claims [24,39,53,54,55]. Similar studies have reported a significant wetting tendency in northern Xinjiang [4,56], which is consistent with the trend observed in this study. However, unlike some studies revealed a trend of dryness in Xinjiang from 2000–2015 [32]. This might be caused by differences in the selection of research indicators and scales. Additionally, vegetation growth has improved significantly in the past 19 years in Xinjiang. The observation of a vegetation increase in recent decades is consistent with the results of the dynamic greening trend for vegetation in Eurasia, Central Asia, and Western China in previous studies [27,28,56,57]. These variations have led to the optimistic expectation that the fragile eco-environment in arid regions can be improved [24].
Spatially, both temperature and precipitation have tended to increase over the past 19 years, with the variation being higher in NXC than in SXC, which is consistent with previous studies [36,55]. Furthermore, the temperature increase in summer was particularly noticeable in NXC, especially in Urumqi, Turpan, and Hami. These urban areas might act as heat islands, exacerbating the warming trend [53]. The precipitation trend in autumn tended to be an increase in the Altay Mountains and a decline in Junggar Basin, which is consistent with previous research [24,36]. As a previous study reported [11,55], the regions of vegetation showing obvious restoration were mainly distributed in the Tianshan Mountains, Altay Mountains, and around the margins of Tarim Basin. A similar result was also found in this paper. The vegetation degradation area was mainly located at the intersection of desert and oasis, which might have been caused by the lack of water supply. A previous study found that the NDVI decreased significantly in Taklimakan Desert of Tarim Basin [55].
The spatial patterns of the NDVI were positively affected by both temperature and precipitation change. Spatially, NXC is more sensitive to precipitation than SXC. The little precipitation and strong evaporation rate in Xinjiang could have large effects on vegetation growth [24]. Furthermore, in dry conditions, vegetation might reduce the carbon supply to bacterial communities which, in turn, limits the growth of vegetation [58,59,60]. These results confirm previous findings concerning the drought risk in arid regions, which revealed that precipitation is the primary climatic driver for vegetation changes [2,25,33].
The rising temperatures might enhance the vegetation growth of Xinjiang by two aspects. Firstly, a properly increasing temperature might extend the growing season of vegetation. For example, the response of the NDVI to temperature was slightly higher than that of precipitation in autumn. This result agrees with previous work [12,35] and provides further evidence that precipitation and temperature have different effects on vegetation growth in different seasons. Secondly, an increasing temperature would accelerate the glacial ablation of the high mountains [54,55], and then the runoff might promote the growth of vegetation. The results of the transfer matrix of LULC could vindicate this judgment.
The response of NDVI to the extreme index of precipitation was stronger than that of temperature. Meanwhile, the response of the NDVI to the climate extremes was stronger than the response to climate change. Extreme drought might be more likely to decrease vegetation growth and even ecosystem productivity and stability [8]. Furthermore, the NDVI variation in arid regions was eventually determined by the precipitation increase, especially by precipitation extremes [39]. Therefore, extreme precipitation could be regarded as a vital factor in the variation of NDVI in Xinjiang, especially for continuous concentrated precipitation. As for temperature extremes, the results indicated that the mean minimum temperature (TMINmean) and warm nights (TN90p) had significant positive correlations with the NDVI, which is consistent with previous research [39,43,44,52]. Furthermore, we did find that the diurnal temperature range (DTR) was significantly negatively correlated with the NDVI, especially in NXC. This illustrates that the significant enhancement of vegetation was consistent with the significant increase in the night temperature in Xinjiang. Thus, higher night-time temperatures in the study area could regulate and enhance vegetation growth by reducing the frost risk and increasing vegetation respiration.

4.2. Suggestions, Limitaion, and Prospects

The vegetation in arid areas could be more sensitive to climate change, which might influence the eco-environment in the countries and regions of the Belt and Road [4]. The work could enrich the understanding of the effects of climate change on land cover change and vegetation dynamics, laying the basis for its sustainable management. Consequently, the advantages and disadvantages of climate change and its influence on vegetation should be fully comprehended by the local government.
(a)
As for the advantages, climate change might create an environment that is more suitable for specific types of vegetation. For example, the grassland showed the highest levels of improvement, with these areas showing positive responses to an increase in precipitation. These findings could support a scientific basis for the implementation and management of ecological restoration programs to improve the fragile environment. The government could use the advantages of vegetation growth from climate change to implement some ecological restoration strategies (e.g., enhancing the protection of grassland especially during periods of increased precipitation).
(b)
Regarding the disadvantages, an increase in temperature will accelerate the melting of glaciers on high mountains, which could nurture and enhance the vegetation growth. However, it could also exacerbate water shortages and increase the Bare land, which would threaten the fragile local arid ecosystems. Thus, the local government should carry out effective measures to tackle climate warming, such as increasing energy conservation and emission reduction efforts. Notably, Xinjiang is the National Large-scale Coal Mining Base of China, where the carbon emissions of coal consumption cannot be ignored. Therefore, the local government should actively optimize the structure of energy utilization.
Because of the complexity of the vegetation and its response to climate change, there were still some limitations in this study. Owing to the topographic relief, and the sparse MS which mainly in or around cities, which could affect the accuracy of the results. Notably, the irrational anthropogenic socioeconomic activity could disturb the growth of vegetation, such as the increment of Cultivated land occupied the grassland of 19,483 km2. Thus, further research should be done to quantitatively analyze the coupling mechanism between climate change, vegetation growth, and human activities.

5. Conclusions

This work proves and evidences the effect of climate change on land cover change and vegetation dynamics, laying the basis for its sustainable management. Since climate change showed a warming trend, the Permanent snow has been reduced by 20,436 km2. The NDVI exhibited an increased volatility trend, with the significant improvement regions mainly located in the margin of basins. The humid trend could provide more suitable conditions for vegetation growth and ecological restoration, but the warmer might prevent vegetation growth. The response of NDVI to precipitation was stronger than the response to temperature. Spatially, NXC was more sensitive to precipitation than SXC. Seasonally, the response of NDVI to precipitation was higher than the temperature in spring and summer; but in autumn, it was the opposite. Continuous concentrated precipitation could be considered as a vital factor for vegetation dynamics in Xinjiang. Furthermore, the significant enhancement of vegetation was consistent with the significant increase in night-time temperature. Therefore, the reduction in the diurnal temperature range and higher night-time temperatures could enhance vegetation dynamics.

Author Contributions

All authors contributed to the design and development of this manuscript. Conceptualization, F.C. and Z.B.; methodology, H.Y.; software, H.Y.; validation, S.M., J.Y. and F.C.; formal analysis, H.Y.; investigation, H.Y. and J.Y.; resources, F.C.; data curation, H.Y.; writing—original draft preparation, H.Y.; writing—review and editing, F.C.; visualization, J.Y.; supervision, F.C. and Z.B.; project administration, F.C.; funding acquisition, Z.B. All authors have read and agreed to the published version of the manuscript.

Funding

This work was funded by the Key Project of Joint Funds of the National Natural Science Foundation of China, “The coal resources of Protective exploitation and environmental effects in Xinjiang” (Grant No. U1903209).

Acknowledgments

The authors gratefully acknowledge the editors and anonymous reviewers for their constructive comments on our manuscript. We would also like to thank MDPI editing service for providing English language, grammar, punctuation, and spelling during the preparation of this manuscript.

Conflicts of Interest

The authors declare no conflict of interest. The funders had no role in the design of the study; the collection, analyses, or interpretation of data; the writing of the manuscript, or in the decision to publish the results.

References

  1. Tian, H.; Cao, C.; Chen, W.; Bao, S.; Yang, B.; Myneni, R.B. Response of vegetation activity dynamic to climatic change and ecological restoration programs in Inner Mongolia from 2000 to 2012. Ecol. Eng. 2015, 82, 276–289. [Google Scholar] [CrossRef]
  2. Xu, H.; Zhao, C.; Wang, X. Spatiotemporal differentiation of the terrestrial gross primary production response to climate constraints in a dryland mountain ecosystem of northwestern China. Agric. For. Meteorol. 2019, 276–277, 107628. [Google Scholar] [CrossRef]
  3. White, C.J.; Tanton, T.W.; Rycroft, D.W. The Impact of Climate Change on the Water Resources of the Amu Darya Basin in Central Asia. Water Resour. Manag. 2014, 28, 5267–5281. [Google Scholar] [CrossRef]
  4. Luo, N.; Mao, D.; Wen, B.; Liu, X. Climate Change Affected Vegetation Dynamics in the Northern Xinjiang of China: Evaluation by SPEI and NDVI. Land 2020, 9, 90. [Google Scholar] [CrossRef] [Green Version]
  5. Chuai, X.W.; Huang, X.J.; Wang, W.J.; Bao, G. NDVI, temperature and precipitation changes and their relationships with different vegetation types during 1998–2007 in Inner Mongolia, China. Int. J. Clim. 2013, 33, 1696–1706. [Google Scholar] [CrossRef]
  6. Yang, Y.; Zhang, S.; Hou, H.; Chen, F. Resilience mechanism of land ecosystem in mining area based on nonlinear dynamic model. J. China Coal Soc. 2019, 44, 3174–3184. [Google Scholar]
  7. Yan, H.; Zhan, J.; Liu, B.; Yuan, Y. Model Estimation of Water Use Efficiency for Soil Conservation in the Lower Heihe River Basin, Northwest China during 2000–2008. Sustainability 2014, 6, 6250–6266. [Google Scholar] [CrossRef] [Green Version]
  8. Zhang, F.; Quan, Q.; Ma, F.; Tian, D.; Hoover, D.L.; Zhou, Q.; Niu, S. When does extreme drought elicit extreme ecological responses? J. Ecol. 2019, 107, 2553–2563. [Google Scholar] [CrossRef]
  9. Seddon, A.W.R.; Macias-Fauria, M.; Long, P.R.; Benz, D.; Willis, K.J. Sensitivity of global terrestrial ecosystems to climate variability. Nature 2016, 531, 229–232. [Google Scholar] [CrossRef] [Green Version]
  10. Han, H.; Bai, J.; Ma, G.; Yan, J. Vegetation Phenological Changes in Multiple Landforms and Responses to Climate Change. ISPRS Int. J. Geo-Inf. 2020, 9, 111. [Google Scholar] [CrossRef] [Green Version]
  11. Zhou, W.; Yang, H.; Huang, L.; Chen, C.; Lin, X.; Hu, Z.; Li, J. Grassland degradation remote sensing monitoring and driving factors quantitative assessment in China from 1982 to 2010. Ecol. Indic. 2017, 83, 303–313. [Google Scholar] [CrossRef]
  12. Zhou, Y.; Zhang, L.; Fensholt, R.; Wang, K.; Vitkovskaya, I.; Tian, F. Climate Contributions to Vegetation Variations in Central Asian Drylands: Pre- and Post-USSR Collapse. Remote Sens. 2015, 7, 2449–2470. [Google Scholar] [CrossRef] [Green Version]
  13. Jiang, W.; Yuan, L.; Wang, W.; Cao, R.; Zhang, Y.; Shen, W. Spatio-temporal analysis of vegetation variation in the Yellow River Basin. Ecol. Indic. 2015, 51, 117–126. [Google Scholar] [CrossRef]
  14. Lin, Q.; Wu, Z.; Singh, V.P.; Sadeghi, S.H.R.; He, H.; Lu, G. Correlation between hydrological drought, climatic factors, reservoir operation, and vegetation cover in the Xijiang Basin, South China. J. Hydrol. 2017, 549, 512–524. [Google Scholar] [CrossRef]
  15. Pan, T.; Zou, X.; Liu, Y.; Wu, S.; He, G. Contributions of climatic and non-climatic drivers to grassland variations on the Tibetan Plateau. Ecol. Eng. 2017, 108, 307–317. [Google Scholar] [CrossRef]
  16. Luo, Z.; Song, Q.; Wang, T.; Zeng, H.; He, T.; Zhang, H.; Wu, W. Direct Impacts of Climate Change and Indirect Impacts of Non-Climate Change on Land Surface Phenology Variation across Northern China. ISPRS Int. J. Geo-Inf. 2018, 7, 451. [Google Scholar] [CrossRef] [Green Version]
  17. Xu, Y.; Yang, J.; Chen, Y. NDVI-based vegetation responses to climate change in an arid area of China. Theor. Appl. Clim. 2016, 126, 213–222. [Google Scholar] [CrossRef]
  18. Fensholt, R.; Rasmussen, K.; Nielsen, T.T.; Mbow, C. Evaluation of earth observation based long term vegetation trends-Intercomparing NDVI time series trend analysis consistency of Sahel from AVHRR GIMMS, Terra MODIS and SPOT VGT data. Remote Sens. Environ. 2009, 113, 1886–1898. [Google Scholar] [CrossRef]
  19. Yang, Y.; Erskine, P.D.; Lechner, A.M.; Mulligan, D.; Zhang, S.; Wang, Z. Detecting the dynamics of vegetation disturbance and recovery in surface mining area via Landsat imagery and LandTrendr algorithm. J. Clean. Prod. 2018, 178, 353–362. [Google Scholar] [CrossRef]
  20. Zoungrana, B.J.; Conrad, C.; Thiel, M.; Amekudzi, L.K.; Da, E.D. MODIS NDVI trends and fractional land cover change for improved assessments of vegetation degradation in Burkina Faso, West Africa. J. Arid. Environ. 2018, 153, 66–75. [Google Scholar] [CrossRef]
  21. Hoylman, Z.H.; Jencso, K.G.; Hu, J.; Holden, Z.A.; Allred, B.; Dobrowski, S.; Robinson, N.; Martin, J.T.; Affleck, D.; Seielstad, C. The Topographic Signature of Ecosystem Climate Sensitivity in the Western United States. Geophys. Res. Lett. 2019, 46, 14508–14520. [Google Scholar] [CrossRef] [Green Version]
  22. Fensholt, R.; Proud, S.R. Evaluation of Earth Observation based global long-term vegetation trends-Comparing GIMMS and MODIS global NDVI time series. Remote Sens. Environ. 2012, 119, 131–147. [Google Scholar] [CrossRef]
  23. Duan, H.; Zhao, H.; Jiang, Y.; Li, Y. Analysis of Seasonal Grassland Change and Its Drivers during 1982–2006 in Xinjiang. Rangel. Ecol. Manag. 2017, 70, 422–429. [Google Scholar] [CrossRef]
  24. Jiapaer, G.; Liang, S.; Yi, Q.; Liu, J. Vegetation dynamics and responses to recent climate change in Xinjiang using leaf area index as an indicator. Ecol. Indic. 2015, 58, 64–76. [Google Scholar]
  25. Mohammat, A.; Wang, X.; Xu, X.; Peng, L.; Yang, Y.; Zhang, X.; Myneni, R.B.; Piao, S. Drought and spring cooling induced recent decrease in vegetation growth in Inner Asia. Agric. For. Meteorol. 2013, 178–179, 21–30. [Google Scholar] [CrossRef]
  26. Stow, D.; Daeschner, S.; Hope, A.; Douglas, D.; Petersen, A.; Myneni, R.; Zhou, L.; Oechel, W. Variability of the Seasonally Integrated Normalized Difference Vegetation Index across the North Slope of Alaska in the 1990s. Int. J. Remote Sens. 2003, 24, 1111–1117. [Google Scholar] [CrossRef]
  27. Kong, D.; Zhang, Q.; Singh, V.P.; Shi, P. Seasonal vegetation response to climate change in the Northern Hemisphere (1982–2013). Glob. Planet. Chang. 2017, 148, 1–8. [Google Scholar] [CrossRef] [Green Version]
  28. Chen, C.; Park, T.; Wang, X.; Piao, S.; Xu, B.; Chaturvedi, R.K.; Fuchs, R.; Brovkin, V.; Ciais, P.; Fensholt, R.; et al. China and India lead in greening of the world through land-use management. Nat. Sustain. 2019, 2, 122–129. [Google Scholar] [CrossRef]
  29. Chuai, X.; Qi, X.; Zhang, X.; Li, J.; Yuan, Y.; Guo, X.; Huang, X.; Park, S.; Zhao, R.; Xie, X.; et al. Land degradation monitoring using terrestrial ecosystem carbon sinks/sources and their response to climate change in China. Land Degrad. Dev. 2018, 29, 3489–3502. [Google Scholar] [CrossRef]
  30. Gao, Q.; Wan, Y.; Xu, H.; Li, Y.; Jiangcun, W.; Borjigidai, A. Alpine grassland degradation index and its response to recent climate variability in Northern Tibet, China. Quatern. Int. 2010, 226, 143–150. [Google Scholar] [CrossRef]
  31. Fang, S.; Yan, J.; Che, M.; Zhu, Y.; Liu, Z.; Pei, H.; Zhang, H.; Xu, G.; Lin, X. Climate change and the ecological responses in Xinjiang, China: Model simulations and data analyses. Quatern. Int. 2013, 311, 108–116. [Google Scholar] [CrossRef]
  32. Yao, J.; Zhao, Y.; Chen, Y.; Yu, X.; Zhang, R. Multi-scale assessments of droughts: A case study in Xinjiang, China. Sci. Total Environ. 2018, 630, 444–452. [Google Scholar] [CrossRef] [PubMed]
  33. Wu, Z.; Xu, H.; Li, Y.; Wen, L.; Li, J.; Lu, G.; Li, X. Climate and drought risk regionalisation in China based on probabilistic aridity and drought index. Sci. Total Environ. 2018, 612, 513–521. [Google Scholar] [CrossRef] [PubMed]
  34. Sun, W.; Song, X.; Mu, X.; Gao, P.; Wang, F.; Zhao, G. Spatiotemporal vegetation cover variations associated with climate change and ecological restoration in the Loess Plateau. Agric. For. Meteorol. 2015, 209–210, 87–99. [Google Scholar] [CrossRef]
  35. Zhou, X.; Geng, X.; Yin, G.; Hänninen, H.; Hao, F.; Zhang, X.; Fu, Y.H. Legacy effect of spring phenology on vegetation growth in temperate China. Agric. For. Meteorol. 2020, 281, 107845. [Google Scholar] [CrossRef]
  36. Qin, Y.; Li, B.; Chen, Z.; Chen, Y.; Lian, L. Spatio-temporal variations of nonlinear trends of precipitation over an arid region of northwest China according to the extreme-point symmetric mode decomposition method. Int. J. Clim. 2018, 38, 2239–2249. [Google Scholar] [CrossRef]
  37. Wang, J.; Li, Z. Extreme-point Symmetric Mode Decomposition method for data analysis. Adv. Adapt. Data Anal. 2013, 5, 1350015. [Google Scholar] [CrossRef]
  38. Smith, M.D. The ecological role of climate extremes: Current understanding and future prospects. J. Ecol. 2011, 99, 651–655. [Google Scholar] [CrossRef]
  39. Yao, J.; Chen, Y.; Zhao, Y.; Mao, W.; Xu, X.; Liu, Y.; Yang, Q. Response of vegetation NDVI to climatic extremes in the arid region of Central Asia: A case study in Xinjiang, China. Theor. Appl. Clim. 2018, 131, 1503–1515. [Google Scholar] [CrossRef]
  40. Tan, Z.; Tao, H.; Jiang, J.; Zhang, Q. Influences of Climate Extremes on NDVI (Normalized Difference Vegetation Index) in the Poyang Lake Basin, China. Wetlands 2015, 35, 1033–1042. [Google Scholar] [CrossRef]
  41. Merino, A.; Fernández-González, S.; García-Ortega, E.; Sánchez, J.L.; López, L.; Gascón, E. Temporal continuity of extreme precipitation events using sub-daily precipitation: Application to floods in the Ebro basin, northeastern Spain. Int. J. Clim. 2018, 38, 1877–1892. [Google Scholar] [CrossRef]
  42. Agel, L.; Barlow, M.; Colby, F.; Binder, H.; Catto, J.L.; Hoell, A.; Cohen, J. Dynamical analysis of extreme precipitation in the US northeast based on large-scale meteorological patterns. Clim. Dynam. 2019, 52, 1739–1760. [Google Scholar] [CrossRef] [Green Version]
  43. Almazroui, M.; Islam, M.N.; Dambul, R.; Jones, P.D. Trends of temperature extremes in Saudi Arabia. Int. J. Clim. 2014, 34, 808–826. [Google Scholar] [CrossRef]
  44. Yu, Z.; Li, X. Recent trends in daily temperature extremes over northeastern China (1960–2011). Quatern. Int. 2015, 380–381, 35–48. [Google Scholar] [CrossRef]
  45. Zhao, Y.; Zou, X.; Cao, L.; Xu, X. Changes in precipitation extremes over the Pearl River Basin, southern China, during 1960–2012. Quatern. Int. 2014, 333, 26–39. [Google Scholar] [CrossRef]
  46. Fu, B.; Burgher, I. Riparian vegetation NDVI dynamics and its relationship with climate, surface water and groundwater. J. Arid. Environ. 2015, 113, 59–68. [Google Scholar] [CrossRef]
  47. Wang, Y.; Yang, J.; Chen, Y.; Fang, G.; Duan, W.; Li, Y.; De Maeyer, P. Quantifying the Effects of Climate and Vegetation on Soil Moisture in an Arid Area, China. Water 2019, 11, 767. [Google Scholar] [CrossRef] [Green Version]
  48. Wu, P.; Zhang, J.; Tan, J.; Liang, F. Research on Spatial Interpolation Accuracy Optimization of Air Temperature in Xinjiang Based on DEM. Desert. Oasis Meteorol. 2019, 13, 108–114. [Google Scholar]
  49. Wu, Z.; Wu, J.; Liu, J.; He, B.; Lei, T.; Wang, Q. Increasing terrestrial vegetation activity of ecological restoration program in the Beijing–Tianjin Sand Source Region of China. Ecol. Eng. 2013, 52, 37–50. [Google Scholar] [CrossRef]
  50. Wessels, K.J.; van den Bergh, F.; Scholes, R.J. Limits to detectability of land degradation by trend analysis of vegetation index data. Remote Sens. Environ. 2012, 125, 10–22. [Google Scholar] [CrossRef]
  51. Ma, M.; Frank, V. Interannual variability of vegetation cover in the Chinese Heihe River Basin and its relation to meteorological parameters. Int. J. Remote Sens. 2006, 27, 3473–3486. [Google Scholar] [CrossRef]
  52. Liang, K.; Bai, P.; Li, J.; Liu, C. Variability of temperature extremes in the Yellow River basin during 1961–2011. Quatern. Int. 2014, 336, 52–64. [Google Scholar] [CrossRef]
  53. Wu, Z.; Zhang, H.; Krause, C.M.; Cobb, N.S. Climate change and human activities: A case study in Xinjiang, China. Clim. Chang. 2010, 99, 457–472. [Google Scholar] [CrossRef]
  54. Tang, X.; Lv, X.; He, Y. Features of climate change and their effects on glacier snow melting in Xinjiang, China. Comptes Rendus Geosci. 2013, 345, 93–100. [Google Scholar] [CrossRef]
  55. Yao, J.; Hu, W.; Chen, Y.; Huo, W.; Zhao, Y.; Mao, W.; Yang, Q. Hydro-climatic changes and their impacts on vegetation in Xinjiang, Central Asia. Sci. Total Environ. 2019, 660, 724–732. [Google Scholar] [CrossRef] [PubMed]
  56. Huang, Q.; Zhang, Q.; Singh, V.P.; Shi, P.; Zheng, Y. Variations of dryness/wetness across China: Changing properties, drought risks, and causes. Glob. Planet. Chang. 2017, 155, 1–12. [Google Scholar] [CrossRef]
  57. Yuan, J.; Bian, Z.; Yan, Q.; Gu, Z.; Yu, H. An Approach to the Temporal and Spatial Characteristics of Vegetation in the Growing Season in Western China. Remote Sens. 2020, 12, 945. [Google Scholar] [CrossRef] [Green Version]
  58. De Vries, F.T.; Griffiths, R.I.; Bailey, M.; Craig, H.; Girlanda, M.; Gweon, H.S.; Hallin, S.; Kaisermann, A.; Keith, A.M.; Kretzschmar, M.; et al. Soil bacterial networks are less stable under drought than fungal networks. Nat. Commun. 2018, 9, 3033. [Google Scholar] [CrossRef] [Green Version]
  59. Song, X.; Yang, J.; Zhao, M.; Zhang, G.; Liu, F.; Wu, H. Heuristic cellular automaton model for simulating soil organic carbon under land use and climate change: A case study in eastern China. Agric. Ecosyst. Environ. 2019, 269, 156–166. [Google Scholar] [CrossRef]
  60. Doetterl, S.; Stevens, A.; Six, J.; Merckx, R.; Van Oost, K.; Casanova Pinto, M.; Casanova-Katny, A.; Muñoz, C.; Boudin, M.; Zagal Venegas, E.; et al. Soil carbon storage controlled by interactions between geochemistry and climate. Nat. Geosci. 2015, 8, 780–783. [Google Scholar] [CrossRef]
Figure 1. Location of the study area of Xinjiang (A) in China (B). The figure was mapping based on the Standard Map NO.GS (2016)2923, which could be downloaded from the Ministry of Natural Resources in China (http://bzdt.ch.mnr.gov.cn/). The elevation data was collected from Resource and Environment Data Cloud Platform of China (http://www.resdc.cn/AchievementList1.aspx).
Ijerph 17 04865 g001
Figure 2. Technical flow chart. (i) Data preprocessing, (ii) spatio-temporal characteristics of the NDVI and climate change, and (iii) the effects on the NDVI and LULC by the climate change. Tem and Pre denotes the temperature and precipitation, respectively. Sk includes S1, S2, S3, and S4, represents spring, summer, autumn, and growing seasons, respectively. IDW is the Inverse Distance Weighting; ESMD is the Extreme-point Symmetric Mode Decomposition; LRM is the Linear Regression Method.
Ijerph 17 04865 g002
Figure 3. Yearly average temperature (A) and precipitation (B) for growing season in Xinjiang during 2000–2018. The Figure was mapping based on the daily meteorological data in 2000–2018 from the National Meteorological Data Center of China (http://data.cma.cn/).
Ijerph 17 04865 g003
Figure 4. Spatial-temporal change for temperature and precipitation in Xinjiang during 2000–2018. (A,C) denote the spatial pattern for the change of temperature and precipitation, respectively. (B,D) are the interannual variations and the trends of temperature and precipitation, respectively. 1~4 denotes the in spring, summer, autumn, and the growing season, respectively.
Ijerph 17 04865 g004
Figure 5. Yearly average extreme climate indices in Xinjiang during 2000–2018. The meanings of the abbreviation are as follows: Mean Minimum Temperature (TMINmean); Diurnal temperature range (DTR); Frost day (FD0); Summer days (SU25); Growing season length (GSL); Warm nights (TN90p); Warm speel duration index (WSDI); Cold speel duration index (CSDI); Number of heavy precipitation days (R10mm); Consecutive dry days (CDD); Consecutive wet days (CWD); Simple daily intensity index (SDII); Maximum 1-day precipitation (R × 1day); Wet day precipitation (PRCPTOT); Very wet day precipitation (R95p).
Ijerph 17 04865 g005
Figure 6. Yearly average NDVI for growing season in Xinjiang during 2000–2018.
Ijerph 17 04865 g006
Figure 7. Spatial-temporal change of NDVI in Xinjiang during 2000–2018. (A) and (B) are the variation and its significance of NDVI. (C) denotes the interannual variations and the trends of NDVI. The NS represents the correlation is not significant. The NVCA denotes the non-vegetation covered areas.
Ijerph 17 04865 g007
Figure 8. The LULC of Xinjiang in 2000 (A) and 2018 (B). HC, MC, and LC denote the high coverage, moderated coverage, and low coverage, respectively.
Ijerph 17 04865 g008
Figure 9. Regional difference of the Pearson correlation coefficients between the GNDVI and climate in growing seasons of Xinjiang. (A) and (B) denote the temperature and precipitation, respectively. NS denotes the correlation is not significant. The NVCA denotes the non-vegetation covered areas.
Ijerph 17 04865 g009
Figure 10. Pearson correlation coefficients between GNDVI and extreme climate indices in Xinjiang. The meanings of the indices are same as Figure 5. NS denotes the correlation is not significant. The NVCA denotes the non-vegetation covered areas.
Ijerph 17 04865 g010
Table 1. Definitions of extreme climate indices used in this study.
TemperaturePrecipitation
AbbreviationIndex NameUnitAbbreviationIndex NameUnit
TMINmeanMean Minimum Temperature°CR10mmNumber of heavy precipitation daysd
DTRDiurnal temperature range°CCDDConsecutive dry daysd
FD0Frost daysdCWDConsecutive wet daysd
SU25Summer daysdSDIISimple daily intensity indexmm·d−1
GSLGrowing season lengthdR × 1dayMaximum precipitation per daymm
TN90pWarm nightsdPRCPTOTWet day precipitationmm
WSDIWarm speel duration indexdR95pVery wet day precipitationmm
CSDICold speel duration indexd
Table 2. The variation trends of the extreme climate indices.
TablePrecipitation
IndexRateUnitIndexRateUnit
TMINmean0.294°C·(10a)−1R10mm0.592d·(10a)−1
DTR−0.211°C·(10a)−1CDD0.718d·(10a)−1
FD0−4.221 **d·(10a)−1CWD0.013d·(10a)−1
SU25−0.578d·(10a)−1SDII0.315 **mm·(d·10a)−1
GSL2.335d·(10a)−1R × 1day2.254mm·(10a)−1
TN90p0.744 *d·(10a)−1PRCPTOT13.909mm·(10a)−1
WSDI−0.205d·(10a)−1R95p7.318mm·(10a)−1
CSDI−0.891d·(10a)−1
Note: significant at *—p < 0.1, and **—p < 0.05, respectively. The meanings of the abbreviations are the same as in Figure 5.
Table 3. Statistics of the LULC in 2000 and 2018 (km2).
AreaID123456789101112
Xinjiang200059,41920,94117,260114,276116,699246,208926938,2354295404,838294,385309,218
201890,25313,72113,908132,260110,666239,07911,35717,7998621405,168294,932297,279
Change+30,834−7220−3352+17,984−6033−7129+2088−20,436+4326+330+547−11,939
NXC200032,47717,328681265,75650,90379,38634745954285858,502168,582104,617
201847,62810,758388075,66747,61487,37243822215566350,985147,471113,014
Change+15,151−6570−2932+9911−3289+7986+908−3739+2805−7517−21,111+8397
SXC200026,930360310,44148,50165,77516,6794579532,2171437346,335125,753204,813
201842,619296110,02256,55063,03615,1661697515,5562958354,184147,422184,450
Change+15,689−642−419+8049−2739−15133+1180−16,661+1521+7849+21,669−20,363
Note: The ID means: 1, Cultivated land; 2, Forest; 3, Shrub; 4, Grassland (HC); 5, Grassland (MC); 6, Grassland (LC); 7, Water; 8, Permanent snow; 9, Construction land; 10, Sandy desert; 11, Gobi desert; 12, Bare land.
Table 4. Transfer matrix of LULC in 2000 and 2018 (km2).
XinjiangYear2000Transfer in
YearID123456789101112
2018148,12267725673764798313,073525 192861714323112042,131
246616079746721183376136322136701117561
3126214502564195822012530122369134722118111,344
48999930330769,92622,94979444793557711641102710,53062,334
51766117828091821037,46326,1504131147834786253914,12273,203
626725742448667728,962102,422493176518813,27323,43856,167136,657
7320201184420675808599191314798064515366
8 4172350327 13180 538604619
9317041146134244105080 165755512762686964
103001301625998371934,455455 7835,70774034229748,091
1165293587476253126,2914655416513,822222,39327,40372,539
122105032256969843930,78211018,48841455134,253192,708104,571
Transfer out11,29714,78114,69644,35079,236143,786327825,055263847,76171,992116,510
NXCYear2000Transfer in
YearID123456789101112
2018126,023309859184735307201180 10973162259782321,605
236556739938536128779223332565191
312697544810784804432919501201213432
45868657227344,04811,890281718942749522449376031,619
512738181360811320,77010,34712962668331355248826,844
61972313907251810,86139,15415774144376013,96113,55148,218
71861414919015920324913105342661501891
8 4 411923 1469 659746
9184329999616887715 12501908542424413
10117361451332887213120 6941,20910725839776
1121741150101297562939 1305873124,90910,08522,562
129843812337381829539246391632233622,96772,09940,915
Transfer out645411,761636421,70830,13340,2329834485160817,29343,67332,518
SXCYear2000Transfer in
YearID123456789101112
2018122,0943681708191744535871345 8313009172629720,525
2105923978195712895730 10338552369
31134475211587917202086932601297101607907
43101265102925,86811,05051252903130221118578676530,682
5492360144910,09316,68815,8032841085173953118411,62846,348
66992601541415718,09563,2543361690449513947742,59588,407
7134601352305166053500639455403013475
8 131331302 11,688 531983868
913271247387617365 407365422262551
10183941480865343127,242335 9315,8692962171438,315
1143552437375223420,6614265435794897,45217,31349,970
12112651023229661025,3836414,5329221511,268120,86163,589
Transfer out48363011832622,63349,087103,540229520,529103030,46628,30183,952
Note: The meaning of the ID is same as Table 3.
Table 5. Pearson correlation coefficient between the NDVI and climate for different seasons in Xinjiang from 2000–2018.
IndexTemperaturePrecipitation
S1NDVI−0.0820.538 ***
S2NDVI0.276 *0.747 ***
S3NDVI0.321 *0.278 *
GNDVI0.0820.797 ***
Note: significant at *—p < 0.1, **—p < 0.05, and ***—p < 0.01. The S1NDVI, S2NDVI, S3NDVI, and GNDVI denotes the NDVI in spring, summer, autumn, and growing season.
Table 6. Statistics of the correlations between the GNDVI and extreme climate indices in the vegetation coverage area (VCA) of Xinjiang.
TypeExtreme IndicesPercentage (%)Pearson Correlation Coefficient
NC ***NC **NC *NCPCPC *PC **PC ***
TemperatureTMINmean0.100.611.0126.6754.896.256.853.620.429 *
DTR15.4519.8710.9839.9512.440.430.720.17−0.634 ***
FD01.023.574.0859.8029.820.870.680.16−0.341
SU251.284.134.2352.1835.221.451.170.33−0.082
GSL0.341.521.7545.8647.041.831.400.260.133
TN90p0.110.570.9732.7051.805.235.762.850.311
WSDI0.161.222.1652.9640.161.761.350.23−0.037
CSDI0.201.191.7744.9848.452.021.230.16−0.187
PrecipitationR10mm0.090.400.5011.7246.439.7015.0616.100.751 ***
CDD7.2510.117.1153.4421.200.500.330.06−0.317
CWD0.120.500.7125.0357.866.096.483.210.286
SDII0.080.320.4113.2656.7810.1212.746.280.771 ***
R × 1day0.120.390.4413.3751.5010.7714.089.330.758 ***
PRCPTOT0.120.410.4610.3242.059.9715.7120.960.689 ***
R95p0.060.310.4012.6448.1011.4716.0710.950.721 ***
Note: significant at *—p < 0.1, **—p < 0.05, and ***—p < 0.01, respectively. PC and NC represent the positive and negative correlations, respectively. The meanings of the abbreviations are the same as in Figure 7.

