A Clustering Approach to Classify Italian Regions and Provinces Based on Prevalence and Trend of SARS-CoV-2 Cases
Abstract
:1. Introduction
2. Materials and Methods
- The regional prevalence of SARS-CoV-2 positive cases on 3 May 2020 (i.e., expressed as the number of positive cases per 10,000 residents);
- The weekly regional trend of SARS-CoV-2 positive cases from 27 April to 3 May 2020 (expressed as the percentage of increment/decrement of positive cases);
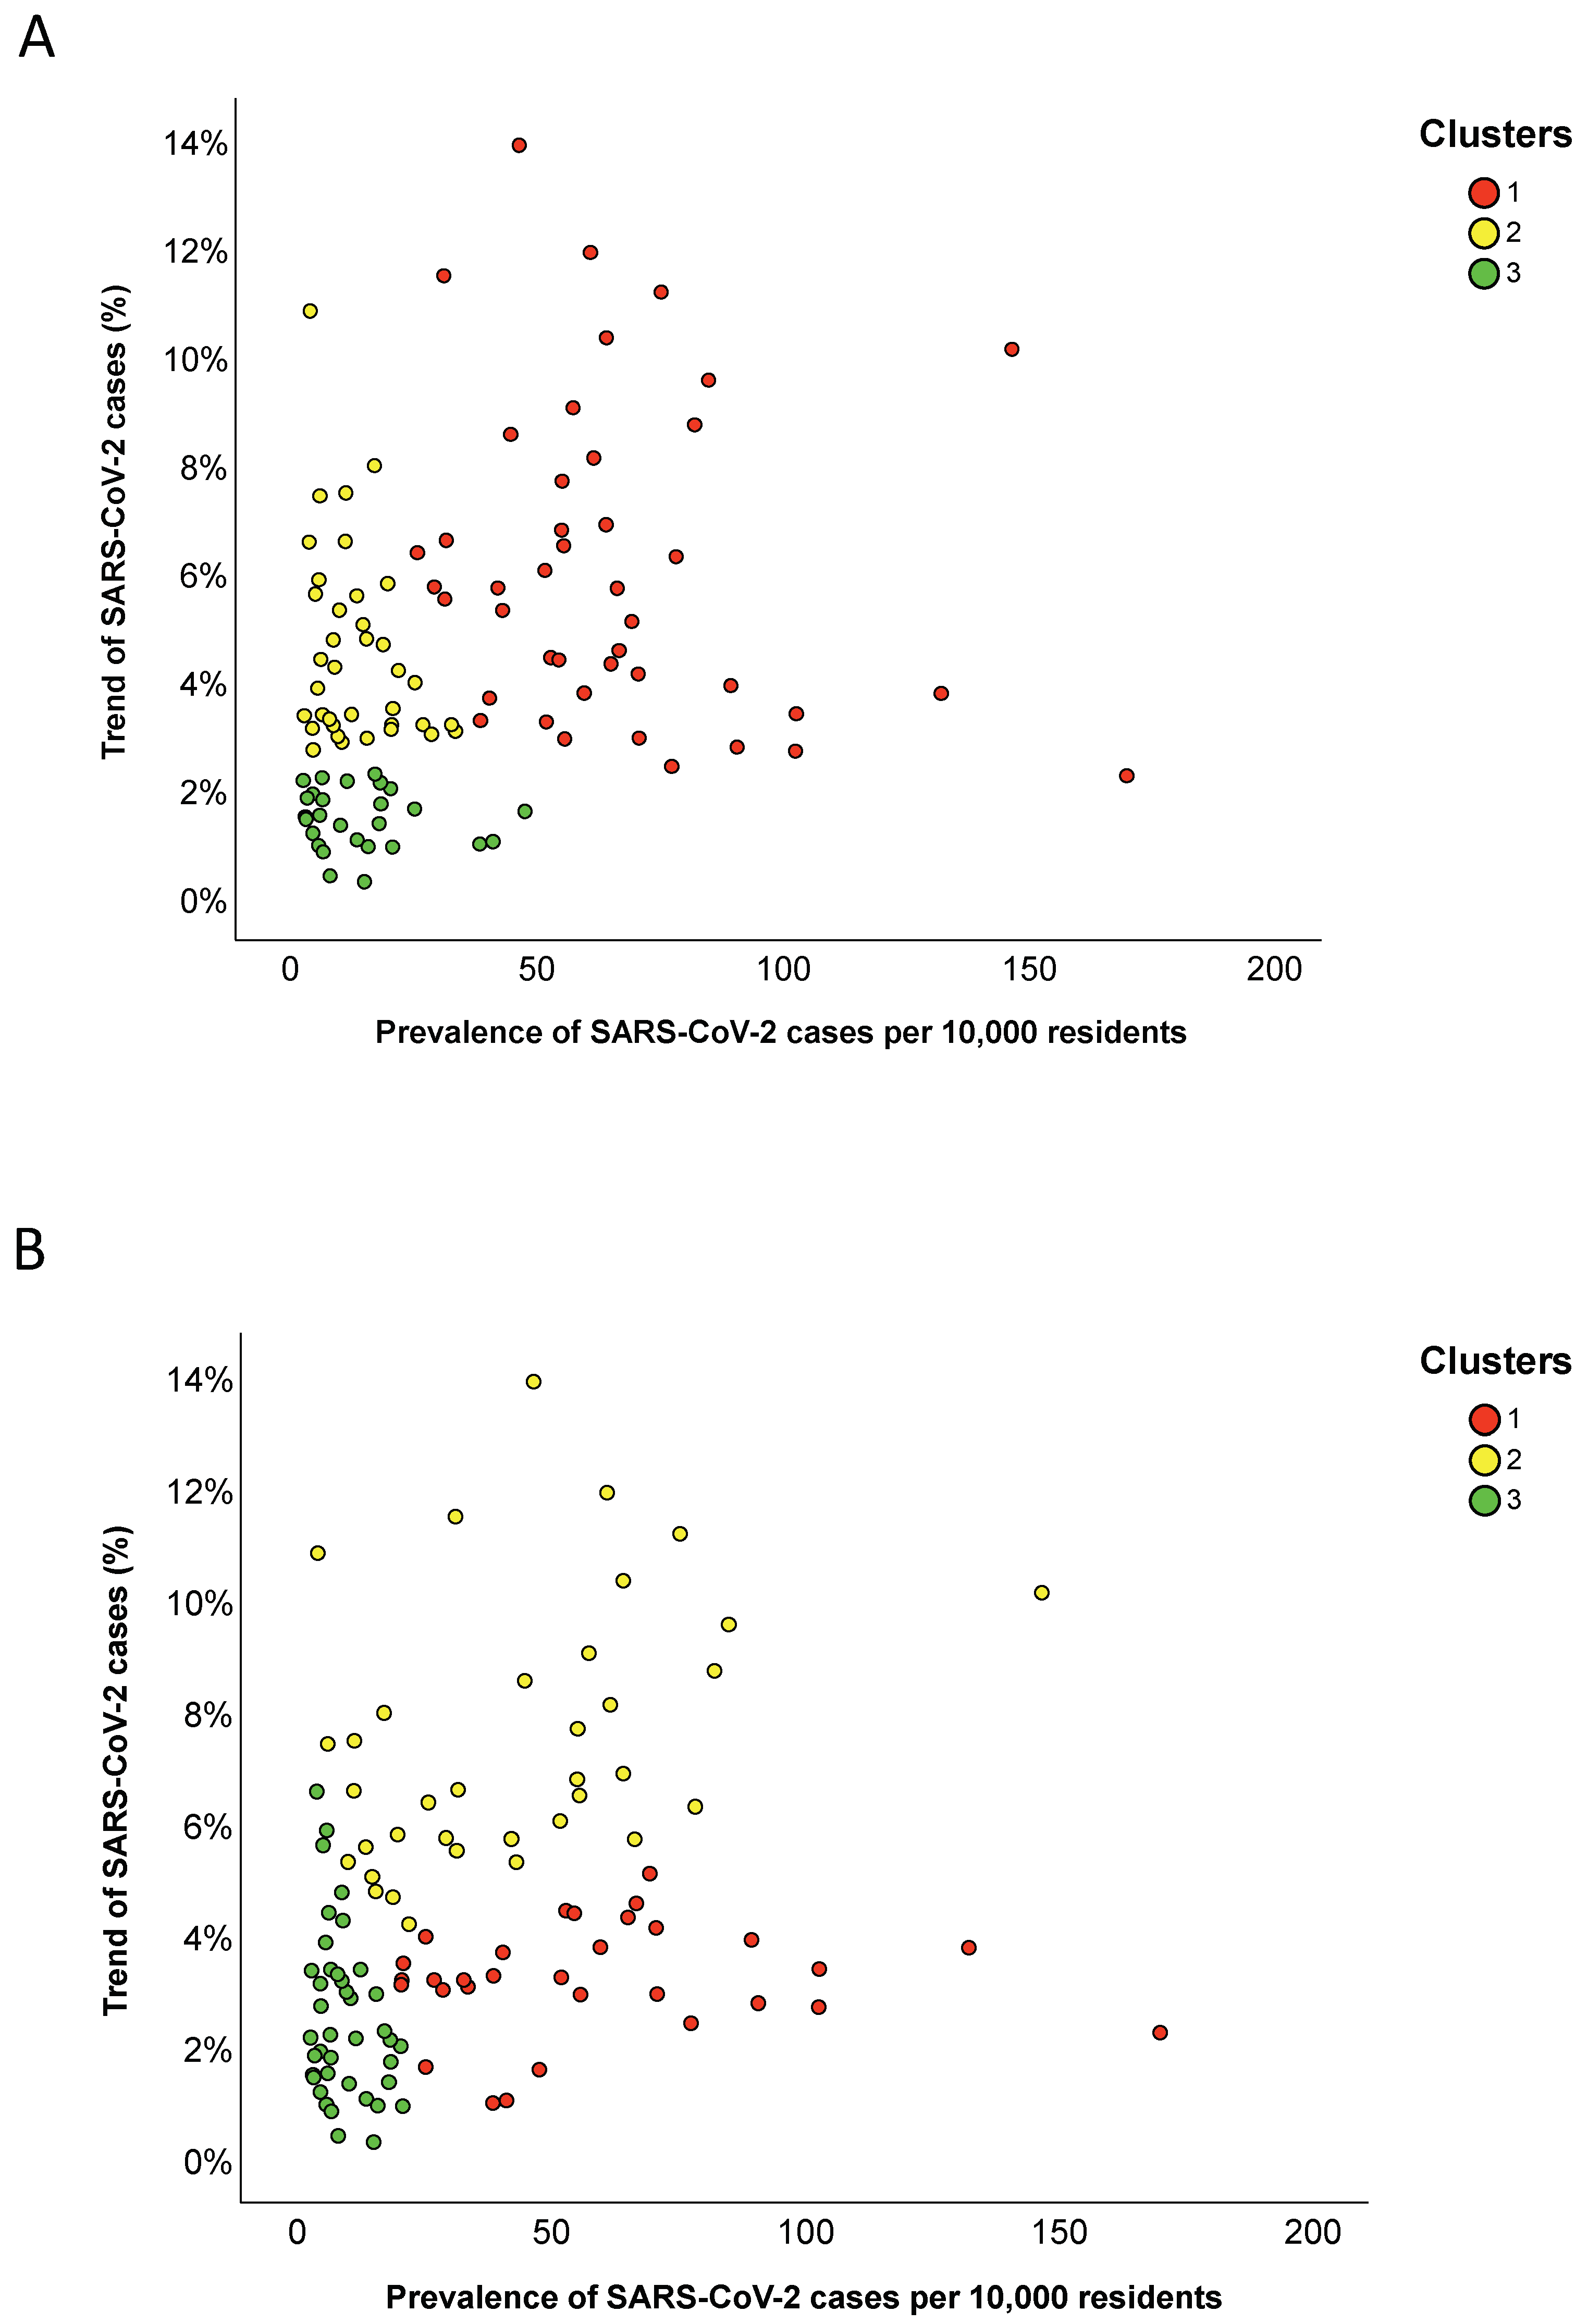
- The provincial prevalence of SARS-CoV-2 cases on 3 May 2020 (i.e., expressed as the number of total cases per 10,000 residents);
- The weekly provincial trend of SARS-CoV-2 cases from 27 April to 3 May 2020 (expressed as percentage of increment of total cases);
- The number of tests performed per 10,000 residents (i.e., only at the regional level).
3. Results
3.1. Description of Data
3.2. Regional Clusters
3.3. Provincial Clusters
4. Discussion
5. Conclusions
Author Contributions
Funding
Conflicts of Interest
References
- World Health Organization. Coronavirus Disease (COVID-19) Dashboard. Available online: https://covid19.who.int/ (accessed on 4 May 2020).
- Day, M. Covid-19: Italy confirms 11 deaths as cases spread from north. BMJ 2020, 368, m757. [Google Scholar] [CrossRef] [PubMed] [Green Version]
- Italian Ministry of Health. Covid-19. Situation Report Update at 4 May 18:00. Available online: http://www.salute.gov.it/portale/nuovocoronavirus/dettaglioNotizieNuovoCoronavirus.jsp?lingua=italiano&menu=notizie&p=dalministero&id=4678 (accessed on 4 May 2020).
- Italian Ministry of Health. Novel Coronavirus. Available online: http://www.salute.gov.it/portale/nuovocoronavirus/homeNuovoCoronavirus.jsp?lingua=english (accessed on 4 May 2020).
- Signorelli, C.; Scognamiglio, T.; Odone, A. COVID-19 in Italy: Impact of containment measures and prevalence estimates of infection in the general population. Acta Biomed. 2020, 91, 175–179. [Google Scholar] [CrossRef] [PubMed]
- Giordano, G.; Blanchini, F.; Bruno, R.; Colaneri, P.; Di Filippo, A.; Di Matteo, A.; Colaneri, M. Modelling the COVID-19 epidemic and implementation of population-wide interventions in Italy. Nat. Med. 2020. [Google Scholar] [CrossRef] [PubMed]
- Maugeri, A.; Barchitta, M.; Battiato, S.; Agodi, A. Modeling the novel coronavirus (SARS-CoV-2) outbreak in Sicily, Italy. Int. J. Environ. Res. Public Health 2020, 17, 4964. [Google Scholar] [CrossRef] [PubMed]
- Tuite, A.R.; Ng, V.; Rees, E.; Fisman, D. Estimation of COVID-19 outbreak size in Italy. Lancet Infect. Dis 2020, 20, 537. [Google Scholar] [CrossRef] [Green Version]
- Gatto, M.; Bertuzzo, E.; Mari, L.; Miccoli, S.; Carraro, L.; Casagrandi, R.; Rinaldo, A. Spread and dynamics of the COVID-19 epidemic in Italy: Effects of emergency containment measures. Proc. Natl. Acad. Sci. USA 2020, 117, 10484–10491. [Google Scholar] [CrossRef] [PubMed] [Green Version]
- Remuzzi, A.; Remuzzi, G. COVID-19 and Italy: What next? Lancet 2020, 395, 1225–1228. [Google Scholar] [CrossRef]
- Altman, N.; Krzywinski, M. Clustering. Nat. Methods 2017, 14, 545–546. [Google Scholar] [CrossRef]
- GitHub. Provincial Data on SARS-CoV-2. Available online: https://github.com/pcm-dpc/COVID-19/tree/master/dati-province (accessed on 4 May 2020).
- GitHub. Regional Data on SARS-CoV-2. Available online: https://github.com/pcm-dpc/COVID-19/tree/master/dati-regioni (accessed on 4 May 2020).
- Dipartimento della Protezione Civile. Aggiornamento Casi COVID-19. Available online: http://opendatadpc.maps.arcgis.com/apps/opsdashboard/index.html#/b0c68bce2cce478eaac82fe38d4138b1 (accessed on 6 July 2020).
- Istituto Nazionale di Statistica, ISTAT. Available online: analysis-and-products/databases (accessed on 4 May 2020).
- Lovmar, L.; Ahlford, A.; Jonsson, M.; Syvänen, A.C. Silhouette scores for assessment of SNP genotype clusters. BMC Genom. 2005, 6, 35. [Google Scholar] [CrossRef] [PubMed]
- GIMBE. Profili Sanitari Della Cosiddetta Fase due: Strategie Ante e Post Covid-19. Available online: https://coronavirus.gimbe.org/var/uploads/contenuti/allegati/Audizione%20Fondazione%20GIMBE%207%20maggio%202020.pdf (accessed on 4 May 2020).
- Sebastiani, G.; Massa, M.; Riboli, E. Covid-19 epidemic in Italy: Evolution, projections and impact of government measures. Eur. J. Epidemiol. 2020, 35. [Google Scholar] [CrossRef] [PubMed]
- Onder, G.; Rezza, G.; Brusaferro, S. Case-fatality rate and characteristics of patients dying in relation to COVID-19 in Italy. JAMA 2020. [Google Scholar] [CrossRef] [PubMed]
- Maugeri, A.; Barchitta, M.; Battiato, S.; Agodi, A. Estimation of unreported novel coronavirus (SARS-CoV-2) infections from reported deaths: A susceptible-exposed-infectious-recovered-dead model. J. Clin. Med. 2020, 9, 1350. [Google Scholar] [CrossRef] [PubMed]
- Kucharski, A.J.; Klepac, P.; Conlan, A.J.K.; Kissler, S.M.; Tang, M.L.; Fry, H.; Gog, J.R.; Edmunds, W.J.; CMMID COVID-19 Working Group. Effectiveness of isolation, testing, contact tracing, and physical distancing on reducing transmission of SARS-CoV-2 in different settings: A mathematical modelling study. Lancet Infect. Dis. 2020. [Google Scholar] [CrossRef]
- Ji, Y.; Ma, Z.; Peppelenbosch, M.P.; Pan, Q. Potential association between COVID-19 mortality and health-care resource availability. Lancet Glob. Health 2020, 8, e480. [Google Scholar] [CrossRef] [Green Version]
- Li, R.; Pei, S.; Chen, B.; Song, Y.; Zhang, T.; Yang, W.; Shaman, J. Substantial undocumented infection facilitates the rapid dissemination of novel coronavirus (SARS-CoV2). Science 2020, 368, 489–493. [Google Scholar] [CrossRef] [PubMed] [Green Version]
- Wang, H.; Wang, Z.; Dong, Y.; Chang, R.; Xu, C.; Yu, X.; Zhang, S.; Tsamlag, L.; Shang, M.; Huang, J.; et al. Phase-adjusted estimation of the number of Coronavirus Disease 2019 cases in Wuhan, China. Cell Discov. 2020, 6, 10. [Google Scholar] [CrossRef] [PubMed] [Green Version]
- Zhao, S.; Musa, S.S.; Lin, Q.; Ran, J.; Yang, G.; Wang, W.; Lou, Y.; Yang, L.; Gao, D.; He, D.; et al. Estimating the unreported number of novel coronavirus (2019-nCoV) cases in China in the first half of January 2020: A data-driven modelling analysis of the early outbreak. J. Clin. Med. 2020, 9, 388. [Google Scholar] [CrossRef] [PubMed] [Green Version]

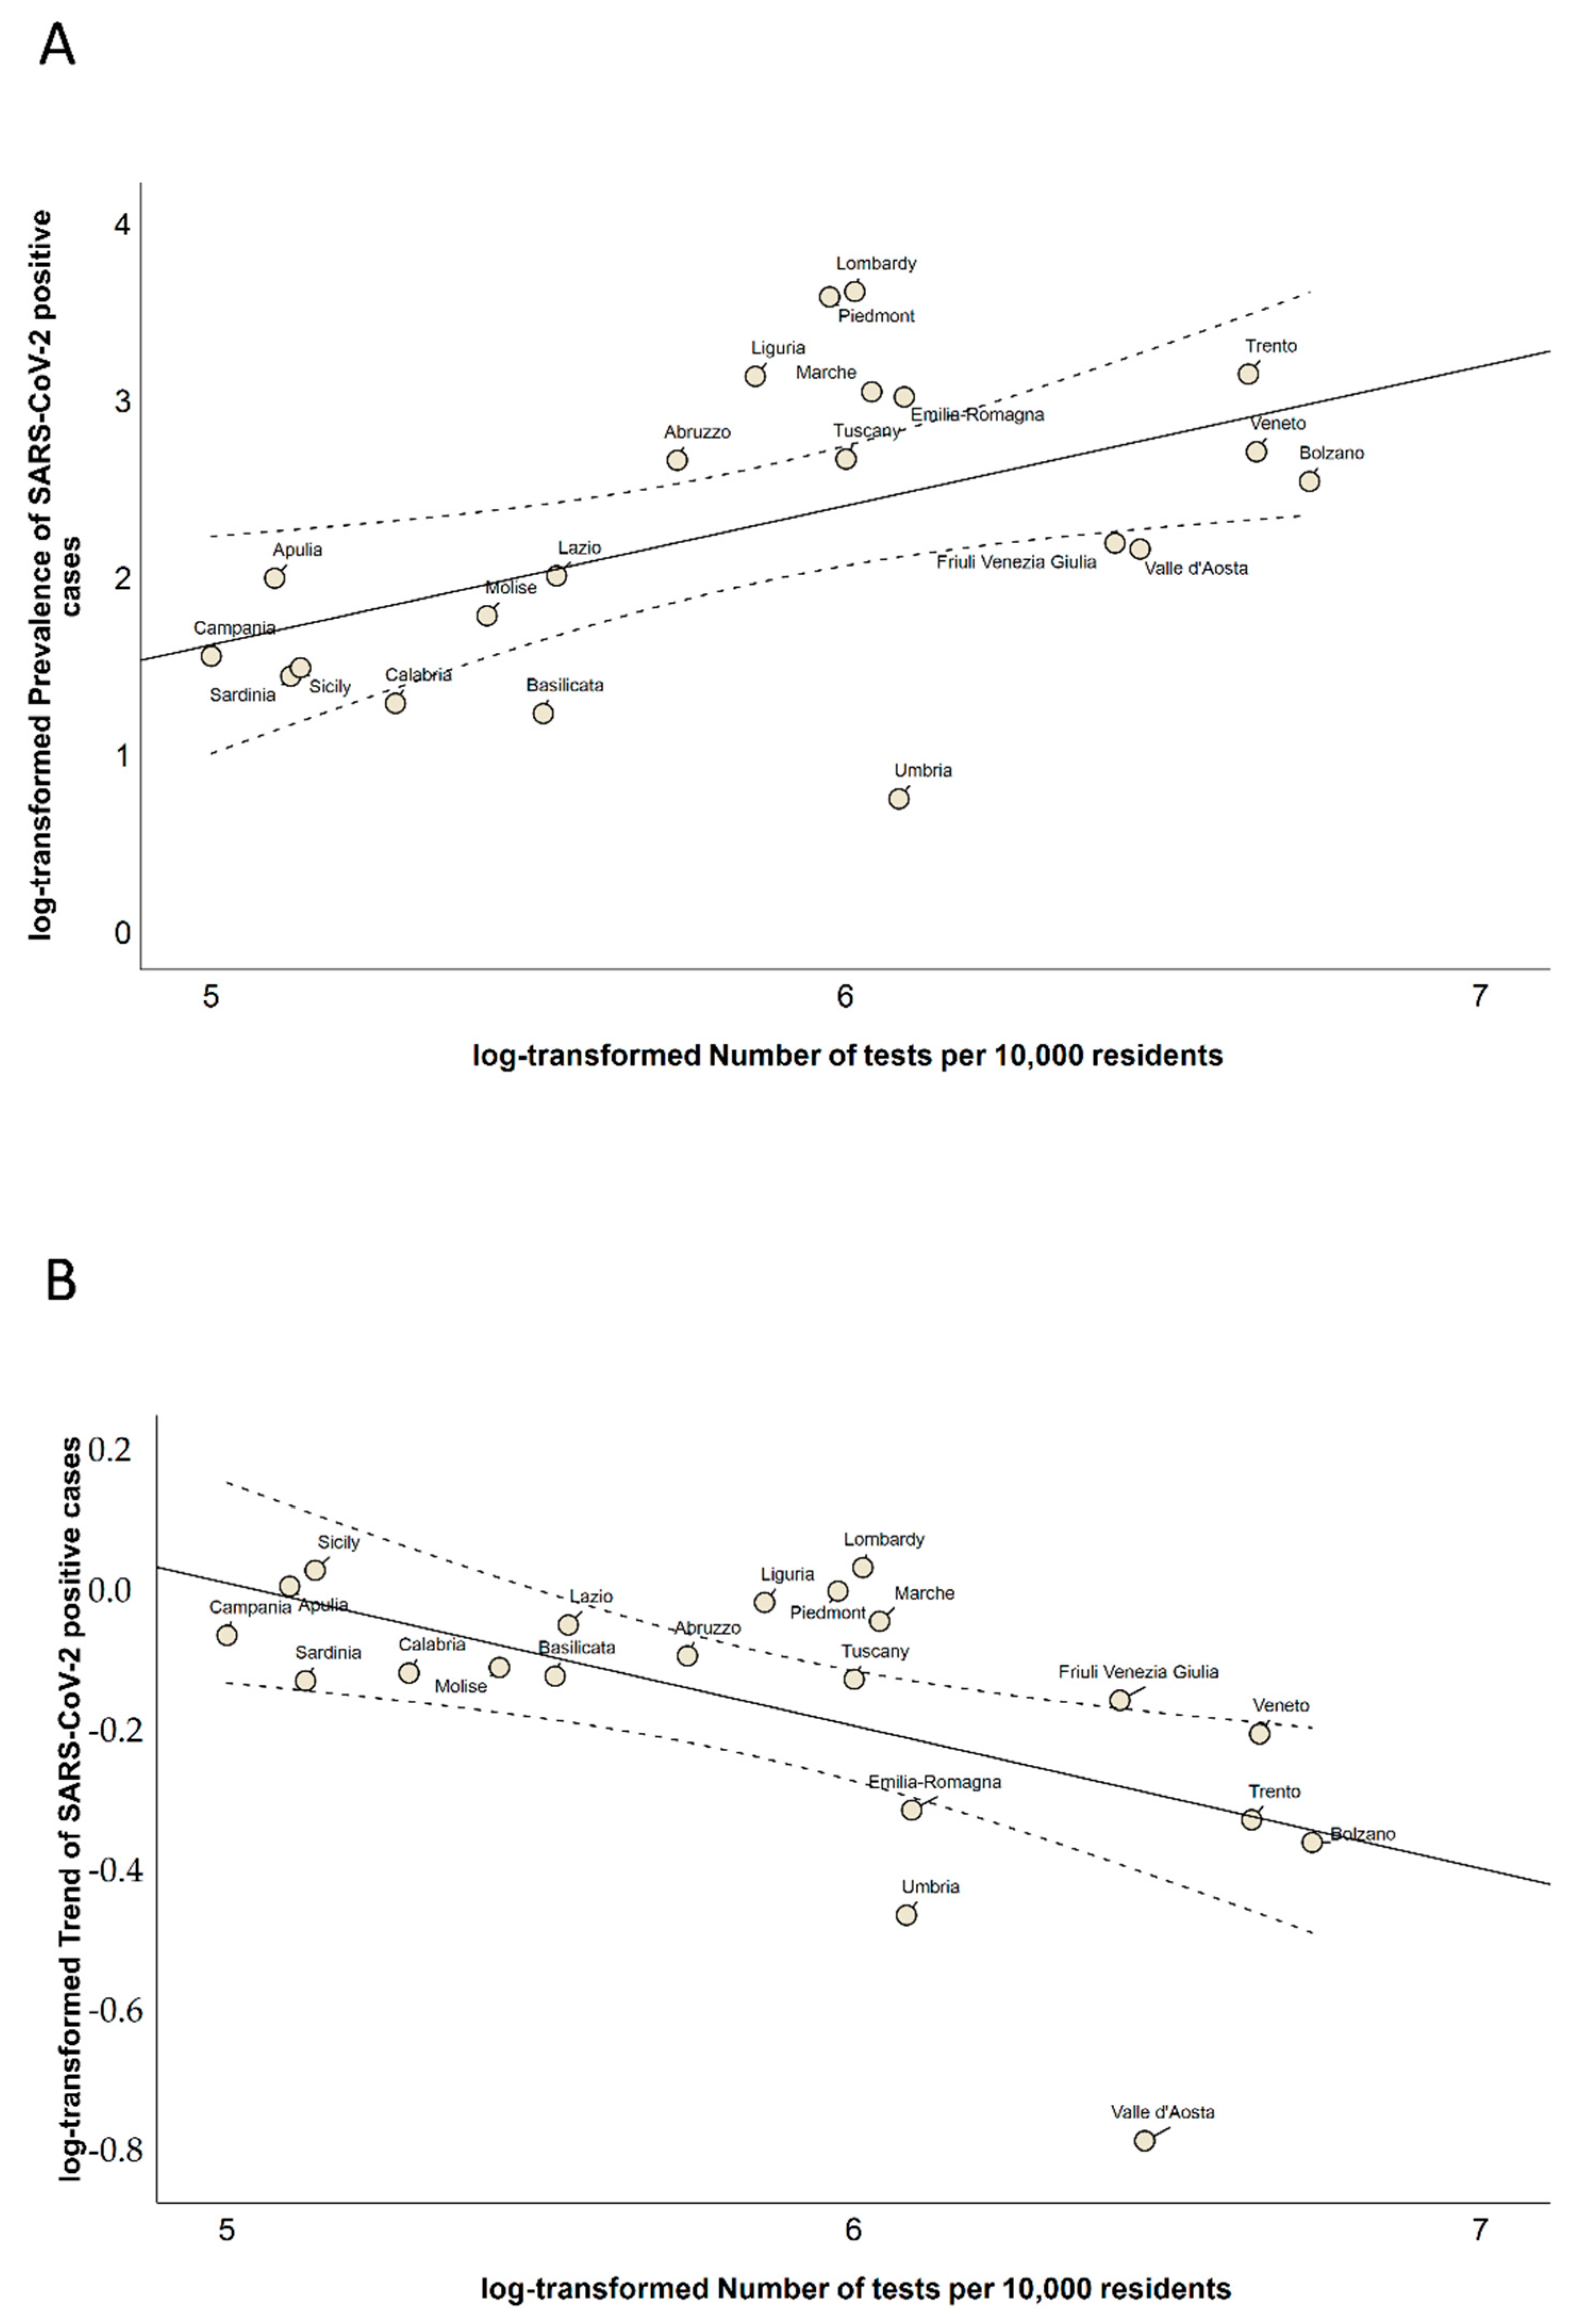
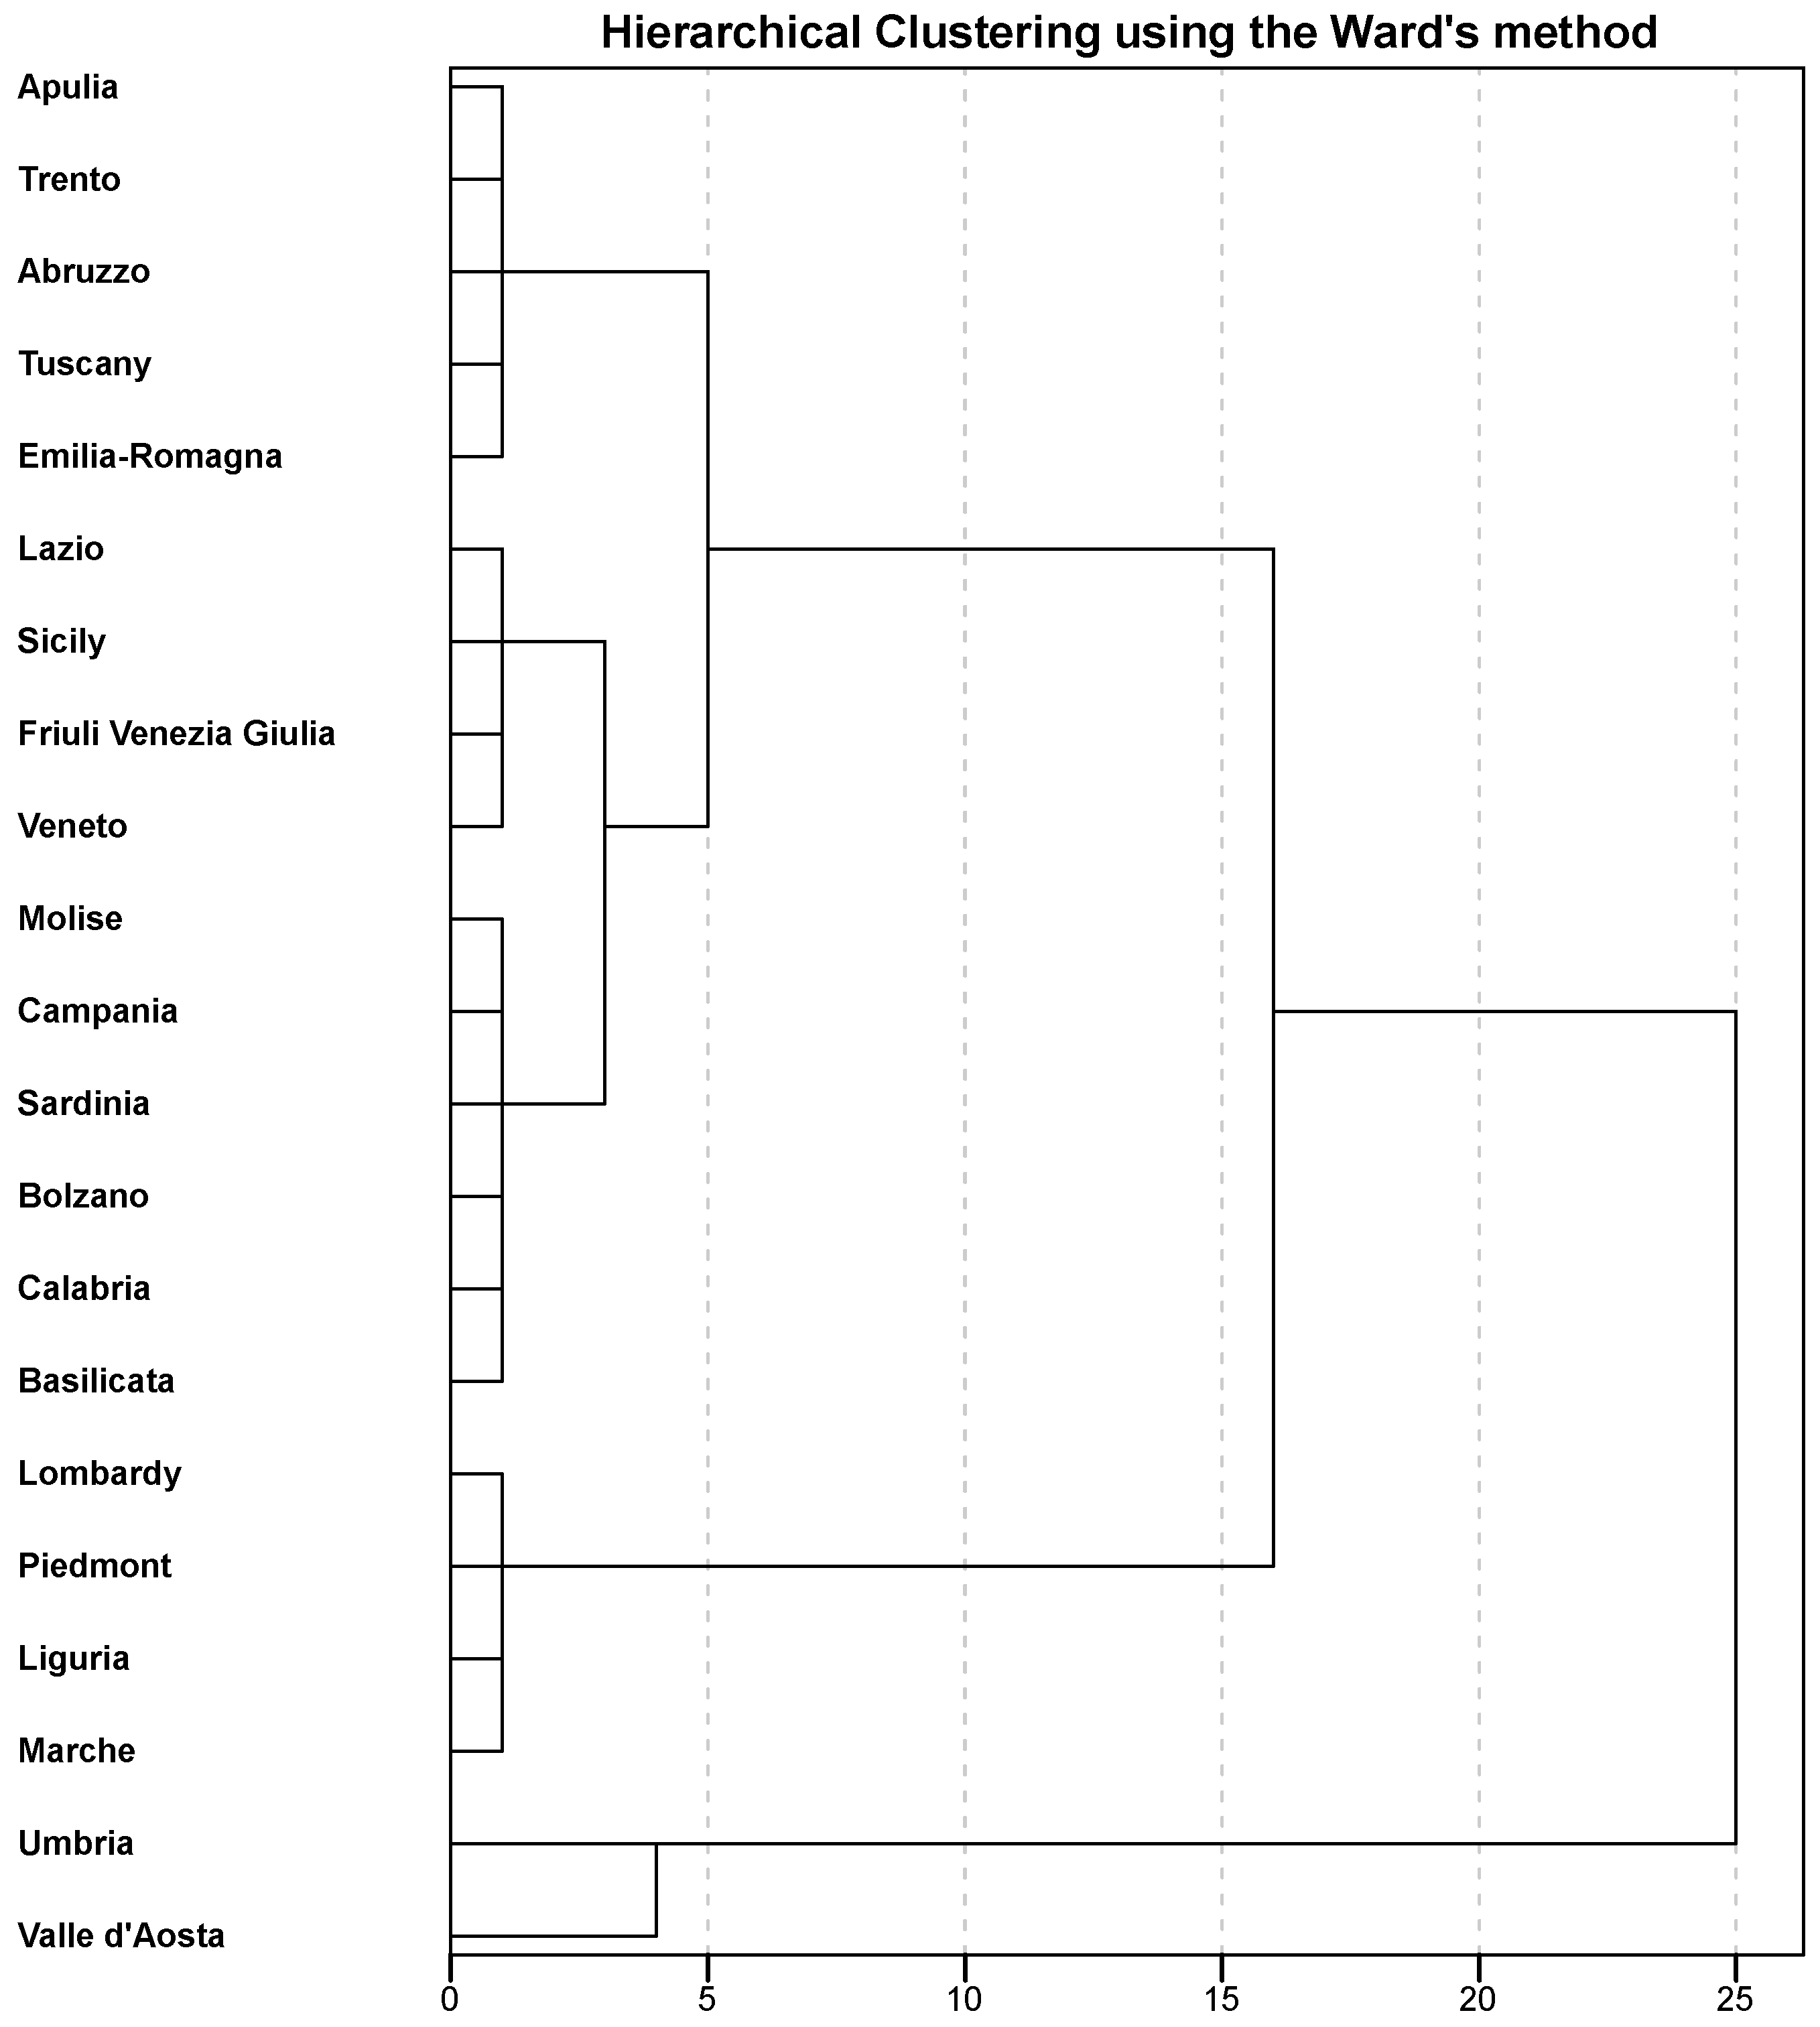
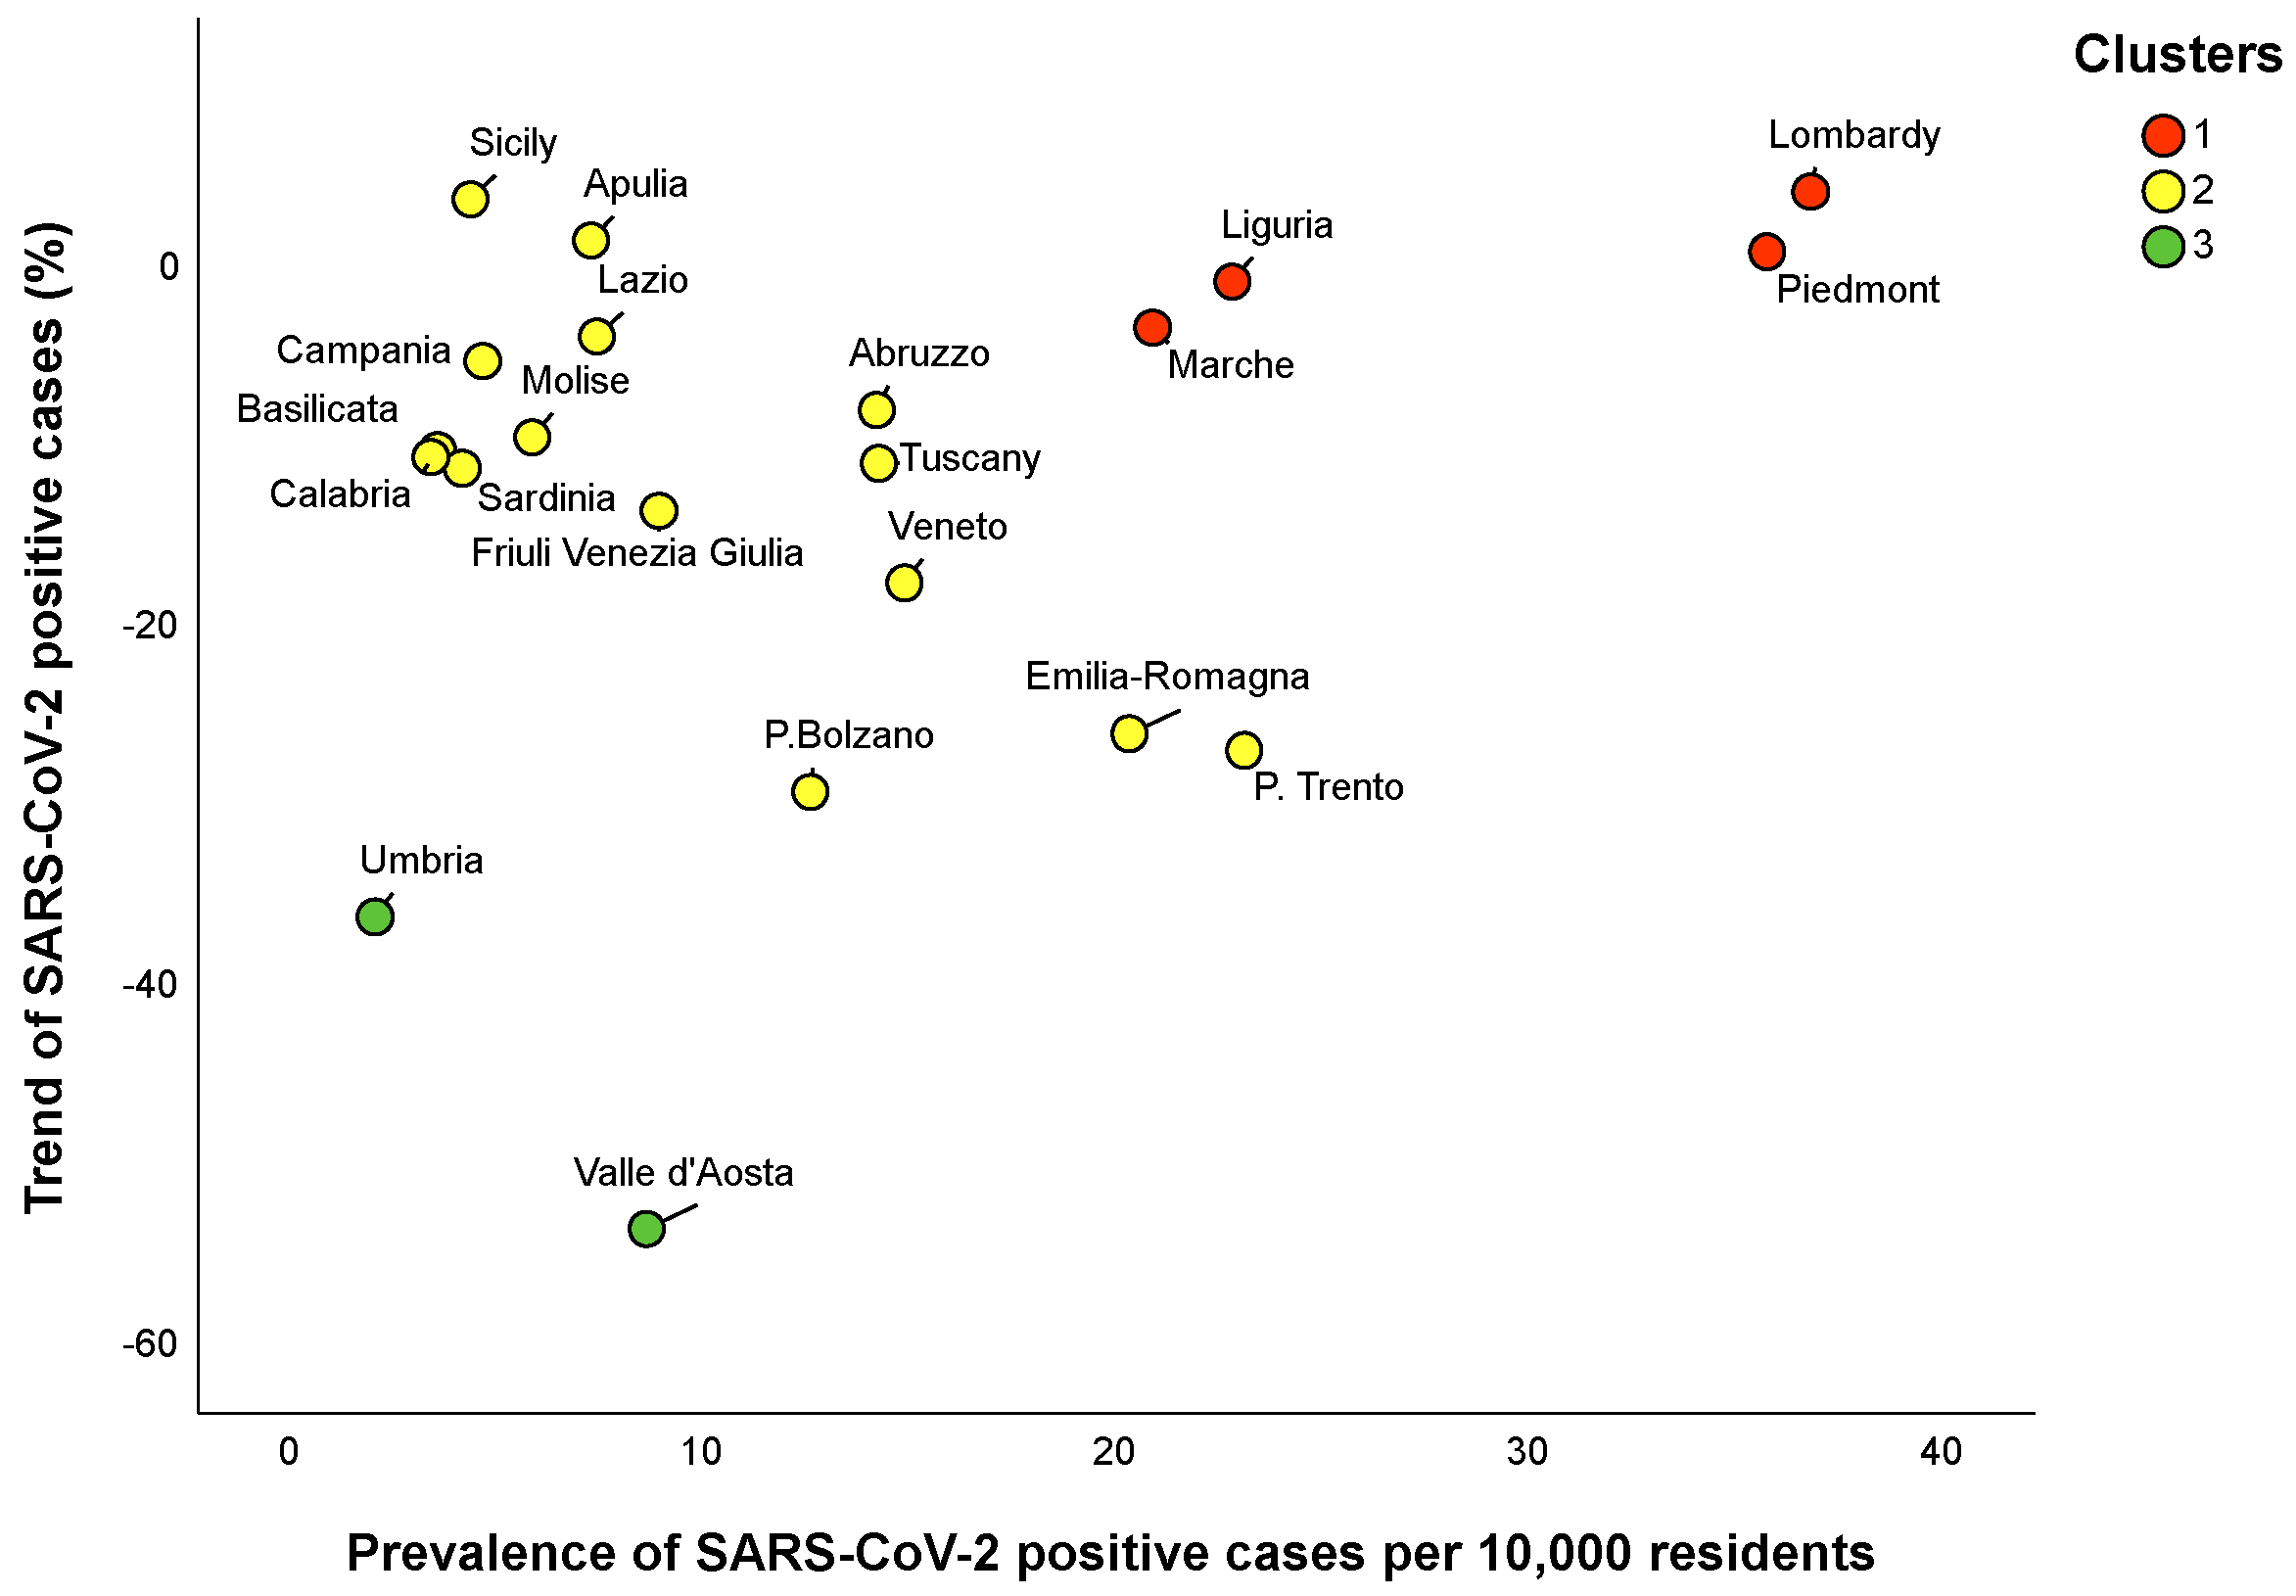
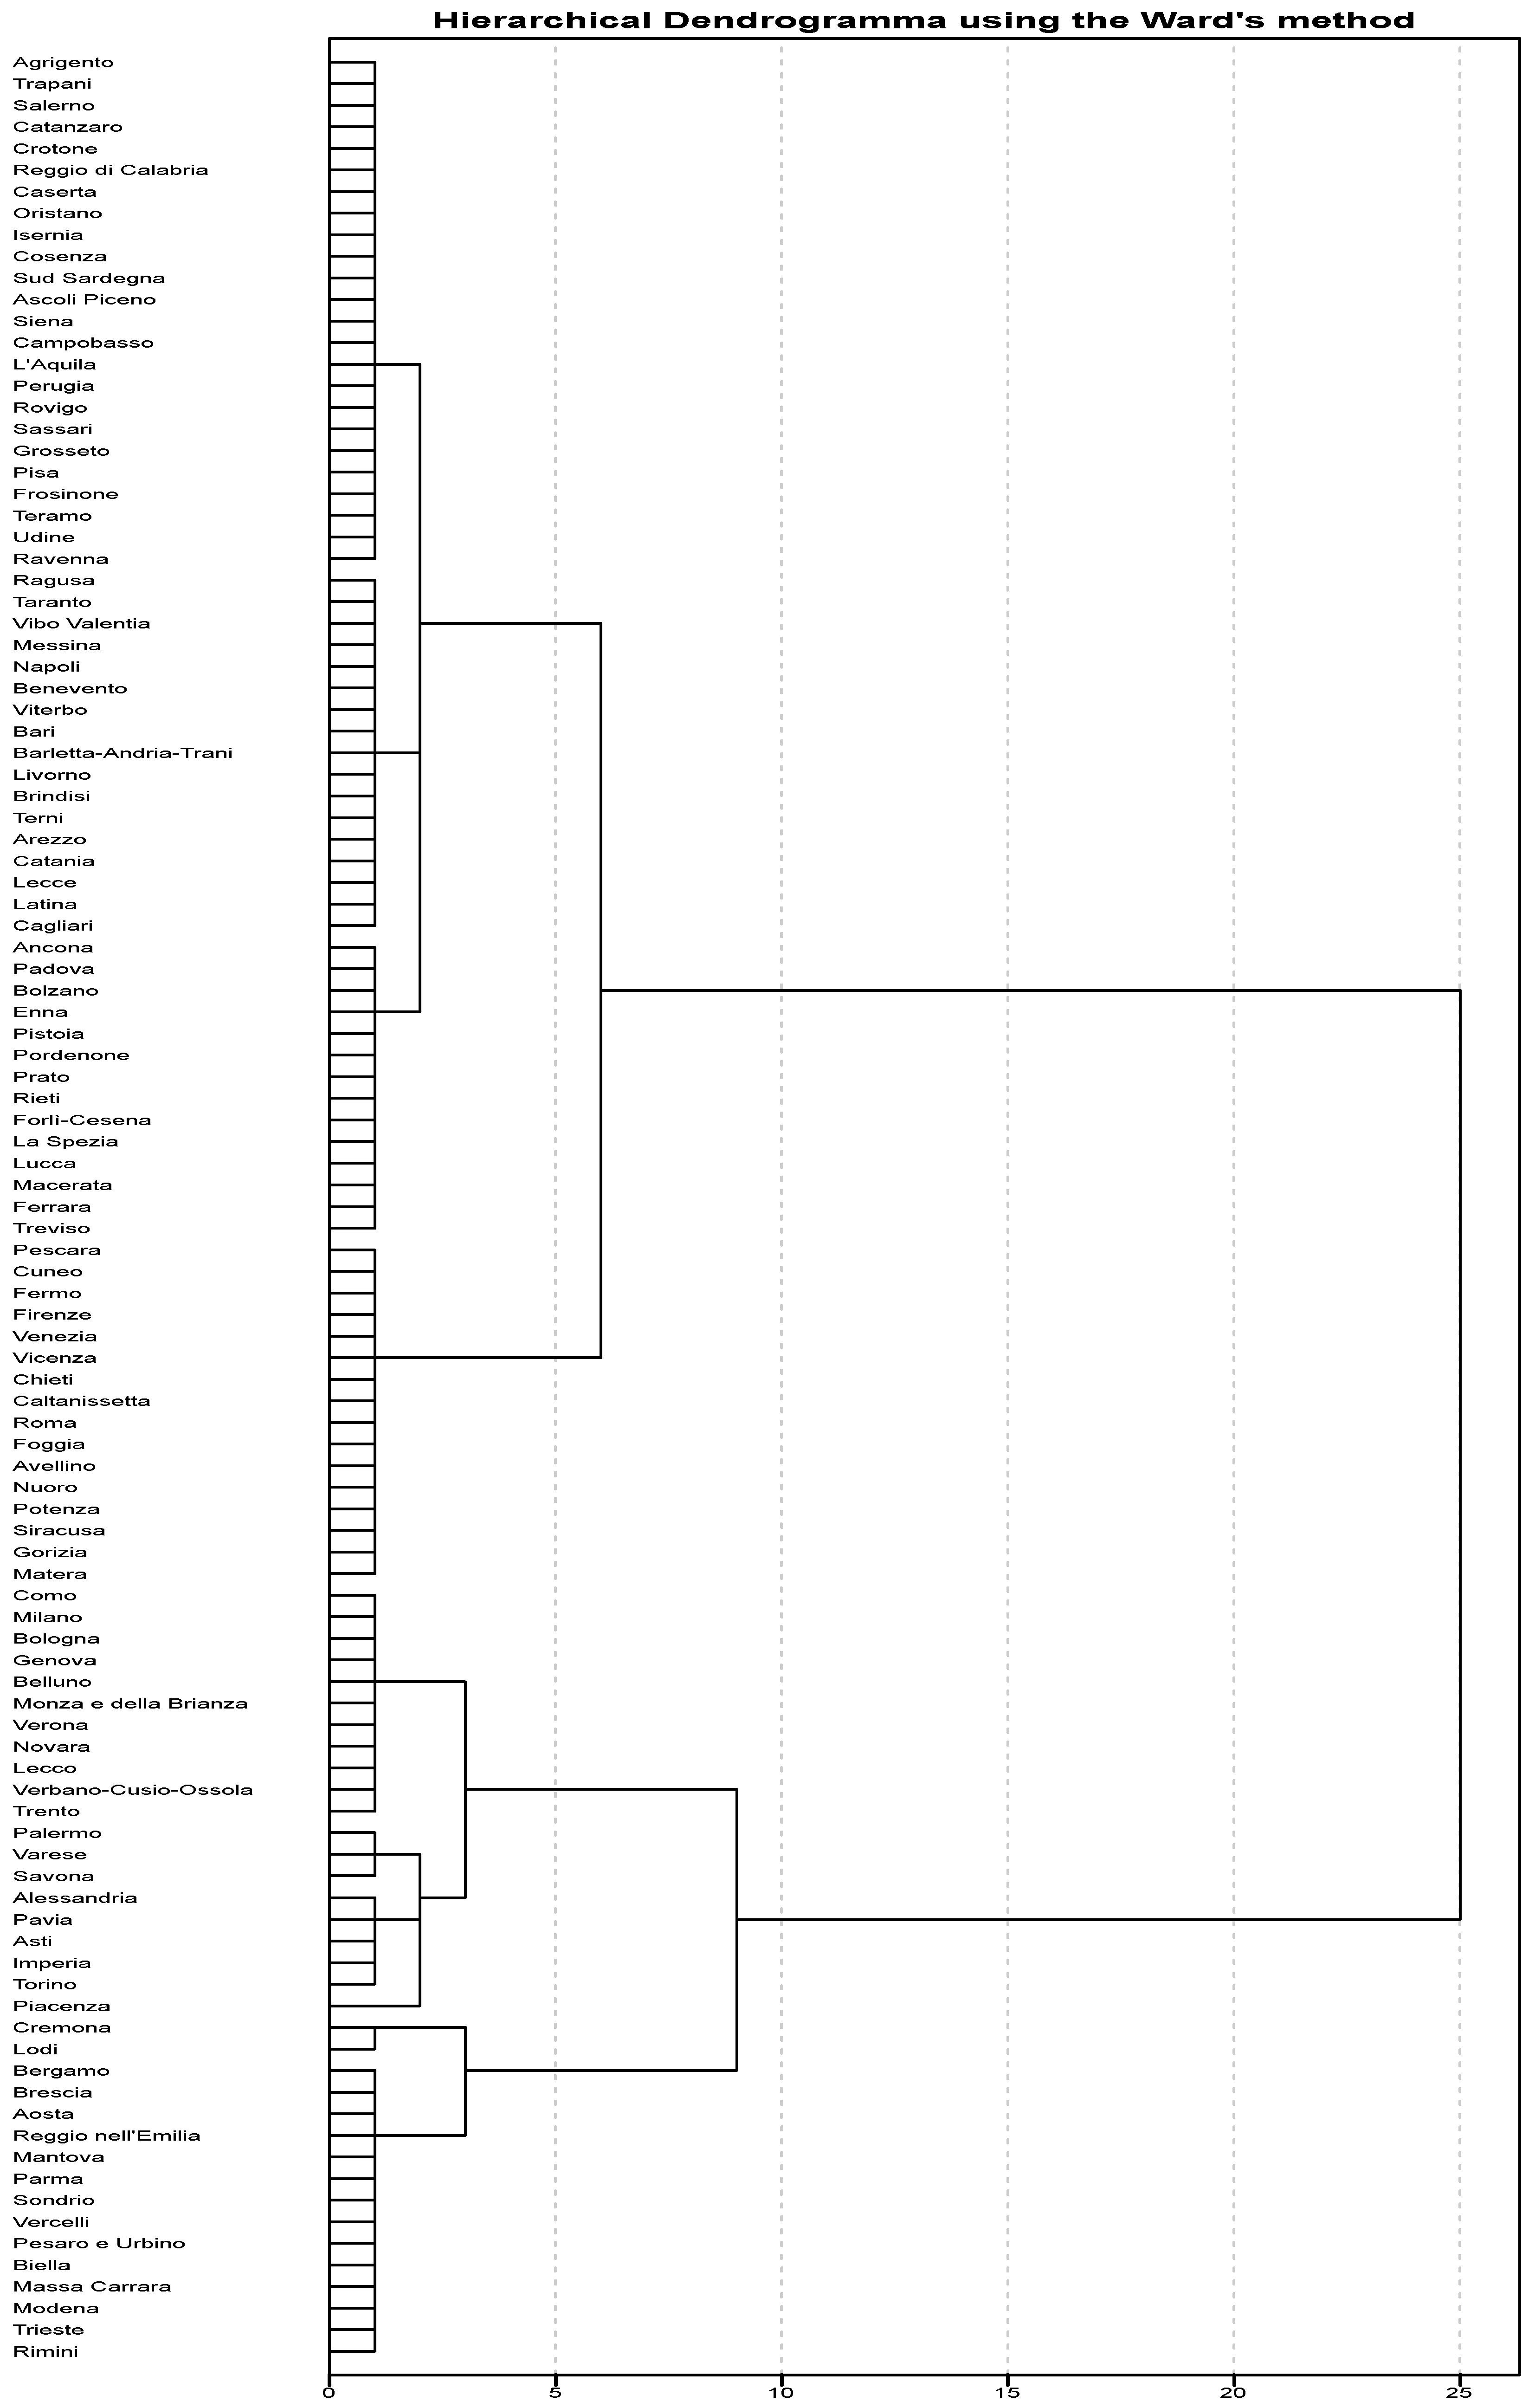
| Regions | Residents | Prevalence of Positive Cases (Per 10,000 Residents) a | Trend of Positive Cases (%) b | Number of Tests (Per 10,000 Residents) a |
|---|---|---|---|---|
| Abruzzo | 1,315,196 | 14.2 | −8.00% | 309.5 |
| Apulia | 4,048,242 | 7.3 | 1.50% | 164.1 |
| Basilicata | 567,118 | 3.4 | −10.60% | 250.6 |
| Bolzano c | 527,750 | 12.6 | −29.30% | 838.3 |
| Calabria | 1,956,687 | 3.6 | −10.20% | 198.5 |
| Campania | 5,826,860 | 4.7 | −5.30% | 148.5 |
| Emilia-Romagna | 4,452,629 | 20.3 | −26.00% | 442.6 |
| Friuli Venezia Giulia | 1,215,538 | 8.9 | −13.60% | 616.9 |
| Lazio | 5,896,693 | 7.4 | −3.90% | 255.9 |
| Liguria | 1,556,981 | 22.8 | −0.80% | 350 |
| Lombardy | 10,036,258 | 36.8 | 4.20% | 409.4 |
| Marche | 1,531,753 | 20.9 | −3.40% | 420.5 |
| Molise | 308,493 | 5.9 | −9.50% | 229.3 |
| Piedmont | 4,375,865 | 35.7 | 0.80% | 393.5 |
| Sardinia | 1,648,176 | 4.2 | −11.20% | 168.3 |
| Sicily | 5,026,989 | 4.4 | 3.80% | 170.9 |
| Trento c | 539,898 | 23.1 | −27.00% | 761.2 |
| Tuscany | 3,736,968 | 14.3 | −11.00% | 403.8 |
| Umbria | 884,640 | 2.1 | −36.20% | 438.9 |
| Valle d’Aosta | 126,202 | 8.6 | −53.60% | 641.8 |
| Veneto | 4,905,037 | 14.9 | −17.60% | 771.0 |
| Number of Clusters | Average Silhouette Width (Standard Deviation) |
|---|---|
| 2 | 0.566 (0.166) |
| 3 | 0.632 (0.099) |
| 4 | 0.493 (0.197) |
| 5 | 0.530 (0.248) |
| Clusters | Prevalence of Positive Cases Per 10,000 Residents a | Trend of Positive Cases b | Number of Tests Per 10,000 Residents a |
|---|---|---|---|
| Cluster 1 | 29.3 (15.2) | 0% (6.1) | 401.5 (56.9) |
| Cluster 2 | 7.4 (9.9) | −10.6% (12.3) | 255.9 (446.0) |
| Cluster 3 | 5.4 (6.5) | −44.9% (17.4) | 540.4 (202.9) |
| p-Value | 0.011 | 0.007 | 0.356 |
| Number of Clusters | Average Silhouette Width (Standard Deviation) |
|---|---|
| 2 | 0.399 (0.169) |
| 3 | 0.402 (0.229) |
| 4 | 0.368 (0.214) |
| 5 | 0.377 (0.225) |
| Clusters | Provinces |
|---|---|
| Cluster 1 | Alessandria; Aosta; Asti; Belluno; Bergamo; Biella; Bologna; Brescia; Como; Cremona; Cuneo; Fermo; Firenze; Forlì-Cesena; Genova; Imperia; La Spezia; Lecco; Lodi; Mantova; Massa Carrara; Milano; Modena; Monza e della Brianza; Novara; Parma; Pavia; Pesaro e Urbino; Pescara; Piacenza; Reggio nell’Emilia; Rimini; Savona; Sondrio; Torino; Trento; Trieste; Varese; Venezia; Verbano-Cusio-Ossola; Vercelli; Verona; Vicenza |
| Cluster 2 | Arezzo; Avellino; Bari; Barletta-Andria-Trani; Benevento; Brindisi; Cagliari; Caltanissetta; Catania; Chieti; Enna; Ferrara; Foggia; Gorizia; Latina; Lecce; Livorno; Lucca; Macerata; Matera; Messina; Napoli; Nuoro; Palermo; Pistoia; Pordenone; Potenza; Prato; Ragusa; Rieti; Roma; Siracusa; Taranto; Terni; Treviso; Vibo Valentia; Viterbo |
| Cluster 3 | Agrigento; Ancona; Ascoli Piceno; Bolzano; Campobasso; Caserta; Catanzaro; Cosenza; Crotone; Frosinone; Grosseto; Isernia; L’Aquila; Oristano; Padova; Perugia; Pisa; Ravenna; Reggio di Calabria; Rovigo; Salerno; Sassari; Siena; Sud Sardegna; Teramo; Trapani; Udine |
| Clusters | Prevalence of Total Cases Per 10,000 Residents | Trend of Total Cases (%) |
|---|---|---|
| Hierarchical Clustering | ||
| Cluster 1 | 61.0 (31.0) | 5.7% (4.4) |
| Cluster 2 | 11.2 (14.0) | 3.9% (2.4) |
| Cluster 3 | 11.6 (12.7) | 1.5% (0.9) |
| p-Value | <0.001 | <0.001 |
| K-means Clustering | ||
| Cluster 1 | 53.0 (38.1) | 3.2% (1.1) |
| Cluster 2 | 42.7 (44.0) | 6.7% (3.3) |
| Cluster 3 | 7.4 (8.5) | 2.2% (2.0) |
| p-Value | <0.001 | <0.001 |
| Clusters | Provinces |
|---|---|
| Cluster 1 | Ancona; Aosta; Bergamo; Biella; Bolzano; Brescia; Cremona; Enna; Ferrara; Forlì-Cesena; La Spezia; Lecco; Lodi; Lucca; Macerata; Mantova; Massa Carrara; Modena; Padova; Parma; Pesaro e Urbino; Pordenone; Prato; Ravenna; Reggio nell’Emilia; Rieti; Rimini; Sondrio; Treviso; Trieste; Vercelli |
| Cluster 2 | Alessandria; Arezzo; Asti; Avellino; Belluno; Bologna; Brindisi; Caltanissetta; Chieti; Como; Cuneo; Fermo; Firenze; Foggia; Genova; Gorizia; Imperia; Matera; Milano; Monza e della Brianza; Novara; Palermo; Pavia; Pescara; Piacenza; Pistoia; Roma; Savona; Terni; Torino; Trento; Varese; Venezia; Verbano-Cusio-Ossola; Verona; Vicenza |
| Cluster 3 | Agrigento; Ascoli Piceno; Bari; Barletta-Andria-Trani; Benevento; Cagliari; Campobasso; Caserta; Catania; Catanzaro; Cosenza; Crotone; Frosinone; Grosseto; Isernia; L’Aquila; Latina; Lecce; Livorno; Messina; Napoli; Nuoro; Oristano; Perugia; Pisa; Potenza; Ragusa; Reggio di Calabria; Rovigo; Salerno; Sassari; Siena; Siracusa; Sud Sardegna; Taranto; Teramo; Trapani; Udine; Vibo Valentia; Viterbo |
© 2020 by the authors. Licensee MDPI, Basel, Switzerland. This article is an open access article distributed under the terms and conditions of the Creative Commons Attribution (CC BY) license (http://creativecommons.org/licenses/by/4.0/).
Share and Cite
Maugeri, A.; Barchitta, M.; Agodi, A. A Clustering Approach to Classify Italian Regions and Provinces Based on Prevalence and Trend of SARS-CoV-2 Cases. Int. J. Environ. Res. Public Health 2020, 17, 5286. https://doi.org/10.3390/ijerph17155286
Maugeri A, Barchitta M, Agodi A. A Clustering Approach to Classify Italian Regions and Provinces Based on Prevalence and Trend of SARS-CoV-2 Cases. International Journal of Environmental Research and Public Health. 2020; 17(15):5286. https://doi.org/10.3390/ijerph17155286
Chicago/Turabian StyleMaugeri, Andrea, Martina Barchitta, and Antonella Agodi. 2020. "A Clustering Approach to Classify Italian Regions and Provinces Based on Prevalence and Trend of SARS-CoV-2 Cases" International Journal of Environmental Research and Public Health 17, no. 15: 5286. https://doi.org/10.3390/ijerph17155286
APA StyleMaugeri, A., Barchitta, M., & Agodi, A. (2020). A Clustering Approach to Classify Italian Regions and Provinces Based on Prevalence and Trend of SARS-CoV-2 Cases. International Journal of Environmental Research and Public Health, 17(15), 5286. https://doi.org/10.3390/ijerph17155286


