Influence of Absolute Humidity, Temperature and Population Density on COVID-19 Spread and Decay Durations: Multi-Prefecture Study in Japan
Abstract
1. Introduction
2. Materials and Methods
2.1. Data Source
2.2. Data Processing
2.3. Statistics
3. Results
4. Discussion
5. Conclusions
Author Contributions
Funding
Conflicts of Interest
Appendix A
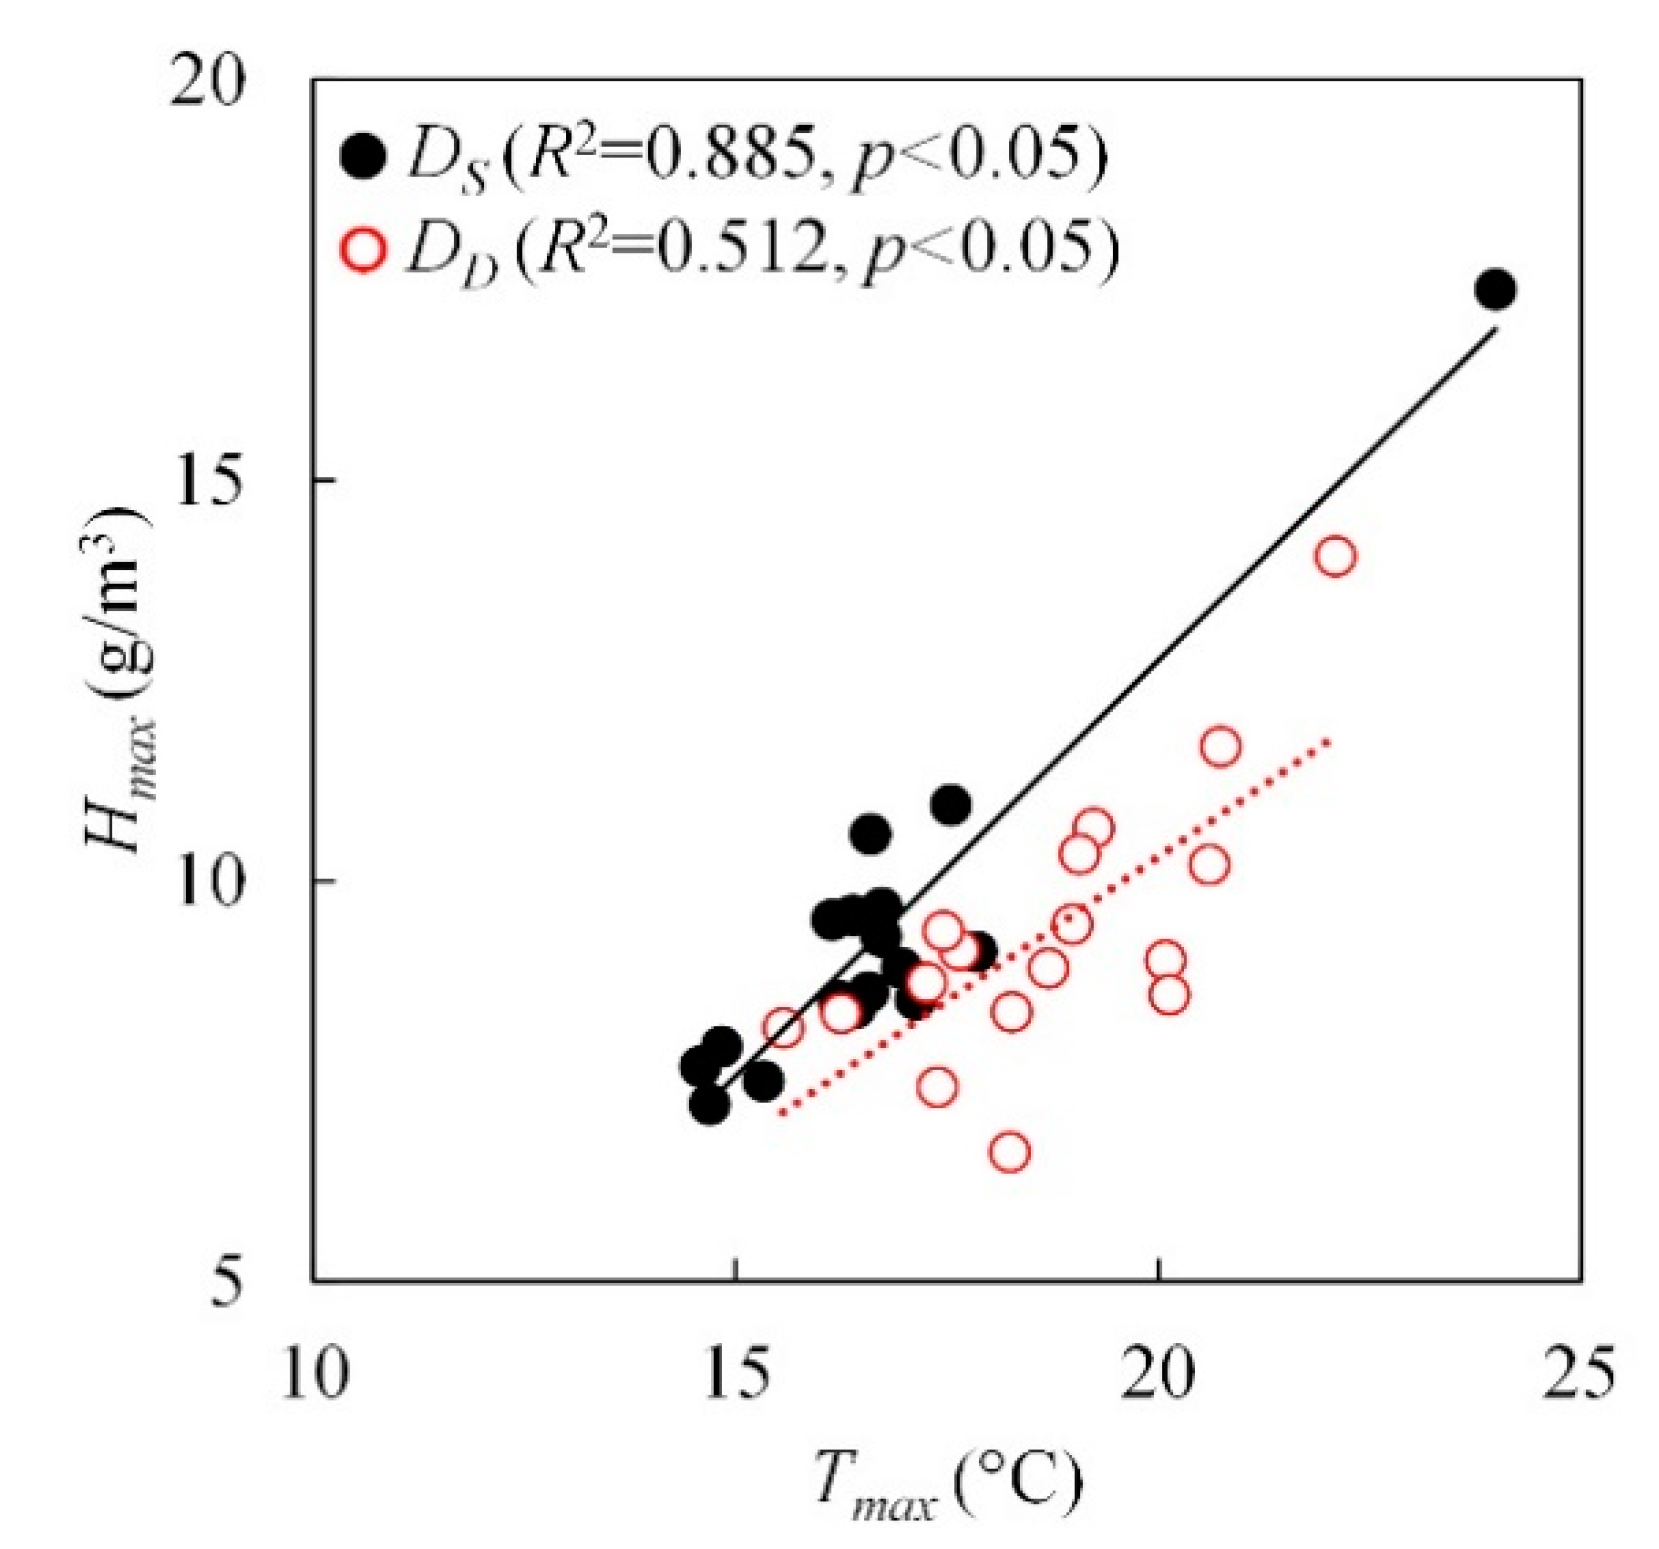
References
- Wu, Z.; McGoogan, J.M. Characteristics of and important lessons from the coronavirus disease 2019(COVID-19) outbreak in China: Summary of a report of 72314cases from the Chinese Center for Disease Control and Prevention. Jama 2020, 323, 1239–1242. [Google Scholar] [CrossRef] [PubMed]
- World Health Organization. Coronavirus Disease 2019(COVID-19): Situation Report 72; World Health Organization: Geneva, Switzerland, 2020. [Google Scholar]
- Adhikari, S.P.; Meng, S.; Wu, Y.-J.; Mao, Y.-P.; Ye, R.-X.; Wang, Q.-Z.; Sun, C.; Sylvia, S.; Rozelle, S.; Raat, H. Epidemiology, causes, clinical manifestation and diagnosis, prevention and control of coronavirus disease (COVID-19) during the early outbreak period: A scoping review. Infect. Dis. Poverty 2020, 9, 1–12. [Google Scholar] [CrossRef]
- Hethcote, H.W. The mathematics of infectious diseases. SIAM Rev. 2000, 42, 599–653. [Google Scholar] [CrossRef]
- Daley, D.J.; Gani, J. Epidemic Modelling: An introduction; Cambridge University Press: Cambridge, UK, 2001; Volume 15. [Google Scholar]
- Keeling, M.J.; Rohani, P. Modeling Infectious Diseases in Humans and Animals; Princeton University Press: Princeton, NJ, USA, 2011. [Google Scholar]
- Lin, Q.; Zhao, S.; Gao, D.; Lou, Y.; Yang, S.; Musa, S.S.; Wang, M.H.; Cai, Y.; Wang, W.; Yang, L. A conceptual model for the outbreak of Coronavirus disease 2019(COVID-19) in Wuhan, China with individual reaction and governmental action. Int. J. Infect. Dis. 2020, 93, 211–216. [Google Scholar] [CrossRef] [PubMed]
- Giordano, G.; Blanchini, F.; Bruno, R.; Colaneri, P.; Di Filippo, A.; Di Matteo, A.; Colaneri, M. Modelling the COVID-19epidemic and implementation of population-wide interventions in Italy. Nat. Med. 2020, 26, 1–6. [Google Scholar] [CrossRef]
- Briz-Redón, Á.; Serrano-Aroca, Á. A spatio-temporal analysis for exploring the effect of temperature on COVID-19early evolution in Spain. Sci. Total Environ. 2020, 728, 138811. [Google Scholar] [CrossRef]
- Reis, R.F.; de Melo Quintela, B.; de Oliveira Campos, J.; Gomes, J.M.; Rocha, B.M.; Lobosco, M.; dos Santos, R.W. Characterization of the COVID-19pandemic and the impact of uncertainties, mitigation strategies, and underreporting of cases in South Korea, Italy, and Brazil. Chaos Solitons Fractals 2020, 36, 109888. [Google Scholar] [CrossRef]
- Currie, C.S.; Fowler, J.W.; Kotiadis, K.; Monks, T.; Onggo, B.S.; Robertson, D.A.; Tako, A.A. How simulation modelling can help reduce the impact of COVID-19. J. Simul. 2020, 14, 83–97. [Google Scholar] [CrossRef]
- Pirouz, B.; Shaffiee Haghshenas, S.; Pirouz, B.; Shaffiee Haghshenas, S.; Piro, P. Development of an assessment method for investigating the impact of climate and urban parameters in confirmed cases of covid-19: A new challenge in sustainable development. Int. J. Environ. Res. Public Health 2020, 17, 2801. [Google Scholar] [CrossRef]
- Ai, T.; Yang, Z.; Hou, H.; Zhan, C.; Chen, C.; Lv, W.; Tao, Q.; Sun, Z.; Xia, L. Correlation of chest CT and RT-PCR testing in coronavirus disease 2019(COVID-19) in China: A report of 1014cases. Radiology 2020, 296, 200642. [Google Scholar] [CrossRef]
- Repici, A.; Maselli, R.; Colombo, M.; Gabbiadini, R.; Spadaccini, M.; Anderloni, A.; Carrara, S.; Fugazza, A.; Di Leo, M.; Galtieri, P.A. Coronavirus (COVID-19) outbreak: What the department of endoscopy should know. Gastrointest. Endosc. 2020, 92, 192–197. [Google Scholar] [CrossRef] [PubMed]
- Ma, Y.; Zhao, Y.; Liu, J.; He, X.; Wang, B.; Fu, S.; Yan, J.; Niu, J.; Zhou, J.; Luo, B. Effects of temperature variation and humidity on the death of COVID-19in Wuhan, China. Sci. Total Environ. 2020, 724, 138226. [Google Scholar] [CrossRef] [PubMed]
- Wang, J.; Tang, K.; Feng, K.; Lv, W. High temperature and high humidity reduce the transmission of COVID-19. SSRN 3551767 2020. (In Press) [CrossRef]
- Tosepu, R.; Gunawan, J.; Effendy, D.S.; Lestari, H.; Bahar, H.; Asfian, P. Correlation between weather and Covid-19pandemic in Jakarta, Indonesia. Sci. Total Environ. 2020, 725, 138436. [Google Scholar] [CrossRef] [PubMed]
- Ogen, Y. Assessing nitrogen dioxide (NO2) levels as a contributing factor to the coronavirus (COVID-19) fatality rate. Sci. Total Environ. 2020, 726, 138605. [Google Scholar] [CrossRef] [PubMed]
- Zhu, Y.; Xie, J. Association between ambient temperature and COVID-19infection in 122cities from China. Sci. Total Environ. 2020, 724, 138201. [Google Scholar]
- Liu, J.; Zhou, J.; Yao, J.; Zhang, X.; Li, L.; Xu, X.; He, X.; Wang, B.; Fu, S.; Niu, T. Impact of meteorological factors on the COVID-19transmission: A multi-city study in China. Sci. Total Environ. 2020, 726, 138513. [Google Scholar] [CrossRef]
- Tomar, A.; Gupta, N. Prediction for the spread of COVID-19in India and effectiveness of preventive measures. Sci. Total Environ. 2020, 728, 138762. [Google Scholar] [CrossRef]
- Auler, A.; Cássaro, F.; da Silva, V.; Pires, L. Evidence that high temperatures and intermediate relative humidity might favor the spread of COVID-19in tropical climate: A case study for the most affected Brazilian cities. Sci. Total Environ. 2020, 729, 139090. [Google Scholar] [CrossRef]
- Oliveiros, B.; Caramelo, L.; Ferreira, N.C.; Caramelo, F. Role of temperature and humidity in the modulation of the doubling time of COVID-19cases. medRxiv 2020. Available online: https://www.medrxiv.org/content/10.1101/2020.03.05.20031872v1 (accessed on 24 July 2020).
- Hu, H.; Nigmatulina, K.; Eckhoff, P. The scaling of contact rates with population density for the infectious disease models. Math. Biosci. 2013, 244, 125–134. [Google Scholar] [CrossRef] [PubMed]
- Prata, D.N.; Rodrigues, W.; Bermejo, P.H. Temperature significantly changes COVID-19transmission in (sub) tropical cities of Brazil. Sci. Total Environ. 2020, 729, 138862. [Google Scholar] [CrossRef]
- Kodera, S.; Rashed, E.A.; Hirata, A. Correlation between COVID-19morbidity and mortality rates in japan and local population density, temperature, and absolute humidity. Int. J. Environ. Res. Public Health 2020. submitted. [Google Scholar]
- Wu, Y.; Jing, W.; Liu, J.; Ma, Q.; Yuan, J.; Wang, Y.; Du, M.; Liu, M. Effects of temperature and humidity on the daily new cases and new deaths of COVID-19in 166countries. Sci. Total Environ. 2020, 729, 139051. [Google Scholar] [CrossRef] [PubMed]
- Huang, Z.; Huang, J.; Gu, Q.; Du, P.; Liang, H.; Dong, Q. Optimal temperature zone for the dispersal of COVID-19. Sci. Total Environ. 2020, 736, 139487. [Google Scholar] [CrossRef] [PubMed]
- Toyo Keizai Online. Coronavirus Disease (COVID-19) Situation Report in Japan. Available online: https://toyokeizai.net/sp/visual/tko/covid19/en.html (accessed on 31 May 2020).
- Ministry of Health Labour and Welfare. About Coronavirus Disease 2019(COVID-19). Available online: https://www.mhlw.go.jp/stf/seisakunitsuite/bunya/newpage_00032.html (accessed on 26 May 2020).
- Aichi Prefecture. Aichi New Coronavirus Infectious Disease Top Page. Available online: https://www.pref.aichi.jp/site/covid19-aichi/ (accessed on 24 July 2020).
- Statistics Bureau of Japan. Population Estimates. Available online: https://www.stat.go.jp/english/ (accessed on 2 June 2020).
- Japan Meteorological Agency Weather/Earthquake. Available online: https://www.jma.go.jp/jma/indexe.html (accessed on 29 May 2020).
- Roser, M.; Ritchie, H.; Ortiz-Ospina, E.; Hasell, J. Coronavirus Pandemic (COVID-19). Available online: https://ourworldindata.org/coronavirus#coronavirus-country-profiles (accessed on 29 June 2020).
- Lauer, S.A.; Grantz, K.H.; Bi, Q.; Jones, F.K.; Zheng, Q.; Meredith, H.R.; Azman, A.S.; Reich, N.G.; Lessler, J. The incubation period of coronavirus disease 2019(COVID-19) from publicly reported confirmed cases: Estimation and application. Ann. Intern. Med. 2020, 172, 577–582. [Google Scholar] [CrossRef] [PubMed]
- Ceylan, Z. Estimation of COVID-19prevalence in Italy, Spain, and France. Sci. Total Environ. 2020, 729, 138817. [Google Scholar] [CrossRef]
- Nishiura, H.; Linton, N.M.; Akhmetzhanov, A.R. Serial interval of novel coronavirus (COVID-19) infections. Int. J. Infect. Dis. 2020, 93, 284–286. [Google Scholar] [CrossRef]
- Gusev, A.I.; Lyubutin, S.K.; Rukin, S.N.; Tsyranov, S.N. Superfast thyristor-based switches operating in impact-ionization wave mode. IEEE Transact. Plasma Sci. 2016, 44, 1888–1893. [Google Scholar] [CrossRef]
- Ishikawa Prefecture. 2019 Novel Coronavirus. Available online: https://www.pref.ishikawa.lg.jp/kansen/coronakennai.html (accessed on 29 May 2020).
- Park, J.E.; Son, W.S.; Ryu, Y.; Choi, S.B.; Kwon, O.; Ahn, I. Effects of temperature, humidity, and diurnal temperature range on influenza incidence in a temperate region. Influenza Other Respir. Viruses 2019, 14, 11–18. [Google Scholar] [CrossRef]
- Metz, J.A.; Finn, A. Influenza and humidity–Why a bit more damp may be good for you! J. Infect. 2015, 71, S54–S58. [Google Scholar] [CrossRef] [PubMed]
- Michelozzi, P.; Accetta, G.; De Sario, M.; D’Ippoliti, D.; Marino, C.; Baccini, M.; Biggeri, A.; Anderson, H.R.; Katsouyanni, K.; Ballester, F. High temperature and hospitalizations for cardiovascular and respiratory causes in 12European cities. Am. J. Respir. Crit. Care Med. 2009, 179, 383–389. [Google Scholar] [CrossRef] [PubMed]
- Lanzinger, S.; Hampel, R.; Breitner, S.; Rückerl, R.; Kraus, U.; Cyrys, J.; Geruschkat, U.; Peters, A.; Schneider, A. Short-term effects of air temperature on blood pressure and pulse pressure in potentially susceptible individuals. Int. J. Hyg. Environ. Health 2014, 217, 775–784. [Google Scholar] [CrossRef] [PubMed]
- The Prime Minister in Action. Press Conference regarding the Novel Coronavirus Disease (COVID-19). Available online: https://japan.kantei.go.jp/98_abe/actions/202004/_00022.html (accessed on 29 May 2020).
- Kamiya, T.; Onishi, R.; Kodera, S.; Hirata, A. Estimation of Time-Course Core Temperature and Water Loss in Realistic Adult and Child Models with Urban Micrometeorology Prediction. Int. J. Environ. Res. Public Health 2019, 16, 5097. [Google Scholar] [CrossRef]
- Kamiya, T.; Kodera, S.; Hasegawa, K.; Egawa, R.; Sasaki, H.; Hirata, A. Different thermoregulatory responses of people from tropical and temperate zones: A computational study. Build. Environ. 2019, 159, 106152. [Google Scholar] [CrossRef]
- Tyler, C.J.; Reeve, T.; Hodges, G.J.; Cheung, S.S. The effects of heat adaptation on physiology, perception and exercise performance in the heat: A meta-analysis. Sports Med. 2016, 46, 1699–1724. [Google Scholar] [CrossRef]
- Peci, A.; Winter, A.-L.; Li, Y.; Gnaneshan, S.; Liu, J.; Mubareka, S.; Gubbay, J.B. Effects of absolute humidity, relative humidity, temperature, and wind speed on influenza activity in Toronto, Ontario, Canada. Appl. Environ. Microbiol. 2019, 85, e02426-18. [Google Scholar] [CrossRef]
- Shimmei, K.; Nakamura, T.; Ng, C.F.S.; Hashizume, M.; Murakami, Y.; Maruyama, A.; Misaki, T.; Okabe, N.; Nishiwaki, Y. Association between seasonal influenza and absolute humidity: Time-series analysis with daily surveillance data in Japan. Sci. Rep. 2020, 10, 1–7. [Google Scholar] [CrossRef]
- Lu, J.; Gu, J.; Li, K.; Xu, C.; Su, W.; Lai, Z.; Zhou, D.; Yu, C.; Xu, B.; Yang, Z. COVID-19outbreak associated with air conditioning in restaurant, Guangzhou, China, 2020. Emerg. Infect. Dis. 2020, 26, 1628. [Google Scholar] [CrossRef]
- Kodera, S.; Nishimura, T.; Rashed, E.A.; Hasegawa, K.; Takeuchi, I.; Egawa, R.; Hirata, A. Estimation of heat-related morbidity from weather data: A computational study in three prefectures of Japan over 2013–2018. Environ. Int. 2019, 130, 104907. [Google Scholar] [CrossRef]
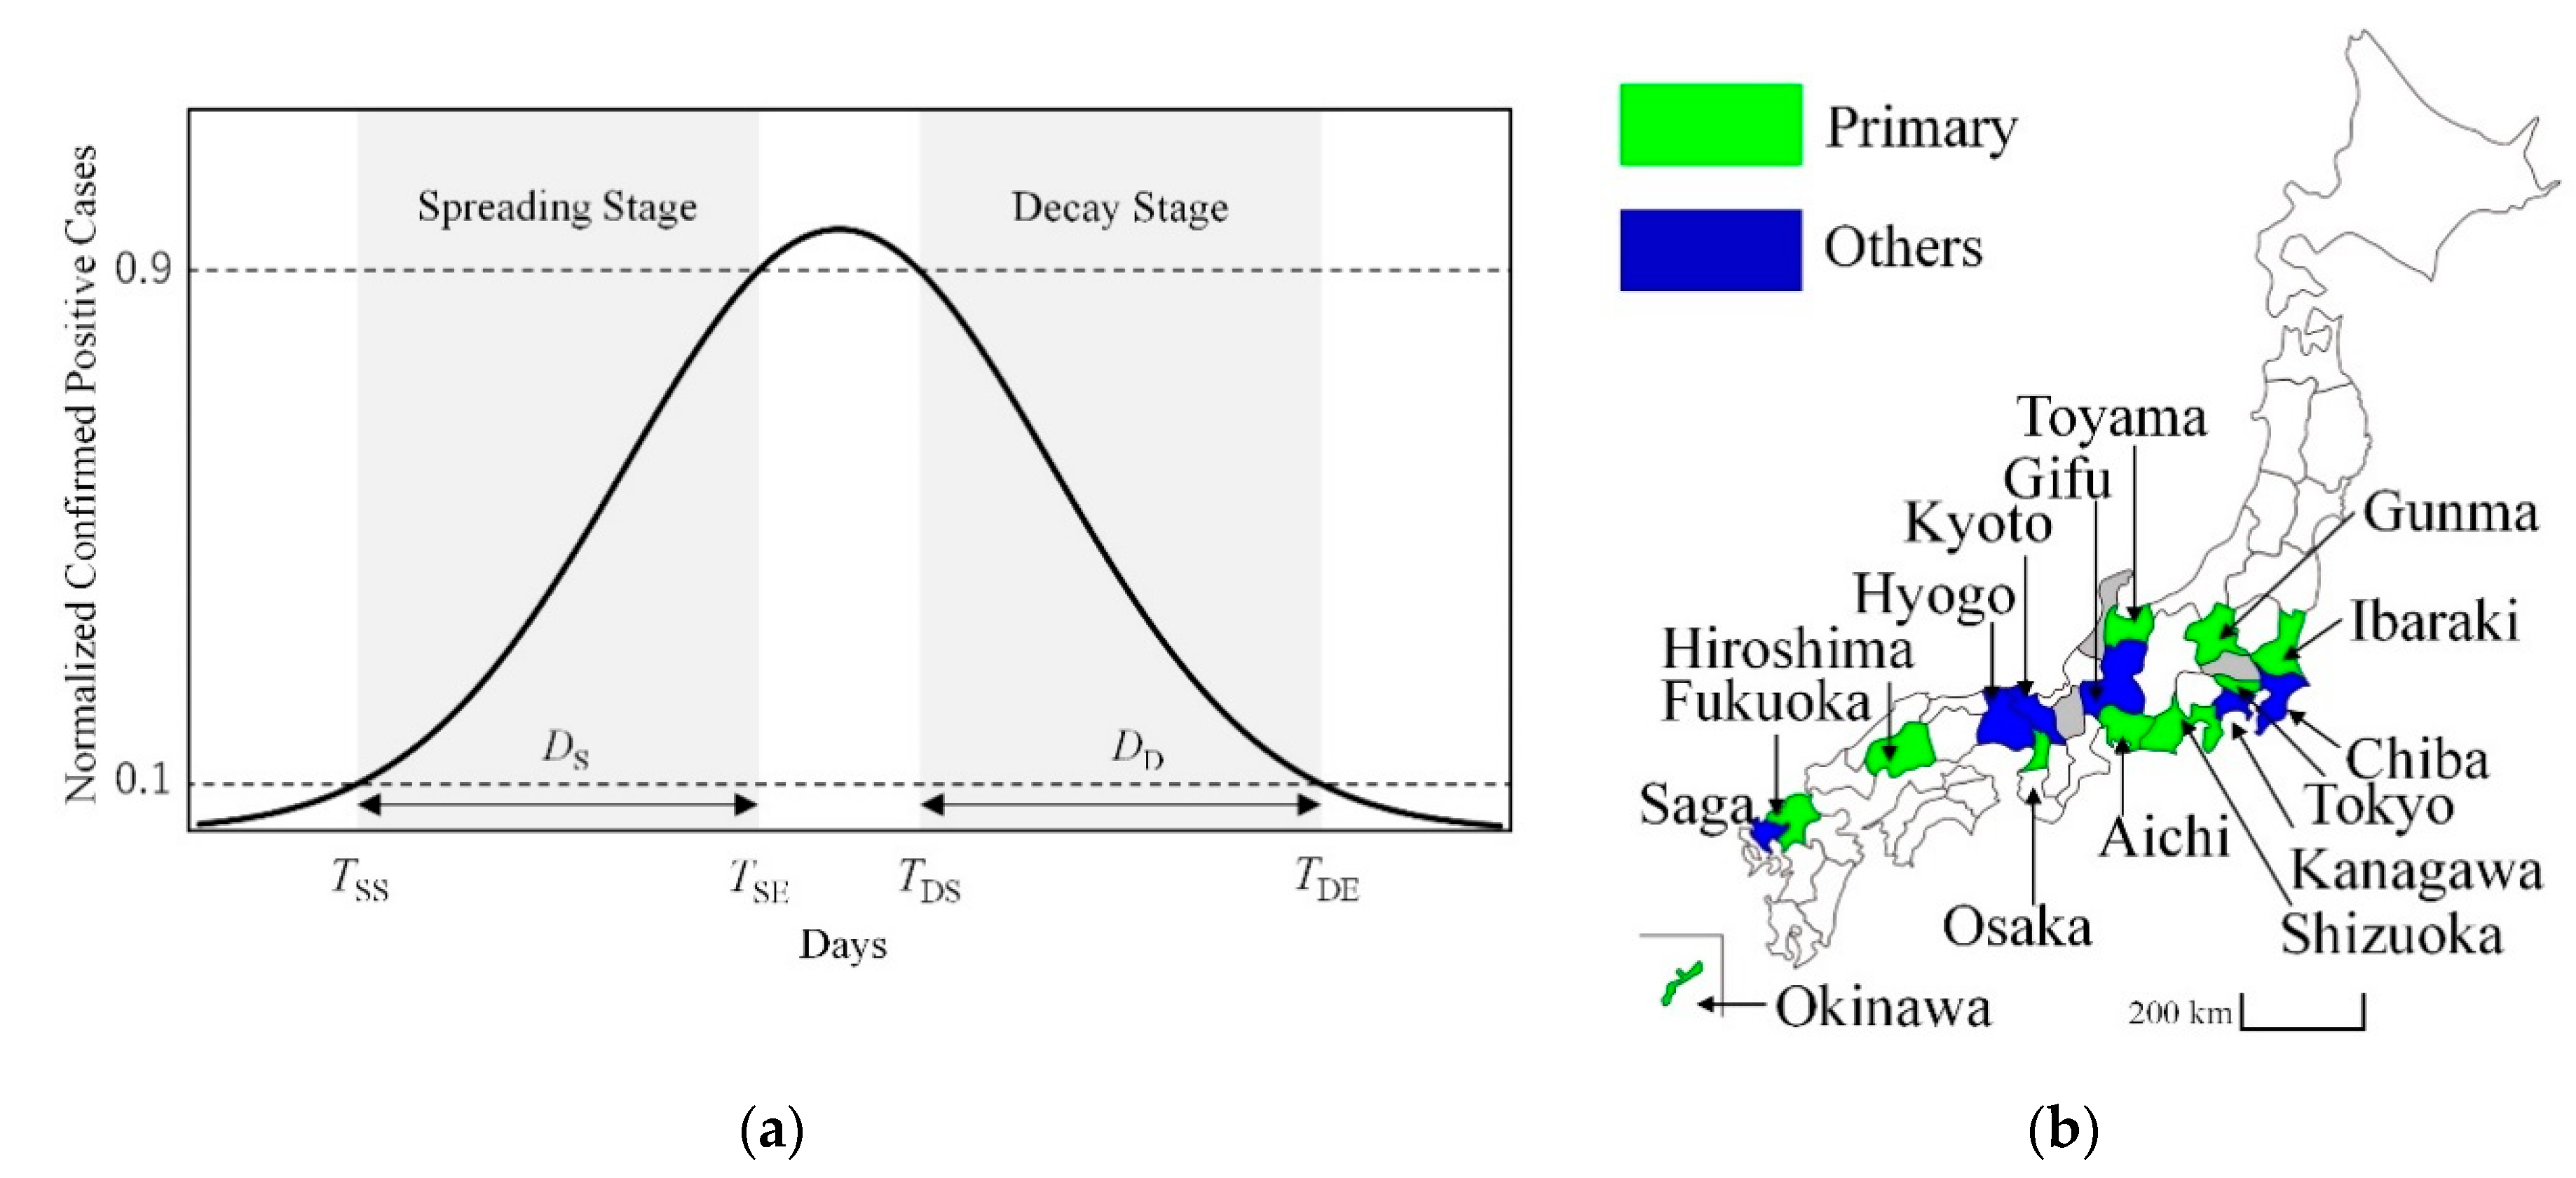
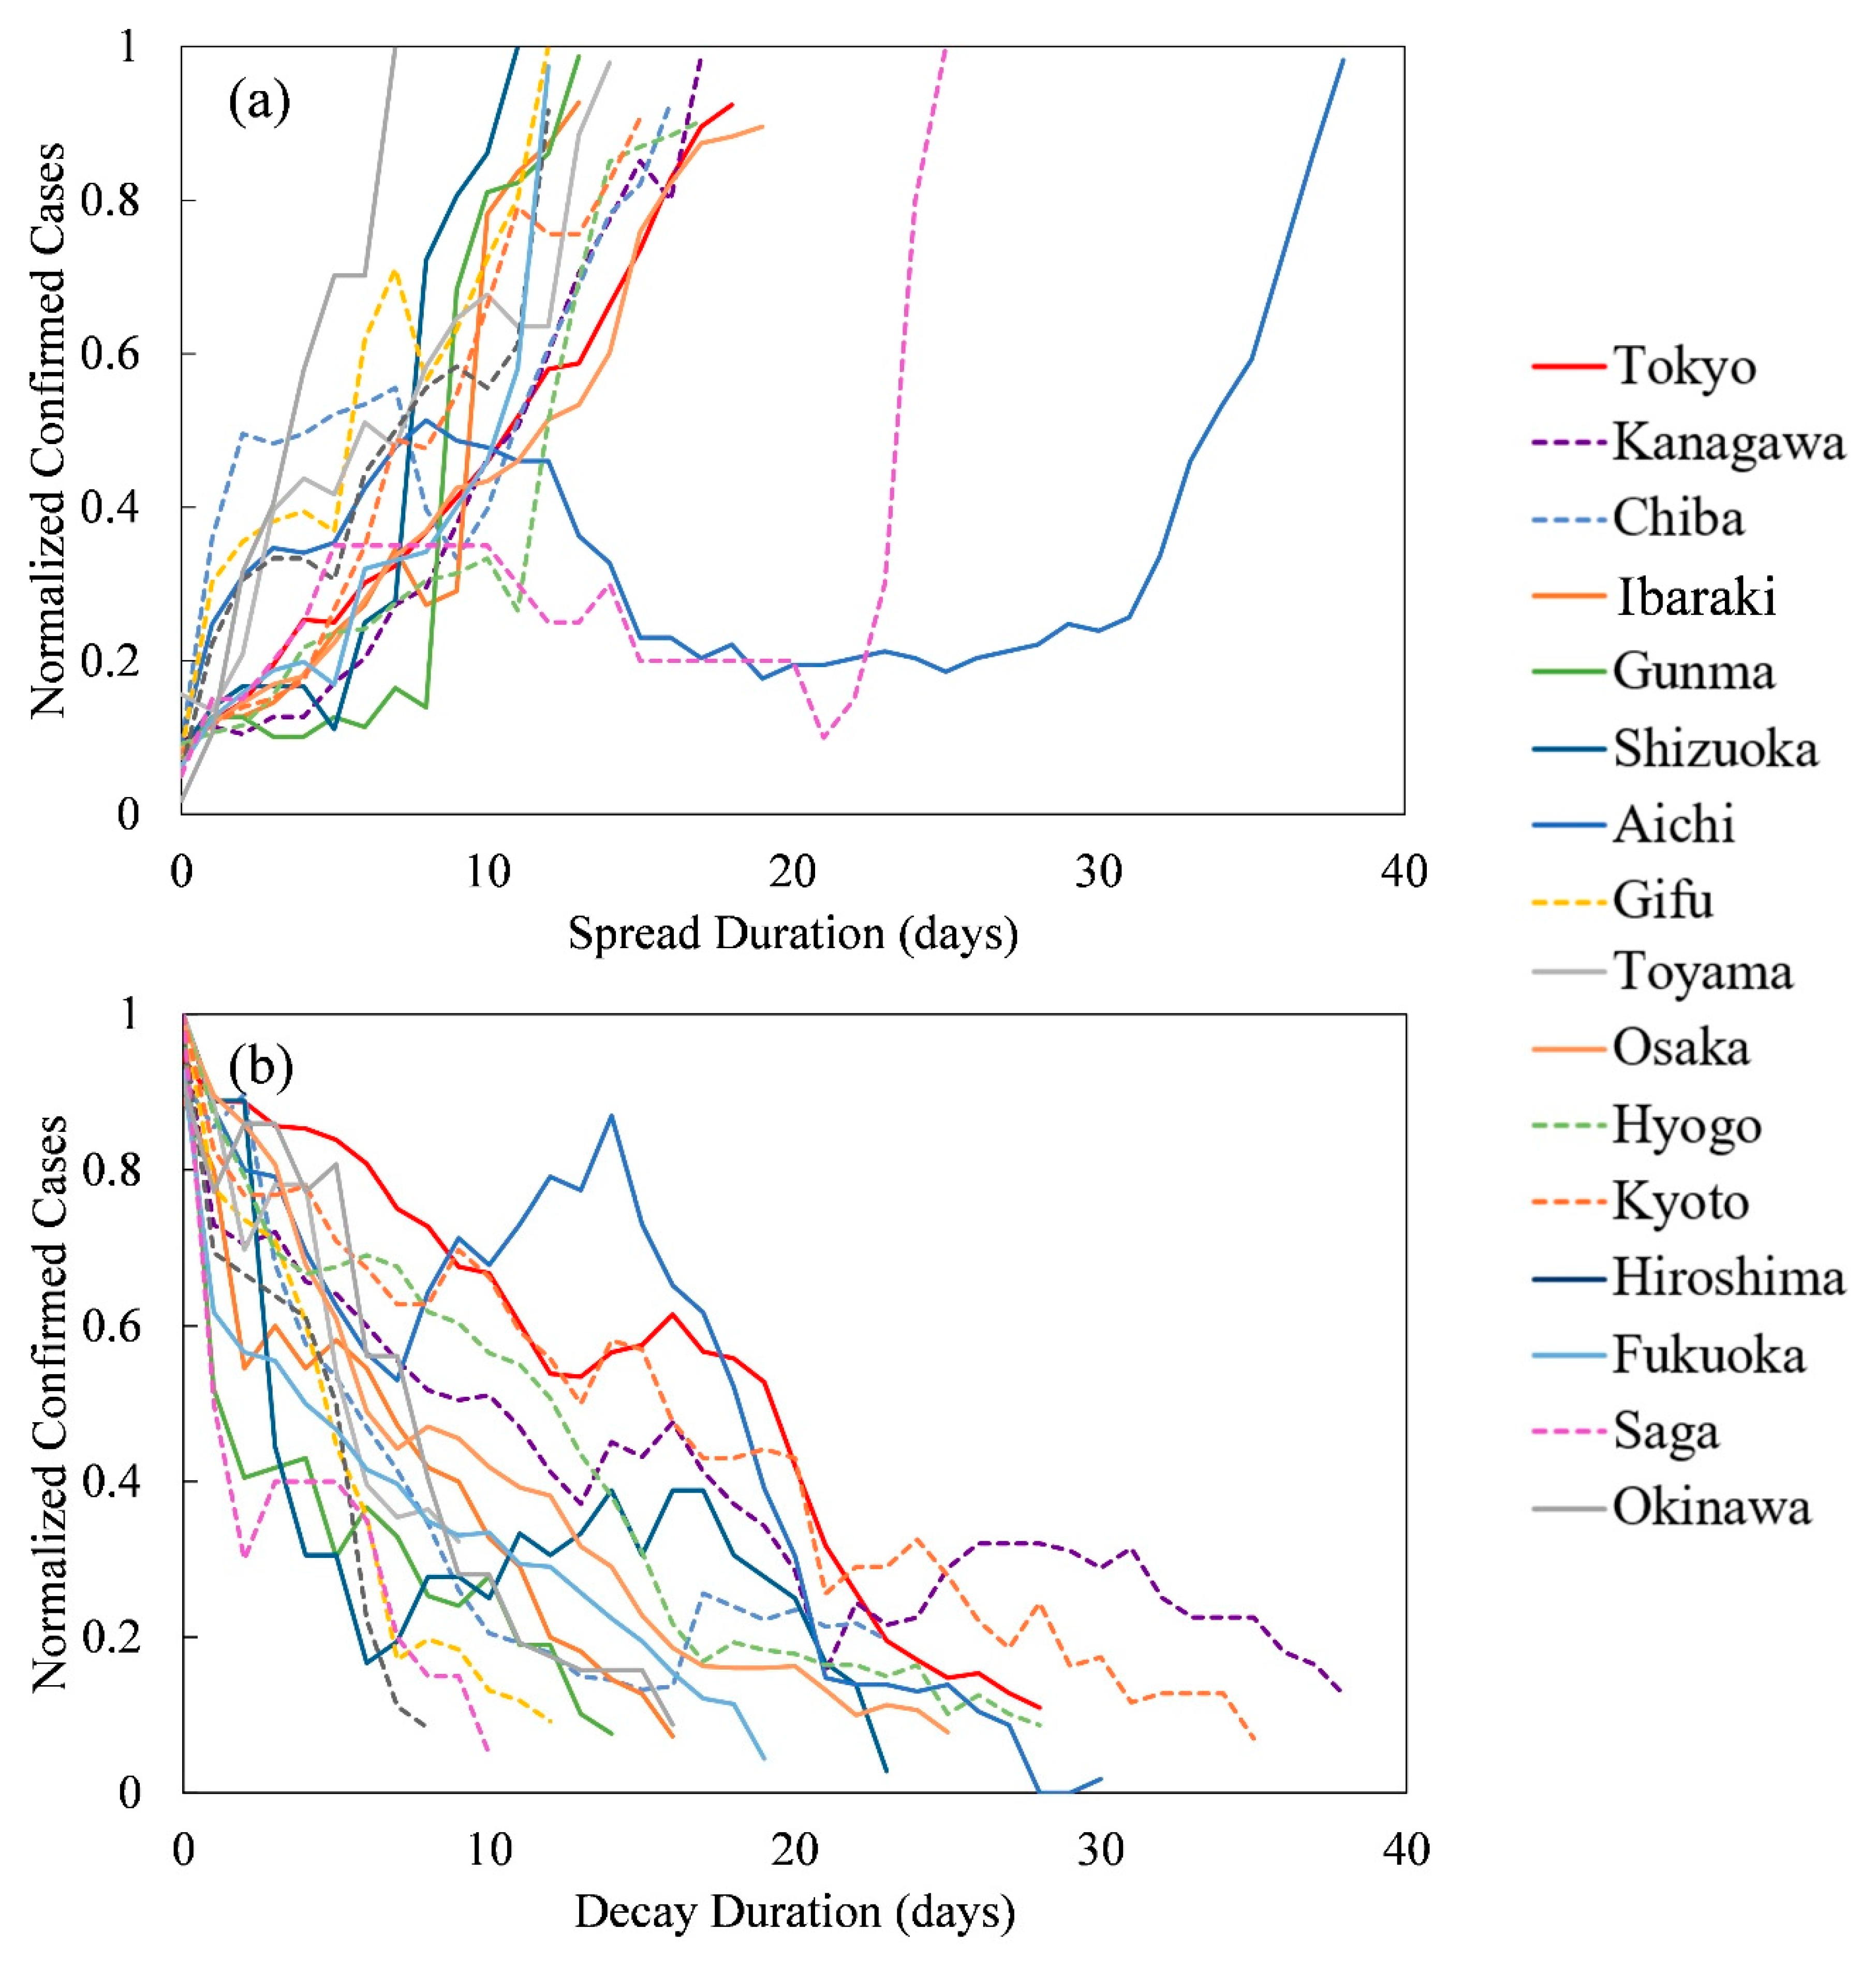
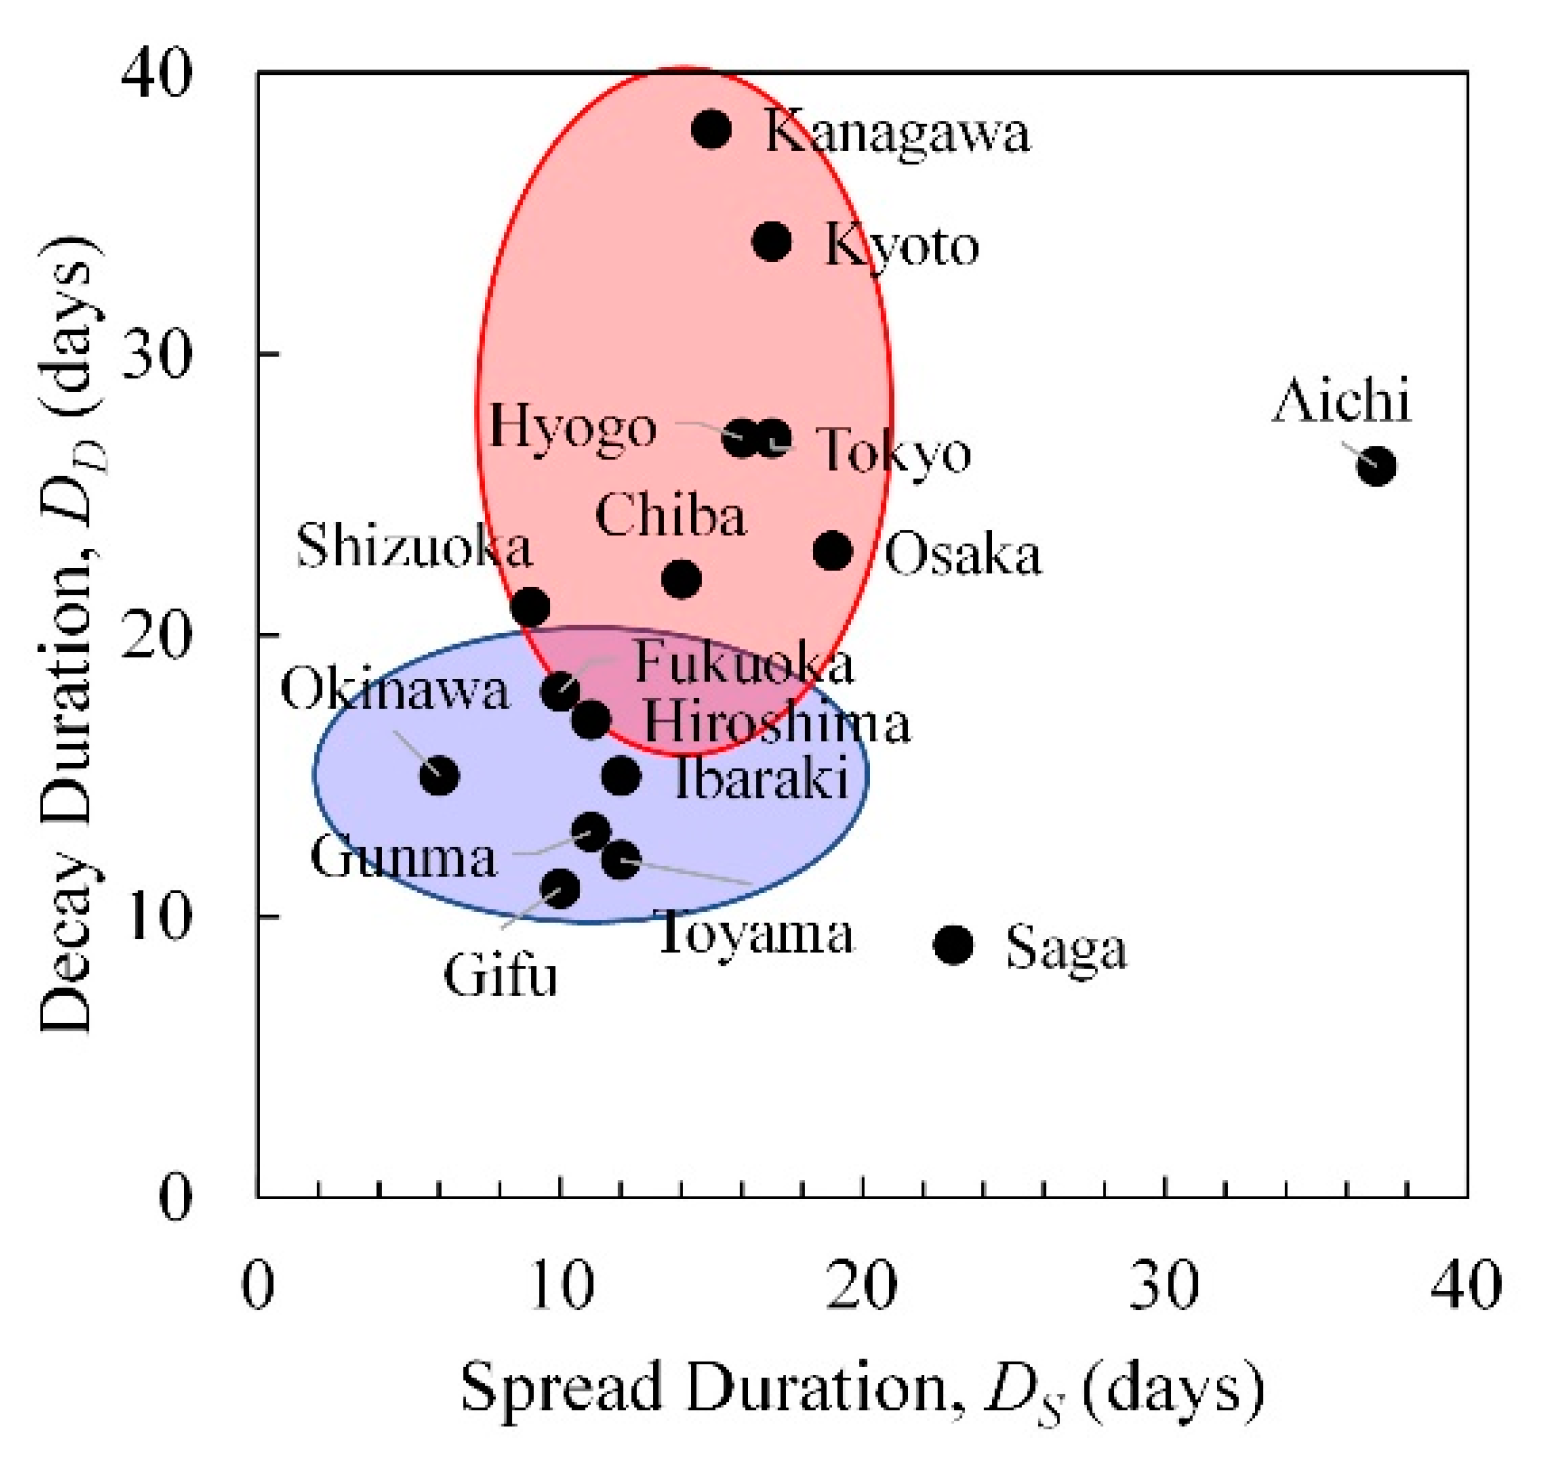
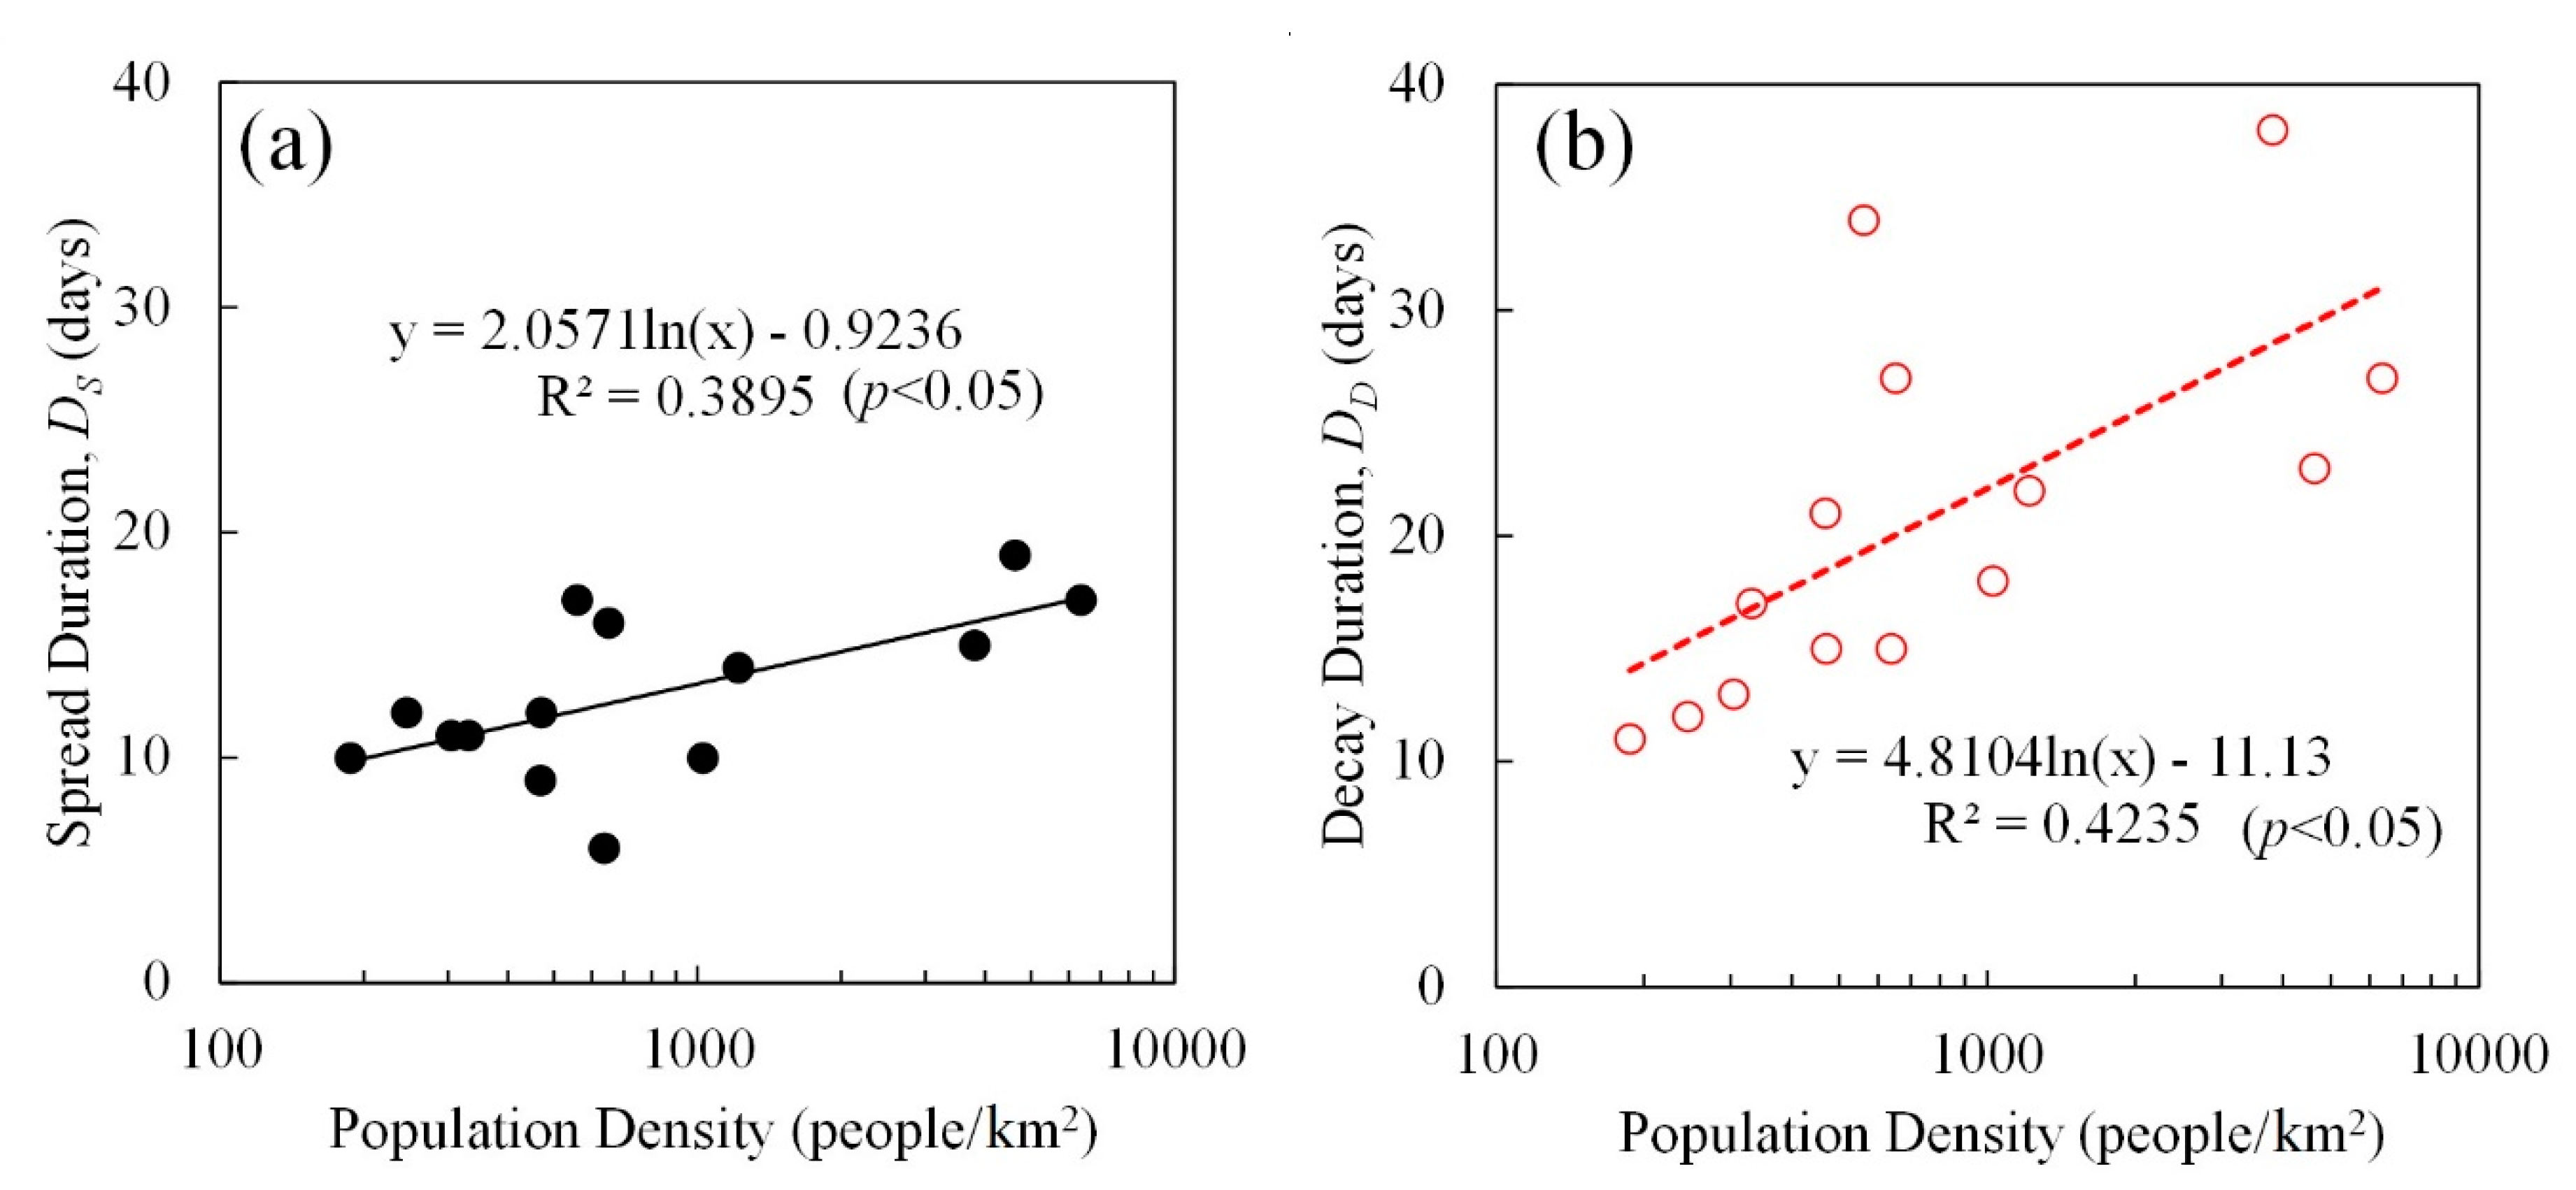
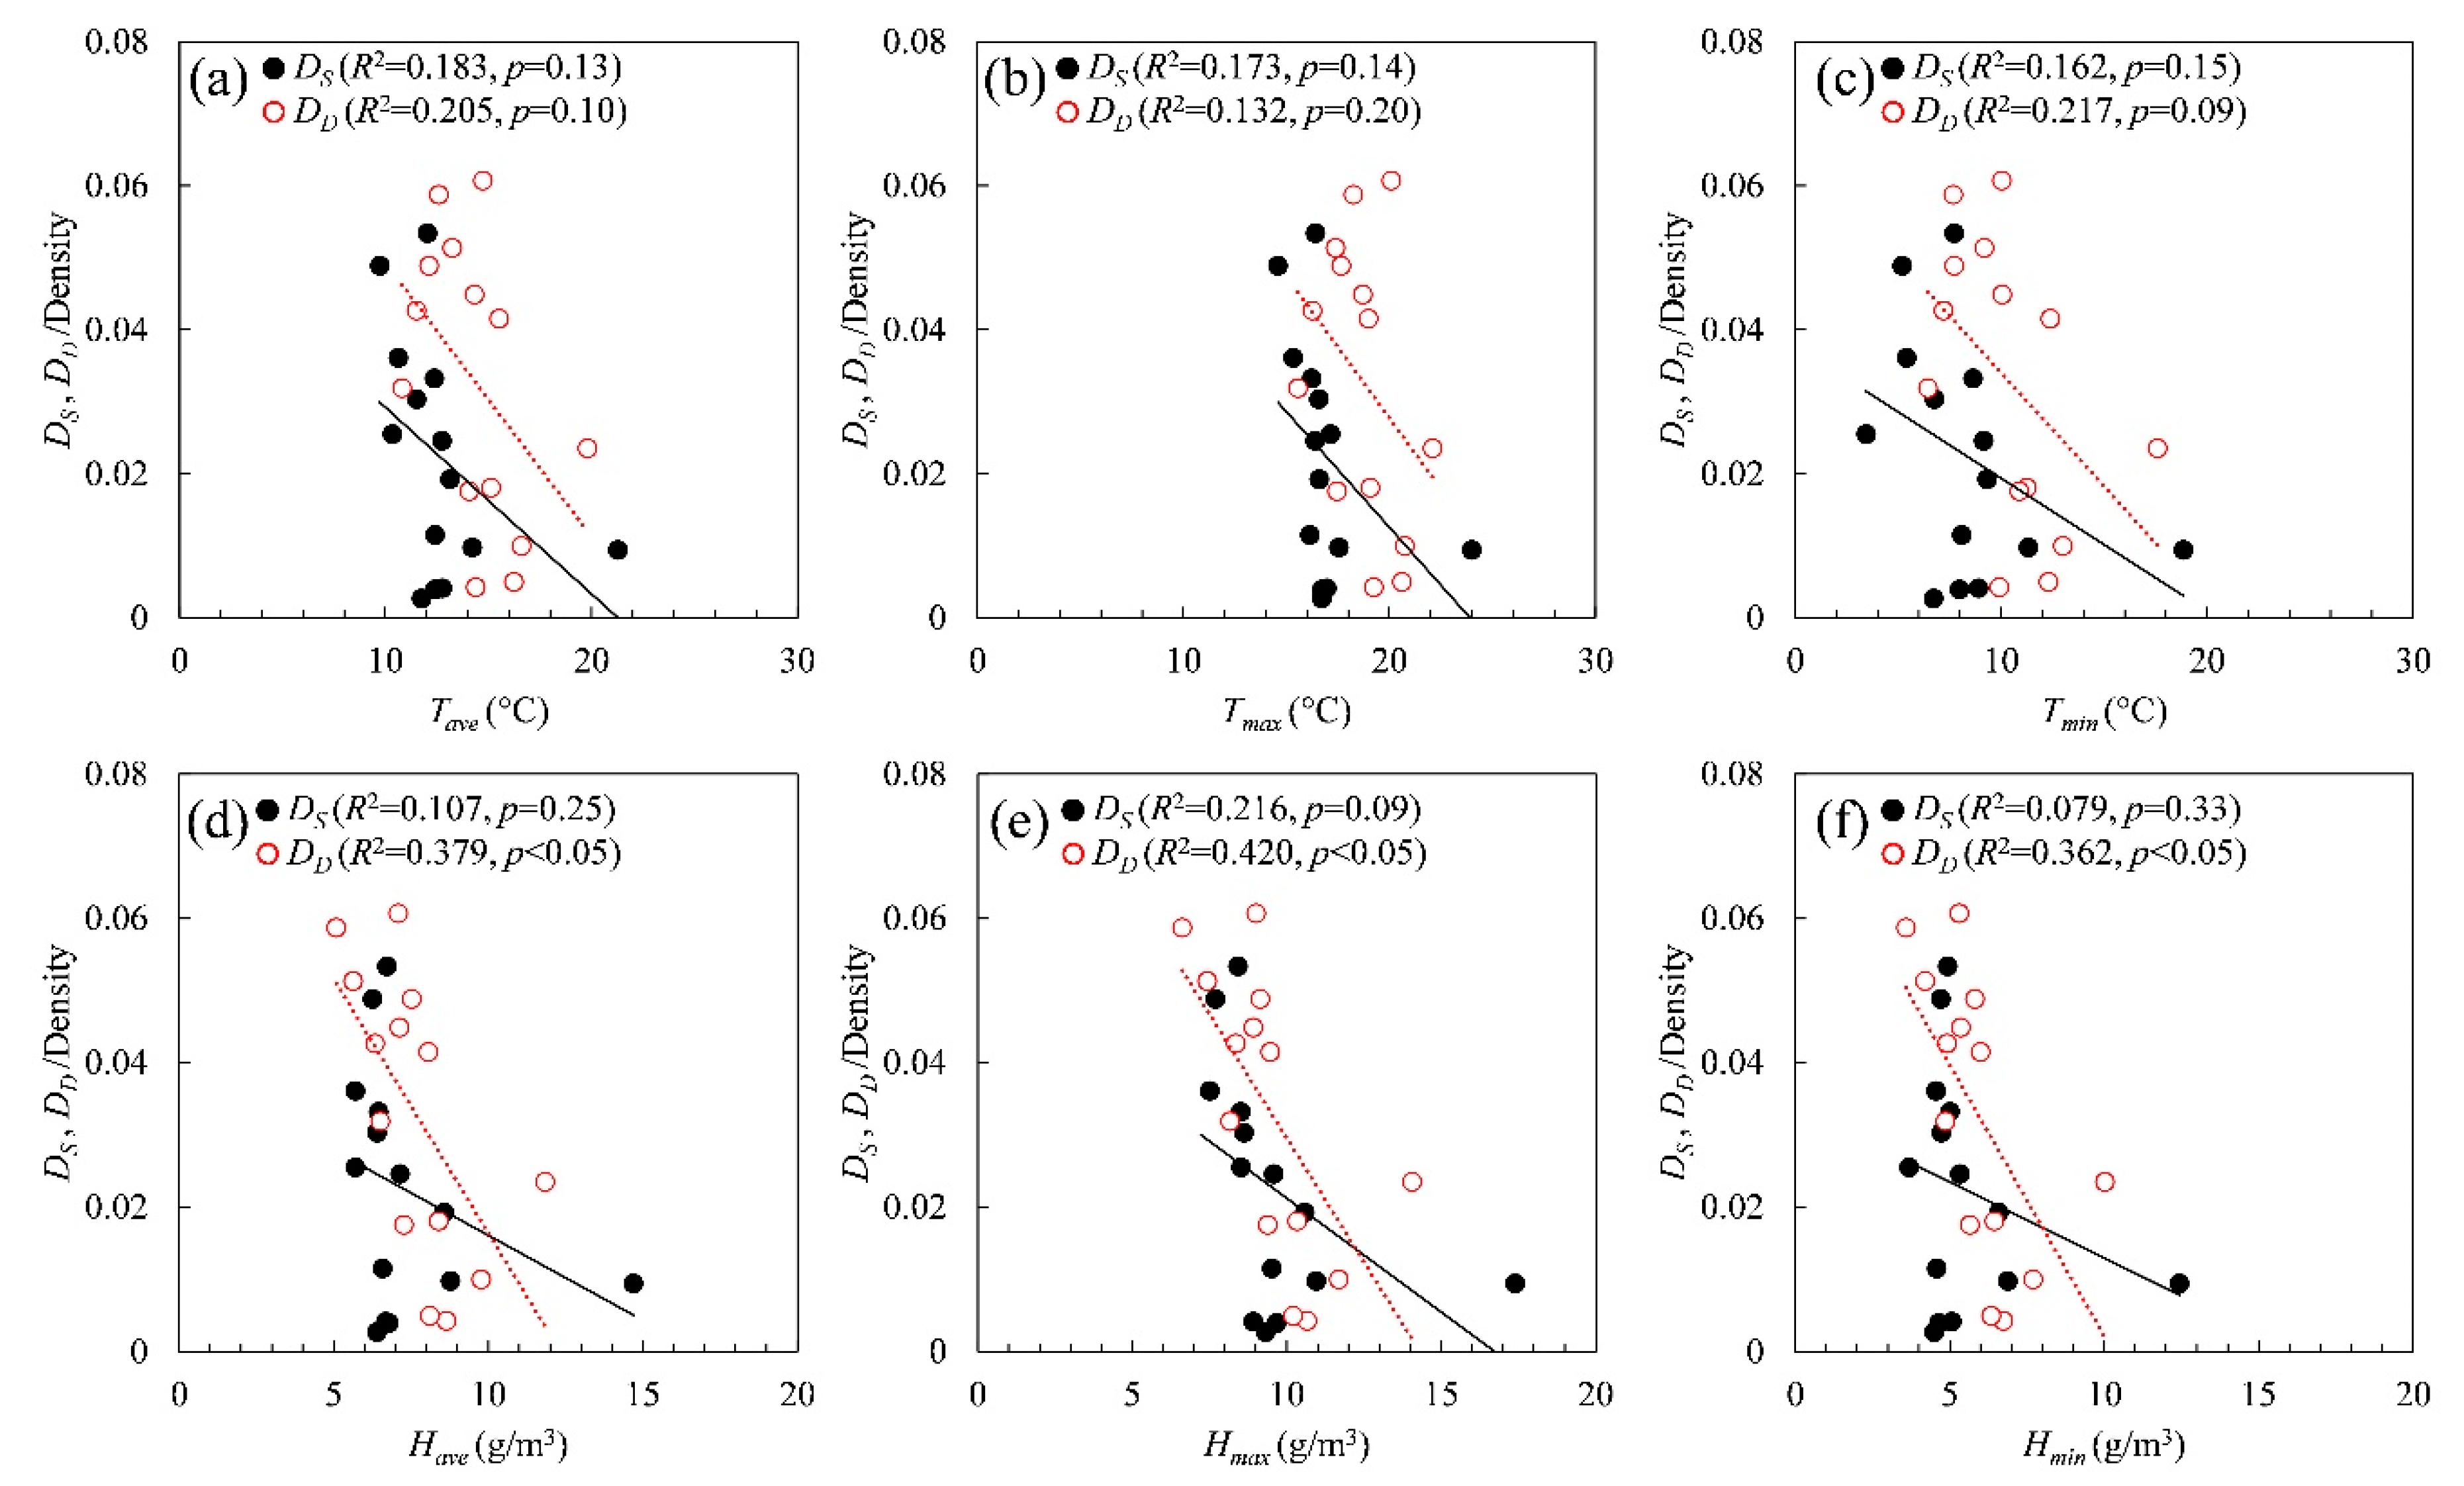
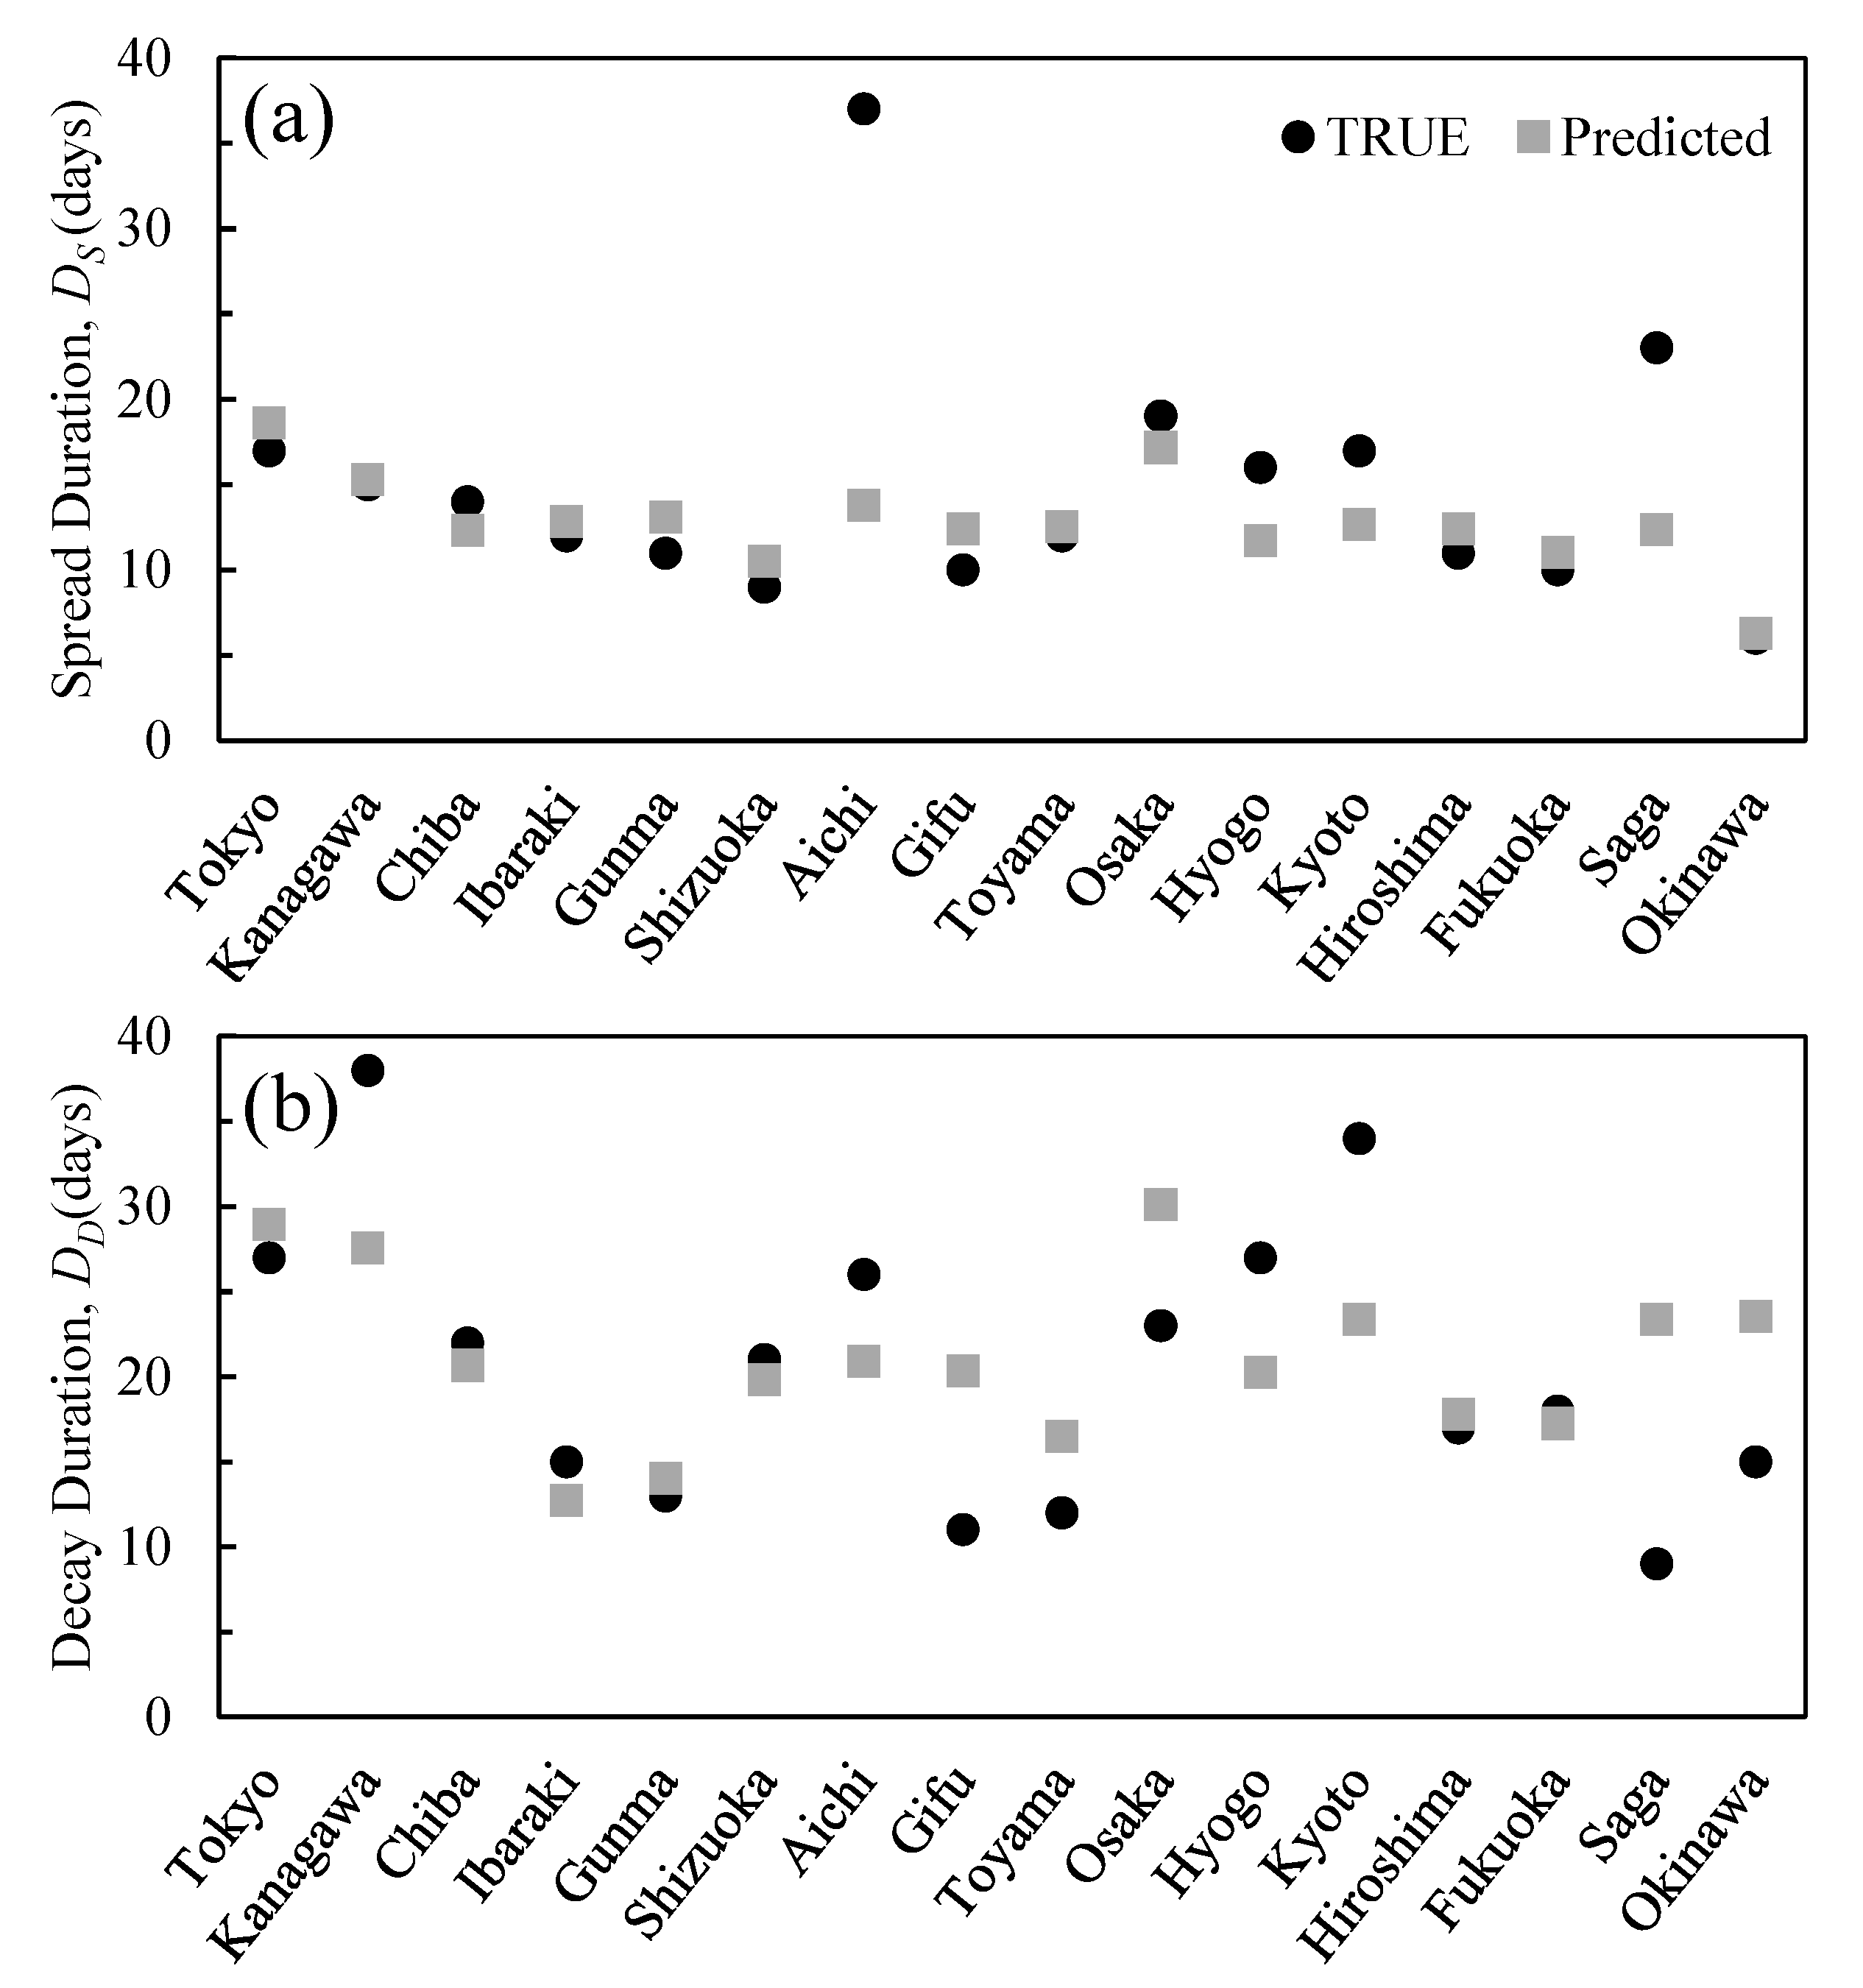
| Population (×1000) | Population Density (People Per km2) | Total Cases (Through 25 May) | Daily Max Cases | Percentage of Positive Test Results (%) | |
|---|---|---|---|---|---|
| Tokyo | 13,921 | 6354.8 | 5170 | 206 | 34.8 |
| Kanagawa * | 9198 | 3807.5 | 1336 | 94 | 14.7 |
| Saitama * | 7350 | 1932.0 | 1000 | 56 | 5.2 |
| Chiba * | 6259 | 1217.4 | 904 | 70 | 6.4 |
| Ibaragi | 2860 | 470.4 | 168 | 28 | 3.7 |
| Gunma | 1942 | 304.6 | 149 | 44 | 4.2 |
| Shizuoka | 3644 | 467.9 | 75 | 18 | 2.2 |
| Aichi | 7552 | 1460.0 | 507 | 21 | 5.2 |
| Gifu ** | 1987 | 187.3 | 150 | 18 | 4.4 |
| Ishikawa | 1138 | 271.7 | 296 | 20 | 11.2 |
| Toyama | 1044 | 245.6 | 227 | 21 | 7.3 |
| Osaka | 8809 | 4631.0 | 1781 | 108 | 6.1 |
| Hyogo *** | 5466 | 650.4 | 699 | 57 | 6.4 |
| Kyoto *** | 2583 | 560.1 | 358 | 20 | 4.6 |
| Shiga *** | 1414 | 352.0 | 100 | 12 | 5.7 |
| Hiroshima | 2804 | 331.1 | 167 | 51 | 2.5 |
| Fukuoka | 5104 | 1024.8 | 672 | 108 | 5.7 |
| Saga **** | 815 | 333.6 | 47 | 11 | 3.4 |
| Okinawa | 1453 | 637.5 | 81 | 17 | 2.9 |
| TSS | TSE | Daily Peak * | TDS | TDE | DS | DD | |
|---|---|---|---|---|---|---|---|
| Tokyo | 17-Mar | 3-Apr | 17-Apr | 10-Apr | 7-May | 17 | 27 |
| Kanagawa | 19-Mar | 3-Apr | 10-Apr | 11-Apr | 19-May | 15 | 38 |
| Chiba | 19-Mar | 2-Apr | 17-Apr | 13-Apr | 5-May | 14 | 22 |
| Ibaraki | 16-Mar | 28-Mar | 3-Apr | 8-Apr | 23-Apr | 12 | 15 |
| Gunma | 25-Mar | 5-Apr | 11-Apr | 9-Apr | 22-Apr | 11 | 13 |
| Shizuoka | 25-Mar | 3-Apr | 10-Apr | 6-Apr | 27-Apr | 9 | 21 |
| Aichi | 22-Feb | 30-Mar | 4-Apr | 1-Apr | 27-Apr | 37 | 26 |
| Gifu | 25-Mar | 4-Apr | 8-Apr | 6-Apr | 17-Apr | 10 | 11 |
| Toyama | 1-Apr | 13-Apr | 17-Apr | 18-Apr | 30-Apr | 12 | 12 |
| Osaka | 18-Mar | 6-Apr | 14-Apr | 13-Apr | 6-May | 19 | 23 |
| Hyogo | 19-Mar | 4-Apr | 9-Apr | 7-Apr | 4-May | 16 | 27 |
| Kyoto | 16-Mar | 2-Apr | 7-Apr | 5-Apr | 9-May | 17 | 34 |
| Hiroshima | 26-Mar | 6-Apr | 12-Apr | 10-Apr | 27-Apr | 11 | 17 |
| Fukuoka | 22-Mar | 1-Apr | 11-Apr | 9-Apr | 27-Apr | 10 | 18 |
| Saga | 23-Mar | 15-Apr | 19-Apr | 22-Apr | 1-May | 23 | 9 |
| Okinawa | 28-Mar | 3-Apr | 7-Apr | 10-Apr | 25-Apr | 6 | 15 |
| DS | DD | |||||||||||
|---|---|---|---|---|---|---|---|---|---|---|---|---|
| Tave | Tmax | Tmin | Have | Hmax | Hmin | Tave | Tmax | Tmin | Have | Hmax | Hmin | |
| Tokyo | 11.7 | 16.7 | 6.7 | 6.4 | 9.3 | 4.5 | 14.4 | 19.2 | 9.9 | 8.6 | 10.7 | 6.7 |
| Kanagawa | 12.4 | 16.7 | 8.0 | 6.8 | 9.7 | 4.7 | 16.6 | 20.7 | 13.0 | 9.8 | 11.7 | 7.7 |
| Chiba | 12.4 | 16.1 | 8.1 | 6.6 | 9.5 | 4.6 | 15.1 | 19.1 | 11.2 | 8.4 | 10.3 | 6.4 |
| Ibaragi | 10.3 | 17.1 | 3.4 | 5.7 | 8.5 | 3.7 | 10.8 | 15.6 | 6.4 | 6.5 | 8.2 | 4.9 |
| Gunma | 10.6 | 15.3 | 5.4 | 5.7 | 7.5 | 4.6 | 11.5 | 16.3 | 7.2 | 6.3 | 8.4 | 4.9 |
| Shizuoka | 13.1 | 16.6 | 9.3 | 8.6 | 10.6 | 6.6 | 14.3 | 18.7 | 10.0 | 7.1 | 8.9 | 5.4 |
| Aichi | 10.1 | 14.8 | 6.0 | 5.9 | 7.9 | 4.4 | 13.0 | 18.3 | 8.6 | 6.5 | 8.4 | 4.9 |
| Gifu | 12.0 | 16.4 | 7.7 | 6.7 | 8.4 | 4.9 | 12.6 | 18.2 | 7.7 | 5.1 | 6.6 | 3.6 |
| Toyama | 9.7 | 14.6 | 5.2 | 6.3 | 7.7 | 4.7 | 12.1 | 17.6 | 7.7 | 7.5 | 9.1 | 5.8 |
| Osaka | 12.7 | 17.0 | 8.9 | 6.7 | 8.9 | 5.1 | 16.2 | 20.6 | 12.3 | 8.1 | 10.2 | 6.3 |
| Hyogo | 12.7 | 16.4 | 9.1 | 7.2 | 9.6 | 5.3 | 15.5 | 19.0 | 12.4 | 8.1 | 9.5 | 6.0 |
| Kyoto | 11.5 | 16.6 | 6.8 | 6.4 | 8.6 | 4.7 | 14.7 | 20.1 | 10.0 | 7.1 | 9.0 | 5.3 |
| Hiroshima | 12.4 | 16.2 | 8.6 | 6.5 | 8.5 | 5.0 | 13.2 | 17.4 | 9.2 | 5.6 | 7.4 | 4.2 |
| Fukuoka | 14.2 | 17.5 | 11.3 | 8.8 | 11.0 | 6.9 | 14.0 | 17.5 | 10.9 | 7.3 | 9.4 | 5.7 |
| Saga | 13.4 | 17.9 | 9.0 | 7.3 | 9.1 | 5.5 | 14.9 | 20.1 | 9.8 | 7.1 | 8.6 | 5.4 |
| Okinawa | 21.3 | 24.0 | 18.8 | 14.7 | 17.4 | 12.4 | 19.8 | 22.1 | 17.6 | 11.8 | 14.1 | 10.0 |
| Ds/Density | Dd/Density | |||
|---|---|---|---|---|
| ρ | p-Value | ρ | p-Value | |
| Tave | −0.526 | 0.05 | −0.459 | 0.099 |
| Tmax | −0.659 | <0.05 | −0.385 | 0.175 |
| Tmin | −0.415 | 0.140 | −0.465 | 0.094 |
| Tdiff | 0.227 | 0.435 | 0.487 | 0.078 |
| Have | −0.494 | 0.061 | −0.716 | <0.05 |
| Hmax | −0.737 | <0.05 | −0.741 | <0.05 |
| Hmin | −0.130 | 0.657 | −0.733 | <0.05 |
| Hdiff | −0.760 | <0.05 | −0.718 | <0.05 |
| R2 | adj. R2 | p-Value | |
|---|---|---|---|
| DS | 0.641 | 0.533 | <0.05 |
| DD | 0.416 | 0.240 | 0.130 |
© 2020 by the authors. Licensee MDPI, Basel, Switzerland. This article is an open access article distributed under the terms and conditions of the Creative Commons Attribution (CC BY) license (http://creativecommons.org/licenses/by/4.0/).
Share and Cite
Rashed, E.A.; Kodera, S.; Gomez-Tames, J.; Hirata, A. Influence of Absolute Humidity, Temperature and Population Density on COVID-19 Spread and Decay Durations: Multi-Prefecture Study in Japan. Int. J. Environ. Res. Public Health 2020, 17, 5354. https://doi.org/10.3390/ijerph17155354
Rashed EA, Kodera S, Gomez-Tames J, Hirata A. Influence of Absolute Humidity, Temperature and Population Density on COVID-19 Spread and Decay Durations: Multi-Prefecture Study in Japan. International Journal of Environmental Research and Public Health. 2020; 17(15):5354. https://doi.org/10.3390/ijerph17155354
Chicago/Turabian StyleRashed, Essam A., Sachiko Kodera, Jose Gomez-Tames, and Akimasa Hirata. 2020. "Influence of Absolute Humidity, Temperature and Population Density on COVID-19 Spread and Decay Durations: Multi-Prefecture Study in Japan" International Journal of Environmental Research and Public Health 17, no. 15: 5354. https://doi.org/10.3390/ijerph17155354
APA StyleRashed, E. A., Kodera, S., Gomez-Tames, J., & Hirata, A. (2020). Influence of Absolute Humidity, Temperature and Population Density on COVID-19 Spread and Decay Durations: Multi-Prefecture Study in Japan. International Journal of Environmental Research and Public Health, 17(15), 5354. https://doi.org/10.3390/ijerph17155354


