Abstract
Although the adverse effects of ambient particulate matter (PM) on cardiovascular disease (CVD) have been previously documented, information about their economic consequence was insufficient. This study aimed to evaluate the attributable risk and economic cost of cardiovascular hospitalizations due to ambient PM. Data of CVD hospitalizations and PM concentrations from 1 January 2015 to 31 December 2017 were collected in Wuhan, China. A generalized additive model was applied to quantify the PM-attributable CVD hospitalizations, and total attributable hospitalization costs were calculated via multiplying the total attributable cases by the case-average hospitalization costs. A total of 45,714 CVD hospitalizations were included in this study. The results showed that a 10 µg/m3 increase in PM2.5 and PM10 concentrations at lag7 day, respectively, contributed to a 1.01% (95% confidence interval: 0.67–1.34) and 0.48% (0.26–0.70) increase in CVD hospitalizations. During the study period, 1487 and 983 CVD hospitalizations were attributable to PM2.5 and PM10, equaling an economic cost of 29.27 and 19.34 million RMB (1 RMB = 0.1424 USD), respectively, and significant differences in PM-attributable hospitalizations and economic burden were found between gender and age groups. Our study added evidence in heavily polluted megacities regarding the increased health risk and economic cost of CVD hospitalizations associated with ambient particulate pollution.
1. Introduction
Ambient particulate matter (PM) is typically considered to be the primary air pollutant, which has been of increasing public concern, and was estimated to have caused 40.93 million deaths and 105.67 million disability-adjusted life-years (DALYs) in 2016 globally [1]. Particularly, ambient PM contributed greater health impacts to Chinese populations [2]. Emerging studies have evaluated the adverse effects of PM on cardiovascular disease (CVD). For instance, with a 10 µg/m3 increase of the PM2.5 (particulate matter with aerodynamic diameter <2.5 µm) concentration, a nationwide time-series analysis in 272 Chinese cities suggested that PM2.5 was related to an increase in daily cardiovascular disease mortality of 0.27% (95% confidence interval: 0.18–0.36) [3]; other studies [4,5] found that exposure to PM2.5 contributed to increased cardiovascular hospital admissions in Shandong (0.40% (0.03–0.78)), and Beijing (0.30% (0.20–0.39)) as well. For PM10 (particulate matter with aerodynamic diameter <10 µm), a review study reported a 0.70% (0.60–0.80) increase in cardiovascular mortality per 10 µg/m3 increase of the PM10 concentration [6]; PM10 exposure was also associated with increased ischemic heart disease mortality (0.86% (0.22–1.51)) [7] and elevated stroke hospitalizations (1.0% (0.1–1.4)) [8].
The health costs of air pollution were predicted to achieve $580 billion globally by 2050 [9]. Meanwhile, a study indicated that PM2.5 pollution should cause a loss of about 2.0% of China’s GDP by 2030 if necessary measures are not taken [10]. There were 290 million CVD cases in China [11], and CVD accounted for the highest proportion of the total curative care expenditure followed by neoplasm and respiratory diseases [12]. Nevertheless, few studies have determined the economic burdens of CVD attributable to ambient PM, and previous studies have mainly focused on its health outcomes (e.g., mortality and hospital admission), as described above. Therefore, the assessment of both the health and economic burden is urgently needed, which could provide more comprehensive information for the cost-effectiveness evaluation of policy-making regarding air pollution control.
It was on this basis we conducted our study to determine the association between exposure to ambient PM (including PM2.5 and PM10) and cardiovascular hospitalizations in Wuhan, China. In addition, we further quantified the CVD hospitalizations and hospitalization expenses attributable to PM2.5 and PM10; the preventable CVD hospitalizations and savable hospitalization costs were also estimated based on the scenarios that the concentrations of PM2.5 and PM10 during the study period could be maintained at relatively lower levels.
2. Methods
2.1. Study Area
As the largest metropolis in central China, Wuhan has experienced heavy air pollution in the past few years with the development of urbanization, motorization and industrialization [13]. Wuhan is located at 113.7–113.1° E and 29.9–31.4° N with an 8569.15 km2 total metropolitan area, and the permanent residents were 10.33 million by the end of 2019. The main climate type in Wuhan is humid subtropical monsoon, characterized by hot summers and cold winters as well as short springs and autumns.
2.2. Data Collection
Daily hospitalization admission data between 1 January 2015 and 31 December 2017 were obtained from two general hospitals in Wuhan; both the chosen hospitals are Grade-A tertiary hospitals with well-known expertise in diagnosing and treating disease. Records of hospital admissions included admission date, age, gender, principal discharge diagnosis and hospitalization costs, and the diagnosis of disease was coded according to the International Classification of Disease Tenth Revision (ICD-10). Patients hospitalized due to CVD (ICD-10: I00-I99) were included in our study; the entire study group was divided into two gender groups (male and female) and two age groups (0–64 years and +65 years). Further break-down of the 0–64 years group was not conducted because the children group (0–14 years) only accounted for 0.24% of the total cases. Besides, two subtypes of CVD including ischemic heart disease (IHD, ICD-10: I20-I25) and stroke (ICD-10: I60-I69) were also analyzed.
Data of ambient air pollutants including PM2.5, PM10, SO2 (sulfur dioxide) and NO2 (nitrogen dioxide) were acquired from the Hubei Environmental Protection Bureau; the daily mean concentration (µg/m3) for each air pollutant was calculated by averaging across the measurements from the 10 monitoring stations in Wuhan. Daily meteorological data were collected from the China Meteorological Data Network (http://data.cma.cn), including mean air temperature (°C) and relative humidity (%). The spatial distribution of included hospitals and air monitoring sites are displayed in Figure S1.
2.3. Data Analysis
A three-stage analytic approach was used to analyze the data. Firstly, we decomposed the time-series data (including PM concentration, CVD hospitalizations and hospitalization costs) to detect a potential long-term trend and seasonality. Secondly, we applied a time-series model to estimate PM-hospitalization associations. Thirdly, we calculated the hospitalizations and hospitalization costs attributable to PM2.5 and PM10.
2.3.1. First-Stage Analysis
A seasonal-trend decomposed method was used to detect a potential long-term trend and seasonality of the daily concentration of PM (PM2.5 and PM10), daily hospitalizations and case-average hospitalization costs. The time-series was split into three additive components, including a long-term trend during the study period, seasonal variations within years and random variation [14,15]; the fundamental statistical model was as shown:
where is the linear trend; is the seasonal effect; is the r random noise and t = 1, 2, …., N.
2.3.2. Second-Stage Analysis
The associations of PM2.5 and PM10 with CVD hospitalizations were estimated by using a generalized additive model (GAM) with quasi-Poisson regression as shown:
where is the expected hospitalizations on day i, is the estimated slope of associations of the concentrations of PM2.5 or PM10 on day i, s is a spline smoothing function for the nonlinear variable (e.g., time, mean temperature and relative humidity), df is the degree of freedom—7 df per year for time trends [15,16] and 3 df per year for mean temperature and relative humidity were defined [17], DOW is a categorical variable for day of the week and is the intercept of the model.
Effect estimates across lag0 day (the day of hospital admission) to lag7 day (7 days prior to hospital admission) were investigated in our current study, which were presented as a percent change (PC, %), and the 95% confidence interval (CI) in daily CVD hospitalizations was associated with a 10 µg/m3 increase in the concentrations of PM2.5 or PM10. PC was calculated through Equation (3):
where is the estimated slope of associations of the concentrations of PM2.5 or PM10 on day i, which was obtained from Formula (2).
2.3.3. Third-Stage Analysis
The attributable fraction (AF) and attributable number (AN) of CVD hospitalizations due to PM2.5 or PM10 were estimated by using the method mentioned previously [18,19,20,21]. The following, Equations (4) and (5), were used:
where is the attributable fraction on day i, is the attributable number of CVD hospitalizations on day i, is the daily CVD hospitalizations on day i and is the estimated slope of associations of the concentrations of PM2.5 or PM10 on day i. is the concentration difference between the observed and the reference concentrations of PM2.5 or PM10 on day i. The reference concentration is a threshold level at which no health effects are yet assumed, then the air quality standard proposed by the World Health Organization (WHO) was considered as the threshold (24 h average value: 25 µg/m3 for PM2.5 and 50 µg/m3 for PM10) in our current study [20].
Therefore, the total attributable number was estimated by summing daily , and its ratio with total CVD hospitalizations was the total AF. We further calculated the total attributable hospitalization costs via multiplying the total attributable number by the case-average hospitalization costs during the study period [20,22]. The potential number of avoidable hospitalizations and savable hospitalization costs were also estimated based on the scenarios that the concentrations of PM2.5 and PM10 during the study period could be maintained at relatively lower levels. All the costs were presented as the 2020 price in Renminbi using a consumer price index for adjustment (1 RMB = 0.1424 USD).
2.3.4. Sensitivity Analysis
A sensitivity analysis was performed to examine the robustness of the model through: (1) adjusting for co-pollutants (SO2 and NO2) and (2) changing the degree of freedom (df = 8 and 9) for the long-term trend and seasonality.
All analyses were conducted by R software (version 3.6.1, R Foundation for Statistical Computing, Vienna, Austria), and two-sided tests with p < 0.05 were considered to be statistically significant.
2.4. Ethical Approval
All the data in our study were anonymous and de-identified, and it was approved by the Ethics Committee of the Medical Department of Wuhan University to waive informed consent of the participants (No. 2019YF2037).
3. Results
A total of 45,714 CVD hospitalizations from 1 January 2015 to 31 December 2017 were included in this study, of which IHD and stroke, respectively, accounted for 20.77% and 38.29%. Table 1 provides the summary statistics of daily hospitalization counts, hospitalization costs, air pollutant concentration and meteorological factors in Wuhan, China, from 2015–2017. On average, there were 42 admission cases per day for CVD, 9 cases for IHD and 16 cases for stroke. The daily CVD hospitalizations of males were obviously higher than that of females, and there were less daily CVD hospitalizations for patients aged 0–64 years compared with the older group (65+ years). The average hospitalization costs for CVD, IHD and stroke were 19,680 RMB, 19,320 RMB and 24,290 RMB, respectively. Higher mean CVD-associated costs were observed for males and patients aged 0–64 years.

Table 1.
Summary statistics of daily hospitalization counts, hospitalization costs, air pollutant concentration and meteorological factors in Wuhan, China, from 2015–2017.
The annual average concentrations of PM2.5 and PM10 were 58.52 µg/m3 and 96.10 µg/m3 in Wuhan; both exceeded the secondary standard of ambient air quality in China (annual average value: 35µg/m3 for PM2.5 and 70 µg/m3 for PM10). In addition, the annual mean temperature and relative humidity were 17.20 °C and 80.62%, respectively. Spearman’s rank correlation indicated that PM2.5 and PM10 were moderately correlated with SO2 and NO2, while they were slightly correlated with meteorological factors (see Table S1).
The long-term trend and seasonality of the daily concentrations of PM2.5 and PM10, daily hospitalizations and case-average hospitalization costs due to CVD are shown in Figure 1. During the study period, the daily concentrations of PM2.5 and PM10 had similar characteristics of periodic fluctuation with a downtrend annually, the seasonal pattern of which showed a high concentration in winter and spring while a low concentration in summer and autumn. However, daily CVD hospitalizations and case-average hospitalization costs increased over the three-year study period without notable seasonal fluctuations. Similar trends in hospitalizations and costs were also noted for IHD and stroke (see Figure S2).
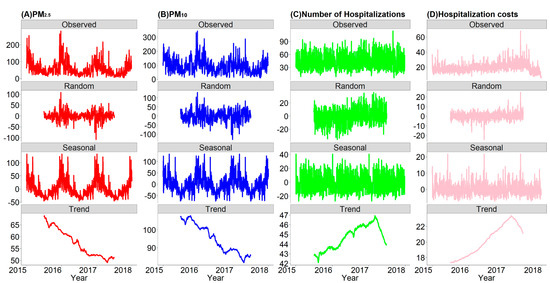
Figure 1.
The decomposed distributions for the daily concentrations of PM2.5 and PM10, daily hospitalizations and case-average hospitalization costs due to CVD in Wuhan, China, from 2015–2017. (A) daily concentration of PM2.5; (B) daily concentration of PM10; (C) daily number of hospitalizations; (D) case-average hospitalization costs.
Figure 2 illustrates the estimated percent changes (%, 95% CI) of hospitalization risks associated with a 10 µg/m3 increase in PM2.5 and PM10 concentrations at different lag days in single-pollutant models. We found evidence for significant positive associations for at least two exposure lag days between the PM2.5 concentration and hospital admissions for all cardiovascular outcomes. The strongest effects were noted at lag7 day; the corresponding percent changes of hospitalizations for CVD, IHD and stroke were 1.01% (0.67–1.34), 1.10% (0.37–1.84) and 1.01% (0.45–1.56), respectively. With a 10 µg/m3 increase in PM10, significant percent changes of cardiovascular hospitalizations first occurred at lag2 day with the exception of strokes. Likewise, estimated values reached the peak at lag7 day, and were 0.48% (0.26–0.70), 0.58% (0.11–1.07) and 0.61% (0.25–0.96) for CVD, IHD and stroke, respectively. To ease the interpretation, the lag7 day concentrations of PM2.5 and PM10 are further analyzed in the following paragraphs, since these days produced the largest effect estimates.
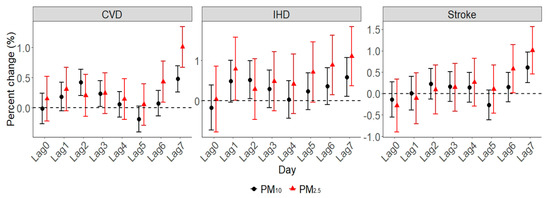
Figure 2.
The estimated percent change of cardiovascular disease (CVD) hospitalizations due to a 10 µg/m3 increase in PM2.5 and PM10 concentrations.
Results of subgroup analyses of CVD hospitalizations are presented in Figure 3. There was no notable gender difference for PM2.5, whereas males were more vulnerable to PM10 (0.51% (0.22–0.79)) than females (0.44% (0.11–0.77)). For age group, greater estimated values were found for the group aged 0–64 years; the percent changes of PM2.5 and PM10 were 1.05% (0.53–1.56) and 0.57% (0.24–0.91), respectively. Subgroup analyses of IHD and stroke are presented in Figures S3 and S4, and significant differences were found by gender and age groups.
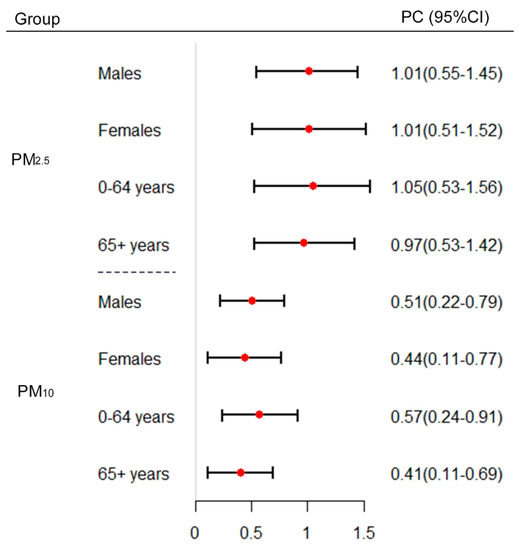
Figure 3.
The estimated percent change of CVD hospitalizations per 10 µg/m3 increase in PM2.5 and PM10 concentrations, by gender and age group. PC: percent change; CI: confidence interval.
Table 2 demonstrates the estimated attributable figures for different CVD observations during the study period. For all CVD, 1487 and 983 hospitalizations were, respectively, attributable to PM2.5 and PM10, which corresponded to 29.27 million RMB and 19.34 million RMB. Both attributable hospitalizations and attributable hospitalization costs were higher in males than in females. In addition, there were more attributable hospitalizations due to PM2.5 for the group aged 65+ years than the younger group (0–64 years), while the opposite results were produced by PM10. In addition, there were 340 and 249 IHD-related hospitalizations attributable to PM2.5 and PM10, and the associated attributable hospitalization costs were 6.57 million RMB and 4.82 million RMB, respectively. For stroke, 13.35 million RMB and 8.98 million RMB were attributable to PM2.5 and PM10, and the attributable hospitalizations were 550 and 465, respectively.
Table 2.
The number of hospitalizations and hospitalization costs attributable to PM2.5 and PM10 in Wuhan, China, from 2015–2017.
Figure 4 illustrates the potential number of avoidable hospitalizations and savable hospitalization costs if the concentration of PM2.5 and PM10 during the study period could be maintained at relatively low levels. For total CVD, maintaining the PM2.5 concentration at 45 µg/m3 could prevent 193 hospitalizations and save 3.8 million RMB annually. In addition, if the PM10 concentration could be maintained at 90 µg/m3, 39 hospitalizations could be avoided annually, reducing 0.8 million RMB correspondingly. It seems obvious that more hospital admissions and hospitalization costs could be avoided if the historical concentrations of PM2.5 and PM10 are kept at lower levels, such that if the PM2.5 concentration is kept at 30 µg/m3, 420 hospitalizations and 8.3 million RMB could be avoided annually, and if the concentration of PM10 is maintained at 60 µg/m3, 255 hospitalizations and 5.0 million RMB could be averted annually. In addition, more health and economic benefits could be obtained for stroke than IHD. For instance, if the historical concentration of PM2.5 is maintained at 45 µg/m3, more stroke-associated hospitalizations and costs (68 and 1.5 million RMB, respectively) could be prevented than IHD (45 and 0.9 million RMB, respectively). More details about the subgroup analysis are showed in the supplementary material (see Figure S5).
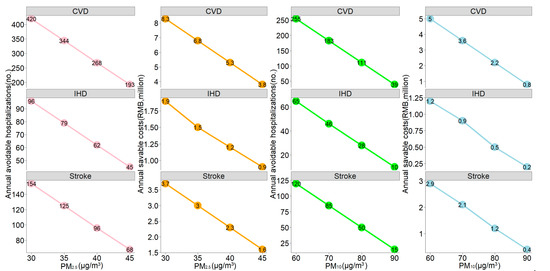
Figure 4.
The estimated annual avoidable hospitalizations and savable hospitalization costs if the historical concentrations of PM2.5 and PM10 could be maintained at relatively low levels. The air quality standard proposed by the WHO (24-h average value: 25 µg/m3 for PM2.5 and 50 µg/m3 for PM10) was considered as the reference.
Sensitivity analyses of adjusted co-pollutants in the model (SO2 and NO2) and changed df (8 and 9) for the long-term trend and seasonality were performed, which suggested that our main models were generally robust (See Table S2).
4. Discussion
Some notable results were found in this time-series study in Wuhan, China. First, the daily concentration of ambient PM showed a downtrend, while daily cardiovascular hospitalizations and hospitalization costs increased during the study period. Second, exposure to PM2.5 and PM10 were associated with an excess risk of CVD hospitalization, and differences were found by gender and age groups. Third, substantial economic costs were attributed to PM2.5 and PM10 exposure; millions of hospitalization costs could be avoided if the historical PM concentration is maintained at relatively low levels.
In this study, we conducted a decomposed method to detect the potential long-term trend and seasonality of the daily concentration of ambient PM, daily hospitalizations and case-average hospitalization costs. Possibly as a result of strengthened measures taken by the local government to control ambient air pollution recently, a trend of a decline in the PM concentration from 2015 to 2017 was observed. The ambient PM concentration was relatively high in winter and spring; such a seasonal pattern could be interpreted by the increased burning of coal to provide central heating in the cold season that might cause more PM. Another reason might be that temperature inversion is common in the cold season, which would inhibit the spread of air pollutants. However, both daily CVD hospitalizations and corresponding average hospitalization costs performed uptrends during the study period, echoing a study [23] that suggested that the prevalence of non-communicable diseases was increasing worldwide, especially for CVD. A natural cubic spline for time with 7 df per year was commonly used to control for the long-term trend of daily hospital admissions [15,16,24]. In addition, with the growth of per-capita income and chronic disease morbidity, rates of patients leaving against medical advice and avoiding the hospital decreased [25], contributing to the increase of hospitalization expenses.
In line with previous studies, our results reported that PM was associated with an excess risk of CVD hospitalization. For example, with a 10 µg/m3 increment of the PM concentration, a 0.87% increase in cardiovascular hospital admissions due to PM2.5 [13] and 1.0% increase in stroke hospitalizations due to PM10 [8] were found in Wuhan. In addition, other researchers observed consistently increased hospitalizations associated with PM2.5 and PM10 for CVD in some Chinese regions such as Shandong [4], Beijing [5], Shanghai [26] and Sichuan [27]. Moreover, studies [28,29] of Brazil, France, Iran and Italy also demonstrated the positive associations between PM exposure and cardiovascular hospitalizations. Ambient PM mainly comes from fossil fuel combustion and automobile exhaust, which contains toxic organic compounds such as benzopyrene and many heavy metals (e.g., lead, nickel and chromium) [30]. Previous clinical and toxicological studies have established several possible mechanisms for how PM and its components adversely impact the cardiovascular system. For instance, Cao et al. [31] indicated that PM could lead to cardiomyocyte apoptosis by protein kinase activation, and Kowalska et al. [32] suggested that PM contributed to myocardial infarction via destabilizing atherosclerotic plaques. Other researchers also found that PM was related to acute decompensated heart failure symptoms [33,34], decreased heart rate variability and changed autonomic tone [35,36].
Gender and age differences in associations of particulate pollution with cardiovascular health have been of wide interest in air pollution epidemiology. We found that the impacts of PM on CVD were significantly greater in males, which is consistent with a study in Shanghai [26], while other studies [5,37] showed that the gender differences were statistically insignificant. Similar with previous studies [13,38], a greater increase of CVD hospitalizations for the younger group (0–64 years) was also observed in our current study. However, a study of Powell et al. [39] suggested stronger associations between daily CVD hospital admissions and particulate air pollution were observed for the elderly. Considering the gender and age group specific associations were varied, the likely explanation for the heterogeneity might be various study designs, research periods and sociodemographic and economic characteristics.
Economic burden assessment is crucial for the cost-effectiveness evaluation of policy-making regarding air pollution control. A study of Tianjin [40] calculated that attributable CVD mortalities due to PM2.5 were equivalent to 2.79% of the local GDP when converted into present value, and Cheng et al. [16] demonstrated that 21 million RMB CVD-associated hospitalization expenses could be saved annually in Lanzhou if the concentration of CO is kept below 1 mg/m3. Other studies in regard to mental disorders [20] and pneumonia [22] also showed that a certain amount of medical expenses could be avoided with the decline of PM concentrations. Correspondingly, our current study illustrated that 29.27 million RMB and 19.34 million RMB were, respectively, attributed to PM2.5 and PM10, and more hospitalization costs could be saved if the historical concentration of PM is maintained at lower levels. To some extent, our study might fill some of the gaps of knowledge about the health economic aspects of particulate air pollution on CVD in central China, and further studies should focus on other air pollutants on cardiovascular health.
The present study had some limitations. First, the average concentration of PM in Wuhan was considered as personal exposure, which may cause measurement errors. It is a well-recognized inherent limitation of such environmental epidemiological studies [41] that is likely to underestimate the effects of PM [42]. Second, the influences of meteorological factors, day of the week, gender and age were considered in our current study, and more individual information such as socio-economic status and behavioral factors could also be considered in follow-up studies. Third, the economic burden calculated in this study tended to understate the real economic burden of CVD due to PM, since the economic cost in our results only included the direct hospitalization expenses, while the indirect medical costs and outpatient expenditures were not analyzed. Consequently, more research should be undertaken to resolve these issues.
5. Conclusions
In conclusion, we found that ambient particulate pollution increased CVD risk and cost among hospital admission patients in Wuhan, one of the heavily polluted megacities in central China. Then, we should continue to strengthen the efforts to alleviate the level of particulate pollution in Wuhan, which would certainly reduce the health and economic burden among patients with CVD. Our study also highlights the demand for evaluating the air pollution-related economic effect. It may have important implications for promoting the cost-effectiveness evaluation of measures regarding air pollution control, thereby providing informative priorities about measures with the largest benefits for local decision-makers from the public health perspective.
Supplementary Materials
The following are available online at https://www.mdpi.com/1660-4601/17/15/5453/s1. Figure S1: The spatial distribution of included hospitals and air monitoring sites in Wuhan, China. Figure S2: The decomposed distribution of daily hospitalizations (no.) and case-average hospitalization costs due to IHD (A and B) and stroke (C and D) in Wuhan, China, from 2015–2017. Figure S3: The estimated percent change of IHD hospitalizations of per 10 µg/m3 increase in PM2.5 and PM10 concentrations, by gender and age group. PC: percent change, CI: confidence interval. Figure S4: The estimated percent change of stroke hospitalizations per 10 µg/m3 increase in PM2.5 and PM10 concentrations, by gender and age group. PC: percent change, CI: confidence interval. Figure S5: The estimated annual avoidable hospitalizations and savable hospitalization costs for CVD subgroups if the historical concentrations of PM2.5 and PM10 could be maintained at relatively low levels. The air quality standard proposed by the WHO (24-h average value: 25 µg/m3 for PM2.5 and 50 µg/m3 for PM10) was considered as the reference. Table S1: The coefficient of the Spearman rank correlation between particulate matter (including PM2.5 and PM10) and SO2, NO2 and meteorological factors in Wuhan, China. Table S2: Results of sensitivity analyses by adjusting for co-pollutants and changing the degree of freedom for the long-term trend and seasonality. Results are shown in percent change (%) per 10 µg/m3 increase in PM2.5 and PM10 concentrations at the best lag day.
Author Contributions
Conceptualization, X.W. and Y.Z.; data curation, X.W., C.Y., F.S. and Y.Y.; formal analysis, X.W. and Y.Y.; funding acquisition, C.Y.; methodology, X.W., C.Y., Y.Z. and Y.Y.; writing—original draft, X.W., Y.Z. and R.M.; writing—review and editing, X.W., C.Y., Y.Z., F.S., R.M. and Y.Y. All authors have read and agreed to the published version of the manuscript.
Funding
This work was funded by the National Natural Science Foundation of. China (Grant No. 81773552) and the National Key Research and Development Program of China (Grant No. 2018YFC1315302, 2017YFC1200502).
Conflicts of Interest
The authors declare no conflict of interest.
References
- GBD Collaborators. Global, regional, and national comparative risk assessment of 84 behavioral, environmental and occupational, and metabolic risks or clusters of risks, 1990–2016: A systematic analysis for the Global Burden of Disease Study 2016. Lancet 2017, 390, 1345–1422. [Google Scholar]
- Wang, Y.; Qi, Y.; Hu, J.; Zhang, H. Spatial and temporal variations of six criteria air pollutants in 31 provincial capital cities in China during 2013–2014. Environ. Int. 2014, 73, 413–422. [Google Scholar] [CrossRef] [PubMed]
- Chen, R.; Yin, P.; Meng, X.; Liu, C.; Wang, L.; Xu, X.; Ross, J.A.; Tse, L.A.; Zhao, Z.; Kan, H.; et al. Fine particulate air pollution and daily mortality: A nationwide analysis in 272 Chinese cities. Am. J. Respir. Crit. Care Med. 2017, 196, 73–81. [Google Scholar] [CrossRef] [PubMed]
- Liu, Y.; Sun, J.; Gou, Y.; Zhang, D.; Xue, F. Analysis of short-term effects of air pollution on cardiovascular disease using bayesian spatial-temporal models. Int. J. Environ. Res. Public Health 2020, 17, 879. [Google Scholar] [CrossRef] [PubMed]
- Amsalu, E.; Wang, T.; Li, H.; Liu, Y.; Guo, X. Acute effects of fine particulate matter (PM2.5) on hospital admissions for cardiovascular disease in Beijing, China: A time-series study. Environ. Health 2019, 18, 70. [Google Scholar] [CrossRef]
- Karimi, B.; Shokrinezhad, B.; Samadi, S. Mortality and hospitalizations due to cardiovascular and respiratory diseases associated with air pollution in Iran: A systematic review and meta-analysis. Atmos. Environ. 2019, 198, 438–447. [Google Scholar] [CrossRef]
- Zhang, Y.; Wu, K.; Zhu, C.; Deng, Z.; Tang, X.; Ma, L. Seasonal variation in association between air pollution and ischemic heart disease mortality in Wuhan, China. China J. Public Health 2015, 31, 926–929. [Google Scholar]
- Hao, X.; Mertz, K.J.; Arena, V.C.; Brink, L.L.; Xu, X.; Bi, Y.; Talbott, E.O.; Block, M.L. Estimation of short-term effects of air pollution on stroke hospital admissions in Wuhan, China. PLoS ONE 2013, 8, e61168. [Google Scholar]
- Selin, N.E.; Wu, S.; Nam, K.; Reilly, J.M.; Prinn, R.G.; Webster, M.D. Global health and economic impacts of future ozone pollution. MIT Jt. Program Sci. Policy Glob. Chang. 2013, 4, 940–941. [Google Scholar] [CrossRef]
- Xie, Y.; Dai, H.; Dong, H.; Hanaoka, T.; Masui, T. Economic impacts from PM2.5 pollution-related health effects in China: A provincial-level analysis. Environ. Sci. Technol. 2016, 50, 4836–4843. [Google Scholar] [CrossRef]
- National Center for Cardiovascular Diseases. Report on Cardiovascular Disease in China. Encyclopedia of China Publishing House 2018. Available online: http://www.nccd.org.cn/News/Information/Index/1089 (accessed on 9 June 2020).
- He, J.; Yin, Z.; Duan, W.; Wang, Y.; Wang, X. Factors of hospitalization expenditure of the genitourinary system diseases in the aged based on “System of Health Account 2011” and neural network model. J. Glob. Health 2018, 8, 20504. [Google Scholar] [CrossRef] [PubMed]
- Wang, X.; Wang, W.; Jiao, S.; Yuan, J.; Hu, C.; Wang, L. The effects of air pollution on daily cardiovascular diseases hospital admissions in Wuhan from 2013 to 2015. Atmos. Environ. 2018, 182, 307–312. [Google Scholar] [CrossRef]
- Lee, J.H.; Sohn, K.T. Prediction of monthly mean surface air temperature in a region of China. Adv. Atmos. Sci. 2007, 24, 503–508. [Google Scholar] [CrossRef]
- Cheng, J.; Xu, Z.; Zhang, X.; Zhao, H.; Hu, W. Estimating cardiovascular hospitalizations and associated expenses attributable to ambient carbon monoxide in Lanzhou, China: Scientific evidence for policy making. Sci. Total Environ. 2019, 682, 514–522. [Google Scholar] [CrossRef] [PubMed]
- Chen, G.; Li, S.; Zhang, Y.; Zhang, W.; Li, D.; Wei, X.; He, Y.; Bell, M.L.; Williams, G.; Marks, G.B.; et al. Effects of ambient PM1 air pollution on daily emergency hospital visits in China: An epidemiological study. Lancet Planet Health 2017, 1, e221–e229. [Google Scholar] [CrossRef]
- Luo, L.; Zhang, Y.; Jiang, J.; Luan, H.; Yu, C.; Nan, P.; Luo, B.; You, M. Short-term effects of ambient air pollution on hospitalization for respiratory disease in Taiyuan, China: A time-series analysis. Int. J. Environ. Res. Public Health 2018, 15, 2160. [Google Scholar] [CrossRef]
- Zhang, Y.; Xiang, Q.; Yu, C.; Bao, J.; Ho, H.C.; Sun, S.; Ding, Z.; Hu, K.; Zhang, L. Mortality risk and burden associated with temperature variability in China, United Kingdom and United States: Comparative analysis of daily and hourly exposure metrics. Environ. Res. 2019, 179, 108771. [Google Scholar] [CrossRef]
- Chen, G.; Zhang, W.; Li, S.; Zhang, Y.; Guo, Y. The impact of ambient fine particles on influenza transmission and the modification effects of temperature in China: A multi-city study. Environ. Int. 2016, 98, 82. [Google Scholar] [CrossRef]
- Wu, Z.; Chen, X.; Li, G.; Tian, L.; Wang, Z.; Xiong, X.; Yang, C.; Zhou, Z.; Pan, X. Attributable risk and economic cost of hospital admissions for mental disorders due to PM2.5 in Beijing. Sci. Total Environ. 2020, 718, 137274. [Google Scholar] [CrossRef]
- Maji, K.J.; Arora, M.; Dikshit, A.K. Burden of disease attributed to ambient PM2.5 and PM10 exposure in 190 cities in China. Environ. Sci. Pollut. Res. 2017, 24, 11559–11572. [Google Scholar] [CrossRef]
- Patto, N.V.; Nascimento, L.F.C.; Mantovani, K.C.C.; Vieira, L.C.P.F.; Moreira, D.S. Exposure to fine particulate matter and hospital admissions due to pneumonia: Effects on the number of hospital admissions and its costs. Rev. Assoc. Med. Bras. 2016, 24, 342–346. [Google Scholar] [CrossRef]
- Beaglehole, R.; Bonita, R.; Horton, R.; Adams, C.; Alleyne, G.; Asaria, P.; Baugh, V.; Bekedam, H.; Billo, N.; Casswell, S. Priority actions for the non-communicable disease crisis. Lancet 2011, 378, 565–566. [Google Scholar] [CrossRef]
- Hu, K.; Guo, Y.; Hu, D.; Du, R.; Yang, X.; Zhong, J.; Fei, F.; Chen, F.; Chen, G.; Zhao, Q. Mortality burden attributable to PM1 in Zhejiang province, China. Environ. Int. 2018, 121, 515–522. [Google Scholar] [CrossRef]
- Pan, B.; Yuan, Z.; Zou, J.; Cook, D.M.; Yang, W. Elderly hospitalization and the New-type Rural Cooperative Medical Scheme (NCMS) in China: Multi-stage cross-sectional surveys of Jiangxi province. BMC Health Serv. Res. 2016, 16, 436. [Google Scholar] [CrossRef] [PubMed]
- Xu, A.; Zhe, M.; Bo, J.; Wei, W.; Han, Y.; Zhang, L.; Li, J. Acute effects of particulate air pollution on ischemic heart disease hospitalizations in Shanghai, China. Int. J. Environ. Res. Public Health 2017, 14, 168. [Google Scholar] [CrossRef]
- Liu, S.; Wang, L.; Zhou, L.; Li, W.; Pu, X.; Jiang, J.; Chen, Y.; Zhang, L.; Qiu, H. Differential effects of fine and coarse particulate matter on hospitalizations for ischemic heart disease: A population-based time-series analysis in Southwestern China. Atmos. Environ. 2020, 224. [Google Scholar] [CrossRef]
- Mantovani, K.C.C.; Nascimento, L.F.C.; Moreira, D.S.; da Silva Vieira, L.C.P.F.; Vargas, N.P. Air pollutants and hospital admissions due to cardiovascular diseases in São José do Rio Preto, Brazil. Ciência Saúde Coletiva 2016, 21. [Google Scholar] [CrossRef]
- Sicard, P.; Khaniabadi, Y.O.; Perez, S.; Gualtieri, M.; De Marco, A. Effect of O3, PM10 and PM2.5 on cardiovascular and respiratory diseases in cities of France, Iran and Italy. Environ. Sci. Pollut. Res. 2019, 26, 32645–32665. [Google Scholar] [CrossRef]
- Zhao, Z.; Lv, S.; Zhang, Y.; Zhao, Q.; Shen, L.; Xu, S.; Yu, J.; Hou, J.; Jin, C. Characteristics and source apportionment of PM2.5 in Jiaxing, China. Environ. Sci. Pollut. Res. 2019, 26, 7497–7511. [Google Scholar] [CrossRef]
- Cao, J.; Qin, G.; Shi, R.; Bai, F.; Yang, G.; Zhang, M.; Lv, J. Overproduction of reactive oxygen species and activation of MAPKs are involved in apoptosis induced by PM2.5 in rat cardiac H9c2 cells. J. Appl. Toxicol. 2016, 36, 609–617. [Google Scholar] [CrossRef]
- Kowalska, M.; Kocot, K. Short-term exposure to ambient fine particulate matter (PM2.5 and PM10) and the risk of heart rhythm abnormalities and stroke. Adv. Hyg. Exp. Med. 2016, 70, 1017–1025. [Google Scholar]
- Meo, S.A.; Suraya, F. Effect of environmental air pollution on cardiovascular diseases. Eur. Rev. Med. Pharm. Sci. 2016, 19, 4890–4897. [Google Scholar]
- Newby, D.E.; Mannucci, P.M.; Tell, G.S.; Baccarelli, A.A.; Brook, R.D.; Donaldson, K.; Forastiere, F.; Franchini, M.; Franco, O.H.; Graham, I. Expert position paper on air pollution and cardiovascular disease. Eur. Heart J. 2015, 36, 83–93. [Google Scholar] [CrossRef] [PubMed]
- Brook, D.R.; Franklin, B. Air pollution and cardiovascular disease: A statement for healthcare professionals from the expert panel on population and prevention science of the American Heart Association. Circulation 2004, 109, 2655–2671. [Google Scholar] [CrossRef]
- Tsai, T.Y.; Lo, L.W.; Liu, S.H.; Cheng, W.H.; Chou, Y.H.; Lin, W.L.; Lin, Y.J.; Chang, S.L.; Hu, Y.F.; Chung, F.P.; et al. Diurnal cardiac sympathetic hyperactivity after exposure to acute particulate matter 2.5 air pollution. J. Electrocardiol. 2019, 52, 112–116. [Google Scholar] [CrossRef]
- Li, H.; Chen, R.; Meng, X.; Zhao, Z.; Cai, J.; Wang, C.; Yang, C.; Kan, H. Short-term exposure to ambient air pollution and coronary heart disease mortality in 8 Chinese cities. Int. J. Cardiol. 2015, 197, 265–270. [Google Scholar] [CrossRef]
- Lin, C.M.; Kuo, H.W. Sex-age differences in association with particulate matter and emergency admissions for cardiovascular diseases: A hospital-based study in Taiwan. Public Health 2013, 127, 828–833. [Google Scholar] [CrossRef]
- Powell, H.; Krall, J.R.; Wang, Y.; Bell, M.L.; Peng, R.D. Ambient coarse particulate matter and hospital admissions in the medicare cohort air pollution study, 1999–2010. Environ. Health Persp. 2015, 123, 1152–1158. [Google Scholar] [CrossRef]
- Zhang, J.; Feng, L.; Hou, C.; Gu, Q. Health benefits on cardiocerebrovascular disease of reducing exposure to ambient fine particulate matter in Tianjin, China. Environ. Sci. Pollut. Res. 2020, 27, 13261–13275. [Google Scholar] [CrossRef]
- Zeger, S.L.; Thomas, D.; Dominici, F.; Samet, J.M.; Schwartz, J.; Dockery, D.; Cohen, A. Exposure measurement error in time-series studies of air pollution: Concepts and consequences. Environ. Health Persp. 2000, 108, 419–426. [Google Scholar] [CrossRef]
- Hutcheon, J.A.; Chiolero, A.; Hanley, J.A. Random measurement error and regression dilution bias. BMJ 2010, 340, c2289. [Google Scholar] [CrossRef] [PubMed]


© 2020 by the authors. Licensee MDPI, Basel, Switzerland. This article is an open access article distributed under the terms and conditions of the Creative Commons Attribution (CC BY) license (http://creativecommons.org/licenses/by/4.0/).