Microplastics in Food: A Review on Analytical Methods and Challenges

 , ,
, , 
Abstract
1. Introduction
2. Methods
3. Results
3.1. Microplastic Occurrence in Food
3.1.1. Table Salt
3.1.2. Fish and Shellfish
3.1.3. Processed Foods
3.2. Analytical Methods
3.2.1. Pretreatment Methods
3.2.2. Microplastic Identification
3.3. Material Type, Shape, and Size
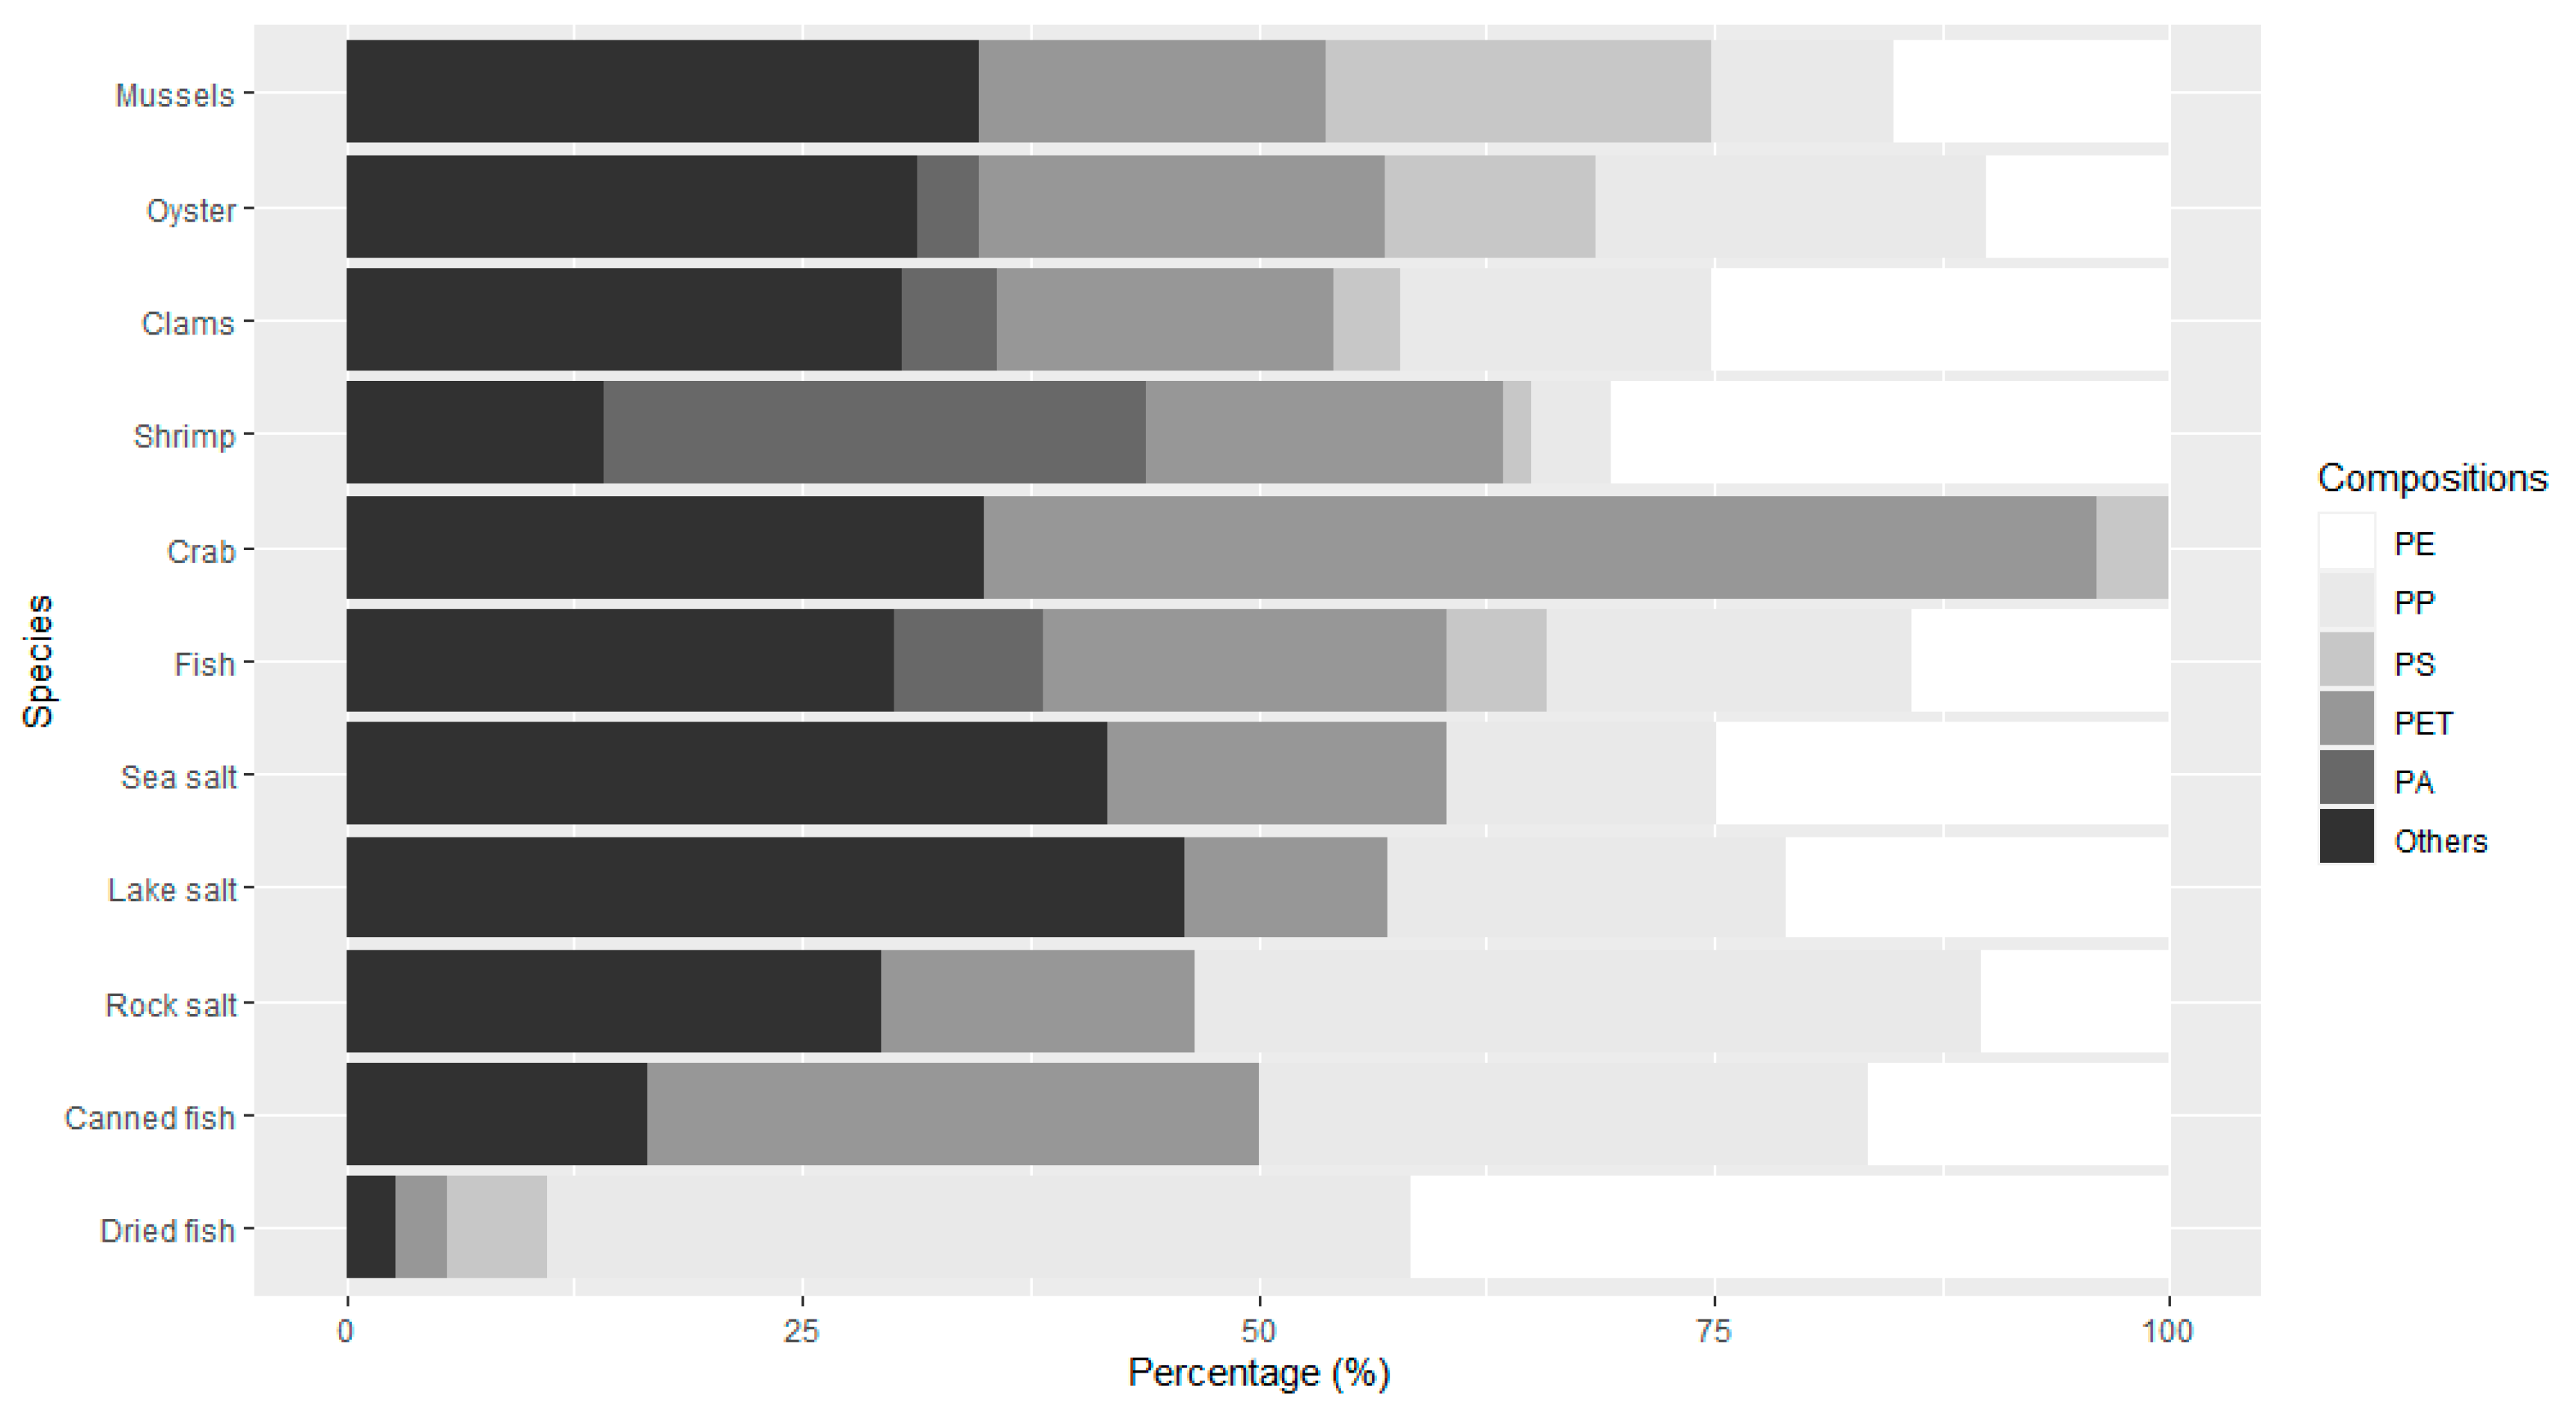
3.3.1. Plastic Materials in Food
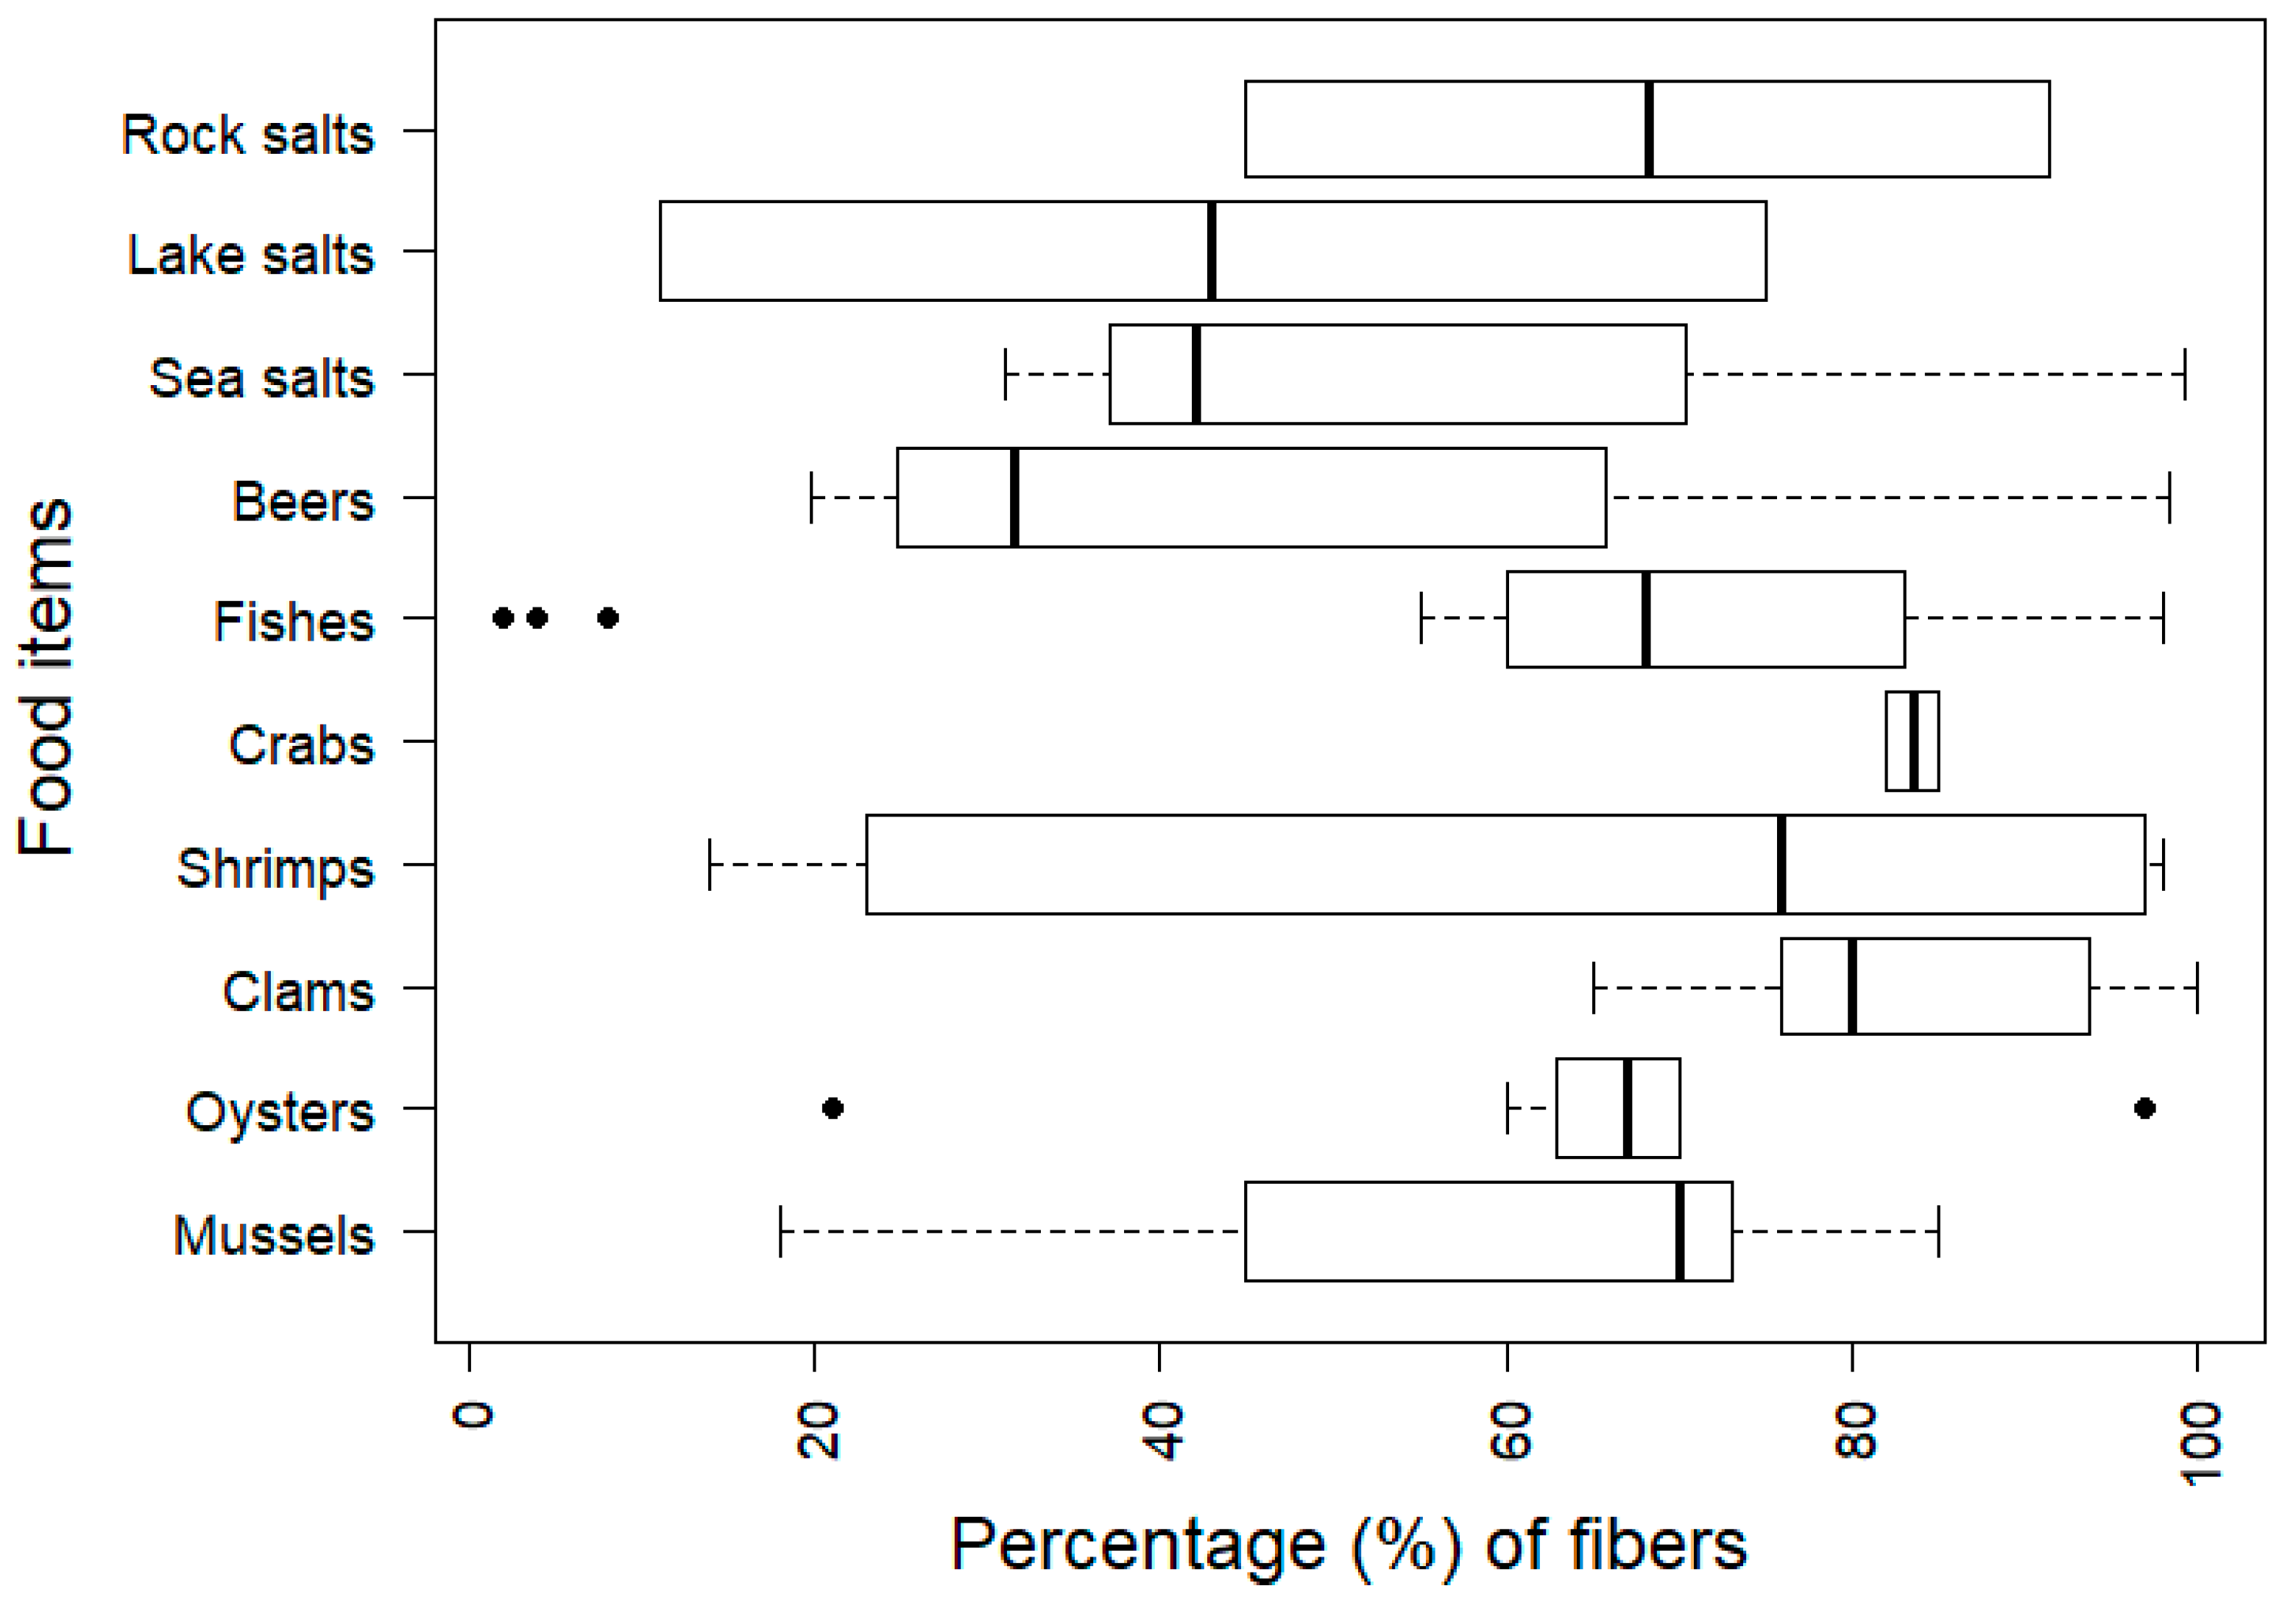
3.3.2. Microplastic Shape and Size
4. Discussion
4.1. Analytical Challenges
4.2. Estimation of Human Microplastic Exposure via Food Consumption
5. Conclusions
Author Contributions
Funding
Conflicts of Interest
References
- Moore, C.J. Synthetic polymers in the marine environment: A rapidly increasing, long-term threat. Environ. Res. 2008, 108, 131–139. [Google Scholar] [CrossRef]
- Cózar, A.; Echevarria, F.; Gonzákez-Gordillo, J.I.; Irigoien, X.; Ubeda, B.; Hernández-León, S.; Palma, A.T.; Navarro, S.; Garcá-de-Lomas, J.; Ruiz, A.; et al. Plastic debris in the open ocean. Proc. Natl. Acad. Sci. USA 2014, 111, 10239–10244. [Google Scholar] [CrossRef] [PubMed]
- Eo, S.; Hong, S.H.; Song, Y.K.; Lee, J.; Lee, J.; Shim, W.J. Abundance, composition, and distribution of microplastics larger than 20 μm in sand beaches of South Korea. Environ. Pollut. 2018, 238, 894–902. [Google Scholar] [CrossRef] [PubMed]
- Ivar do Sul, J.A.; Costa, M.F. The present and future of microplastic pollution in the marine environment. Environ. Pollut. 2014, 185, 352–364. [Google Scholar] [CrossRef] [PubMed]
- Zhang, S.; Yang, X.; Gertsen, H.; Peters, P.; Salánki, T.; Geissen, V. A simple method for the extraction and identification of light density microplastics from soil. Sci. Total Environ. 2018, 616–617, 1056–1065. [Google Scholar] [CrossRef]
- Scheurer, M.; Bigalke, M. Microplastics in Swiss floodplain soils. Environ. Sci. Technol. 2018, 52, 3591–3598. [Google Scholar] [CrossRef]
- Leslie, H.A.; Brandsma, S.H.; van Velzen, M.J.M.; Vethaak, A.D. Microplastics en route: Field measurements in the Dutch River Delta and Amsterdam Canals, wastewater treatment plants, North Sea sediments and biota. Environ. Int. 2017, 101, 133–142. [Google Scholar] [CrossRef]
- Mani, T.; Hauk, A.; Walter, U.; Burkhardt-Holm, P. Microplastics profile along the Rhine River. Sci. Rep. 2015, 5, 17988. [Google Scholar] [CrossRef] [PubMed]
- Park, T.-J.; Lee, S.-H.; Lee, M.-S.; Lee, J.-K.; Lee, S.-H.; Zoh, K.-D. Occurrence of microplastics in the Han River and riverine fish in South Korea. Sci. Total Environ. 2020, 708, 134535. [Google Scholar] [CrossRef]
- Park, H.-J.; Oh, M.-J.; Kim, P.-G.; Kim, G.; Jeong, D.-H.; Ju, B.-K.; Lee, W.-S.; Chung, H.-M.; Kang, H.-J.; Kwon, J.-H. National reconnaissance survey of microplastics in municipal wastewater treatment plants in Korea. Environ. Sci. Technol. 2020, 54, 1503–1512. [Google Scholar] [CrossRef]
- Catarino, A.I.; Macchia, V.; Sanderson, W.G.; Thompson, R.C.; Henry, T.B. Low levels of microplastics (MP) in wild mussels indicate that MP ingestion by humans is minimal compared to exposure via household fibres fallout during a meal. Environ. Pollut. 2018, 237, 675–684. [Google Scholar] [CrossRef] [PubMed]
- Akoueson, F.; Sheldon, L.M.; Danopoulos, E.; Morris, S.; Hotten, J.; Chapman, E.; Li, J.; Rotchell, J.M. A preliminary analysis of microplastics in edible versus non-edible tissues from seafood samples. Environ. Pollut. 2020, 263, 114452. [Google Scholar] [CrossRef] [PubMed]
- Barboza, L.G.A.; Lopes, C.; Oliveira, P.; Bessa, F.; Otero, V.; Henriques, B.; Raimundo, J.; Caetano, M.; Vale, C.; Guilhermino, L. Microplastics in wild fish from North East Atlantic Ocean and its potential for causing neurotoxic effects, lipid oxidative damage, and human health risks associated with ingestion exposure. Sci. Total Environ. 2020, 717, 134625. [Google Scholar] [CrossRef]
- Kim, J.-S.; Lee, H.-J.; Kim, S.-K.; Kim, H.-J. Global pattern of microplastics (MPs) in commercial food-grade salts: Sea salt as an indicator of seawater MP pollution. Environ. Sci. Technol. 2018, 52, 12819–12828. [Google Scholar] [CrossRef]
- Yang, D.; Shi, H.; Li, L.; Li, J.; Jabeen, K.; Kolandhasamy, P. Microplastic pollution in table salts from China. Environ. Sci. Technol. 2015, 49, 13622–13627. [Google Scholar] [CrossRef] [PubMed]
- Fadare, O.O.; Wan, B.; Guo, L.-H.; Zhao, L. Microplastics from consumer plastic food containers: Are we consuming it? Chemosphere 2020, 253, 126787. [Google Scholar] [CrossRef]
- Hernandez, L.M.; Xu, E.G.; Larsson, H.C.E.; Tahara, R.; Maisuria, V.B.; Tufenkji, N. Plastic teabags release billions of microparticles and nanoparticles into tea. Environ. Sci. Technol. 2019, 53, 12300–12310. [Google Scholar] [CrossRef]
- Bouwmeester, H.; Hollman, P.C.H.; Peters, R.J.B. Potential health impact of environmentally released micro-and nanoplastics in the human food production chain: Experiences from nanotoxicology. Environ. Sci. Technol. 2015, 49, 8932–8947. [Google Scholar] [CrossRef]
- Catarino, A.I.; Thompson, R.; Sanderson, W.; Henry, T.B. Development and optimization of a standard method for extraction of microplastics in mussels by enzyme digestion of soft tissues. Environ. Toxicol. Chem. 2017, 36, 947–951. [Google Scholar] [CrossRef]
- De Witte, B.; Devriese, L.; Bekaert, K.; Hoffman, S.; Vandermeersch, G.; Cooreman, K.; Robbens, J. Quality assessment of the blue mussel (Mytilus edulis): Comparison between commercial and wild types. Mar. Pollut. Bull. 2014, 85, 146–155. [Google Scholar] [CrossRef]
- Hermabessiere, L.; Paul-Pont, I.; Cassone, A.-L.; Himber, C.; Receveur, J.; Jezequel, R.; El Rakwe, M.; Rinnert, E.; Rivière, G.; Lambert, C.; et al. Microplastic contamination and pollutant levels in mussels and cockles collected along the channel coasts. Environ. Pollut. 2019, 250, 807–819. [Google Scholar] [CrossRef] [PubMed]
- Abbasi, S.; Soltani, N.; Keshavarzi, B.; Moore, F.; Turner, A.; Hassanaghaei, M. Microplastics in different tissues of fish and prawn from the Musa Estuary, Persian Gulf. Chemosphere 2018, 205, 80–87. [Google Scholar] [CrossRef] [PubMed]
- Akhbarizadeh, R.; Moore, F.; Keshavarzi, B. Investigating a probable relationship between microplastics and potentially toxic elements in fish muscles from northeast of Persian Gulf. Environ. Pollut. 2018, 232, 154–163. [Google Scholar] [CrossRef] [PubMed]
- Karami, A.; Golieskardi, A.; Choo, C.K.; Romano, N.; Ho, Y.B.; Salamatinia, B. A high-performance protocol for extraction of microplastics in fish. Sci. Total. Environ. 2017, 578, 485–494. [Google Scholar] [CrossRef]
- Neves, D.; Sobral, P.; Ferreira, J.L.; Pereira, T. Ingestion of microplastics by commercial fish off the Portuguese coast. Mar. Pollut. Bull. 2015, 101, 119–126. [Google Scholar] [CrossRef] [PubMed]
- Li, Q.; Feng, Z.; Zhang, T.; Ma, C.; Shi, H. Microplastics in the commercial seaweed nori. J. Hazard. Mater. 2020, 388, 122060. [Google Scholar] [CrossRef]
- Karami, A.; Golieskardi, A.; Choo, C.K.; Larat, V.; Karbalaei, S.; Salamatinia, B. Microplastic and mesoplastic contamination in canned sardines and sprats. Sci. Total Environ. 2018, 612, 1380–1386. [Google Scholar] [CrossRef]
- Andrady, A.L. Microplastics in the marine environment. Mar. Pollut. Bull. 2011, 62, 1596–1605. [Google Scholar] [CrossRef]
- Seth, C.K.; Shriwastav, A. Contamination of Indian sea salts with microplastics and a potential prevention strategy. Environ. Sci. Pollut. Res. 2018, 25, 30122–30131. [Google Scholar] [CrossRef]
- Gündoğdu, S. Contamination of table salts from Turkey with microplastics. Food Addit. Contam. A 2018, 32, 1006–1014. [Google Scholar] [CrossRef]
- Karami, A.; Golieskardi, A.; Choo, C.K.; Larat, V.; Galloway, T.S.; Salamatinia, B. The presence of microplastics in commercial salts from different countries. Sci. Rep. 2017, 7, 46173. [Google Scholar] [CrossRef] [PubMed]
- Kosuth, M.; Mason, S.A.; Wattenberg, E.V. Anthropogenic contamination of tap water, beer, and sea salt. PLoS ONE 2018, 13, e0194970. [Google Scholar] [CrossRef] [PubMed]
- Iñiguez, M.E.; Conesa, J.A.; Fullana, A. Microplastics in Spanish table salt. Sci. Rep. 2017, 7, 8620. [Google Scholar] [CrossRef] [PubMed]
- Renzi, M.; Blašković, A. Litter & microplastics features in table salts from marine origin: Italian versus Croatian brands. Mar. Pollut. Bull. 2018, 135, 62–68. [Google Scholar]
- Renzi, M.; Grazioli, E.; Bertacchini, E.; Blašković, A. Microparticles in table salts: Levels and chemical composition of the smallest dimensional fraction. J. Mar. Sci. Eng. 2019, 7, 310. [Google Scholar] [CrossRef]
- Lee, H.; Kunz, A.; Shim, W.J.; Walther, B.A. Microplastic contamination of table salts from Taiwan, including a global review. Sci. Rep. 2019, 9, 10145. [Google Scholar] [CrossRef]
- Löder, M.G.J.; Gerdts, G. Methodology used for the detection and identification of microplastics—A critical appraisal. In Marine Anthropogenic Litter; Bergmann, M., Gutow, L., Klages, M., Eds.; Springer: Cham, Switzerland, 2015; pp. 201–227. [Google Scholar]
- Rochman, C.M.; Tahir, A.; Williams, S.L.; Baxa, D.V.; Lam, R.; Miller, J.T.; Teh, F.-C.; Werorilangi, S.; Teh, S.J. Anthropogenic debris in seafood: Plastic debris and fibers from textiles in fish and bivalves sold for human consumption. Sci. Rep. 2015, 5, 14340. [Google Scholar] [CrossRef]
- Cheung, L.T.O.; Lui, C.Y.; Fok, L. Microplastic contamination of wild and captive flathead grey mullet (Mugil cephalus). Int. J. Environ. Res. Pub. Health 2018, 15, 597. [Google Scholar] [CrossRef]
- Jabeen, K.; Su, L.; Li, J.; Yang, D.; Tong, C.; Mu, J. Microplastics and mesoplastics in fish from coastal and fresh waters of China. Environ. Pollut. 2017, 221, 141–149. [Google Scholar] [CrossRef]
- Avio, C.G.; Pittura, L.; d’Errico, G.; Abel, S.; Amorello, S.; Marino, G.; Gorbi, S.; Regoli, F. Distribution and characterization of microplastic particles and textile microfibers in Adriatic food webs: General insights for biomonitoring strategies. Environ. Pollut. 2020, 258, 113766. [Google Scholar] [CrossRef]
- Biginagwa, F.J.; Mayoma, B.S.; Shashoua, Y.; Syberg, K.; Khan, F.R. First evidence of microplastics in the African Great Lakes: Recovery from Lake Victoria Nile perch and Nile tilapia. J. Gt. Lakes Res. 2016, 42, 146–149. [Google Scholar] [CrossRef]
- Azizah, N.; Saragih, G.S. Microplastics in digestive tracts of fishes from Jakarta Bay. IOP Conf. Ser. Earth Environ. Sci. 2019, 407, 012008. [Google Scholar] [CrossRef]
- Zhang, D.; Cui, Y.; Zhou, H.; Jin, C.; Yu, X.; Xu, Y.; Li, Y.; Zhang, C. Microplastic pollution in water, sediment, and fish from artificial reefs around the Ma’an Archipelago, Shengsi, China. Sci. Total Environ. 2020, 703, 134768. [Google Scholar] [CrossRef] [PubMed]
- Fang, C.; Zheng, R.; Chen, H.; Hong, F.; Lin, L.; Lin, H.; Guo, H.; Bailey, C.; Segner, H.; Mu, J.; et al. Comparison of microplastic contamination in fish and bivalves from two major cities in Fujian province, China and the implications for human health. Aquaculture 2019, 512, 734322. [Google Scholar] [CrossRef]
- Pozo, K.; Gomez, V.; Torres, M.; Vera, L.; Nuñez, D.; Oyarzún, P.; Mendoza, G.; Clarke, B.; Fossi, M.C.; Baini, M.; et al. Presence and characterization of microplastics in fish of commercial importance from the Biobío region in central Chile. Mar. Pollut. Bull. 2019, 140, 315–319. [Google Scholar] [CrossRef] [PubMed]
- Tanaka, K.; Takada, H. Microplastic fragments and microbeads in digestive tracts of planktivorous fish from urban coastal waters. Sci. Rep. 2016, 6, 34351. [Google Scholar] [CrossRef] [PubMed]
- Kazour, M.; Jemaa, S.; Issa, C.; Khalaf, G.; Amara, R. Microplastics pollution along the Lebanese coast (Eastern Mediterranean Basin): Occurrence in surface water, sediments and biota samples. Sci. Total Environ. 2019, 696, 133933. [Google Scholar] [CrossRef] [PubMed]
- Silva-Cacalcanti, J.S.; Silva, J.D.B.; de França, E.J.; de Araújo, M.C.B.; Gusmão, F. Microplastics ingestion by a common tropical freshwater fishing resource. Environ. Pollut. 2017, 221, 218–226. [Google Scholar] [CrossRef] [PubMed]
- Lusher, A.L.; McHugh, M.; Thompson, R.C. Occurrence of microplastics in the gastrointestinal tract of pelagic and demersal fish from the English Channel. Mar. Pollut. Bull. 2013, 67, 94–99. [Google Scholar] [CrossRef] [PubMed]
- Rummel, C.D.; Löder, M.G.J.; Fricke, N.F.; Lang, T.; Griebeler, E.-M.; Janke, M.; Gerdts, G. Plastic ingestion by pelagic and demersal fish from the North Sea and Baltic Sea. Mar. Pollut. Bull. 2016, 102, 134–141. [Google Scholar] [CrossRef] [PubMed]
- Avio, C.G.; Cardelli, L.R.; Gorbi, S.; Pellegrini, D.; Regoli, F. Microplastics pollution after the removal of the Costa Concordia wreck: First evidences from a biomonitoring case study. Environ. Pollut. 2017, 227, 207–214. [Google Scholar] [CrossRef] [PubMed]
- Bucol, L.A.; Romano, E.F.; Cabcaban, S.M.; Siplon, L.M.D.; Madrid, G.C.; Bucol, A.A.; Polidoro, B. Microplastics in marine sediments and rabbitfish (Siganus fuscescens) from selected coastal areas of Negros Oriental, Philippines. Mar. Pollut. Bull. 2020, 150, 110685. [Google Scholar] [CrossRef] [PubMed]
- Chagnon, C.; Thiel, M.; Antunes, J.; Ferreira, J.L.; Sobral, P.; Ory, N.C. Plastic ingestion and trophic transfer between Easter Island flying fish (Cheilopogon rapanouiensis) and yellowfin tuna (Thunnus albacares) from Rapa Nui (Easter Island). Environ. Pollut. 2018, 243, 127–133. [Google Scholar] [CrossRef] [PubMed]
- De Vries, A.N.; Govoni, D.; Árnason, S.H.; Carlsson, P. Microplastic ingestion by fish: Body size, condition factor and gut fullness are not related to the amount of plastics consumed. Mar. Pollut. Bull. 2020, 151, 110827. [Google Scholar] [CrossRef]
- Foekema, E.M.; De Gruijter, C.; Mergia, M.T.; van Franeker, J.A.; Murk, A.T.J.; Koelmans, A.A. Plastic in North Sea fish. Environ. Sci. Technol. 2013, 47, 8818–8824. [Google Scholar] [CrossRef]
- Güven, O.; Gökdağ, K.; Jovanović, B.; Kideyş, A.E. Microplastic litter composition of the Turkish territorial waters of the Mediterranean Sea, and its occurrence in the gastrointestinal tract of fish. Environ. Pollut. 2017, 223, 286–294. [Google Scholar] [CrossRef]
- Hermsen, E.; Pompe, R.; Besseling, E.; Koelmans, A.A. Detection of low numbers of microplastics in North Sea fish using strict quality assurance criteria. Mar. Pollut. Bull. 2017, 122, 253–258. [Google Scholar] [CrossRef]
- Karlsson, T.M.; Vethaak, A.D.; Almroth, B.C.; Ariese, F.; van Velzen, M.; Hassellöv, M.; Leslie, H.A. Screening for microplastics in sediment, water, marine invertebrates and fish: Method development and microplastic accumulation. Mar. Pollut. Bull. 2017, 122, 403–408. [Google Scholar] [CrossRef]
- Liboiron, M.; Liboiron, F.; Wells, E.; Richárd, N.; Zahara, A.; Mather, C.; Bradshaw, H.; Murichi, J. Low plastic ingestion rate in Atlantic cod (Gadus morhua) from Newfoundland destined for human consumption collected through citizen science methods. Mar. Pollut. Bull. 2016, 113, 428–437. [Google Scholar] [CrossRef]
- Markic, A.; Niemand, C.; Bridson, J.H.; Mazouni-Gaertner, N.; Gaertner, J.C.; Eriksen, M.; Bowen, M. Double trouble in the South Pacific subtropical gyre: Increased plastic ingestion by fish in the oceanic accumulation zone. Mar. Pollut. Bull. 2018, 136, 547–564. [Google Scholar] [CrossRef]
- Mancia, A.; Chenet, T.; Bono, G.; Geraci, M.L.; Vaccaro, C.; Munari, C.; Mistri, M.; Cavazzini, A.; Pasti, L. Adverse effects of plastic ingestion on the Mediterranean small-spotted catshark (Scyliorhinus canicula). Mar. Environ. Res. 2020, 155, 104876. [Google Scholar] [CrossRef]
- Ogonowski, M.; Wenman, V.; Danielsson, S.; Gorokhova, E. Ingested microplastic is not correlated to HOC concentrations in Baltic Sea herring. In Proceedings of the 15th International Conference on Environmental Science and Technology, Rhodes, Greece, 31 August–2 September 2017. [Google Scholar]
- Koongolla, J.B.; Lin, L.; Pan, Y.-F.; Yang, C.-P.; Sun, D.-R.; Liu, S.; Xu, X.-R.; Maharana, D.; Huang, J.-S.; Li, H.-X. Occurrence of microplastics in gastrointestinal tracts and gills of fish from Beibu Gulg, South China Sea. Environ. Pollut. 2020, 258, 113734. [Google Scholar] [CrossRef] [PubMed]
- Priscilla, V.; Patria, M.P. Comparison of microplastic abundance in aquaculture ponds of milkfish Chanos (Forsskål, 1775) at Muara Kamal and Marunda, Jakarta Bay. IOP Conf. Ser. Earth Environ. Sci. 2020, 404, 012027. [Google Scholar] [CrossRef]
- Boerger, C.M.; Lattin, G.L.; Moore, S.L.; Moore, C.J. Plastic ingestion by planktivorous fishes in the North Pacific Central Gyre. Mar. Pollut. Bull. 2010, 60, 2275–2278. [Google Scholar] [CrossRef] [PubMed]
- Choy, C.A.; Drazen, J.C. Plastic for dinner? Observations of frequent debris ingestion by pelagic predatory fishes from the central North Pacific. Mar. Ecol. Prog. Ser. 2013, 485, 155–163. [Google Scholar] [CrossRef]
- Bellas, J.; Martínez-Armental, J.; Martínez-Cámara, A.; Besada, V.; Martínez-Gómez, C. Ingestion of microplastics by demersal fish from the Spanish Atlantic and Mediterranean coasts. Mar. Pollut. Bull. 2016, 109, 55–60. [Google Scholar] [CrossRef]
- Su, L.; Deng, H.; Li, B.; Chen, Q.; Pettigrove, V.; Chenxi, W.; Shi, H. The occurrence of microplastic in specific organs in commercially caught fishes from coast and estuary area of east China. J. Hazard. Mater. 2019, 365, 716–724. [Google Scholar] [CrossRef]
- Huang, J.-S.; Koongolla, J.B.; Li, H.-X.; Lin, L.; Pan, Y.-F.; Liu, S.; He, W.-H.; Maharana, D.; Xu, X.-R. Microplastic accumulation in fish from Zhanjiang mangrove wetland, South China. Sci. Total Environ. 2020, 208, 134839. [Google Scholar] [CrossRef]
- Feng, Z.; Zhang, T.; Li, Y.; He, X.; Wang, R.; Xu, J.; Gao, G. The accumulation of microplastics in fish from an important fish farm and mariculture area, Haizhou Bay, China. Sci. Total Environ. 2019, 696, 133948. [Google Scholar] [CrossRef]
- Hurt, R.; O’Reilly, C.M.; Perry, W.L. Microplastic prevalence in two fish species in two U.S. reservoirs. Limnol. Oceanogr. Lett. 2020, 5, 147–153. [Google Scholar] [CrossRef]
- Fareza, A.A.; Sembiring, E. Occurrence of microplastics in water, sediment and milkfish (Chanos chanos) in Citarum River downstream (Case study: Muara Gembong). E3S Web Conf. 2020, 148, 07005. [Google Scholar] [CrossRef]
- Wu, F.; Wang, Y.; Leung, J.Y.S.; Huang, W.; Zeng, J.; Tang, Y.; Chen, J.; Shi, A.; Yu, X.; Xu, X.; et al. Accumulation of microplastics in typical commercial aquatic species: A case study at a productive aquaculture site in China. Sci. Total Environ. 2020, 708, 135432. [Google Scholar] [CrossRef] [PubMed]
- Zhu, J.; Zhang, Q.; Li, Y.; Tan, S.; Kang, Z.; Yu, X.; Lan, W.; Cai, L.; Wang, J.; Shi, H. Microplastic pollution in the Maowei Sea, a typical mariculture bay of China. Sci. Total Environ. 2019, 658, 62–68. [Google Scholar] [CrossRef]
- Li, Q.; Sun, C.; Wang, Y.; Cai, H.; Li, L.; Li, J.; Shi, H. Fusion of microplastics into the mussel byssus. Environ. Pollut. 2019, 252, 420–426. [Google Scholar] [CrossRef] [PubMed]
- Li, J.; Green, C.; Reynolds, A.; Shi, H.; Rotchell, J.M. Microplastics in mussels sampled from coastal waters and supermarkets in the United Kingdom. Environ. Pollut. 2018, 241, 35–44. [Google Scholar] [CrossRef]
- Cho, Y.; Shim, W.J.; Jang, M.; Han, G.M.; Hong, S.H. Abundance and characteristics of microplastics in market bivalves from South Korea. Environ. Pollut. 2019, 245, 1107–1116. [Google Scholar] [CrossRef]
- Li, J.; Yang, D.; Li, L.; Jabeen, K.; Shi, H. Microplastics in commercial bivalves from China. Environ. Pollut. 2015, 207, 190–195. [Google Scholar] [CrossRef]
- Li, J.; Qu, X.; Su, L.; Zhang, W.; Yang, D.; Kolandhasamy, P.; Li, D.; Shi, H. Microplastics in mussels along the coastal waters of China. Environ. Pollut. 2016, 214, 177–184. [Google Scholar] [CrossRef]
- Phuong, N.N.; Poirier, L.; Pham, Q.T.; Lagarde, F.; Zalouk-Vergnoux, A. Factors influencing the microplastic contamination of bivalves from the French Atlantic coast: Location, season and/or mode of life? Mar. Pollut. Bull. 2018, 129, 664–674. [Google Scholar] [CrossRef]
- Mathalson, A.; Hill, P. Microplastic fibers in the intertidal ecosystem surrounding Halifax Harbor, Nova Scotia. Mar. Pollut. Bull. 2014, 81, 69–79. [Google Scholar] [CrossRef]
- Van Cauwenberghe, L.; Janssen, C.R. Microplastics in bivalves cultured for human consumption. Environ. Pollut. 2014, 193, 65–70. [Google Scholar] [CrossRef] [PubMed]
- Martinelli, J.C.; Phan, S.; Luscombe, C.K.; Padilla-Gamiño, J.L. Low incidence of microplastic contaminants in Pacific oysters (Crassostrea gigas Thunberg) from the Salish Sea, USA. Sci. Total Environ. 2020, 715, 136826. [Google Scholar] [CrossRef] [PubMed]
- Waite, H.R.; Donnelly, M.J.; Walters, L.J. Quantity and types of microplastics in the organic tissues of the eastern oyster Crassostrea virginica and Atlantic mud crab Panopeus herbstii from a Florida estuary. Mar. Pollut. Bull. 2018, 129, 179–185. [Google Scholar] [CrossRef] [PubMed]
- Jahan, S.; Strezov, V.; Weldekidan, H.; Kumar, R.; Kan, T.; Sarkodie, S.A.; He, J.; Dastjerdi, B.; Wilson, S.P. Interrelationship of microplastic pollution in sediments and oysters in a seaport environment of the eastern coast of Australia. Sci. Total Environ. 2019, 695, 133924. [Google Scholar] [CrossRef] [PubMed]
- Naji, A.; Nuri, M.; Vethaak, A.D. Microplastics contamination in molluscs from the northern part of the Persian Gulf. Environ. Pollut. 2018, 235, 113–120. [Google Scholar] [CrossRef] [PubMed]
- Davidson, K.; Dudas, S.E. Microplastic ingestion by wild and cultured Manila clams (Venerupis philippinarum) from Baynes Sound, British Columbia. Arch. Environ. Contam. Toxicol. 2016, 71, 147–156. [Google Scholar] [CrossRef]
- Su, L.; Cai, H.; Kolandhasamy, P.; Wu, C.; Rochman, C.M.; Shi, H. Using the Asian clam as an indicator of microplastic pollution in freshwater ecosystems. Environ. Pollut. 2018, 234, 347–355. [Google Scholar] [CrossRef]
- Su, L.; Xue, Y.; Li, L.; Yang, D.; Kolandhasamy, P.; Li, D.; Shi, H. Microplastics in Taihu Lake, China. Environ. Pollut. 2016, 216, 711–719. [Google Scholar] [CrossRef]
- Xu, X.; Wong, C.Y.; Tam, N.F.Y.; Lo, H.-S.; Cheung, S.-G. Microplastics in invertebrates on soft shores in Hong Kong: Influence of habitat, taxa and feeding mode. Sci. Total Environ. 2020, 715, 136999. [Google Scholar] [CrossRef]
- Jones, K.L.; Hartl, M.G.J.; Bell, M.C.; Capper, A. Microplastic accumulation in a Zostera marina L. bed at Deerness Sound, Orkney, Scotland. Mar. Pollut. Bull. 2020, 152, 110883. [Google Scholar] [CrossRef]
- Doyle, D.; Gammell, M.; Frias, J.; Griffin, G.; Nash, R. Low levels of microplastics recorded from the common periwinkle, Littorina littorea on the west coast of Ireland. Mar. Pollut. Bull. 2019, 149, 110645. [Google Scholar] [CrossRef]
- Devriese, L.I.; van der Meulen, M.D.; Maes, T.; Bekaert, K.; Paul-Pont, I.; Frère, L.; Vethaak, A.D. Microplastic contamination in brown shrimp (Crangon, Linnaeus 1758) from coastal waters of the Southern North Sea and Channel area. Mar. Pollut. Bull. 2015, 98, 179–187. [Google Scholar] [CrossRef]
- Nan, B.; Su, L.; Kellar, C.; Craig, N.J.; Keough, M.J.; Pettigrove, V. Identification of microplastics in surface water and Australian freshwater shrimp Paratya australiensis in Victoria, Australia. Environ. Pollut. 2020, 259, 113865. [Google Scholar] [CrossRef] [PubMed]
- Hossain, M.S.; Rahman, M.S.; Uddin, M.N.; Sharifuzzaman, S.M.; Chowdhury, S.R.; Sarker, S.; Chowdhury, M.S.N. Microplastic contamination in Penaeid shrimp from the Northern Bay of Bengal. Chemosphere 2020, 238, 124688. [Google Scholar] [CrossRef] [PubMed]
- Hara, J.; Frias, J.; Nash, R. Quantification of microplastic ingestion by the decapod crustacean Nephrops norvegicus from Irish waters. Mar. Pollut. Bull. 2020, 152, 110905. [Google Scholar] [CrossRef]
- Cau, A.; Avio, C.G.; Dessì, C.; Follesa, M.C.; Moccia, D.; Regoli, F.; Pusceddu, A. Microplastics in the crustaceans Nephrops norvegicus and Aristeus antennatus: Flagship species for deep-sea environments? Environ. Pollut. 2019, 255, 113107. [Google Scholar] [CrossRef]
- Waddell, E.N.; Lascelles, N.; Conkle, J.L. Microplastic contamination in Corpus Christi Bay blue crabs, Callinectes sapidus. Limn. Oceanogr. Lett. 2020, 5, 92–102. [Google Scholar] [CrossRef]
- Munno, K.; Helm, P.A.; Jackson, D.A.; Rochman, C.; Sims, A. Impacts of temperature and selected chemical digestion methods on microplastic particles. Environ. Toxicol. Chem. 2018, 37, 91–98. [Google Scholar] [CrossRef]
- Farrington, J.W.; Goldberg, E.D.; Risebrough, R.W.; Martin, J.H.; Bowen, V.T. U.S. “Mussel Watch” 1976–1978: An overview of the trace-metal, DDE, PCB, hydrocarbon and artificial radionuclide data. Environ. Sci. Technol. 1983, 17, 490–496. [Google Scholar] [CrossRef]
- Monirith, I.; Ueno, D.; Takahashi, S.; Nakada, H.; Sudaryanto, A.; Subramanian, A.; Karuppiah, S.; Ismail, A.; Muchtar, M.; Zheng, J.; et al. Asia-Pacific mussel watch: Monitoring contamination of persistent organochlorine compounds in coastal waters of Asian countries. Mar. Pollut. Bull. 2003, 46, 281–300. [Google Scholar] [CrossRef]
- Birnstiel, S.; Soares-Gomes, A.; da Gama, B.A.P. Depuration reduces microplastic content in wild and farmed mussels. Mar. Pollut. Bull. 2019, 140, 241–247. [Google Scholar] [CrossRef] [PubMed]
- Liebezeit, G.; Liebezeit, E. Synthetic particles as contaminants in German beers. Food Addit. Contam. A 2014, 31, 1574–1578. [Google Scholar] [CrossRef] [PubMed]
- Liebezeit, G.; Liebezeit, E. Non-pollen particulates in honey and sugar. Food Addit. Contam. A 2013, 30, 2136–2140. [Google Scholar] [CrossRef] [PubMed]
- Liebezeit, G.; Liebezeit, E. Origin of synthetic particles in honeys. Pol. J. Food Nutr. Sci. 2015, 65, 143–147. [Google Scholar] [CrossRef]
- Mühlschlegel, P.; Hauk, A.; Walter, U.; Sieber, R. Lack of evidence for microplastic contamination in honey. Food Addit. Contam. A 2017, 34, 1982–1989. [Google Scholar] [CrossRef]
- Kutralam-Muniasamy, G.; Pérez-Guevara, F.; Elizalde-Martínez, I.; Shruti, V.C. Branded milks—Are they immune from microplastics contamination? Sci. Total Environ. 2020, 714, 136823. [Google Scholar] [CrossRef]
- Lu, S.; Qiu, R.; Hu, J.; Li, X.; Chen, Y.; Zhang, X.; Cao, C.; Shi, H.; Xie, B.; Wu, W.-M.; et al. Prevalence of microplastics in animal-based traditional medicinal materials: Widespread pollution in terrestrial environments. Sci. Total Environ. 2020, 709, 136214. [Google Scholar] [CrossRef]
- Fernández-Severini, M.D.; Villagran, D.M.; Buzzi, N.S.; Sartor, G.C. Microplastics in oysters (Crassostrea gigas) and water at the Bahía Blanca Estuary (Southwestern Atlantic): An emerging issue of global concern. Reg. Stud. Mar. Sci. 2019, 32, 100829. [Google Scholar] [CrossRef]
- Sujathan, S.; Kniggendorf, A.K.; Kumar, A.; Roth, B.; Rosenwinkel, K.H.; Nogueira, R. Heat and bleach: A cost-efficient method for extracting microplastics from return activated sludge. Arch. Environ. Contam. Toxicol. 2017, 73, 641–648. [Google Scholar] [CrossRef]
- Tagg, A.S.; Harrison, J.P.; Ju-Nam, Y.; Sapp, M.; Bradley, E.L.; Sinclair, C.J.; Ojeda, J.J. Fenton’s reagent for the rapid and efficient isolation of microplastics from wastewater. Chem. Comm. 2017, 53, 372–375. [Google Scholar] [CrossRef]
- Kühn, S.; van Franeker, J.A.; Donoghue, A.M.O.; Swiers, A.; Starkenburg, M.; van Werven, B.; Lindeboom, H. Details of plastic ingestion and fibre contamination in North Sea. Environ. Pollut. 2020, 257, 113569. [Google Scholar] [CrossRef] [PubMed]
- Cole, M.; Webb, H.; Lindeque, P.K.; Fileman, E.S.; Halsband, C.; Galloway, T.S. Isolation of microplastics in biota-rich seawater samples and marine organisms. Sci. Rep. 2014, 4, 1–8. [Google Scholar] [CrossRef] [PubMed]
- Dehaut, A.; Cassone, A.L.; Frère, L.; Hermabessiere, L.; Himber, C.; Rinnert, E.; Paul-Pont, I. Microplastics in seafood: Benchmark protocol for their extraction and characterization. Environ. Pollut. 2016, 215, 223–233. [Google Scholar] [CrossRef] [PubMed]
- Van Cauwenberghe, L.; Claessens, M.; Vandegehuchte, M.B.; Janssen, C.R. Microplastics are taken up by mussels (Mytilus edulis) and lugworms (Arenicola marina) living in natural habitats. Environ. Pollut. 2015, 199, 10–17. [Google Scholar] [CrossRef]
- Rist, S.; Steensgaard, I.M.; Guven, O.; Nielsen, T.G.; Jensen, L.H.; Møller, L.F.; Hartmann, N.B. The fate of microplastics during uptake and depuration phases in a blue mussel exposure system. Environ. Toxicol. Chem. 2019, 38, 99–105. [Google Scholar] [CrossRef]
- Dawson, A.L.; Kawaguchi, S.; King, C.K.; Townsend, K.A.; King, R.; Huston, W.M.; Bengtson Nash, S.M. Turning microplastics into nanoplastics through digestive fragmentation by Antarctic krill. Nat. Commun. 2018, 9, 1–8. [Google Scholar] [CrossRef]
- Courtene-Jones, W.; Quinn, B.; Murphy, F.; Gary, S.F.; Narayanaswamy, B.E. Optimisation of enzymatic digestion and validation of specimen preservation methods for the analysis of ingested microplastics. Anal. Methods 2017, 9, 1437–1445. [Google Scholar] [CrossRef]
- Mintenig, S.M.; Int-Veen, I.; Löder, M.G.J.; Primpke, S.; Gerdts, G. Identification of microplastic in effluents of waste water treatment plants using focal plane array-based micro-Fourier-transform infrared imaging. Water Res. 2017, 108, 365–372. [Google Scholar] [CrossRef]
- Löder, M.G.J.; Imhof, H.K.; Ladehoff, M.; Löschel, L.A.; Lorenz, C.; Mintenig, S.; Piehl, S.; Primpke, S.; Schrank, I.; Laforsch, C.; et al. Enzymatic porification of microplastics in environmental samples. Environ. Sci. Technol. 2017, 51, 14283–14292. [Google Scholar] [CrossRef]
- Nuelle, M.-T.; Dekiff, J.H.; Remy, D.; Fries, E. A new analytical approach for monitoring microplastics in marine sediments. Environ. Pollut. 2014, 184, 161–169. [Google Scholar] [CrossRef]
- Fries, E.; Dekiff, J.H.; Willmeyer, J.; Nuelle, M.-T.; Ebert, M.; Remy, D. Identification of polymer types and additives in marine microplastic particles using pyrolysis-GC/MS and scanning electron microscopy. Environ. Sci. Process. Impacts 2013, 15, 1949–1956. [Google Scholar] [CrossRef]
- Fischer, M.; Scholz-Böttcher, B.M. Simultaneous trace identification and quantification of common types of microplastics in environmental samples by pyrolysis-gas chromatography-mass spectrometry. Environ. Sci. Technol. 2017, 51, 5052–5060. [Google Scholar] [CrossRef] [PubMed]
- Hermabessiere, L.; Himber, C.; Boricaud, B.; Kazour, M.; Amara, R.; Cassone, A.-L.; Laurentie, M.; Paul-Pont, I.; Soudant, P.; Dehaut, A.; et al. Optimization, performance, and application of a pyrolysis-GC/MS method for the identification of microplastics. Anal. Bioanal. Chem. 2018, 410, 6663–6676. [Google Scholar] [CrossRef] [PubMed]
- Kang, H.-J.; Park, H.-J.; Kwon, O.-K.; Lee, W.-S.; Jeong, D.-H.; Ju, B.-K.; Kwon, J.-H. Occurrence of microplastics in municipal sewage treatment plants: A review. Environ. Health Toxicol. 2018, 33, e2018013. [Google Scholar] [CrossRef] [PubMed]
- Qiao, R.; Deng, Y.; Zhang, S.; Wolosker, M.B.; Zhu, Q.; Ren, H.; Zhang, Y. Accumulation of different shapes of microplastics initiates intestinal injury and gut microbiota dysbiosis in the gut of zebrafish. Chemosphere 2019, 236, 124334. [Google Scholar] [CrossRef] [PubMed]
- Ziajahromi, S.; Kumar, A.; Neale, P.A.; Leusch, F.D.L. Impact of microplastic beads and fibers on waterflea (Ceriodaphnia dubia) survival, growth, and reproduction: Implications of single and mixture exposures. Environ. Sci. Technol. 2017, 51, 13397–13406. [Google Scholar] [CrossRef]
- Au, S.Y.; Bruce, T.F.; Bridges, W.C.; Klaine, S.J. Responses of Hyalella azteca to acute and chronic microplastic exposures. Environ. Toxicol. Chem. 2015, 34, 2564–2572. [Google Scholar] [CrossRef]
- Thiele, C.J.; Hudson, M.D.; Russell, A.E. Evaluation of existing methods to extract microplastics from bivalve tissue: Adapted KOH digestion protocol improves filtration at single-digit pore size. Mar. Pollut. Bull. 2019, 142, 384–393. [Google Scholar] [CrossRef]
- Käppler, A.; Fischer, D.; Oberbeckmann, S.; Schernewski, G.; Labrenz, M.; Eichhorn, K.-J.; Voit, B. Analysis of environmental microplastics by vibrational microspectroscopy: FTIR, Raman or both? Anal. Bioanl. Chem. 2016, 408, 8377–8391. [Google Scholar] [CrossRef]
- Renner, G.; Schmidt, T.C.; Schram, J. Automated rapid & intelligent microplastics mapping by FTIR microscopy: A Python-based workflow. MethodsX 2020, 7, 100742. [Google Scholar]
- Primpke, S.; Lorenz, C.; Rascher-Friesenhausen, R.; Gerdts, G. An automated approach for microplastics analysis using focal plane array (FPA) FTIR microscopy and image analysis. Anal. Methods 2017, 9, 1499–1511. [Google Scholar] [CrossRef]
- Kögel, T.; Bjorøy, Ø.; Toto, B.; Bienfait, A.M.; Sanden, M. Micro-and nanoplastic toxicity on aquatic life: Determining factors. Sci. Total Environ. 2020, 709, 136050. [Google Scholar] [CrossRef] [PubMed]
- Yong, C.Q.Y.; Valiyaveetill, S.; Tang, B.L. Toxicity of microplastics and nanoplastics in mammalian systems. Int. J. Environ. Res. Public Health 2020, 17, 1509. [Google Scholar] [CrossRef] [PubMed]
- Peeken, I.; Primpke, S.; Beyer, B.; Gütermann, J.; Katlein, C.; Krumpen, T.; Bergmann, M.; Hehemann, L.; Gerdts, G. Arctic Sea ice is an important temporal sink and means of transport for microplastic. Nat. Commun. 2018, 9, 1505. [Google Scholar] [CrossRef] [PubMed]
- Enders, K.; Lenz, R.; Stedmon, C.A.; Nielsen, T.G. Abundance, size and polymer composition of marine microplastics ≥10 μm in the Atlantic Ocean and their modelled vertical distribution. Mar. Pollut. Bull. 2015, 100, 70–81. [Google Scholar] [CrossRef] [PubMed]
- Pedrotti, M.L.; Petit, S.; Elineau, A.; Bruzaud, S.; Crebassa, J.C.; Dumontet, B.; Martí, E.; Gorsky, G.; Cózar, A. Changes in the floating plastic pollution of the Mediterranean Sea in relation to the distance to land. PLoS ONE 2016, 11, e0161581. [Google Scholar] [CrossRef] [PubMed]
- Magri, D.; Sánchez-Moreno, P.; Caputo, G.; Gatto, F.; Veronesi, M.; Bardi, G.; Catelani, T.; Guarnieri, D.; Athanassiou, A.; Pompa, P.P.; et al. Laser ablation as a versatile tool to mimic polyethylene terephthalate nanoplastic pollutants: Characterization and toxicology assessment. ACS Nano 2018, 12, 7690–7700. [Google Scholar] [CrossRef]
- Gasperi, J.; Wright, S.L.; Dris, R.; Collard, F.; Mandin, C.; Guerrouache, M.; Langlois, V.; Kelly, F.J.; Tassin, B. Microplastics in air: Are we breathing it in? Curr. Opinion Environ. Sci. Health 2018, 1, 1–5. [Google Scholar] [CrossRef]
- Vianello, A.; Jensen, R.L.; Liu, L.; Vollertsen, J. Simulating human exposure to indoor airborne microplastics using a Breathing Thermal Manikin. Sci. Rep. 2019, 9, 8670. [Google Scholar] [CrossRef] [PubMed]


| Salt Sample | Analytical Methods | Concentration (Particles kg−1) | References | ||
|---|---|---|---|---|---|
| Digestion/Density Separation | Filtration Pore Size (μm) | Identification | |||
| Sea salt from 16 countries | 17.25% H2O2 | 2.7 | Microscope/FT-IR | n.d. *–1674 | [14] |
| Sea salt from India | 30% H2O2 | 0.45 | Microscope/FT-IR | 56(±49)–103(±39) | [29] |
| Sea salt from China | 30% H2O2 | 5 | Microscope/FT-IR | 550–681 | [15] |
| Sea salt from Turkey | 30% H2O2/1.8 g cm−3 NaI | 0.2 | Microscope/Raman | 16–84 | [30] |
| Sea salt from 6 countries | 1.5 g cm−3 NaI | 149 | Microscope/Raman | n.d.–10 | [31] |
| Sea salt from 8 seas/oceans | Rose Bengal | 11 | Dissection microscope | 46.7–806 | [32] |
| Sea salt from Spain | distilled water/centrifuge | 5 | Microscope/FT-IR | 50–280 | [33] |
| Sea salt from Italy and Croatia | Deionized water | 0.45 | Microscope/FT-IR | n.d.–19800 | [34] |
| Sea salt from Italy and Croatia | Deionized water | 0.2 | Microscope/FT-IR | 70–320 | [35] |
| Sea salt from Taiwan | Filtered water | 5 | Microscope/FT-IR | 2.5–20 | [36] |
| Lake salt from China | 30% H2O2 | 5 | Microscope/FT-IR | 43–364 | [15] |
| Lake salt from China and Senegal | 17.25% H2O2 | 2.7 | Microscope/FT-IR | 28–462 | [14] |
| Lake salt from Turkey | 30% H2O2/1.8 g cm−3 NaI | 0.2 | Microscope/Raman | 8–102 | [30] |
| Lake salt from Iran | 1.5 g cm−3 NaI | 149 | Microscope/Raman | 1 | [31] |
| Rock salt from 8 countries | 17.25% H2O2 | 2.7 | Microscope/FT-IR | n.d.–148 | [14] |
| Rock salt from Turkey | 30% H2O2/1.8 g cm−3 NaI | 0.2 | Microscope/Raman | 9–16 | [30] |
| Rock salt from 2 countries | Rose Bengal | 11 | Dissection microscope | 113–367 | [32] |
| Rock salt from Taiwan | Filtered water | 5 | Microscope/FT-IR | 12.5 | [36] |
| Rock/well salt from China | 30% H2O2 | 5 | Microscope/FT-IR | 7–204 | [15] |
| Well salt from Spain | Distilled water/centrifuge | 5 | Microscope/FT-IR | 115–185 | [33] |
| Species | Analytical Methods | Concentration | References | ||
|---|---|---|---|---|---|
| Digestion/Density Separation | Filtration Pore Size (μm) | Identification | |||
| 13 species (US) (M) 1 | GIT 2; 10% KOH (v/v) | - | Microscope/SEM | n.d.–10/fish | [38] |
| 11 species (Indonesia) (M) | GIT; 10% KOH (v/v) | - | Microscope/SEM | n.d.–21/fish | [38] |
| Flathead grey mullet (M. cephalus) (M) | GIT; 30% H2O2 (v/v); NaCl 1.2 g mL−1 | 11 | Microscope/FT-IR | 4.3/fish | [39] |
| 11 species (M) | GIT; 30% H2O2 (v/v); NaCl 1.2 g mL−1 | 5 | Microscope/FT-IR | 0.2–17.2/g | [40] |
| 13 species (M) | GIT; 15% H2O2 (v/v); NaCl 1.2 g mL−1 | 0.45 | Microscope/FT-IR | 1.32 ± 0.48/fish | [41] |
| Nile perch and Nile tilapia (M) | GIT digested with NaOH | 250 | Microscope/FT-IR | - | [42] |
| 9 species (M) | GIT; HNO3:HClO4 (1:5) | - | Stereomicroscope | - | [43] |
| 9 species (M) | GIT; FeSO4 0.05M/30% H2O2; NaCl | 8 | Microscope/FT-IR | 5.0 ± 2.5/fish | [44] |
| 26 species (M) | Stomach content, washed with distilled water | - | Microscope/FT-IR | 0.27 ± 0.63/fish | [25] |
| 4 species (M) | Whole sample; 10% KOH | 2 | Microscope/SEM | 1.00 ± 0.96/g | [23] |
| A. latus; K. punctatus (M) | GIT; 10% KOH; NaCl 1.2 g mL−1 | - | Microscope/FT-IR | 0.49–1.26/g | [45] |
| 4 species (W) | GIT, proteinase-K | 0.7 | Microscope/FT-IR | - | [46] |
| Japanese anchovy (E. japonicus) (W) | GIT; 10% KOH | - | Microscope/FT-IR | 2.3 ± 2.5/fish | [47] |
| European anchovies (E. encrasicolus) (W) | GIT; 10% KOH (v/v) | GF/A | Microscope/FT-IR | 2.5 ± 0.3/fish | [48] |
| Catfish (H. littorale) (W) | GIT content, washed with distilled water | 63 | Dissection microscope | 1–24/fish | [49] |
| 10 species (W) | GIT, cut open and observed | - | Microscope/FT-IR | 1–15/fish | [50] |
| Demersal fish (3 species) (W) | Gut content, suspended in distilled water | 500 | Microscope/FT-IR | 0.03 ± 0.18/fish | [51] |
| Pelagic fish (2 species) (W) | Gut content, suspended in distilled water | 500 | Microscope/FT-IR | 0.19 ± 0.61/g | [51] |
| 4 species (W) | GIT; 15% H2O2(v/v) | - | Microscope/FT-IR | 3.2 ± 1.9/fish | [52] |
| Black rabbitfish (S. fuscescens) (W) | GIT; 10% KOH (v/v) | 8 | Microscope/FT-IR | 0.6/g | [53] |
| Easter Island flying fish (C. rapanouiensis) W) | GIT content, washed with distilled water | 100 | Microscope/FT-IR | 1.5 ± 0.7/fish | [54] |
| Yellowfin tuna (T. albacares) (W) | GIT content, washed with distilled water | 100 | Microscope/FT-IR | n.d.–5/g | [54] |
| Cod (W) | GIT; 10% KOH (v/v)/citric acid | 2.7 | Microscope/FT-IR | 0.23/fish | [55] |
| Saithe (W) | GIT; 10% KOH (v/v)/citric acid | 2.7 | Microscope/FT-IR | 0.28/fish | [55] |
| 5 species (W) | GIT; 10% KOH (v/v) | 200 | Microscope/FT-IR | 1–4/fish | [56] |
| 28 species (W) | GIT; 35% H2O2 | 26 | Microscope/FT-IR | 1–35/fish | [57] |
| 4 species (W) | GIT; 10% KOH (v/v) | 20 | Microscope/FT-IR | 0.005/fish | [58] |
| Brown trout (S. trutta) (W) | GIT, proteinase K | 1.2 | Stereomicroscope/Raman/hot needle test/FT-IR | 1.96/fish | [59] |
| Atlantic cod (G. morhua) (W) | GIT, washed with distilled water | 1000 | Dissecting microscope | n.d.–2/fish | [60] |
| 34 species | GIT; 15% H2O2 (v/v) | 63 | Microscope/FT-IR | 2.4 ± 0.2/fish | [61] |
| Small-spotted catshark (S. canicular) (W) | GIT; 10% KOH (v/v); NaCl | 8 | Microscope/Raman | 0.7/fish | [62] |
| Herring (C. harengus) (W) | GIT, washed with deionized particle-free water | - | Visual inspection | 1/g | [63] |
| Variety (W) | KOH/NaCl | 20 | FT-IR | - | [64] |
| 6 species (W) | GIT; 10% KOH (v/v) | 45 | Microscope/FT-IR | 22.0 ± 14.6/fish | [9] |
| 6 species (W) | Gill | 45 | Microscope/FT-IR | 8.3 ± 6.0/fish | [9] |
| 6 species (W) | Flesh; 10% KOH (v/v) | 45 | Microscope/FT-IR | n.d./fish | [9] |
| 2 species (W) | GIT; 65% HNO3 (v/v); NaCl solution | - | Microscope | 9.6 ± 3.3 (Muara Kamal)8.8 ± 2.7 (Marunda) | [65] |
| Acanthopagrus latus; Konosirus punctatus (W) | GIT; 10% KOH (v/v); NaCl 1.2 g mL−1 | 1.6 | Microscope/FT-IR | 1.26 ± 0.34/g | [45] |
| 6 species (W) | Stomach; removed | - | Microscope | 1–83/fish | [66] |
| 3 species (W) | Stomach | - | Visual inspection | 3.4 ± 2.4/fish | [67] |
| Red mullets (M. barbatus) (W) | Stomach content; 1 M NaOH | - | Microscope | 1.75 ± 1.14/fish | [68] |
| Dogfish (S. canicula) (W) | Stomach content; 1 M NaOH | - | Microscope | 1.20 ± 0.45/fish | [68] |
| 26 species (W) | Stomach contents, washed with distilled water | - | Microscope/FT-IR | 0.27 ± 0.63/fish | [25] |
| 5 species (W) | Tissue; 35% H2O2/4% KOH/HNO3:HClO4 (4:1 v:v); NaI 1.7g mL−1 | 2 | Microscope/SEM | 0.16–1.5/g | [22] |
| 12 species (W) | Gut; 30% H2O2 (v/v) | 20 | Microscope/FT-IR | 0.1–8.8/g | [69] |
| 2 species (W) | Gill | 20 | Microscope/FT-IR | 0.1–5.2/g | [69] |
| 32 species (W) | GIT; 10% KOH (v/v); NaCl 1.2g mL−1 | 20 | Microscope/FT-IR | 2.83 ± 1.84/fish | [70] |
| Kammal thryssa (T. kammalensis) (W) | Tissue; 10% KOH (v/v) | 8 | Microscope/FT-IR | 11.19 ± 1.28/g | [71] |
| Gizzard shad (D. cepedianum) (W) | GIT; KOH; NaCl | 0.8 | Microscope | 3/fish | [72] |
| Gizzard shad (D. cepedianum) (W) | Gill | 0.8 | Microscope | 4/fish | [72] |
| Largemouth bass (M. salmoides) (W) | GIT; KOH; NaCl | 0.8 | Microscope | 16/fish | [72] |
| Largemouth bass (M. salmoides) (W) | Gill | 0.8 | Microscope | 9/fish | [72] |
| Milkfish (C. chanos) (A) | GIT; 65% HNO3 (v/v); NaCl | Microscope | 9.1 ± 3.0/g | [65] | |
| Milkfish (C. chanos) (A) | GIT; 30% H2O2 (v/v) | - | Microscope/FT-IR | 2.3 ± 2.3/fish | [73] |
| Milkfish (C. chanos) (A) | GIT; 30% H2O2 (v/v) | - | Microscope/FT-IR | 1.3 ± 1.0/fish | [73] |
| Yellow croaker (L. crocea) (A) | GIT; 10% KOH (v/v)/30% H2O2 | 0.7 | Microscope/FT-IR | 0.008 ± 0.006/g | [74] |
| Spotted sardine (K. punctatus) (A) | GIT; 10% KOH (v/v)/30% H2O2 | 0.7 | Microscope/FT-IR | 0.044 ± 0.025/g | [74] |
| 12 species (A) | GIT; 10% KOH (v/v) | 5 | Microscope/FT-IR | 3.6 ± 0.4/g | [75] |
| Species | Analytical Methods | Concentration (Particles g−1) | References | ||
|---|---|---|---|---|---|
| Digestion/Density Separation | Filtration Pore Size (μm) | Identification | |||
| Blue mussel (M. edulis) (M) 1 | Soft tissue; 30% H2O2 (v/v) | 5 | Microscope/FT-IR | 3.69–9.16 | [76] |
| Blue mussel (M. edulis) (M) | Soft tissue; 30% H2O2 (v/v); NaCl 1.2 g mL−1 | 5 | Microscope/FT-IR | 0.9–1.4 | [77] |
| Blue mussel (M. edulis) (M) | Soft tissue; 10% KOH (v/v) | 20 | Microscope/FT-IR | n.d.–0.35 | [78] |
| Blue mussel (M. edulis) (M) | Soft tissue; HNO3:HClO4 (4:1 v:v) | Qualitative filter | Stereo microscope | 0.35 | [20] |
| Blue mussel (M. edulis) (M) | Soft tissue, Corolase® 7089 enzyme mixture | 0.8 | Microscope/FT-IR | 0.74 ± 0.125 | [11] |
| 11 species (M) | Soft tissue; H2O2 30% (v/v); NaCl 1.2 g mL−1 | 5 | Microscope/FT-IR | 2.1–10.5 | [79] |
| 3 species (M) | Soft tissue; 10% KOH (v/v); NaCl 1.2 g mL−1 | 1.6 | Microscope/FT-IR | 0.30 ± 0.10 | [45] |
| Blue mussel (M. edulis) (M) | Soft tissue; 30% H2O2 (v/v); NaCl 1.2 g mL−1 | 5 | Microscope/FT-IR/SEM | 2.7 | [80] |
| Blue mussel (M. edulis) (M) | Soft tissue; 30% H2O2 (v/v); NaCl 1.2 g mL−1 | 5 | Microscope/FT-IR | 0.7–2.9 | [77] |
| Blue mussel (M. edulis) (M) | Soft tissue; 10% KOH (v/v); KI (50%, m/v) | 12 | Microscope/FT-IR | 0.23 ± 0.20 | [81] |
| Blue mussel (M. edulis) (M) | Soft tissue; 65% HNO3/30% H2O2 (v/v) | 1.2 | Microscope/Raman/hot needle test/FT-IR | 4–10 | [59] |
| Blue mussel (M. edulis) (M) | Soft tissue; 65% HNO3/30% H2O2 (v/v) | 1.2 | Microscope/Raman/hot needle test/FT-IR | 1–4 | [59] |
| Blue mussel (M. edulis) (M) | Soft tissue; HNO3:HClO4 (4:1 v:v) | Qualitative filter | Stereo microscope | 0.26–0.51 | [20] |
| Blue mussel (M. edulis) (M) | Soft tissue, Corolase® 7089 (AB Enzyme GmbH, Darmstadt, Germany) enzyme mixture | 0.8 | Microscope/FT-IR | 0.086 ± 0.031 | [11] |
| Mediterranean mussel (M. galloprovincialis) (W) | Soft tissue; 15% H2O2 (v/v) | - | Microscope/FT-IR | 1–2/individual | [52] |
| Variety (W) | Soft tissue; 30% H2O2 (v/v); NaCl 1.2 g mL−1 | 0.8 | Dissection microscope | 35/individual | [82] |
| Blue mussel (M. edulis) (M) | Soft tissue; 30% H2O2 (v/v); NaCl 1.2 g mL−1 | 5 | Microscope/FT-IR/SEM/stain | 1.6 | [80] |
| Blue mussel (M. edulis) (M) | Soft tissue; 10% KOH (v/v) | 12 | Microscope/Raman | 0.15 ± 0.06 | [21] |
| Blue mussel (M. edulis) (M) | Soft tissue; 69% HNO3 (v/v) | 5 | Microscope/Raman | 0.36 ± 0.07 | [83] |
| Variety (A) | Soft tissue; 30% H2O2 (v/v); NaCl 1.2 g mL−1 | 0.8 | Dissection microscope | 75/individual | [82] |
| Pacific oyster (C. gigas) (M) | Soft tissue; 30% H2O2 (v/v); saline solution 25% | 5 | Raman/FT-IR | 0.077 | [84] |
| Pacific oyster (C. gigas) (M) | Soft tissue; 10% KOH (v/v) | - | Microscope | n.d.–2 | [38] |
| Pacific oyster (C. gigas) (M) | Soft tissue; 10% KOH (v/v) | 20 | Microscope/FT-IR | n.d.–0.19 | [78] |
| Pacific oyster (C. gigas) (M) | Soft tissue; 69% HNO3 (v/v) | 5 | Microscope/Raman | 0.47 ± 0.16 | [83] |
| Eastern oyster (C. virginica) (W) | Soft tissue; 30% H2O2 (v/v) | 0.45 | Microscope | 3.84 ± 3.39 | [85] |
| Pacific oyster (C. gigas) (W) | Soft tissue; 10% KOH (v/v); KI solution (50%, m/v) | 12 | FT-IR | 0.18 ± 0.16 | [81] |
| Sydney rock oyster (S. glomerate) (W) | Soft tissue; 10% KOH (v/v); NaI | 1 | Microscope/FT-IR/stain | 0.15–0.83 | [86] |
| Spiny oyster (S. spinosus) (W) | Soft tissue; 10% KOH (v/v) | 1.6 | Microscope/Raman | 0.45 ± 0.3 | [48] |
| Atlantic pearl-oyster (P. radiata) (W) | Soft tissue; 30% H2O2 (v/v) | 25 | Microscope/FE-SEM/FT-IR/hot needle | 0.1 | [87] |
| Hongkong oyster (C. hongkongensis) (A) | Soft tissue; 10% KOH (v/v) | 5 | FT-IR | 0.8 ± 0.2 | [75] |
| Densely lamellated oyster (O. denselamellosa) (A) | Soft tissue; 10% KOH/30% H2O2 (v/v) | 0.7 | Microscope/FT-IR | 0.31 ± 0.10 | [74] |
| Japanese scallop (P. yessoensis) (M) | Soft tissue; 10% KOH (v/v) | 20 | Microscope/FT-IR | 0.01–0.17 | [78] |
| 9 species (M) | Soft tissue; 30% H2O2 (v/v); NaCl 1.2 g mL−1 | 5 | Microscope/FT-IR | 2.1–10.5 | [87] |
| Manila clam (T. philippinarum) (M) | Soft tissue; 10% KOH (v/v) | 20 | Microscope/FT-IR | 0.03–1.08 | [78] |
| Manila clam (T. philippinarum) (W) | Soft tissue; 69% HNO3 (v/v) | 1.2 | Microscope | 0.9 ± 0.9 | [88] |
| Asian clams (C. fluminea) (W) | Soft tissue; 30% H2O2 (v/v); NaCl 1.2 g mL−1 | 20 | Microscope/FT-IR | 0.3–4.9 | [89] |
| Asian clams (C. fluminea) (W) | Soft tissue; 30% H2O2 (v/v); NaCl 1.2 g mL−1 | 5 | Microscope/FT-IR/SEM/EDS | 0.2–12.5 | [90] |
| A. squamosus (W) | Whole sample; 10% KOH (v/v) | 38 | Microscope/FT-IR | 2.89 ± 0.54 | [91] |
| G. spp (W) | Whole sample; 10% KOH (v/v) | 38 | Microscope/FT-IR | 0.26 ± 0.08 | [91] |
| Agemaki clam (S. constricta) (A) | Soft tissue; 10% KOH/30% H2O2 (v/v) | 0.7 | Microscope/FT-IR | 0.21 ± 0.05 | [74] |
| Manila clam (T. philippinarum) (A) | Soft tissue; 69% HNO3 (v/v) | 1.2 | Microscope | 1.7 ± 1.2 | [88] |
| Cockle clam (C. edule) (A) | Soft tissue; 10% KOH (v/v) | 12 | FT-IR | 0.74 ± 0.35 | [21] |
| Mud snails (P. indica) (W) | Whole body; 10% KOH (v/v) | 38 | Microscope/FT-IR | 3.48 ± 0.89 | [91] |
| common limpet (P. vulgata) (W) | Soft tissue; 65% HNO3/30% H2O2 | 0.7 | Microscope/Raman/hot needle test/FT-IR | 0–1 | [59] |
| Tower snail (Turritellidae sp.) (W) | Soft tissue; 65% HNO3/30% H2O2 | 0.7 | Microscope/Raman/hot needle test/FT-IR | 1–4 | [59] |
| Mud snails (C. cingulate) (W) | Soft tissue; 30% H2O2 (v/v) | 25 | Microscope/FE-SEM/FT-IR/hot needle | 1.5 | [87] |
| Thais mutabilis (W) | Soft tissue; 30% H2O2 (v/v) | 25 | Microscope/FE-SEM/FT-IR/hot needle | 2.3 | [87] |
| Gibbula cineraria (W) | Soft tissue; 10% KOH (v/v) | 0.7 | Microscope/FT-IR | 3–7/individual | [92] |
| Common periwinkle (L. littorea) (W) | Soft tissue; 65% HNO3/30% H2O2 | 0.7 | Microscope/Raman/hot needle test/FT-IR | 1–6 | [59] |
| Common periwinkle (L. littorea) (M) | Soft tissue; 65% HNO3/30% H2O2 | 0.7 | Microscope/Raman/hot needle test/FT-IR | 27–35 | [93] |
| Common periwinkle (L. littorea) (W) | Soft tissue; 10% KOH (v/v) | 1.2 | Microscope/FT-IR | 2.24 ± 3.15 | [93] |
| Brown shrimp (M. Monoceros) (W) | Whole body; HNO3:HClO4 (4:1 v:v) | 20 | Microscope/hot needle | 0.68 ± 0.55 | [94] |
| Australian freshwater shrimp (P. australiensis) (W) | Whole body; NaOH 2N | 0.45 | Microscope/FT-IR | 2.4 ± 3.1 | [95] |
| Brown shrimp (M. Monoceros) (W) | Soft tissue; 30% H2O2 (v/v); NaCl 1.2 g mL−1 | 45 | Microscope/FT-IR | 2.17–4.88 | [96] |
| Norway lobster (N. norvegicus) (W) | Soft tissue; 69% HNO3 (v/v) | - | Microscope/FT-IR | 1.75 ± 2.01/individual | [97] |
| Norway lobster (N. norvegicus) (W) | Stomach; 15% H2O2; NaCl 1.2 g mL−1 | 0.45 | Microscope/FT-IR | 5.5 ± 0.8/individual | [98] |
| Blue and red shrimp (A. antennatus) (W) | Stomach; 15% H2O2; NaCl 1.2 g mL−1 | 0.45 | Microscope/FT-IR | 1.66 ± 0.11 | [98] |
| Asian tiger shrimp (P. Monodon) (W) | Soft tissue; 30% H2O2 (v/v); NaCl 1.2 g mL−1 | 45 | Microscope/FT-IR | 1.55–4.84 | [96] |
| Spear shrimp (P. hardwickii) (A) | Soft tissue; 10% KOH/30% H2O2 (v/v) | 0.7 | Microscope/FT-IR | 0.25 ± 0.08 | [74] |
| Japanese shore crab (H. sanguineus) (W) | Soft tissue; 65% HNO3/30% H2O2 | 0.7 | Microscope/Raman/hot needle test/FT-IR | 1–5 | [59] |
| Atlantic blue crab (C. sapidus) (W) | Soft tissue; 30% H2O2 (v/v) | 0.8 | μFT-IR | 0.87/individual | [99] |
| Atlantic mud crab (P. herbstii) (W) | Soft tissue; 30% H2O2 (v/v) | 0.45 | Microscope | 297.74 ± 1178.75 | [85] |
| Food Items | Analytical Methods | Concentration (Particles/L or kg) | References | ||
|---|---|---|---|---|---|
| Digestion/Density Separation | Filtration Pore Size (μm) | Identification | |||
| Beer, USA | Rose Bengal | 11 | Dissection microscope | n.d.–14.3/L | [32] |
| Beer, Germany | Rose Bengal | 0.8 | Dissection microscope | 16–254/L | [104] |
| Honey from 5 countries | 30% H2O2 | 0.8 | Dissection microscope | 40–698/kg | [105] |
| Honey from 9 regions | 30% H2O2 | 0.8 | Microscope | 12–418/kg | [106] |
| Honey, Switzerland | 30% H2O2 | 30 | Microscope | 1992–9752/kg (all particles) | [107] |
| Milks from Mexico, USA, Latin and Central America | Filtration after coagulating lipids | 11 | Microscope/SEM/Raman | 3–11/L | [108] |
| Sugar | 30% H2O2 | 0.8 | Dissection microscope | 249 ± 130/kg | [105] |
| Teabag, Canada | Distilled water at 95 °C for 5 min | - | SEM/XPS/FT-IR | 11.6 billion microplastics (>1 μm) and 3.1 billion nanoplastics (<100 nm in size) per steeped teabag. | [17] |
| Commercial seaweed nori, China | Cellulase solution (0.1%, v/v), Alcalase solution (100%, v/v), 30% H2O2 (v/v)/saturated solution of NaCl | 5 | Stereo optical microscope/FT-IR | 0.9–3.0/g (dry weight) | [26] |
| Canned sardines and sprats from 13 countries | 10% KOH/NaI 1.5 g mL−1 | 149/8 | Microscope/Raman/FESEM-EDX | 0–0.75 particles/can | [27] |
| Dried fish, Malaysia | 10% KOH/NaI 1.5 g mL−1 | 149/8 | Microscope/Raman/FESEM-EDX | 0–3 particles/individual fish | [24] |
| Animal-based traditional medicinal materials, China | 30% H2O2/FeSO4·7H2O | 20 | Microscope/FT-IR | 1.59 ± 0.33–43.56 ± 9.22/g (dry weight) | [109] |
| Identification Method | Advantages | Disadvantages |
|---|---|---|
| Visual inspection | Inexpensive, rapid analysis | Possible false-positive detection |
| Scanning electron microscopy | Not limited to particle size | Possible false-positive detection |
| Microscopy/FT-IR | Coupled with visual analysis, chemical confirmation of polymers, relatively rapid scanning | Limited to a size of ~20 μm |
| Microscopy/Raman | Coupled with visual analysis, chemical confirmation of polymers, possible detection to a few micrometers | Time consuming, expensive |
| Thermal decomposition/GC-MS | Mass measurements, ease of pretreatment | No information about size distribution, potentially biased by large particles, calibration required |
| Pretreatment Method | Applied Matrices | Advantages | Disadvantages | References |
|---|---|---|---|---|
| Washing only | Salts, beer | Very rapid, no need for expensive instruments | Potentials for false-positives, often requires staining | [32,34] |
| Oxidative | ||||
| H2O2 | Fish, shellfish, biogenic matter of animal and plant origin | Reduced cost and digestion time, efficient for digesting biological materials | Degradation of PA, PVC, polymethyl methacrylate, and nylon 66; color change of PET | [31,110,111] |
| Fenton’s reagent | Marine organisms | Good preservation of microplastic particles, effective removal of organic components | To be tested on diverse sample matrices | [112] |
| Alkali | ||||
| KOH | Fish, seafood, marine organisms | Effective for destroying proteins, polymer types unaffected with previous environmental degradation | Organic matter such as otoliths, squid beaks, paraffin, and palm fats did not digest; cellulose acetate digested | [113] |
| NaOH | Seafood, zooplankton, copepods, mussels | Complete digestion of soft tissue, good recovery for PET and HDPE (>97%) | Underrepresentation of pH-sensitive polymers; partial destruction of Nylon, melding of polyethylene, yellowing of uPVC, and loss of several polyester fibers | [19,114] |
| Acidic | ||||
| HNO3 | Seafood, fish, mussels, lugworms | Frozen sample with mild stirring can lead to complete soft tissue digestion in 1 h | Poor results for plastic integrity; decreased particle weight for PA-12, melted LDPE, HDPE, PET, PP; complete destruction of nylon fibers | [19,115,116] |
| HCl/HNO3 | Fish | Recovery increased with increasing temperature up to 60 °C | Low digestion efficiency of biological materials (52.5–53.3%) | [31] |
| HClO4 | Mussel body and brown shrimp tissues | Stronger perchloric acid reduces the remaining greasy tissue fraction after destruction;lesser effect of HNO3 on plastic degradation than other acid digestions | Harmed plastic integrity, sample yellowing | [20,94] |
| Enzymatic | ||||
| Corolase 7089 (bacterial protease) | Mussels | Efficient for digesting soft tissue while maintaining microplastic integrity, high recovery (93 ± 10%) | To be tested on different sample types | [19] |
| Alcalase (industrial protease) | Blue mussel tissue | High digestion efficiency (98.3–99.35%) at low conc.; no visual alterations of PS | Experiments are yet to be conducted using diverse plastic types | [117] |
| Proteinase-K | Plankton-rich seawater, marine organisms, Antarctic krill | High efficiency, unharmed microplastic debris | Expensive and not suitable for digesting chitin | [110,118] |
| Trypsin | Mussel tissues | Mild digestion resulting in no change in shape and/or color of polymers | Adductor muscles and mantle skirt were partially digested | [119] |
| Papain/collagenase | Mussel tissues | No significant changes in exposed polymers | Lower digestive efficacy than trypsin | [119] |
© 2020 by the authors. Licensee MDPI, Basel, Switzerland. This article is an open access article distributed under the terms and conditions of the Creative Commons Attribution (CC BY) license (http://creativecommons.org/licenses/by/4.0/).
Share and Cite
Kwon, J.-H.; Kim, J.-W.; Pham, T.D.; Tarafdar, A.; Hong, S.; Chun, S.-H.; Lee, S.-H.; Kang, D.-Y.; Kim, J.-Y.; Kim, S.-B.; et al. Microplastics in Food: A Review on Analytical Methods and Challenges. Int. J. Environ. Res. Public Health 2020, 17, 6710. https://doi.org/10.3390/ijerph17186710
Kwon J-H, Kim J-W, Pham TD, Tarafdar A, Hong S, Chun S-H, Lee S-H, Kang D-Y, Kim J-Y, Kim S-B, et al. Microplastics in Food: A Review on Analytical Methods and Challenges. International Journal of Environmental Research and Public Health. 2020; 17(18):6710. https://doi.org/10.3390/ijerph17186710
Chicago/Turabian StyleKwon, Jung-Hwan, Jin-Woo Kim, Thanh Dat Pham, Abhrajyoti Tarafdar, Soonki Hong, Sa-Ho Chun, Sang-Hwa Lee, Da-Young Kang, Ju-Yang Kim, Su-Bin Kim, and et al. 2020. "Microplastics in Food: A Review on Analytical Methods and Challenges" International Journal of Environmental Research and Public Health 17, no. 18: 6710. https://doi.org/10.3390/ijerph17186710
APA StyleKwon, J.-H., Kim, J.-W., Pham, T. D., Tarafdar, A., Hong, S., Chun, S.-H., Lee, S.-H., Kang, D.-Y., Kim, J.-Y., Kim, S.-B., & Jung, J. (2020). Microplastics in Food: A Review on Analytical Methods and Challenges. International Journal of Environmental Research and Public Health, 17(18), 6710. https://doi.org/10.3390/ijerph17186710