1. Introduction
Nowadays, energy shortages and environmental pollution are becoming more and more serious and therefore sustainable development is hampered. To address the aforementioned problems, the exploitation and utilization of clean energy are urgently required. Geothermal resources have become a popular clean energy source due to its clean and renewable affinities [
1]. Geothermal springs, as an important constituent of geothermal resources, have become a hot research topic so far [
2,
3,
4,
5,
6].
Abundant geothermal springs have been reported on the Chinese mainland [
7]. Most of the high-temperature geothermal springs are distributed in southwestern China, including southern Tibet, western Sichuan, and western Yunnan [
8,
9,
10,
11,
12,
13,
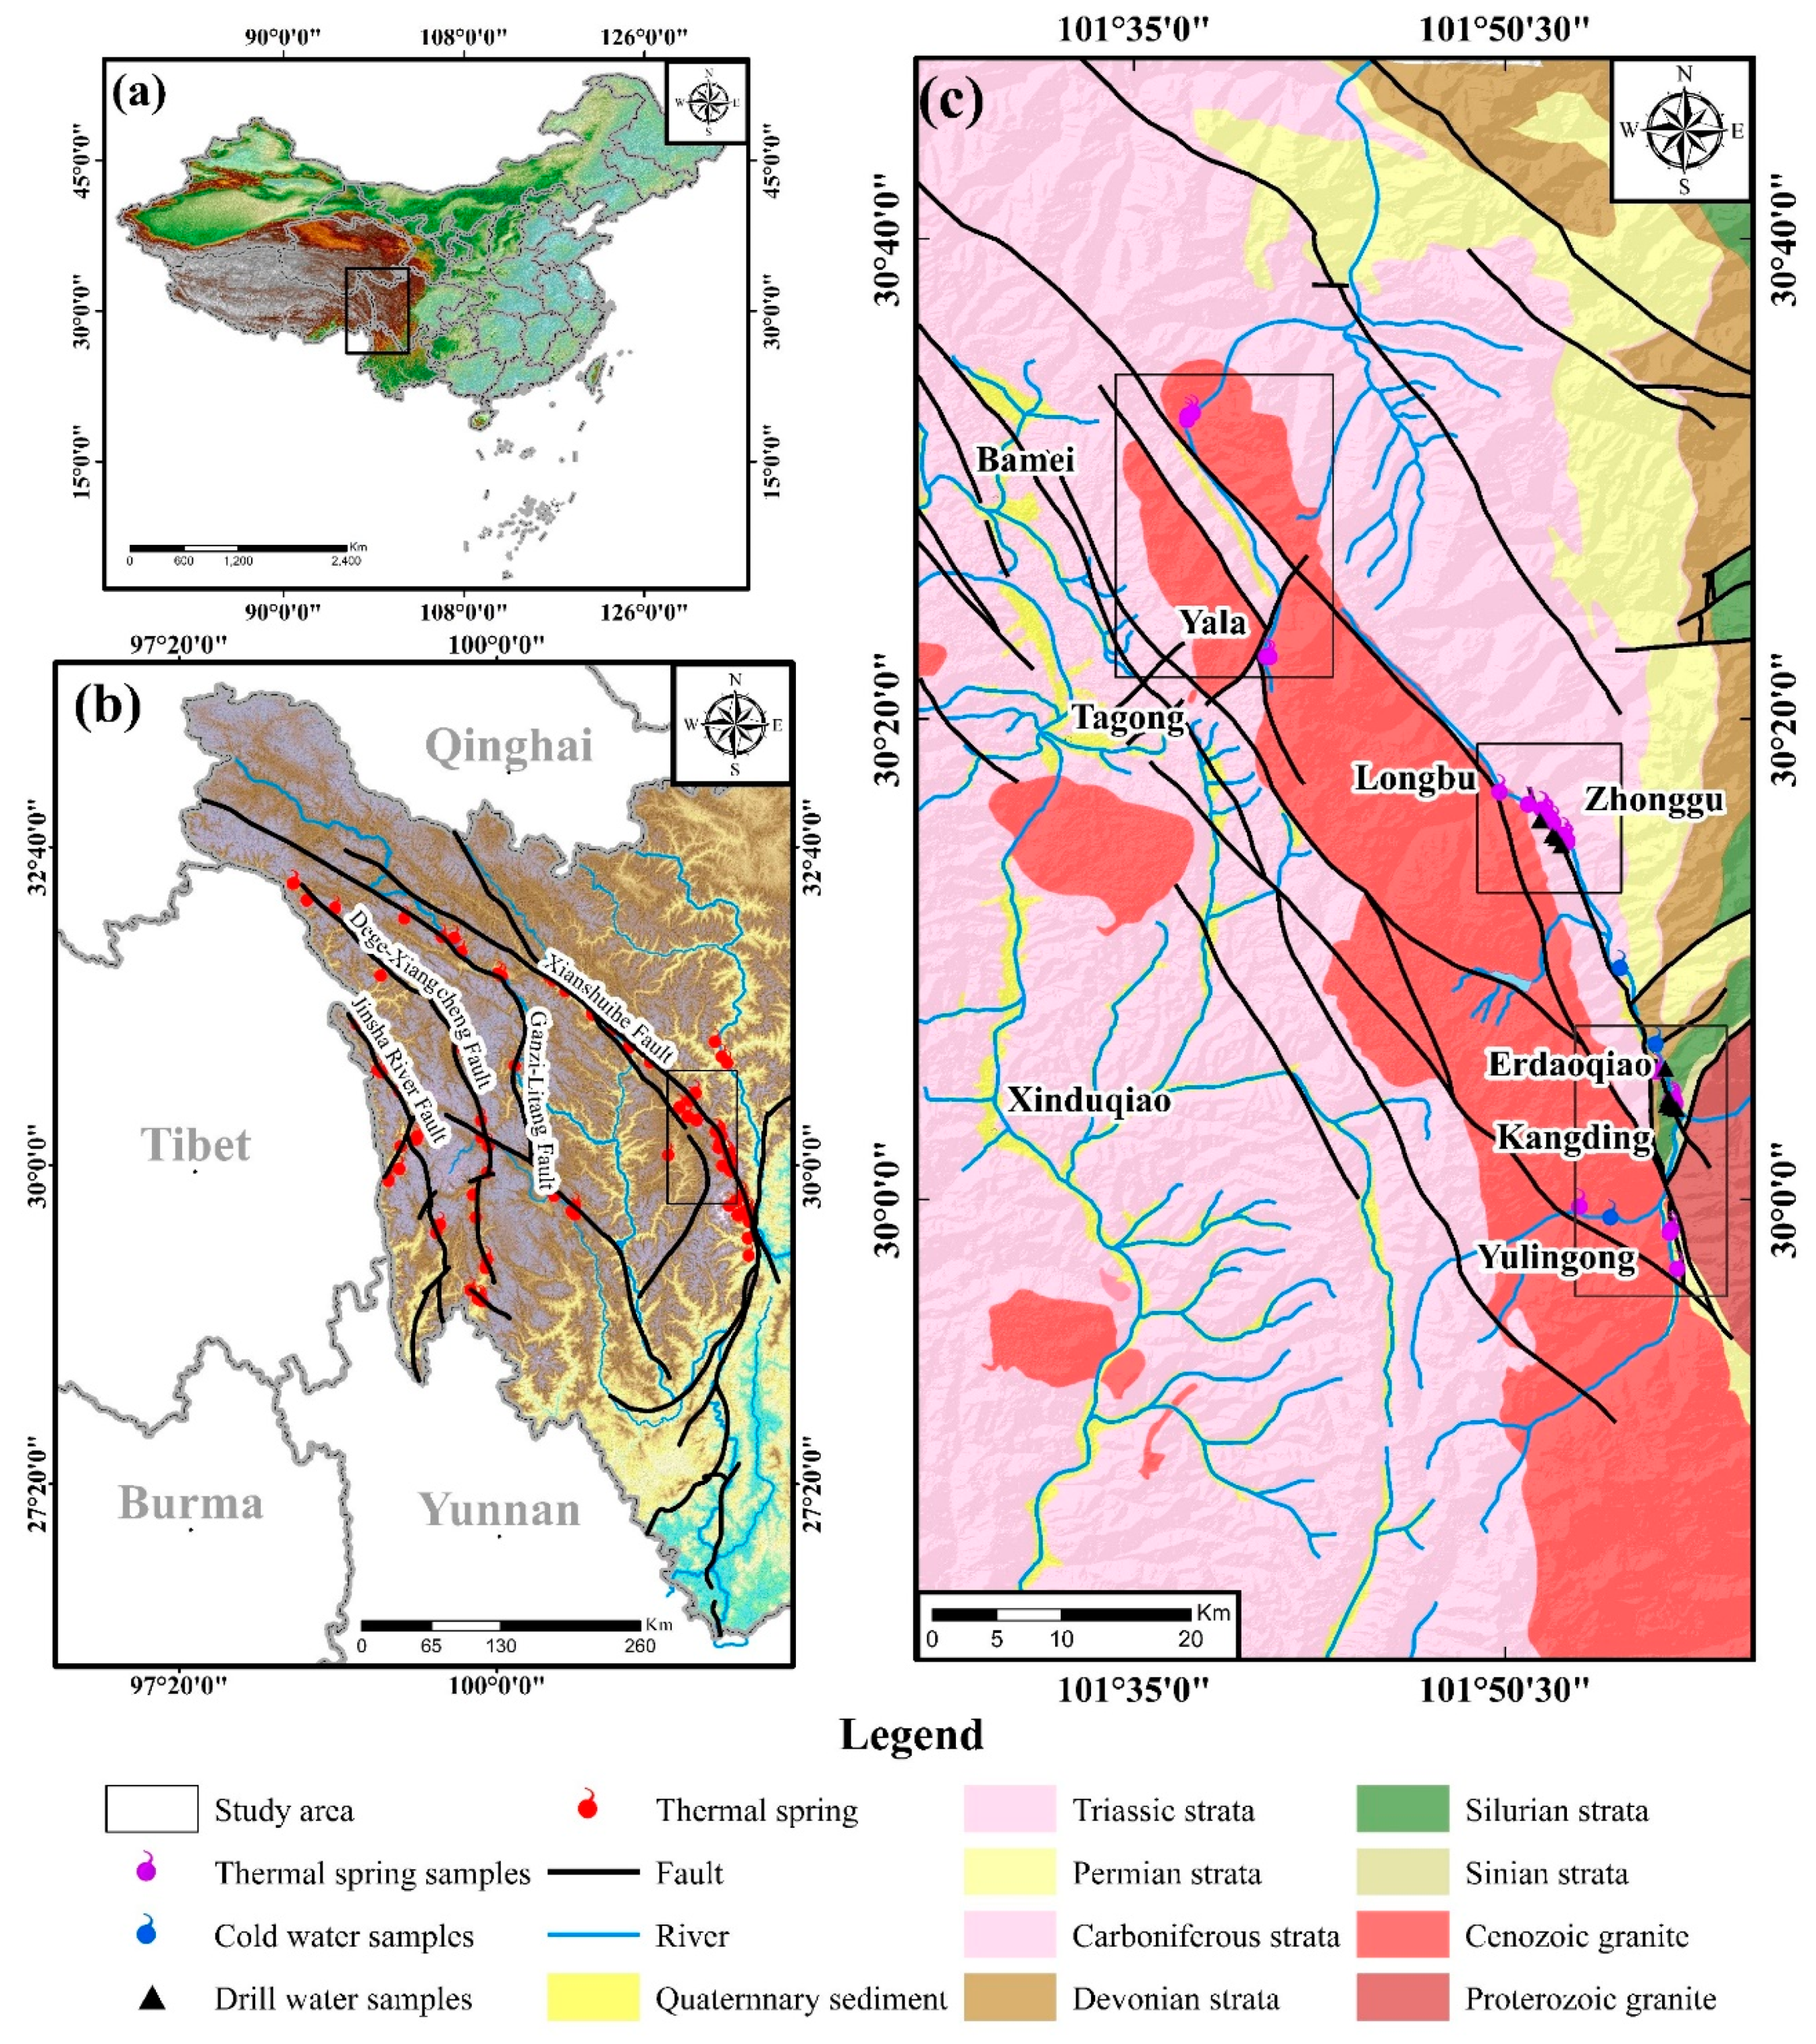
14]. The Xianshuihe fault zone (XFZ) of western Sichuan is a famous area with a significant number of geothermal springs [
15] (
Figure 1a,b). Geothermal springs are primarily found in the Yalabamei, Zhonggu, Erdaoqiao, and Yulingong geothermal areas of the XFZ (
Figure 1c). Up to now, previous studies have interpreted the genesis of geothermal springs in the Erdaoqiao and Yulingong geothermal areas using geophysical and geochemical methods [
16,
17,
18,
19,
20,
21,
22,
23,
24]. However, only a few previous investigations analyzed the geothermal springs in the Yalabamei and Zhonggu geothermal areas [
25], and thus the conceptual model of the geothermal system is unclear. Further research has yet to be conducted to facilitate the exploitation and utilization of the geothermal resource in the XFZ.
Therefore, this study aims at clarifying the mechanism of the geothermal system in the XFZ. Forty-one geothermal springs, drilled water wells, and cold water sites were sampled in the Yalabamei, Zhonggu, Erdaoqiao, and Yulingong geothermal areas of the XFZ. Hydrogeochemical and D-O isotopic analyses for those samples were employed to trace the water–rock interaction, reservoir temperature, and recharge source of geothermal water. Afterward, the conceptual model of the geothermal system was preliminarily constructed as a summary of our hydrogeochemical analyses.
2. Study Area
The XFZ is located in southwestern China and tectonically belongs to the eastern margin of the Tibetan Plateau. Since the Eurasian-Indian collision at the Eocene, the XFZ has been moving in the way of the left-lateral strike-slip [
26]. The XFZ is composed of northwestern, middle, and southeastern segments. The northwestern segment includes the Luhuo, Daofu, and Bamei faults. The middle segment consists of the Yalahe, Zheduotang, and Selaha faults. The southeastern segment contains the Kangding and Moxi faults. The geomorphology of the XFZ is high mountain and low valley. The elevations of the XFZ have a range of ~3000–7556 m with a significant difference of 3000–4000 m.
In the study area, the sedimentary strata are dominated by Triassic sandstone and slate with minor Proterozoic marble, schist, and phyllite, Sillure schist and marble, Devonian slate, Permian limestone, and Quaternary sediments. Three periods of magmatic events (the Proterozoic, and early and late Yashanian) have been recognized in the study area. Separated by the XFZ, the Proterozoic igneous rocks are exposed on the eastern side, while early and late Yanshanian igneous rocks are emplaced on the western side.
An abundance of geothermal springs has been investigated in the middle and southeastern segments of the XFZ, heated by deep magma, radioactive heat of granitoids, and strike-slip frictional heat of the XFZ [
15]. Their distributions are well controlled by the XFZ, forming the Yalabamei, Zhonggu, Erdaoqiao, and Yulingong geothermal areas (
Figure 1c). (1) the Yalabamei area: Twenty geothermal springs with measured temperatures of 47–66 °C are exposed in the Yanshanian granite. They are mainly distributed along the northeastern-trending faults. (2) The Zhonggu area: More than one hundred geothermal springs have been reported in the Zhonggu area. They are distributed along the Yalahe fault and exposed in the Triassic sandstone. The flow rate ranges from 0.1 to 0.3 L/s and the highest temperature is 43 °C. (3) The Erdaoqiao area: The geothermal springs with a discharge of 0.5 to 6.4 L/s and a temperature of 32–56 °C are exposed in the Quaternary sediments along the Yalahe fault. A large number of travertines have been observed on the surface, as well as a strong H
2S smell. (4) The Yulingong area: The geothermal springs here have a temperature higher than 60 °C (the highest is 94 °C) and the discharge of 0.24–6.34 L/s.
3. Sampling and Methodology
A total of 36 water samples were collected from geothermal springs, geothermal drilled water wells, and cold springs and rivers in the vicinity of the XFZ on 18–20 May 2017. Field sampling procedures and analytical methodology were described by Zhang et al. (2018) [
16]. Temperature, pH, alkalinity, and total dissolved solids (TDS) were measured in the field. Temperatures of the samples were measured using a mercury thermometer. The pH electrode was calibrated with standard solutions of pH 1.0, 4.0, and 7.0. The alkalinity of the samples was measured by Gran titration with 0.1 M HCl and is expressed here as HCO
3−. Samples for cation analysis were filtered through 0.1μm and acidified to pH less than 1 with HNO
3. Anions were determined within 24 h after collection.
Within a week after fieldwork, all the experiments were carried out in the State Key Laboratory of Geohazard Prevention and Geoenvironment Protection, Chengdu University of Technology. The samples were analyzed for Si and major cations (K, Na, Ca, and Mg) using inductively coupled plasma-optical emission spectrometry (ICP-OES) (Thermo Fisher ICAP-6300), while anions (Cl and SO4) were determined by ion chromatography (Dionex ICS-1100). Charge balance errors between major cations and anions were lower than ±10% for all samples. The δD and δ18O values were reported in delta (δ) relative to VSMOW (Vienna Standard Mean Ocean Water) using conventional δ (‰) notation. The analytical precision for δD and δ18O was ± 0.6‰ and ± 0.2‰, respectively.
4. Analytical Results
The physical properties and chemical compositions of geothermal waters along the Xianshuihe fault are presented in
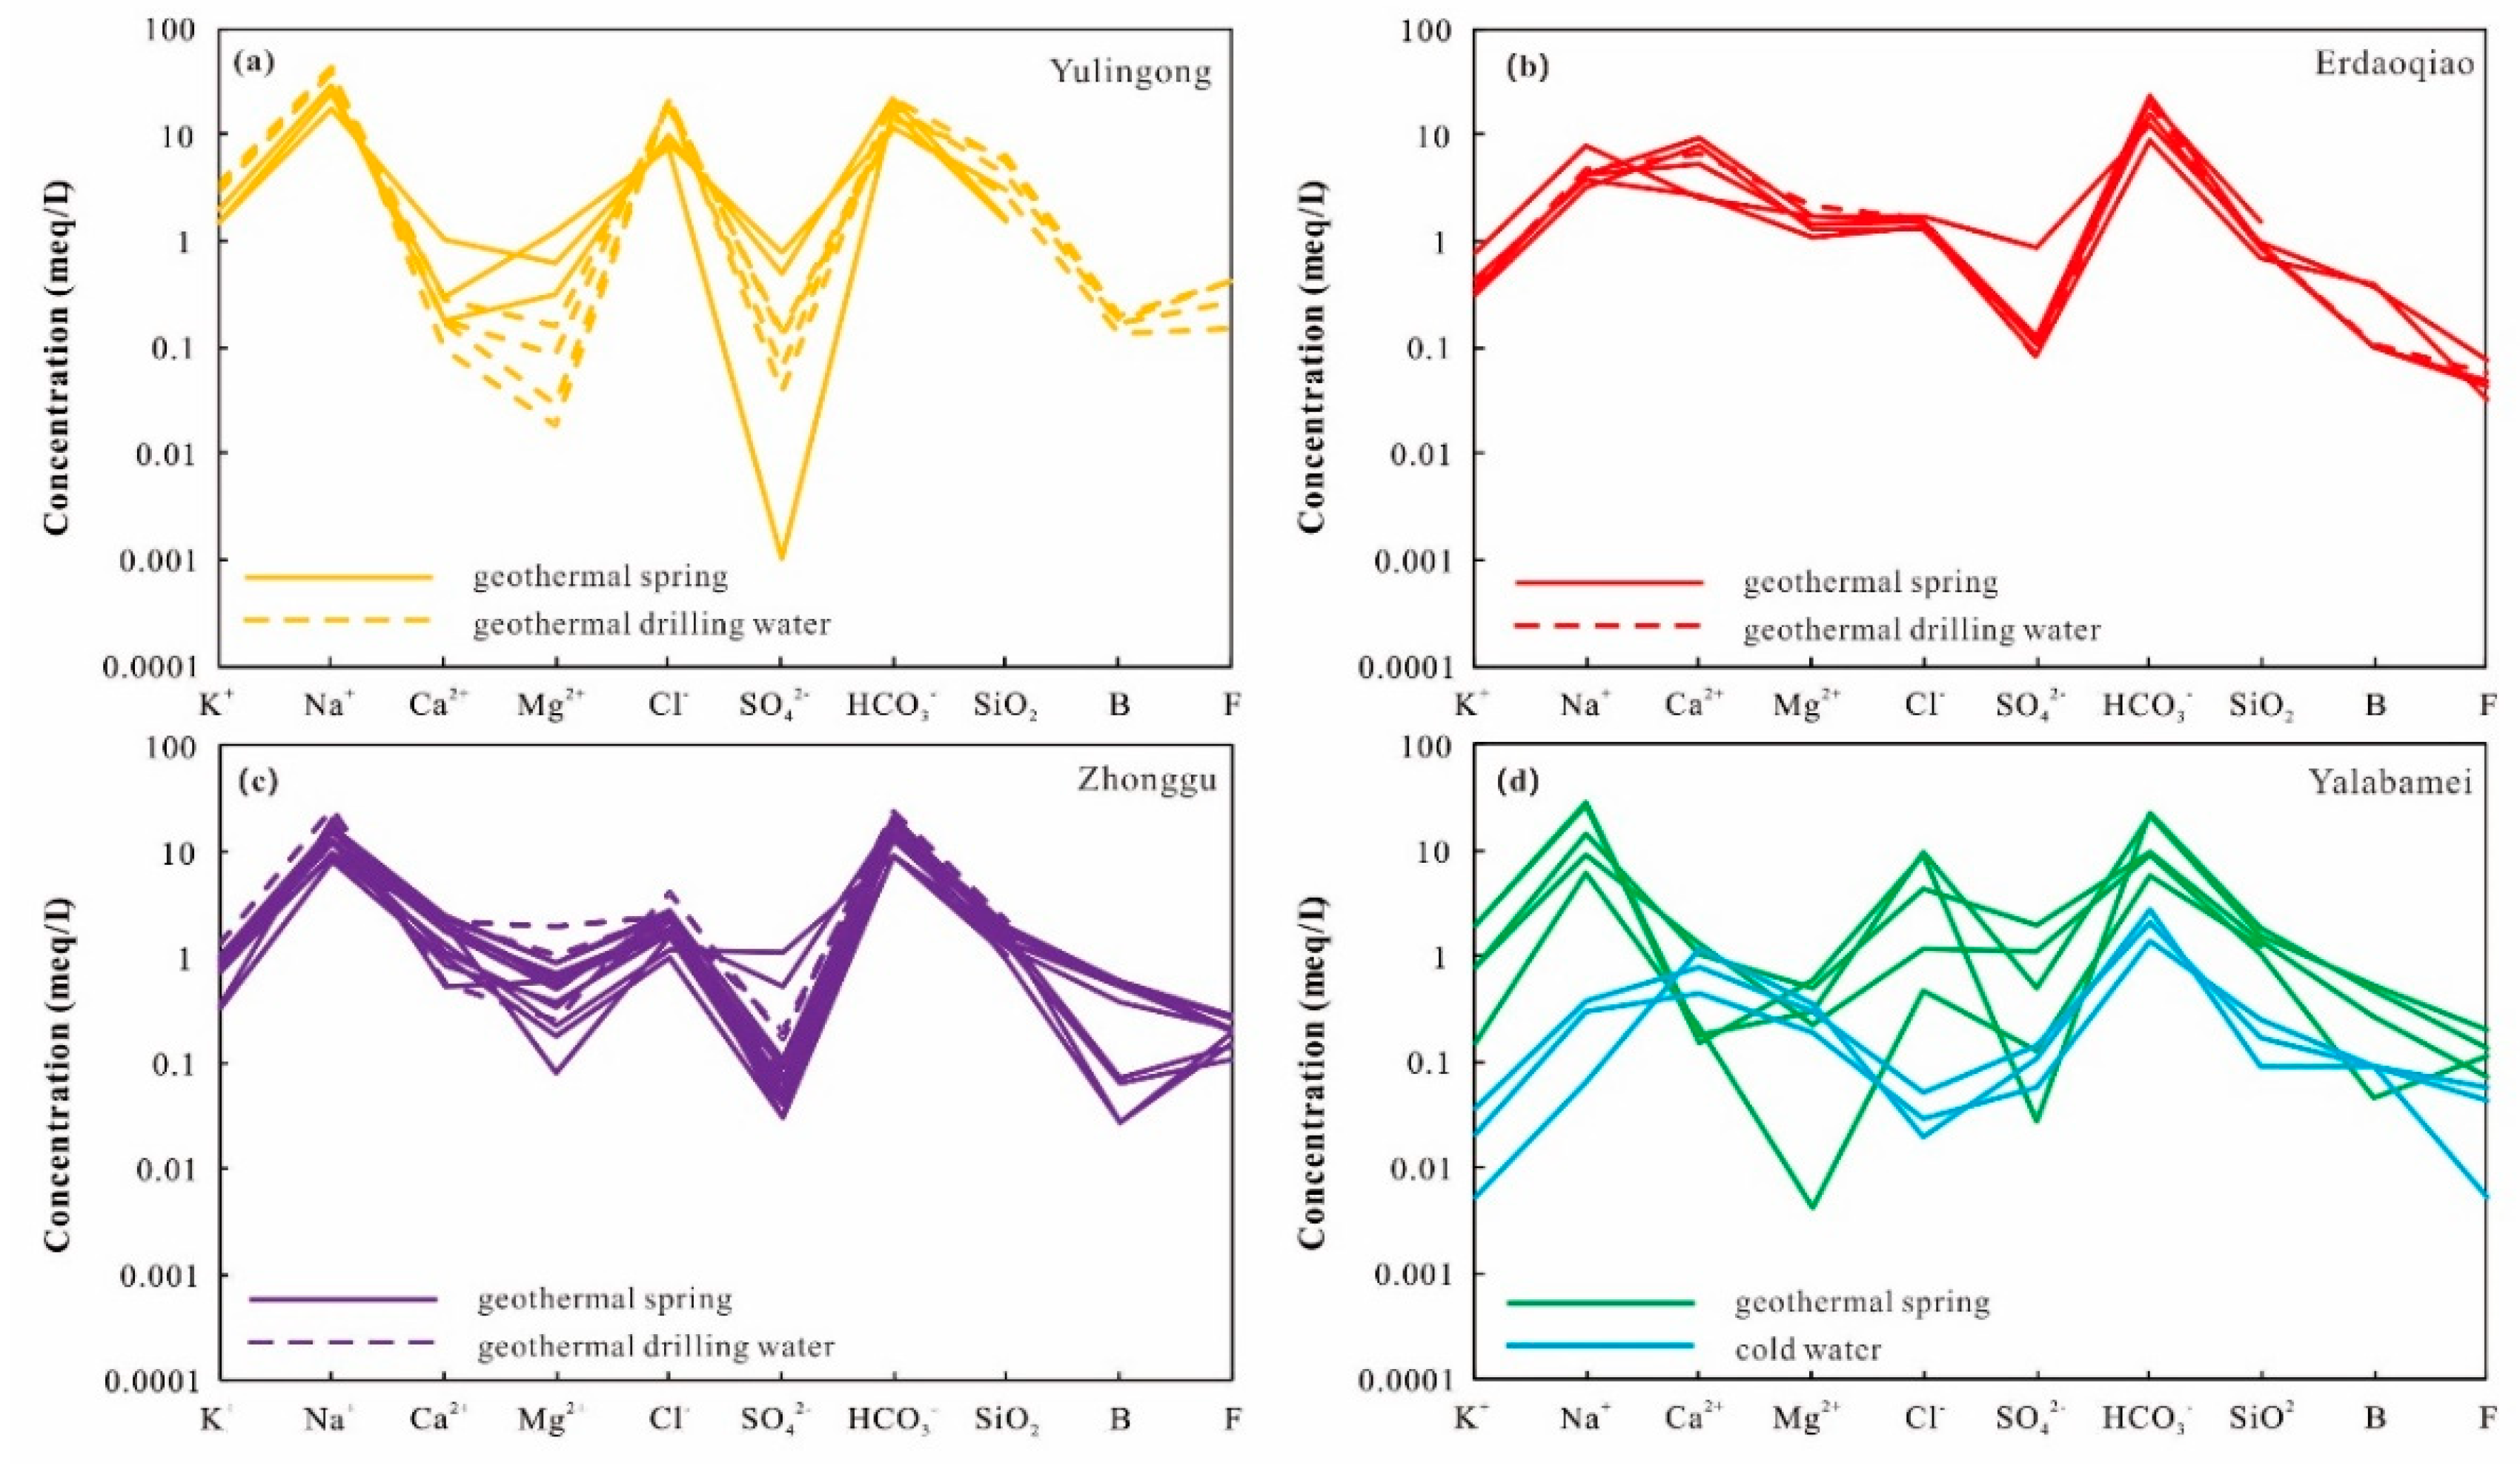
Table S1. The exposed temperature values range from 30.5 to 115 °C, and the pH values vary from 6.5–9.0. Cold spring and river (referred to as cold water afterward) samples have temperature values of 9.8–12.8 °C and pH values of 7.9–8.1. Na
+ and Ca
2+ are the primary cations, while HCO
3− and Cl
− are the dominant anions, respectively (
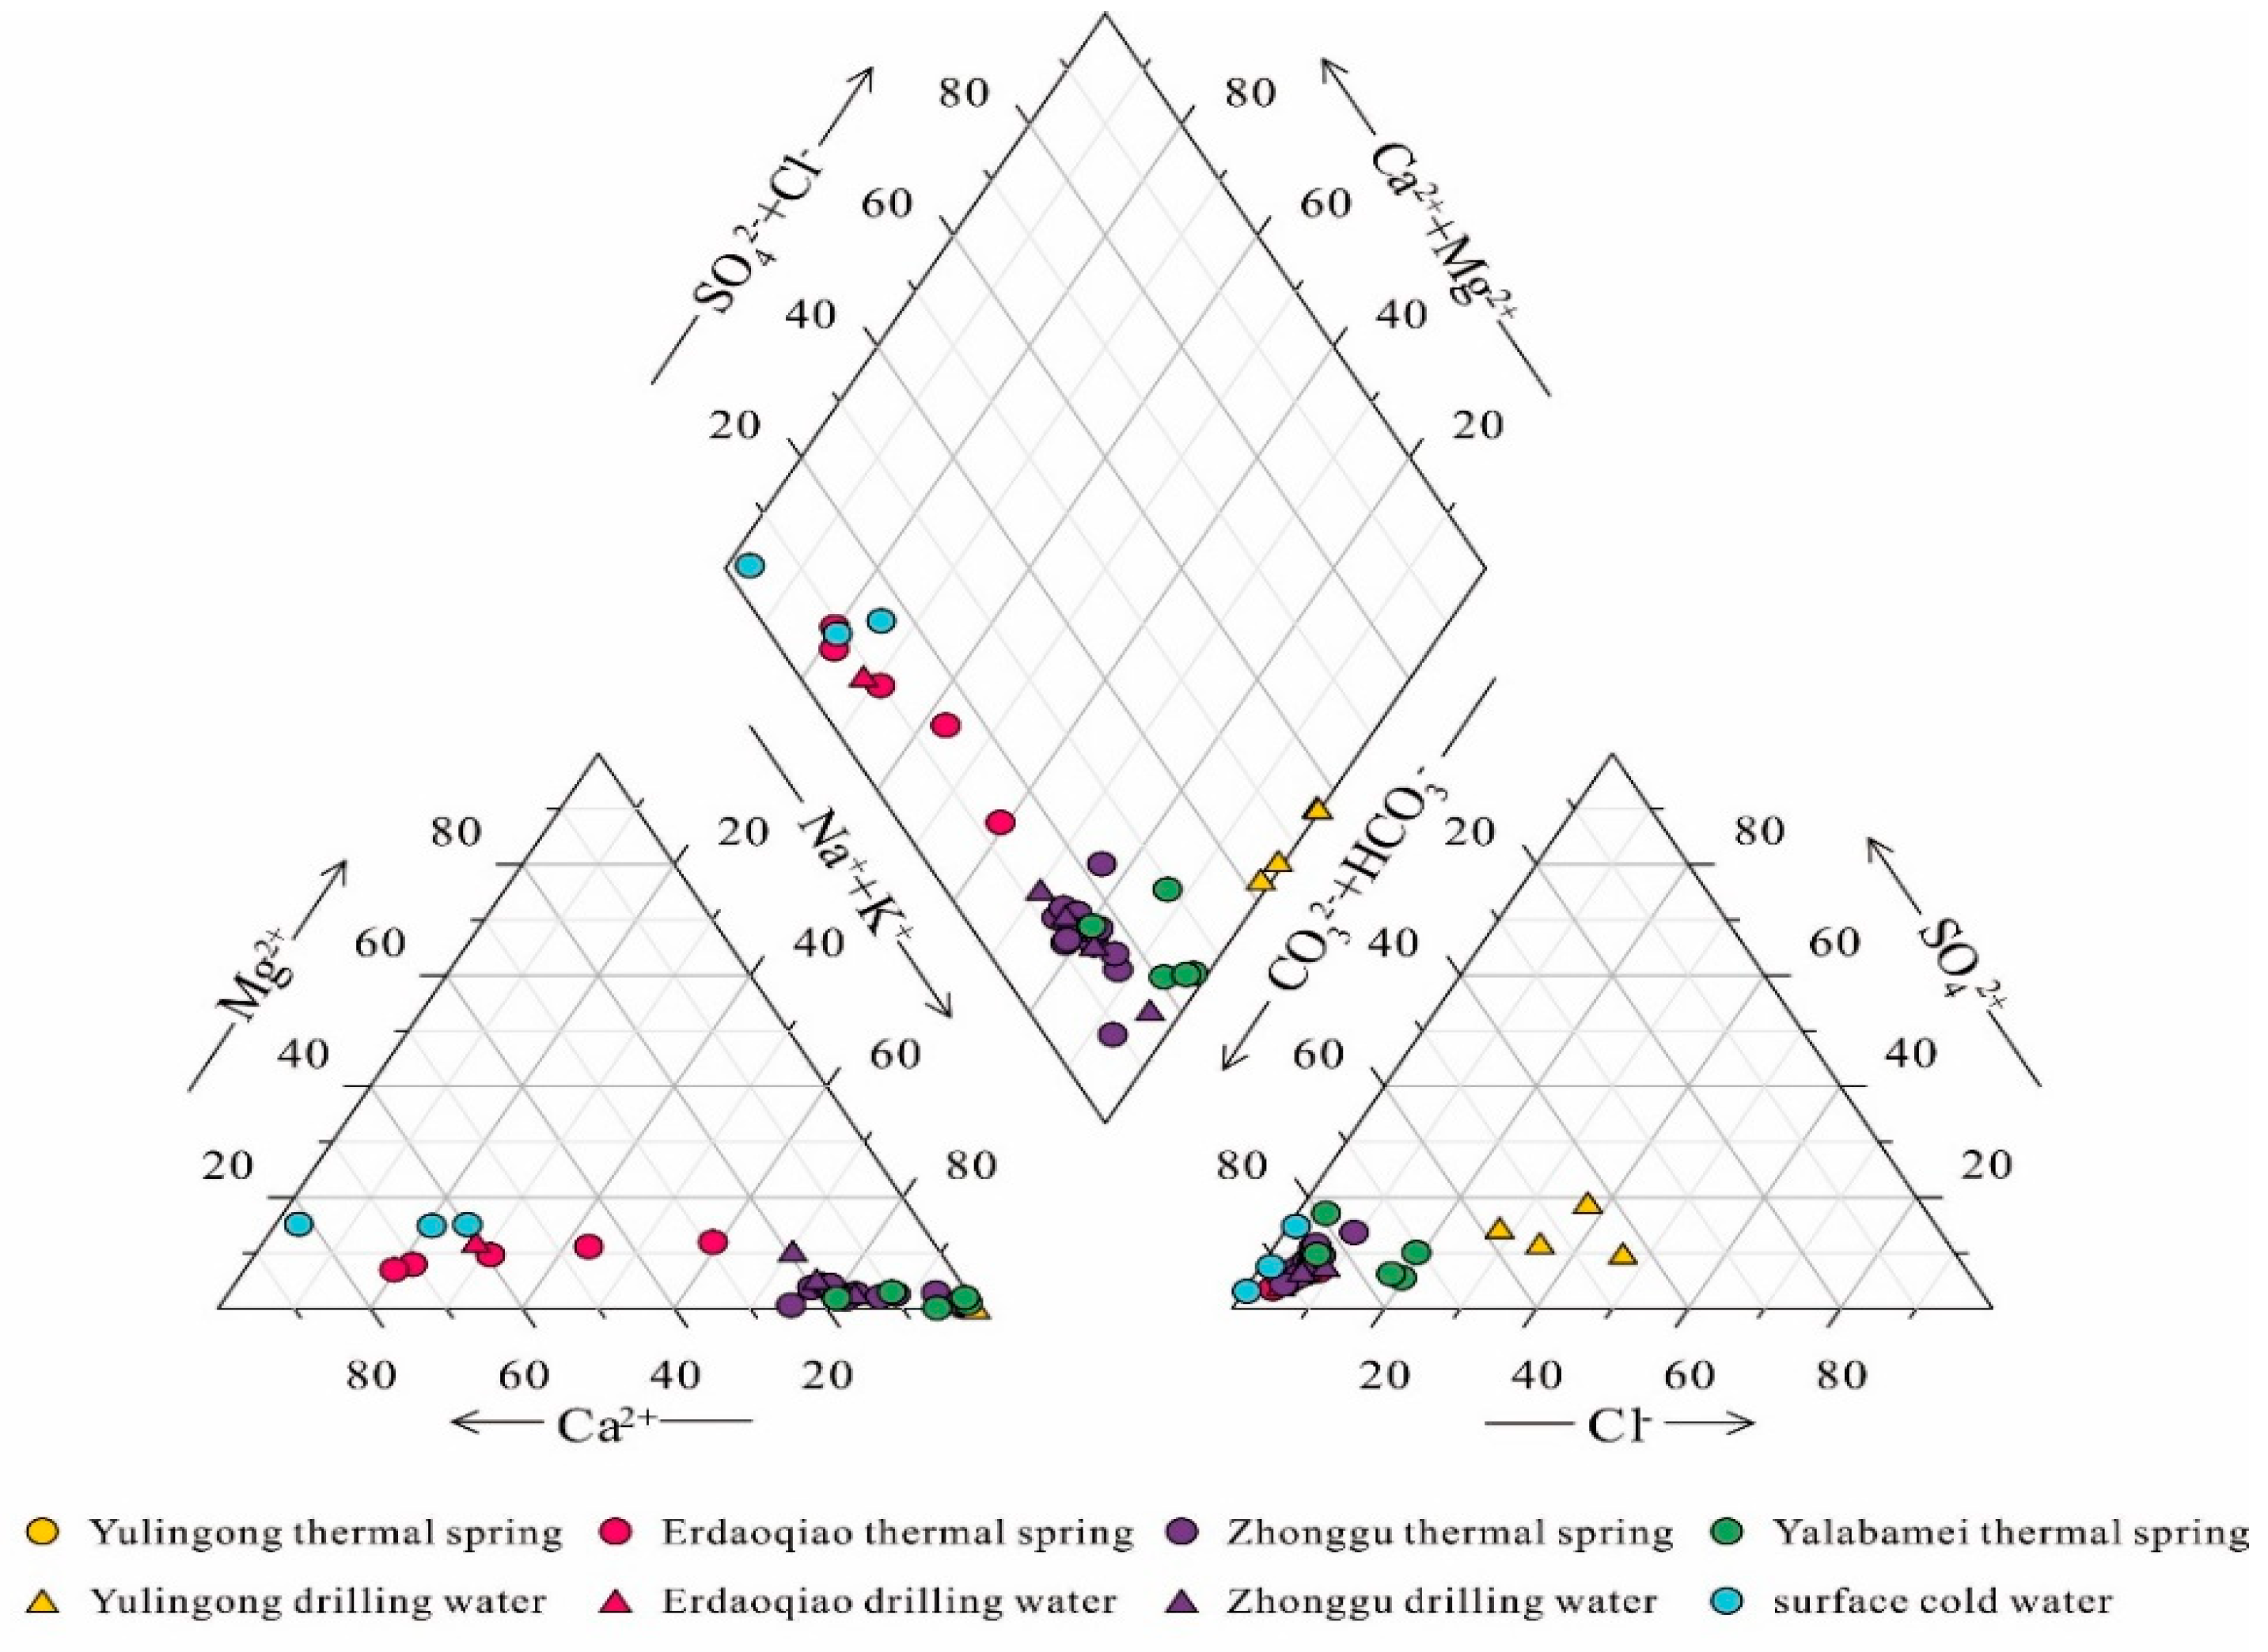
Figure 2). According to the major-ion characteristics of geothermal waters, four representative groups of hydrochemical types were recognized, as shown in
Figure 3. The Na–HCO
3–Cl type geothermal waters are exposed in the Yulingong area and possess higher TDS and temperature values. The Ca–Na–HCO
3 type geothermal waters are distributed in the Erdaoqiao area, while Na–HCO
3 type geothermal waters are located in other areas. Both of the Ca–Na–HCO
3 and Na–HCO
3 type geothermal waters are relatively lower TDS and temperature values. Cold waters are of the Ca–HCO
3 type with the main ions of Ca
2+ and HCO
3− (
Figure 3).
The concentrations of SiO
2, B, and F do not display significant variation among the above four types of geothermal waters (
Figure 2). The SiO
2 concentrations vary from 42.0 mg/L to 367.1 mg/L. The highest SiO
2 concentrations were observed from the Yulingong drilling holes. The F concentrations had a range from 0.6 mg/L to 10 mg/L. The boron concentration (B) are from 0.3 mg/L to 6.6 mg/L. The small variations of boron concentration imply minor involvements of magmatic composition.
The δ
18O and δD compositions (vs. Vienna-Standard Mean Ocean Water (VSMOW)) of the sampled waters vary from −9.3‰ to −11.4‰ and from −63.1‰ to −75.0‰, respectively (
Supplementary Material: Table S1). The waters in the borate exploration wells were slightly depleted in these two isotopic compositions.
5. Discussion
5.1. Processes Controlling the Major Ionic Compositions
5.1.1. Correlations of Major Ions
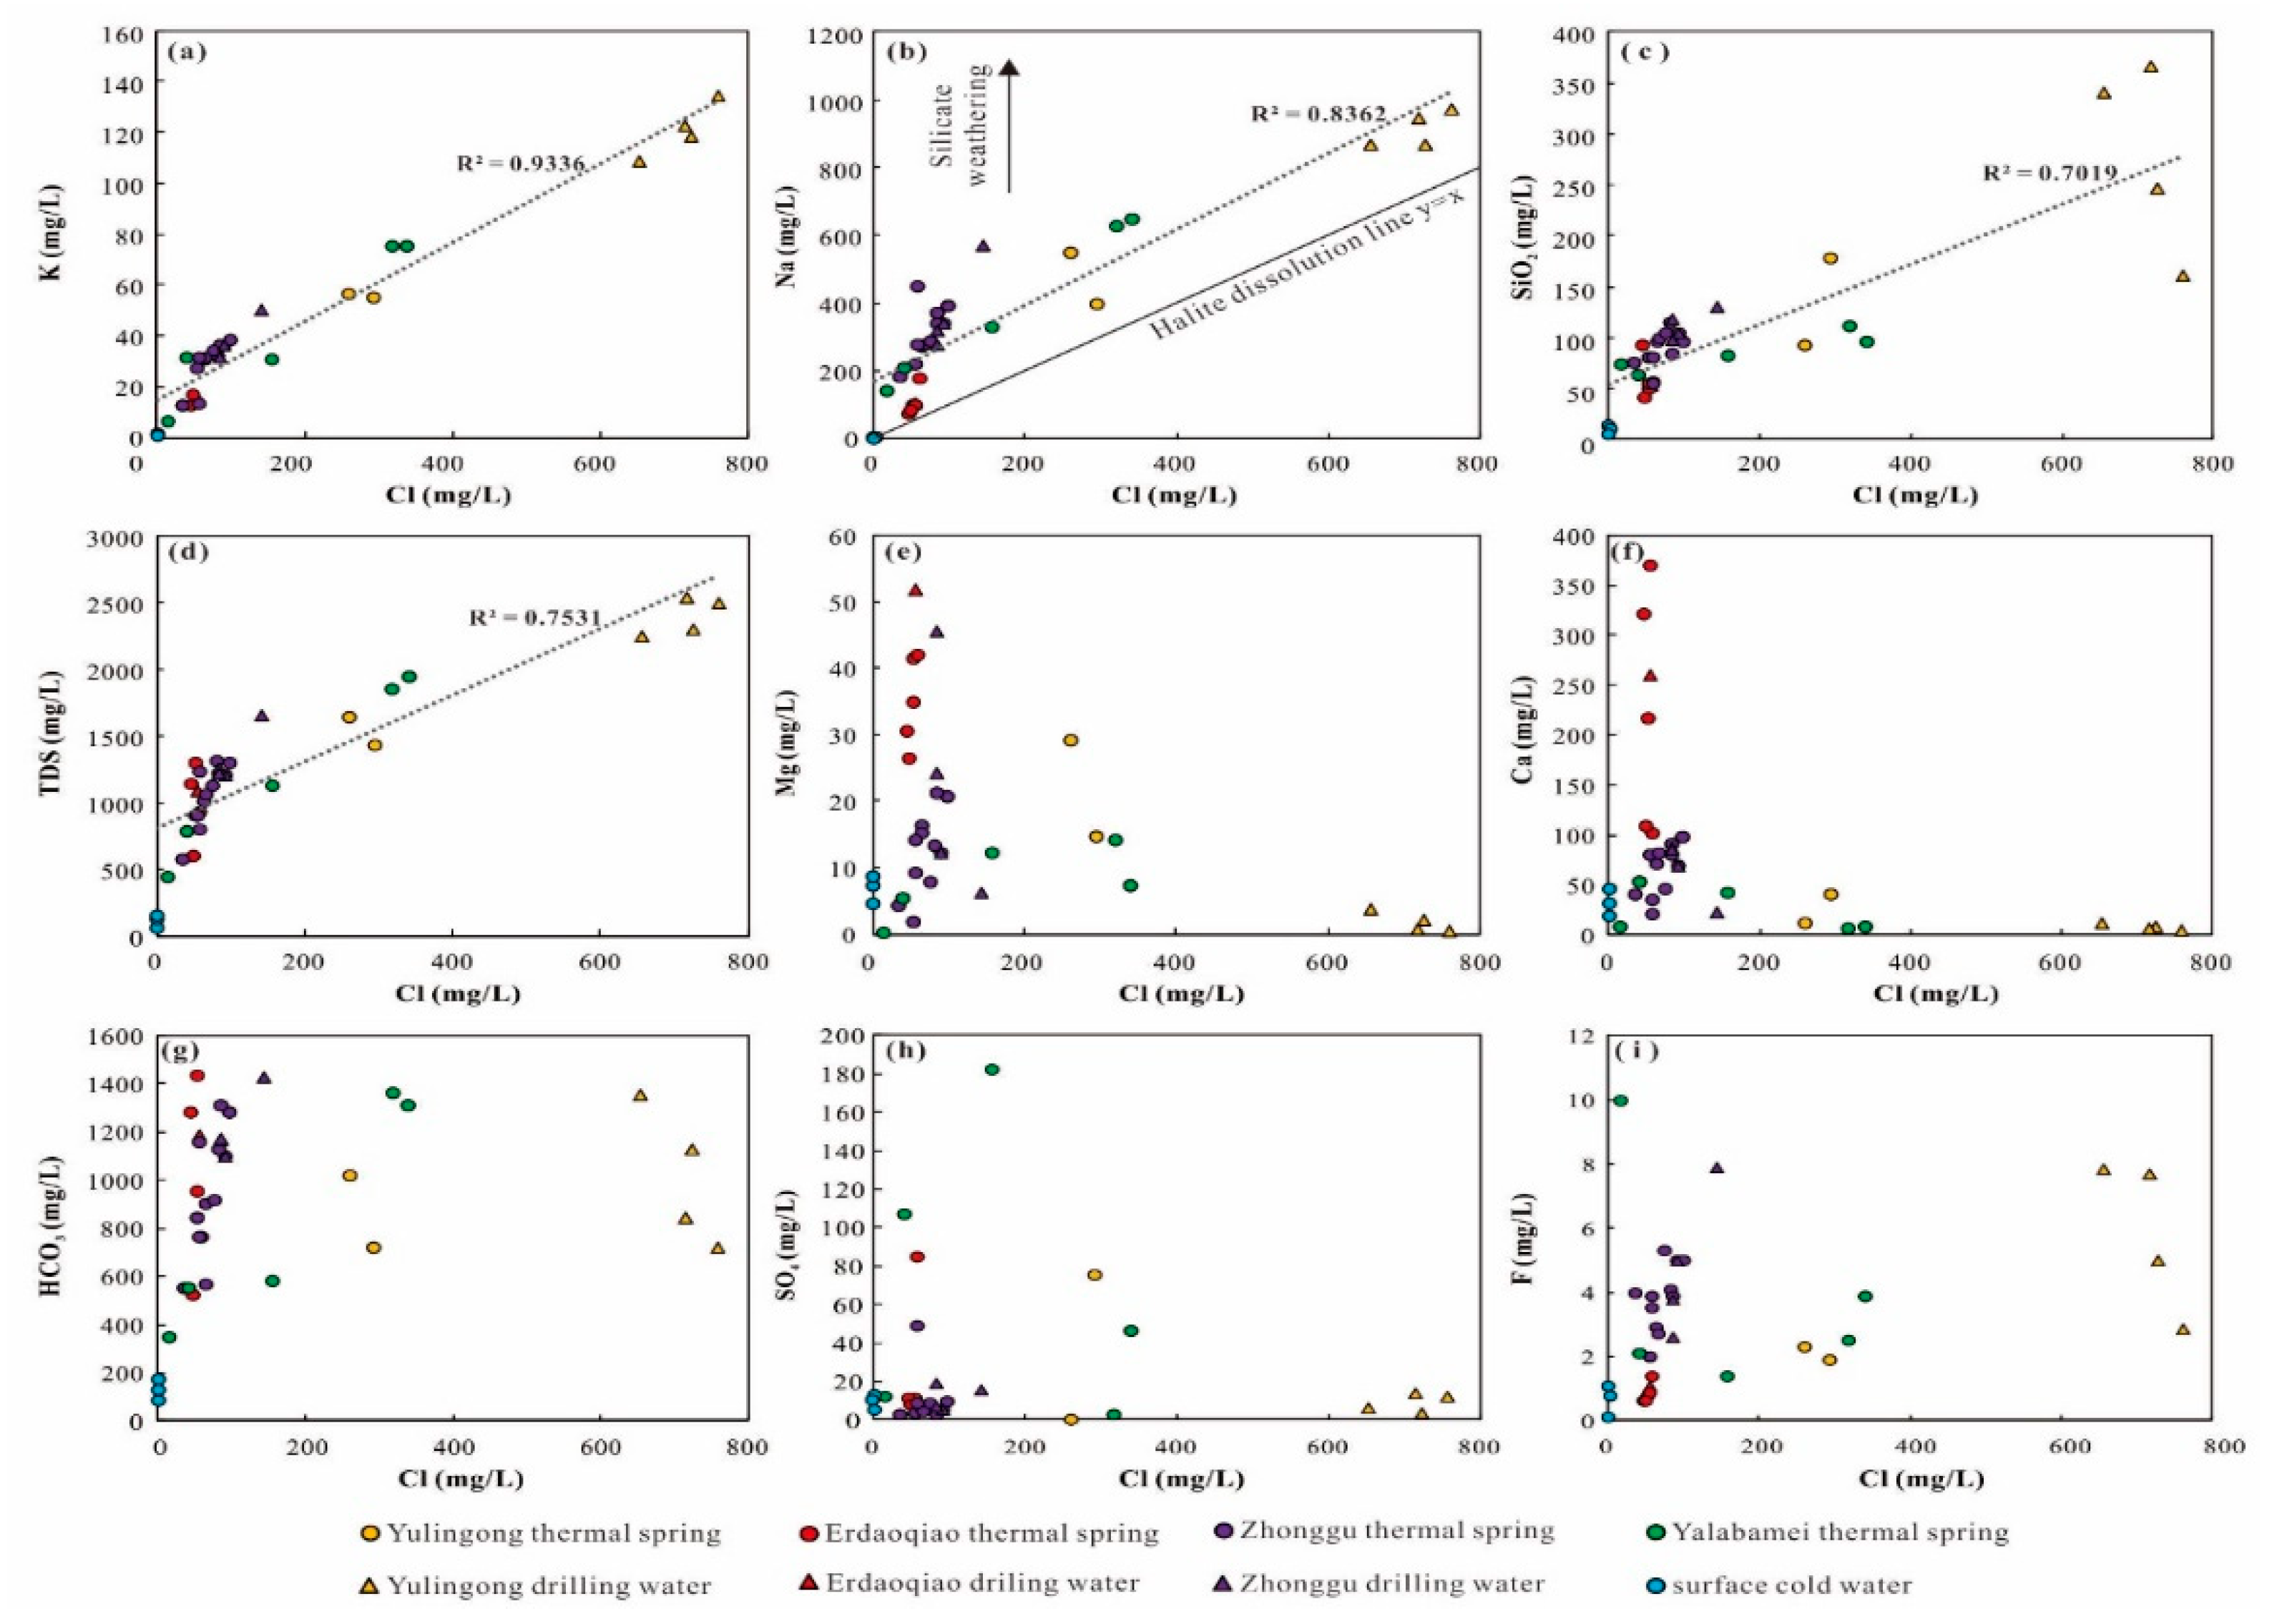
Among these major ions, Cl used to be employed as a useful tool to trace the geochemical process due to its conservative affinity. Even in the condition of high temperatures and high pressures, the Cl concentration would hardly be altered by water–rock interactions and adsorption of rock-forming minerals. Therefore, the relationship between the Cl and other major ions is feasible to clarify the hydrochemical processes in the circulation of geothermal waters. In
Figure 4, geothermal drill samples are generally around or higher than geothermal spring samples, while cold water samples concentrated around zero with no linear trend. It is observed that Cl are well correlated with K (squared regression coefficients = 0.9336) (
Figure 4a). Geothermal waters are believable to be mixing products between surface cold water and a deep geothermal fluid. Linear relationships between Na or SiO
2 and Cl concentrations also existed in (
Figure 4b,c). However, in comparison, squared regression coefficients (0.8362 and 0.7019) of Na or SiO
2 vs. Cl are obviously lower than that for K vs. Cl. Considering this, Na and SiO
2 would also be derived from the mixture but may be affected by other processes (e.g., water–rock reaction and ion exchange). The plots of geothermal spring samples above the line of halite dissolution further suggest Na and Si were originated from silicate dissolution (
Figure 4a).
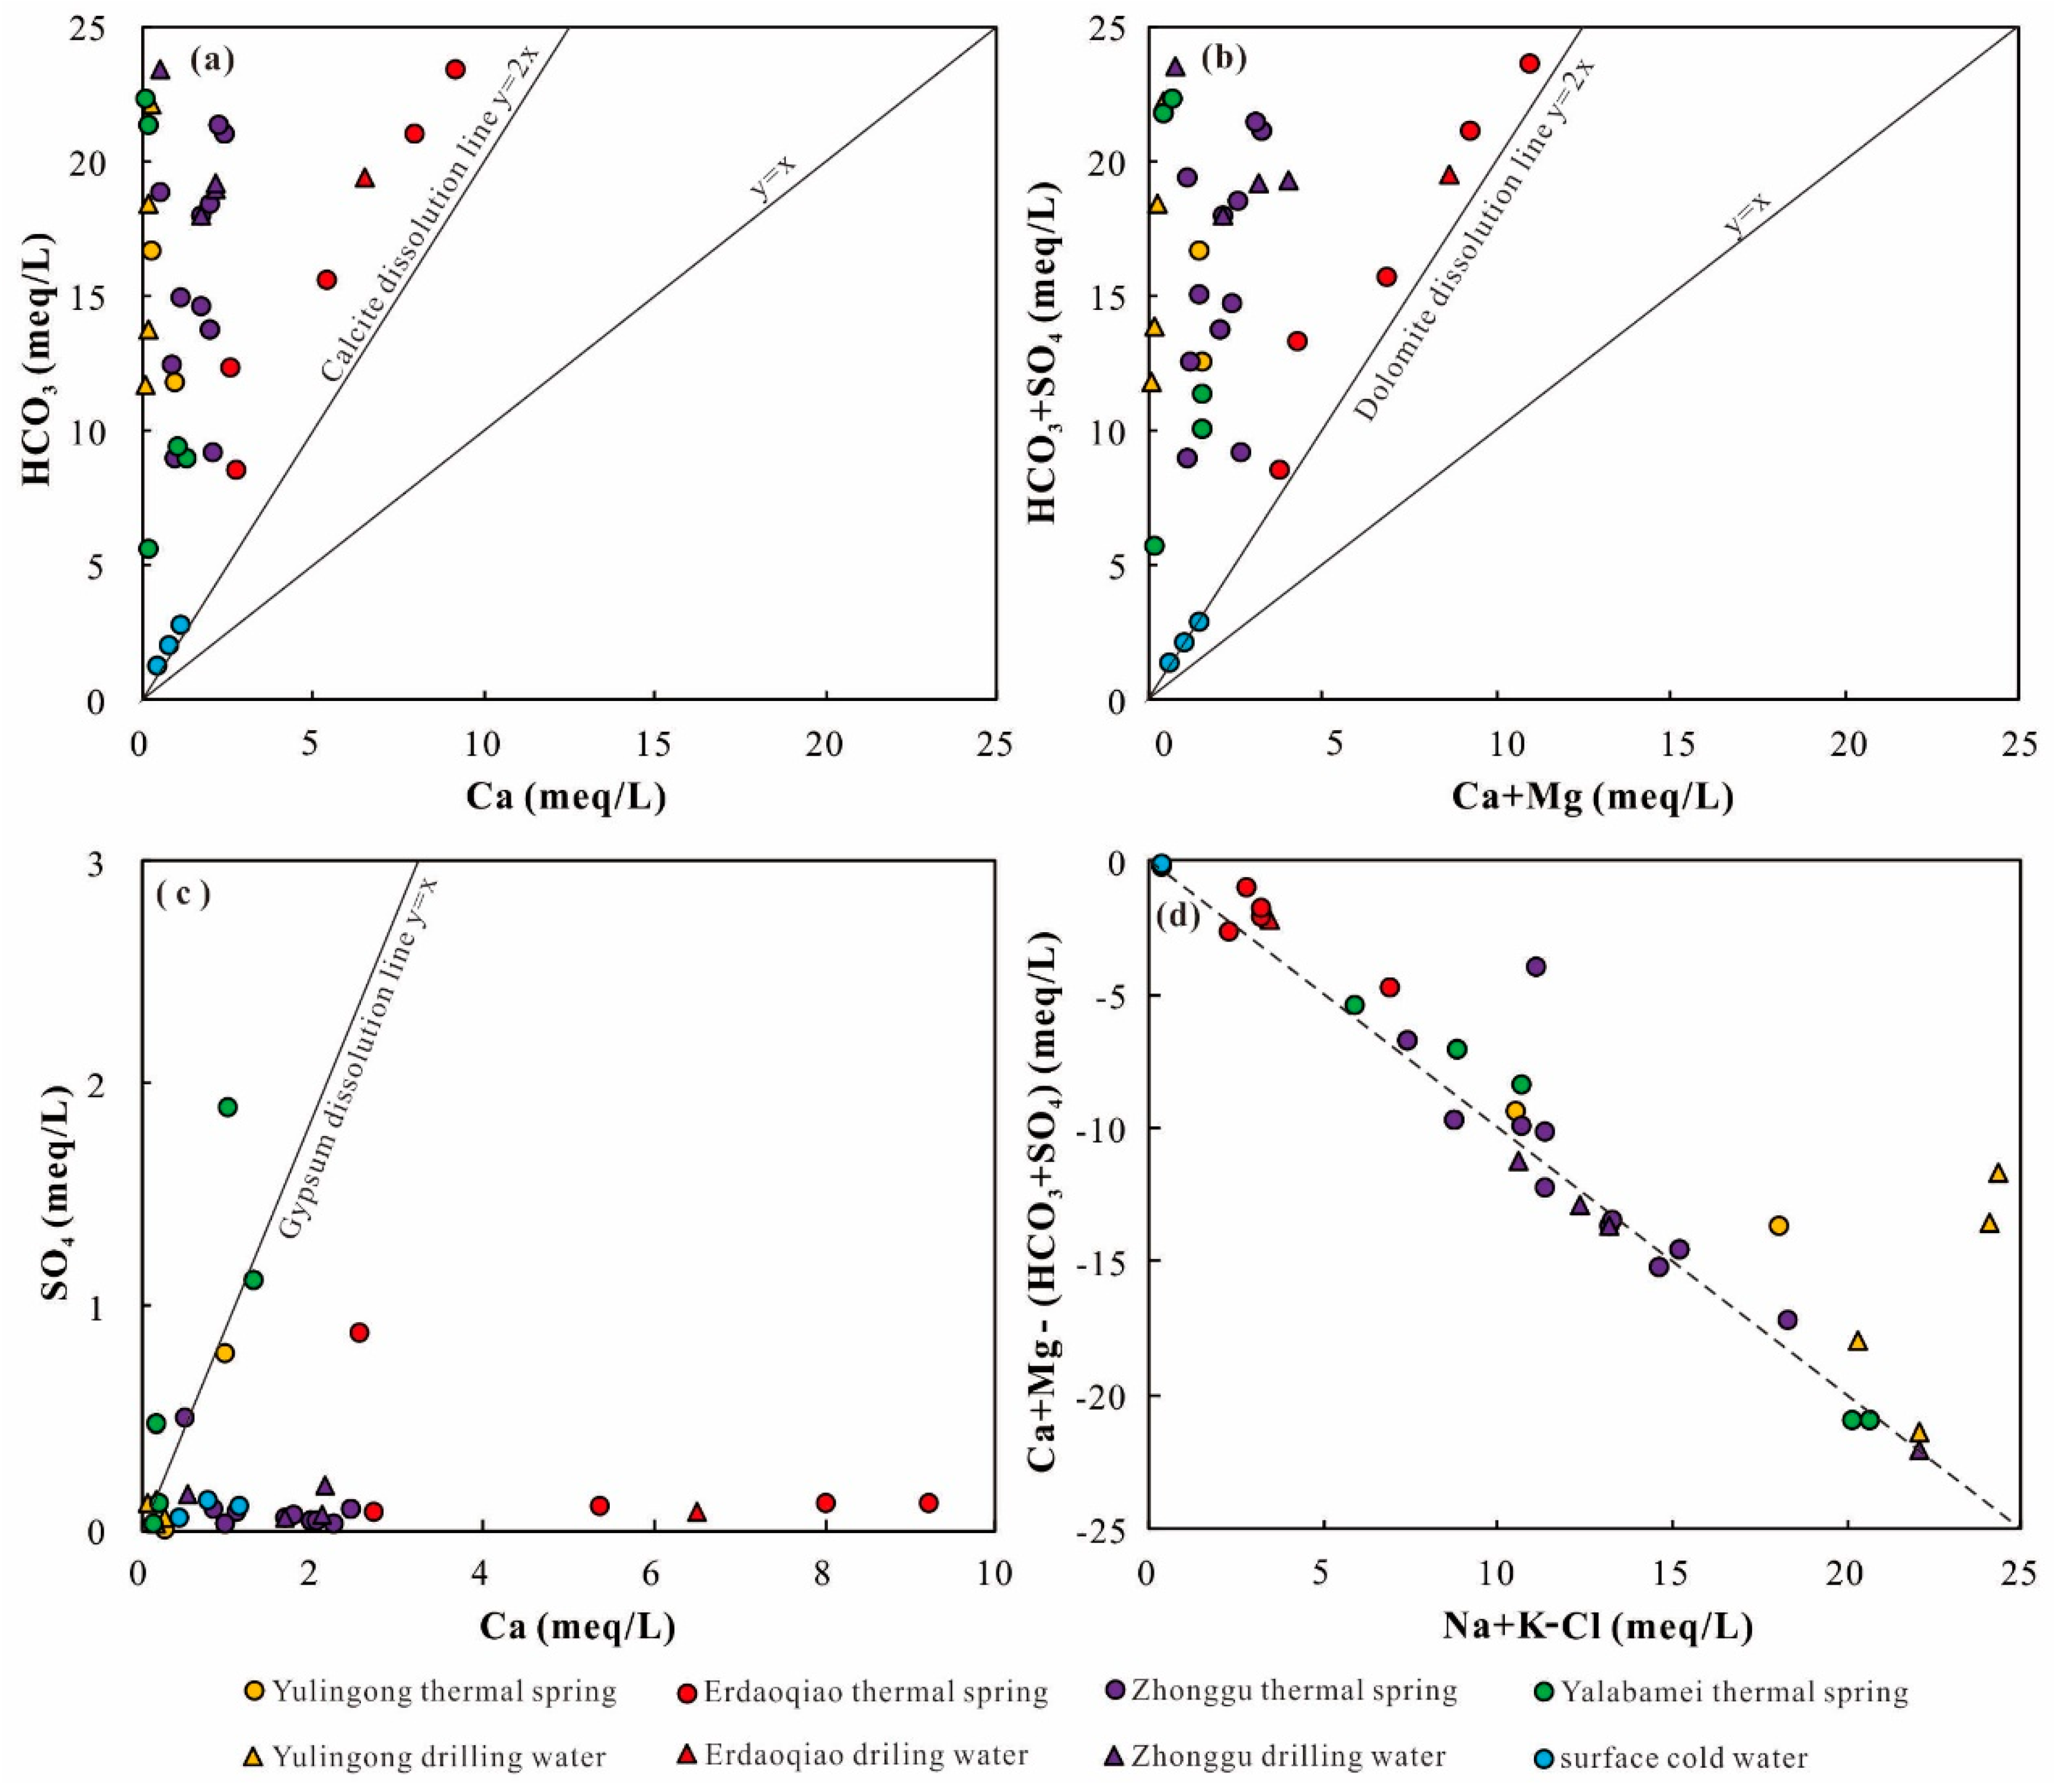
In addition, the plots in the Ca, Mg, HCO
3, SO
4, and F vs. Cl diagrams present scattered distributions (
Figure 4e–i). Hence, these ions are suggested to be derived from multiple sources. When the Ca
2+/HCO
3− and (Ca
2+ + Mg
2+)/HCO
3− molar ratios are equal to 0.5, those ions are attributed to the dissolution of calcite and dolomite (Equations (1) and (2)).
In
Figure 5a, the Ca
2+/HCO
3− and (Ca
2+ + Mg
2+)/HCO
3− molar ratios are lower than 0.5. The low Ca
2+ and enrichment of HCO
3− are attributed to ion exchange from silicates dissolution.
When the Ca
2+ and SO4
2− are derived from dissolution of gypsum, the ratio between Ca
2+ and SO
42− would be 1:1 (Equation (3)).
In this study, most of the samples are plotted distinctly below 1:1 line in Ca
2+ versus SO
42− diagram (
Figure 5c), indicating the significantly higher concentration of Ca
2+. Hence, the enriched Ca
2+ would be produced from the dissolution of carbonates and silicate minerals.
In the (Na + K) − Cl and (Ca + Mg) − (SO
4 + HCO
3) diagram, most of the samples are plotted along the 1:1 line. Hence, the hydrochemical composition of the samples are controlled by a cation-exchange process that is the result of silicate dissolution (
Figure 5d).
5.1.2. Principle Component Analysis
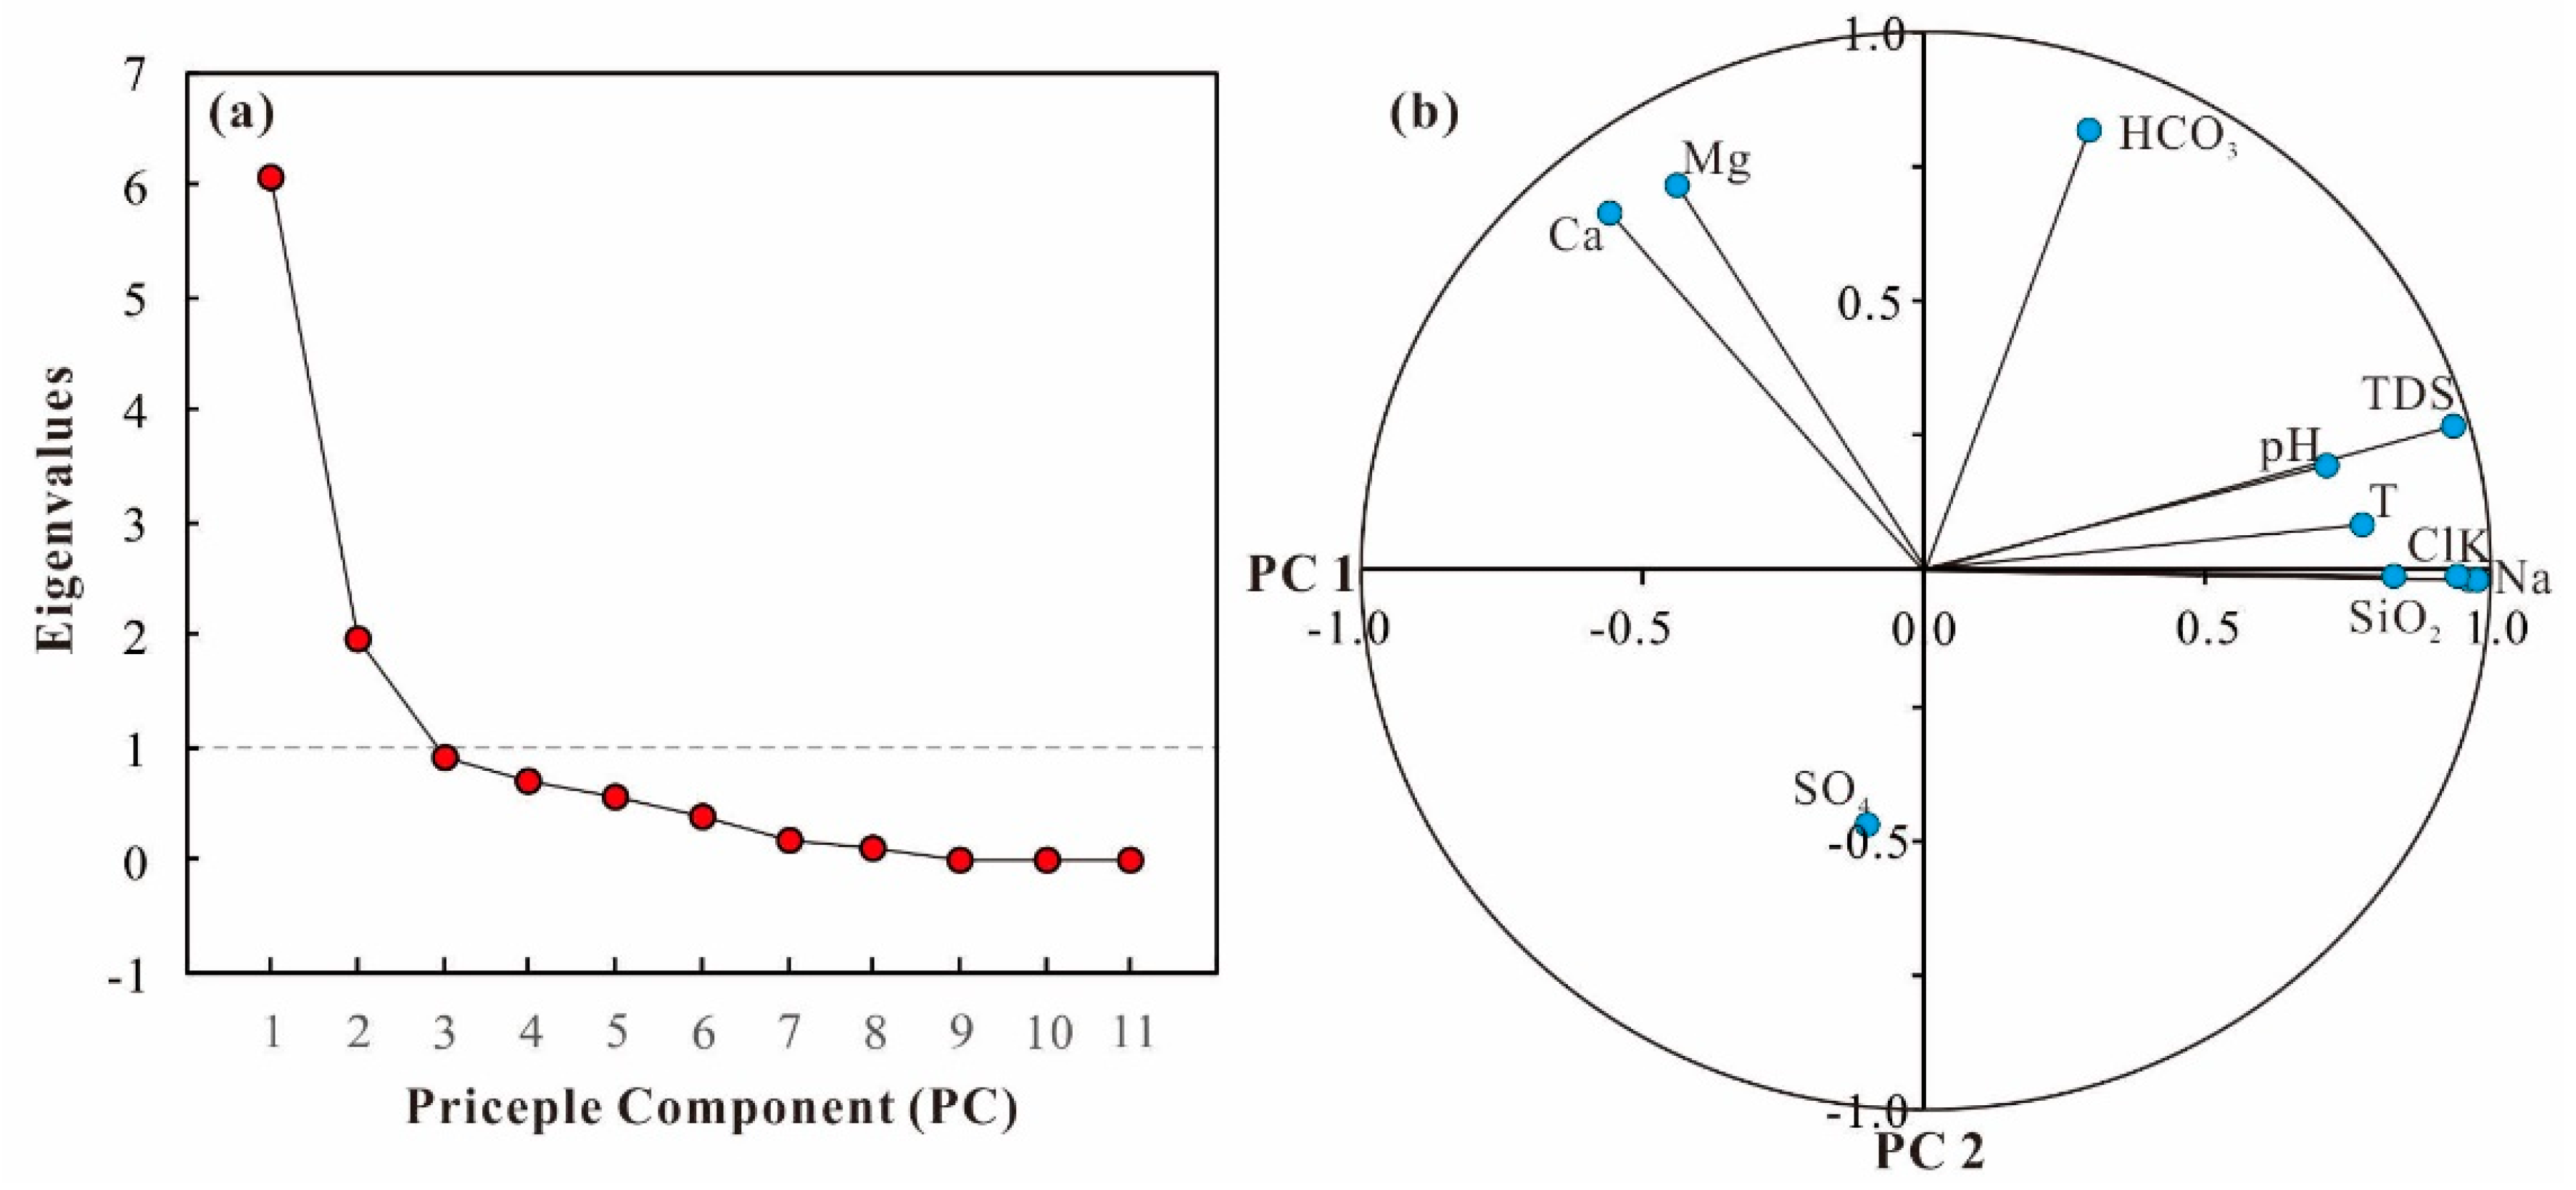
Hydrochemical parameters including pH and major ions were used for principal component analysis, which is helpful for tracing the sources of those ions [
16,
17]. The results of the principal component analysis include eigenvalue, percentage of variance, the cumulative percentage of variance, and the factor loading, presented in
Table 1. Scree plots for groundwater samples showed a distinct change of slope after the second factor (
Figure 6a). Using the Kaiser Criterion and scree plot, two principal components (PCs) of eigenvalues greater than 1 have been obtained, accounting for a total variance of 73.084%. The PC1 was responsible for 55.250% of the total variance and has a strong loading of TDS, Na
+, K
+, Cl
− and SiO
2 (
Figure 6b). This factor indicates the general trend of hydrochemical characteristics, probably dominated by the mixture between cold surface water, deep geothermal water, and the dissolution of silicate minerals. The PC2 explained 17.835% of the total variance and has a medium positive loading of Ca
2+, Mg
2+, and HCO
3− (
Figure 6b). As such, PC2 could be linked to the dissolution of limestone and dolomite.
Based on the analyses of correlations of major ions and the principal component analysis, it is possible to constrain the sources of different water types in the XFZ. The Na–HCO3–Cl type geothermal waters would be derived from the dissolution of silicate rocks with the mixing of deep fluids. Na–HCO3 type geothermal waters are the products from the dissolution of silicate rocks, while Ca–Na–HCO3 type geothermal waters are originated from the dissolution of silicate and carbonate rocks.
5.2. Geothermometry
Geothermometers are used to estimate reservoir temperatures for most systems. The geothermometers are based on temperature-dependent, water–rock equilibria that control the chemical and isotopic composition of geothermal waters. The temperature of the reservoir associated with the geothermal system of the XFS was estimated using both classical geothermometers (cation and silica), the silicon-enthalpy graphic method, and geothermometrical modeling.
5.2.1. Classical Geothermometry
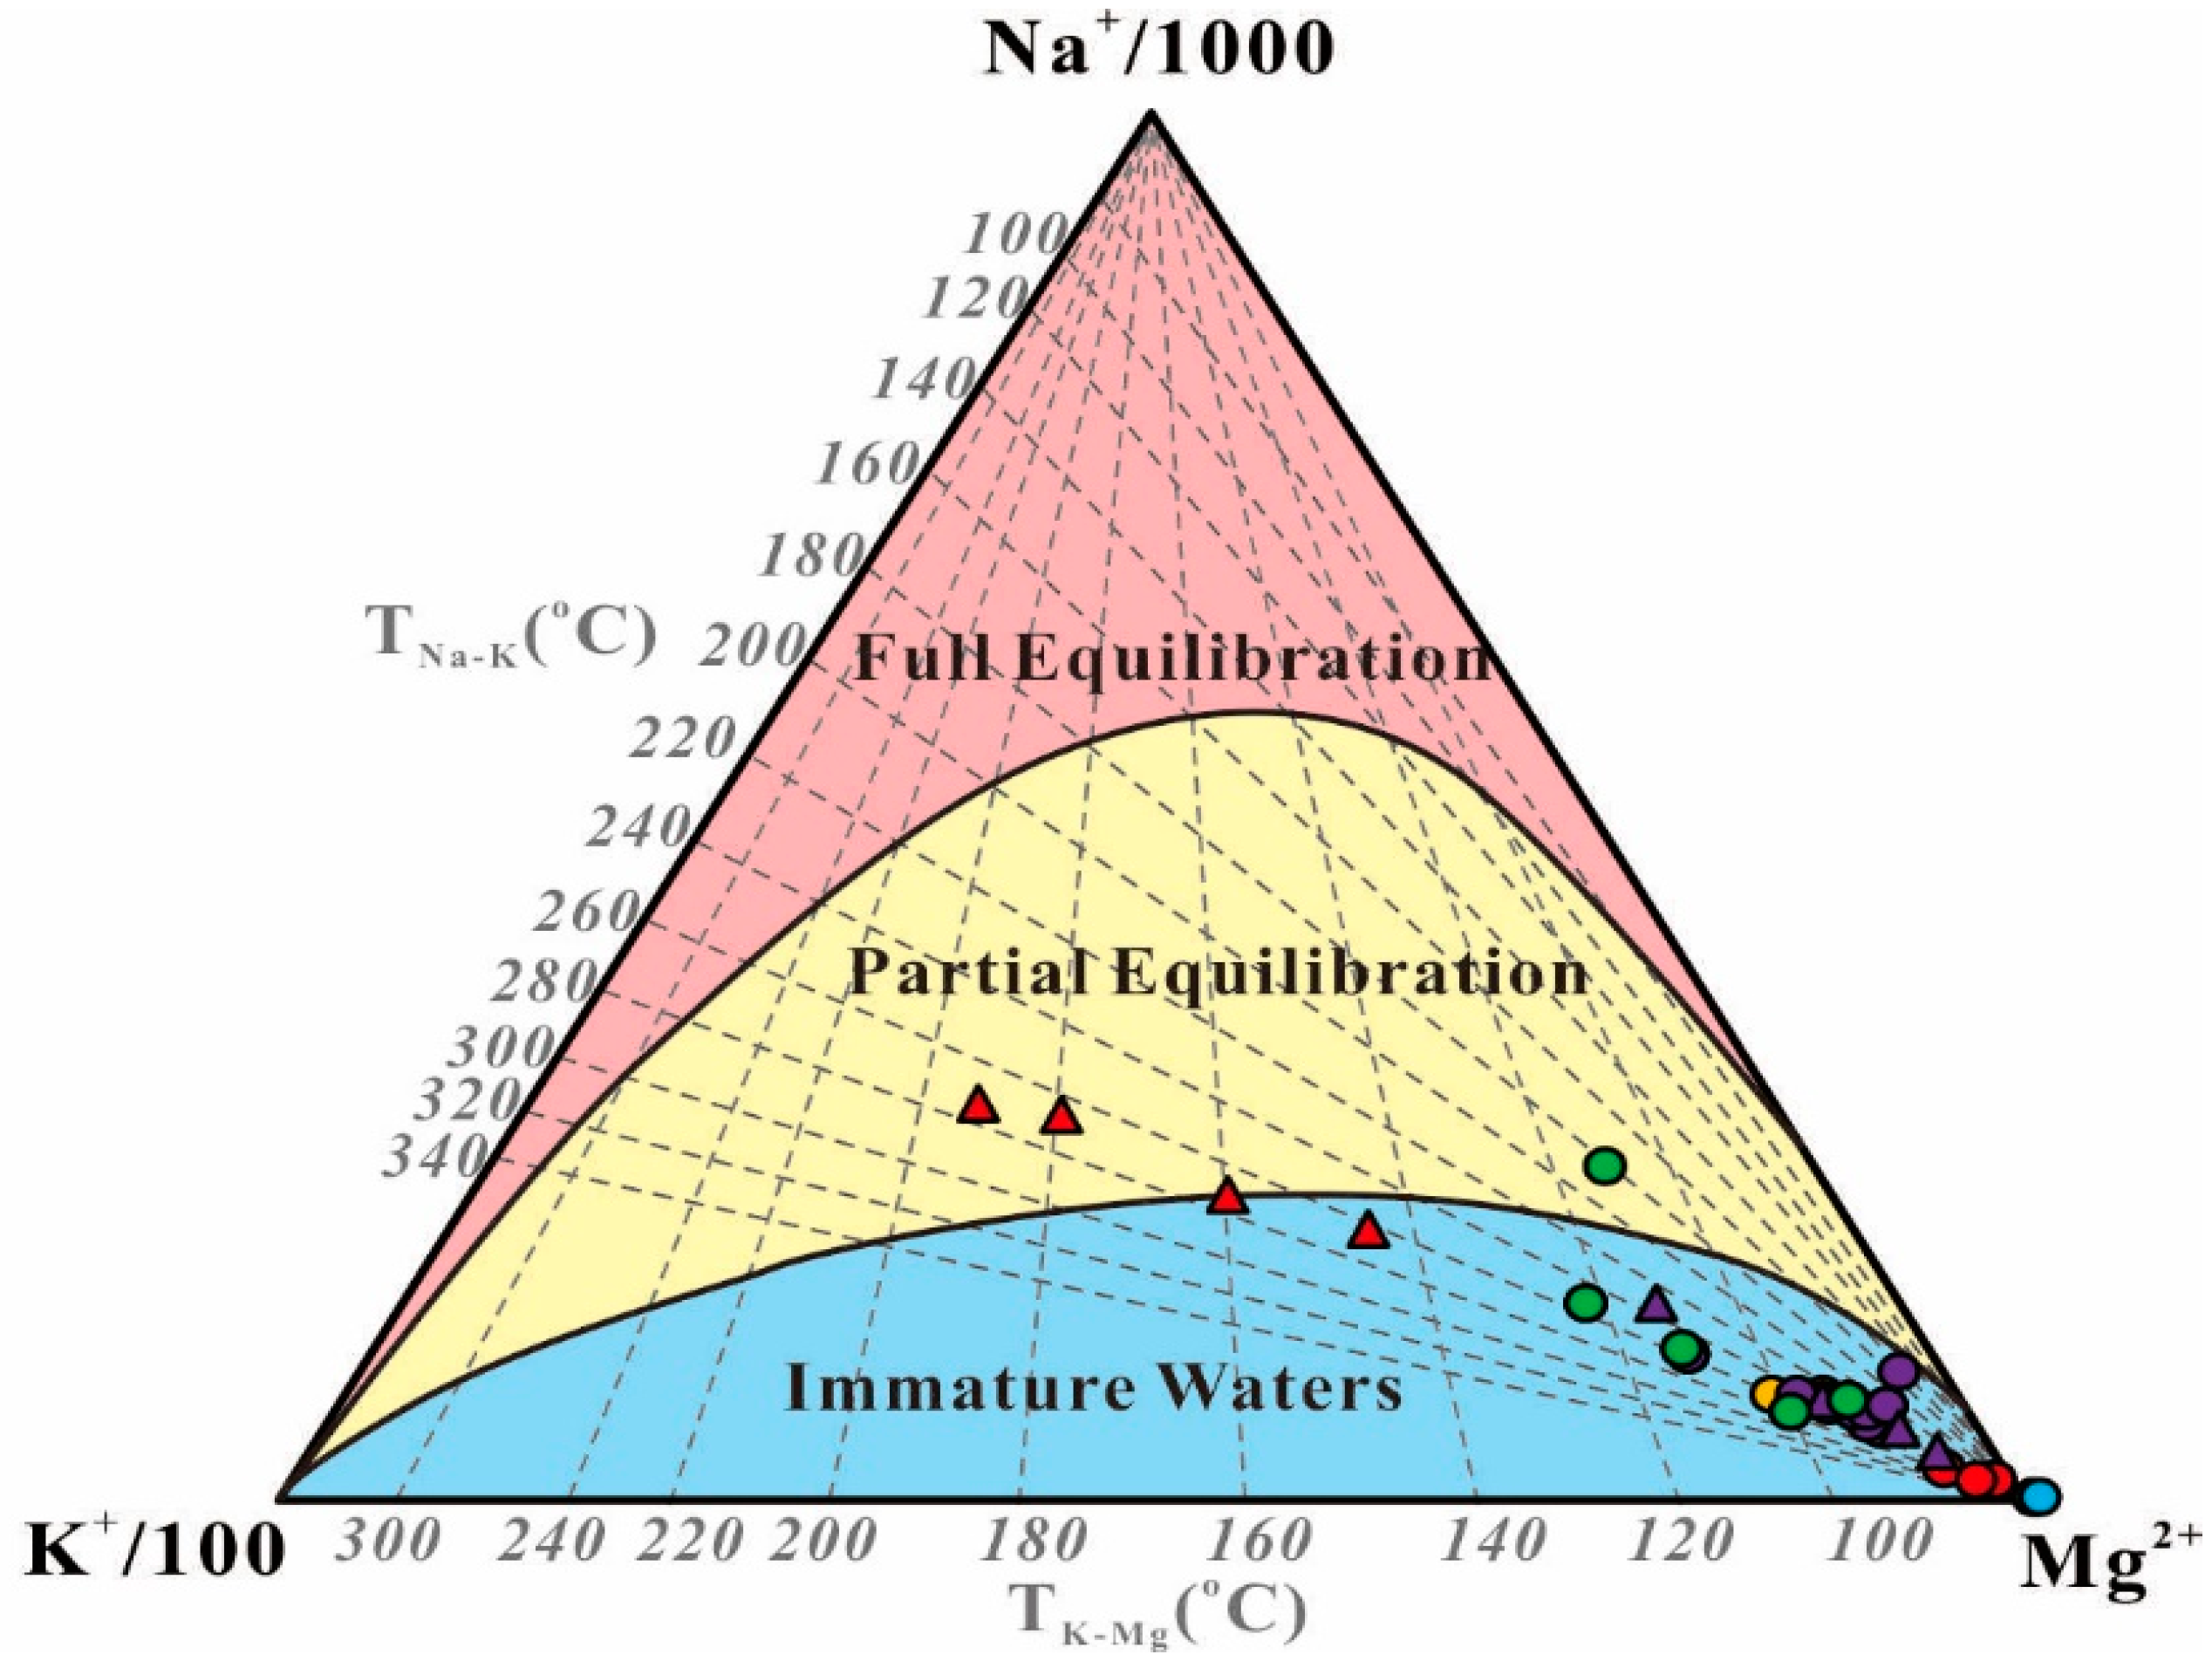
The classic chemical geothermometers (e.g., cation and silica) are applicable for the estimation of the equilibrium temperature in geothermal reservoirs. Considering this, cation and silica geothermometers were conducted to calculate the equilibrium temperatures as listed in
Table S1. However, the results from the cation geothermometers have a great range and have a large variation with wellhead temperatures. In the Na–K–Mg ternary diagram, most of the samples are located in the area of immature water, whereas only the samples of the Yulingong deep wells are found in semi-mature fields (
Figure 7). The diagram demonstrates that none of the geothermal spring waters have reached full equilibrium with the host. Therefore, Silica geothermometers are more applicable to the geothermal spring waters than cation geothermometers in this study [
28].
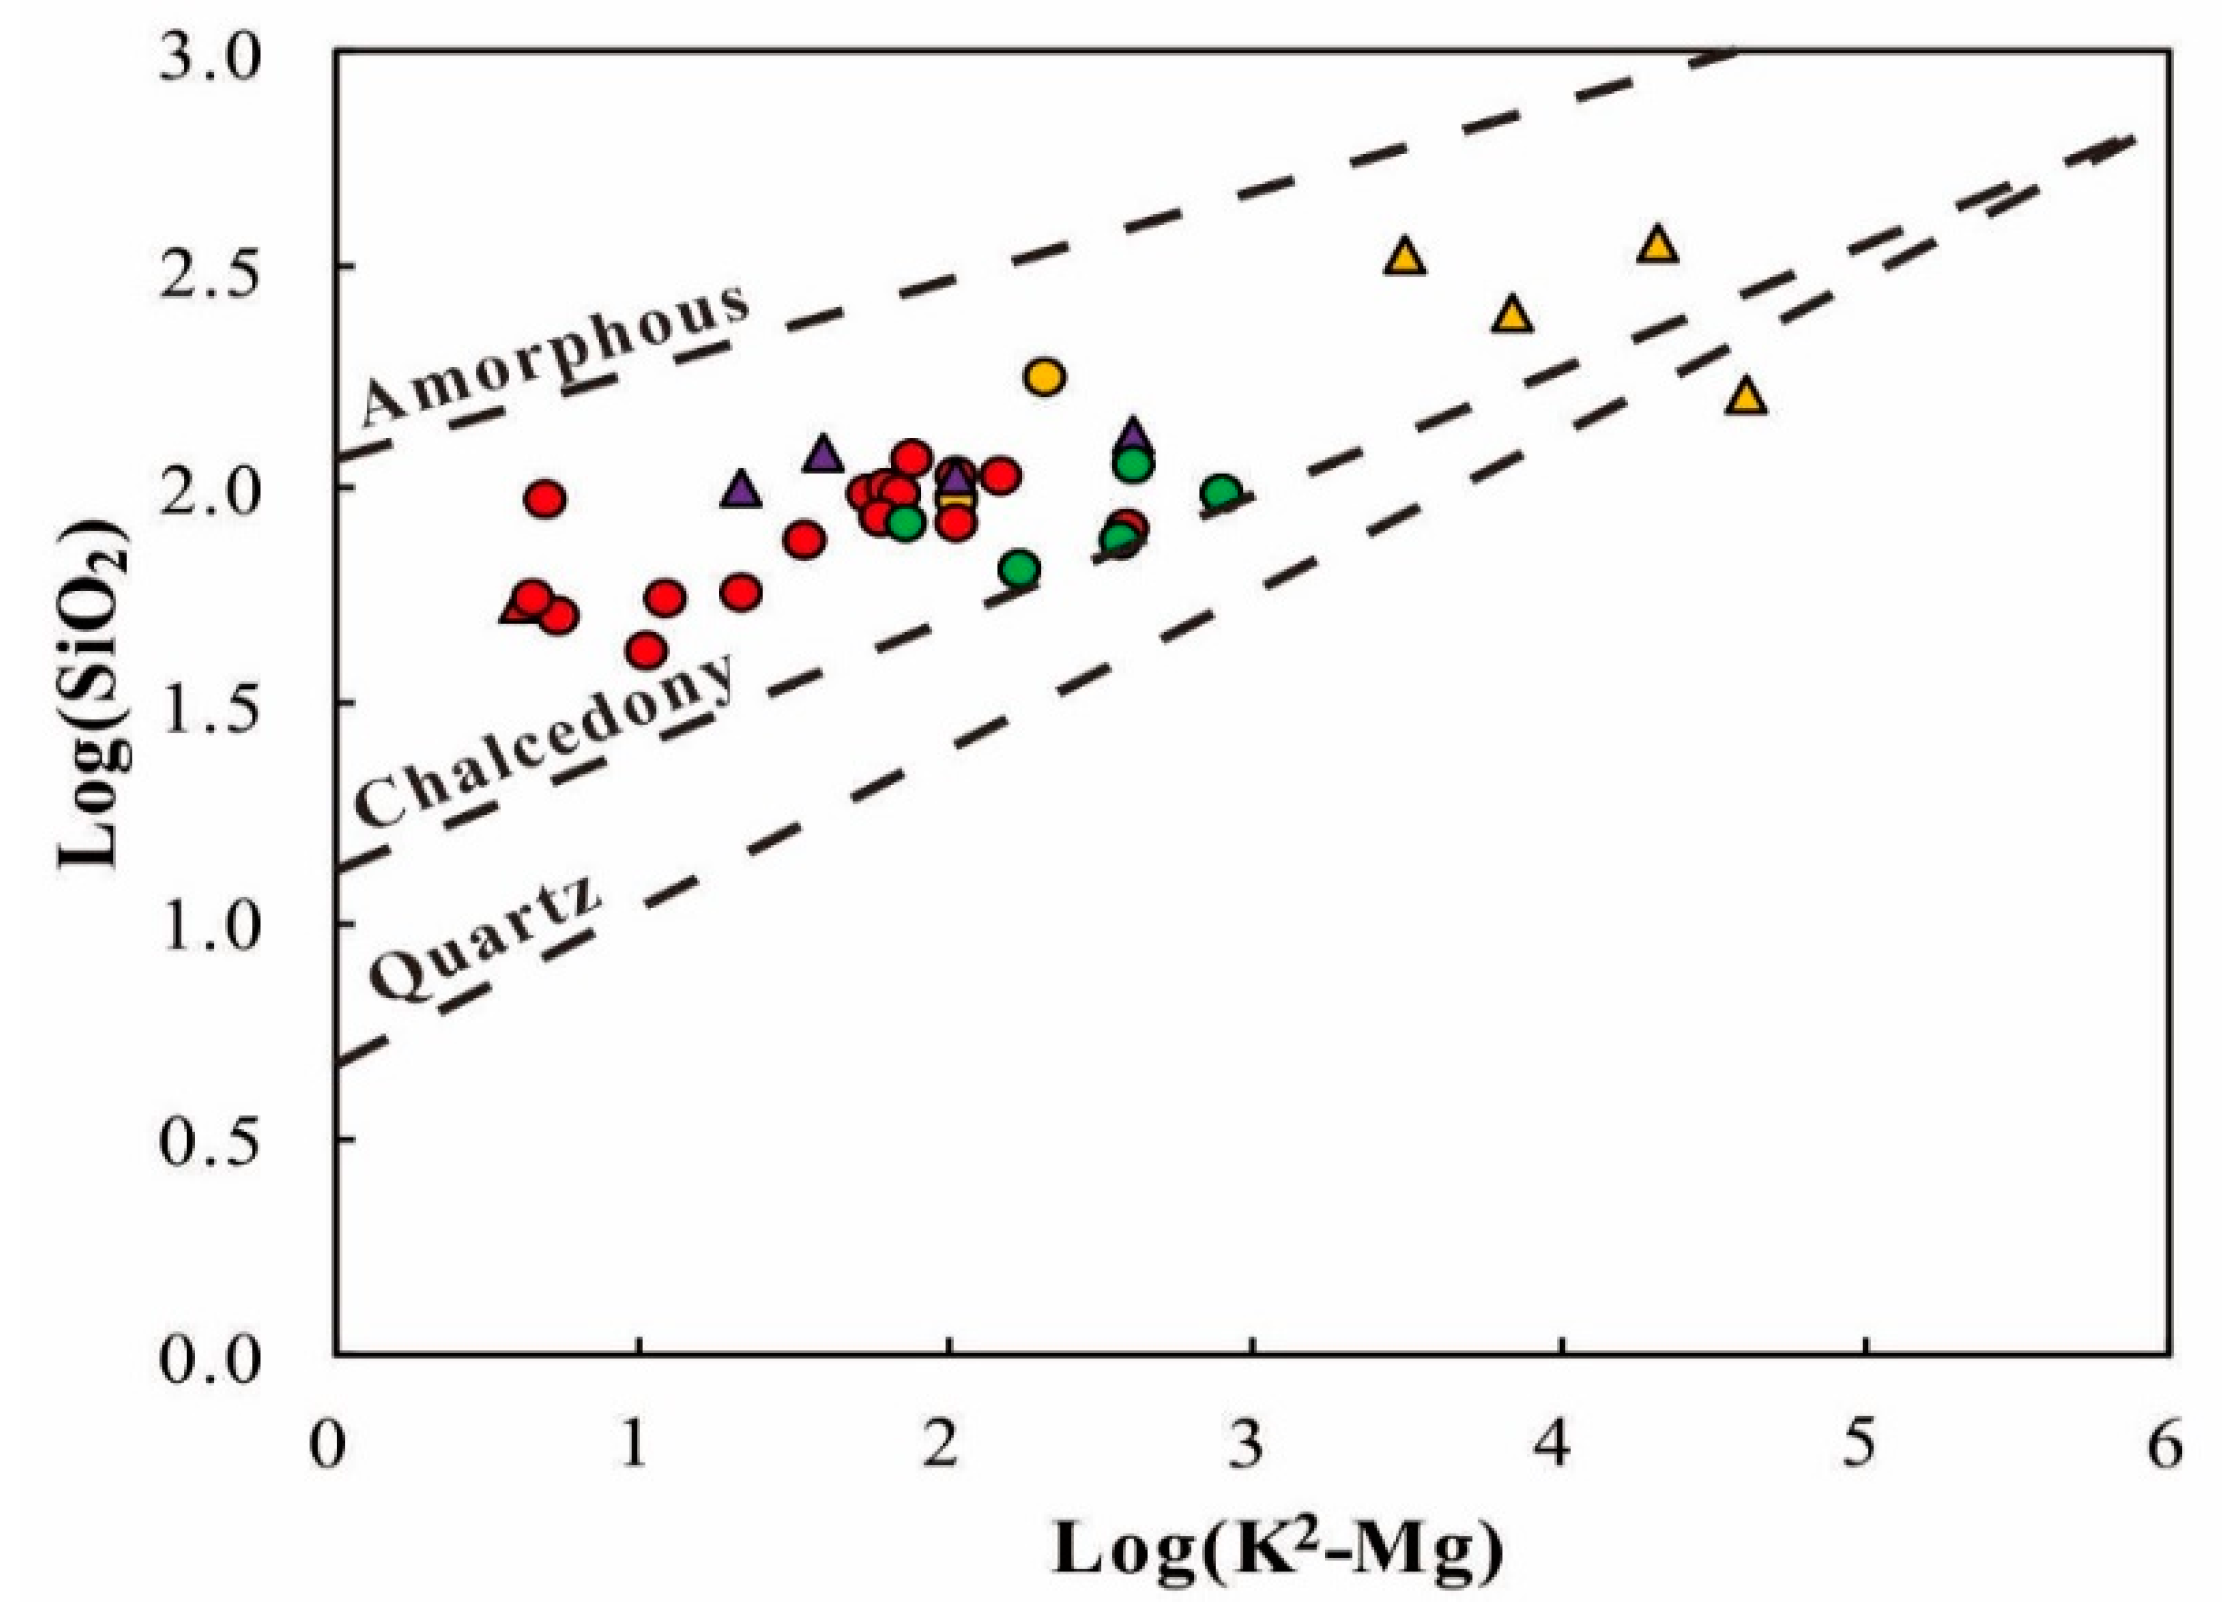
Silica geothermometry is based on the solubility of different silica species (mostly e.g., quartz, chalcedony) in water as a function of reservoir temperature. In
Table S1 (see
Supplementary Material) estimated reservoir temperatures in the study area using various silica geothermometers are presented. The plots in the log (K
2/Mg) versus the log(SiO
2) diagram shows most of the samples are distributed above the chalcedony curve (
Figure 8). The chalcedony saturation indices higher than zero indicate the chalcedony is oversaturated. In addition, quartz geothermometers are used for relatively high temperatures, but at temperatures lower than 180 °C, chalcedony may control the dissolved silica concentration in geothermal fluids. The estimated reservoir temperatures are mostly lower than 180 °C. Consequently, the chalcedony geothermometer is the most appropriate silica geothermometer to estimate reservoir temperatures of the geothermal springs, yielding the results from 63–150 °C.
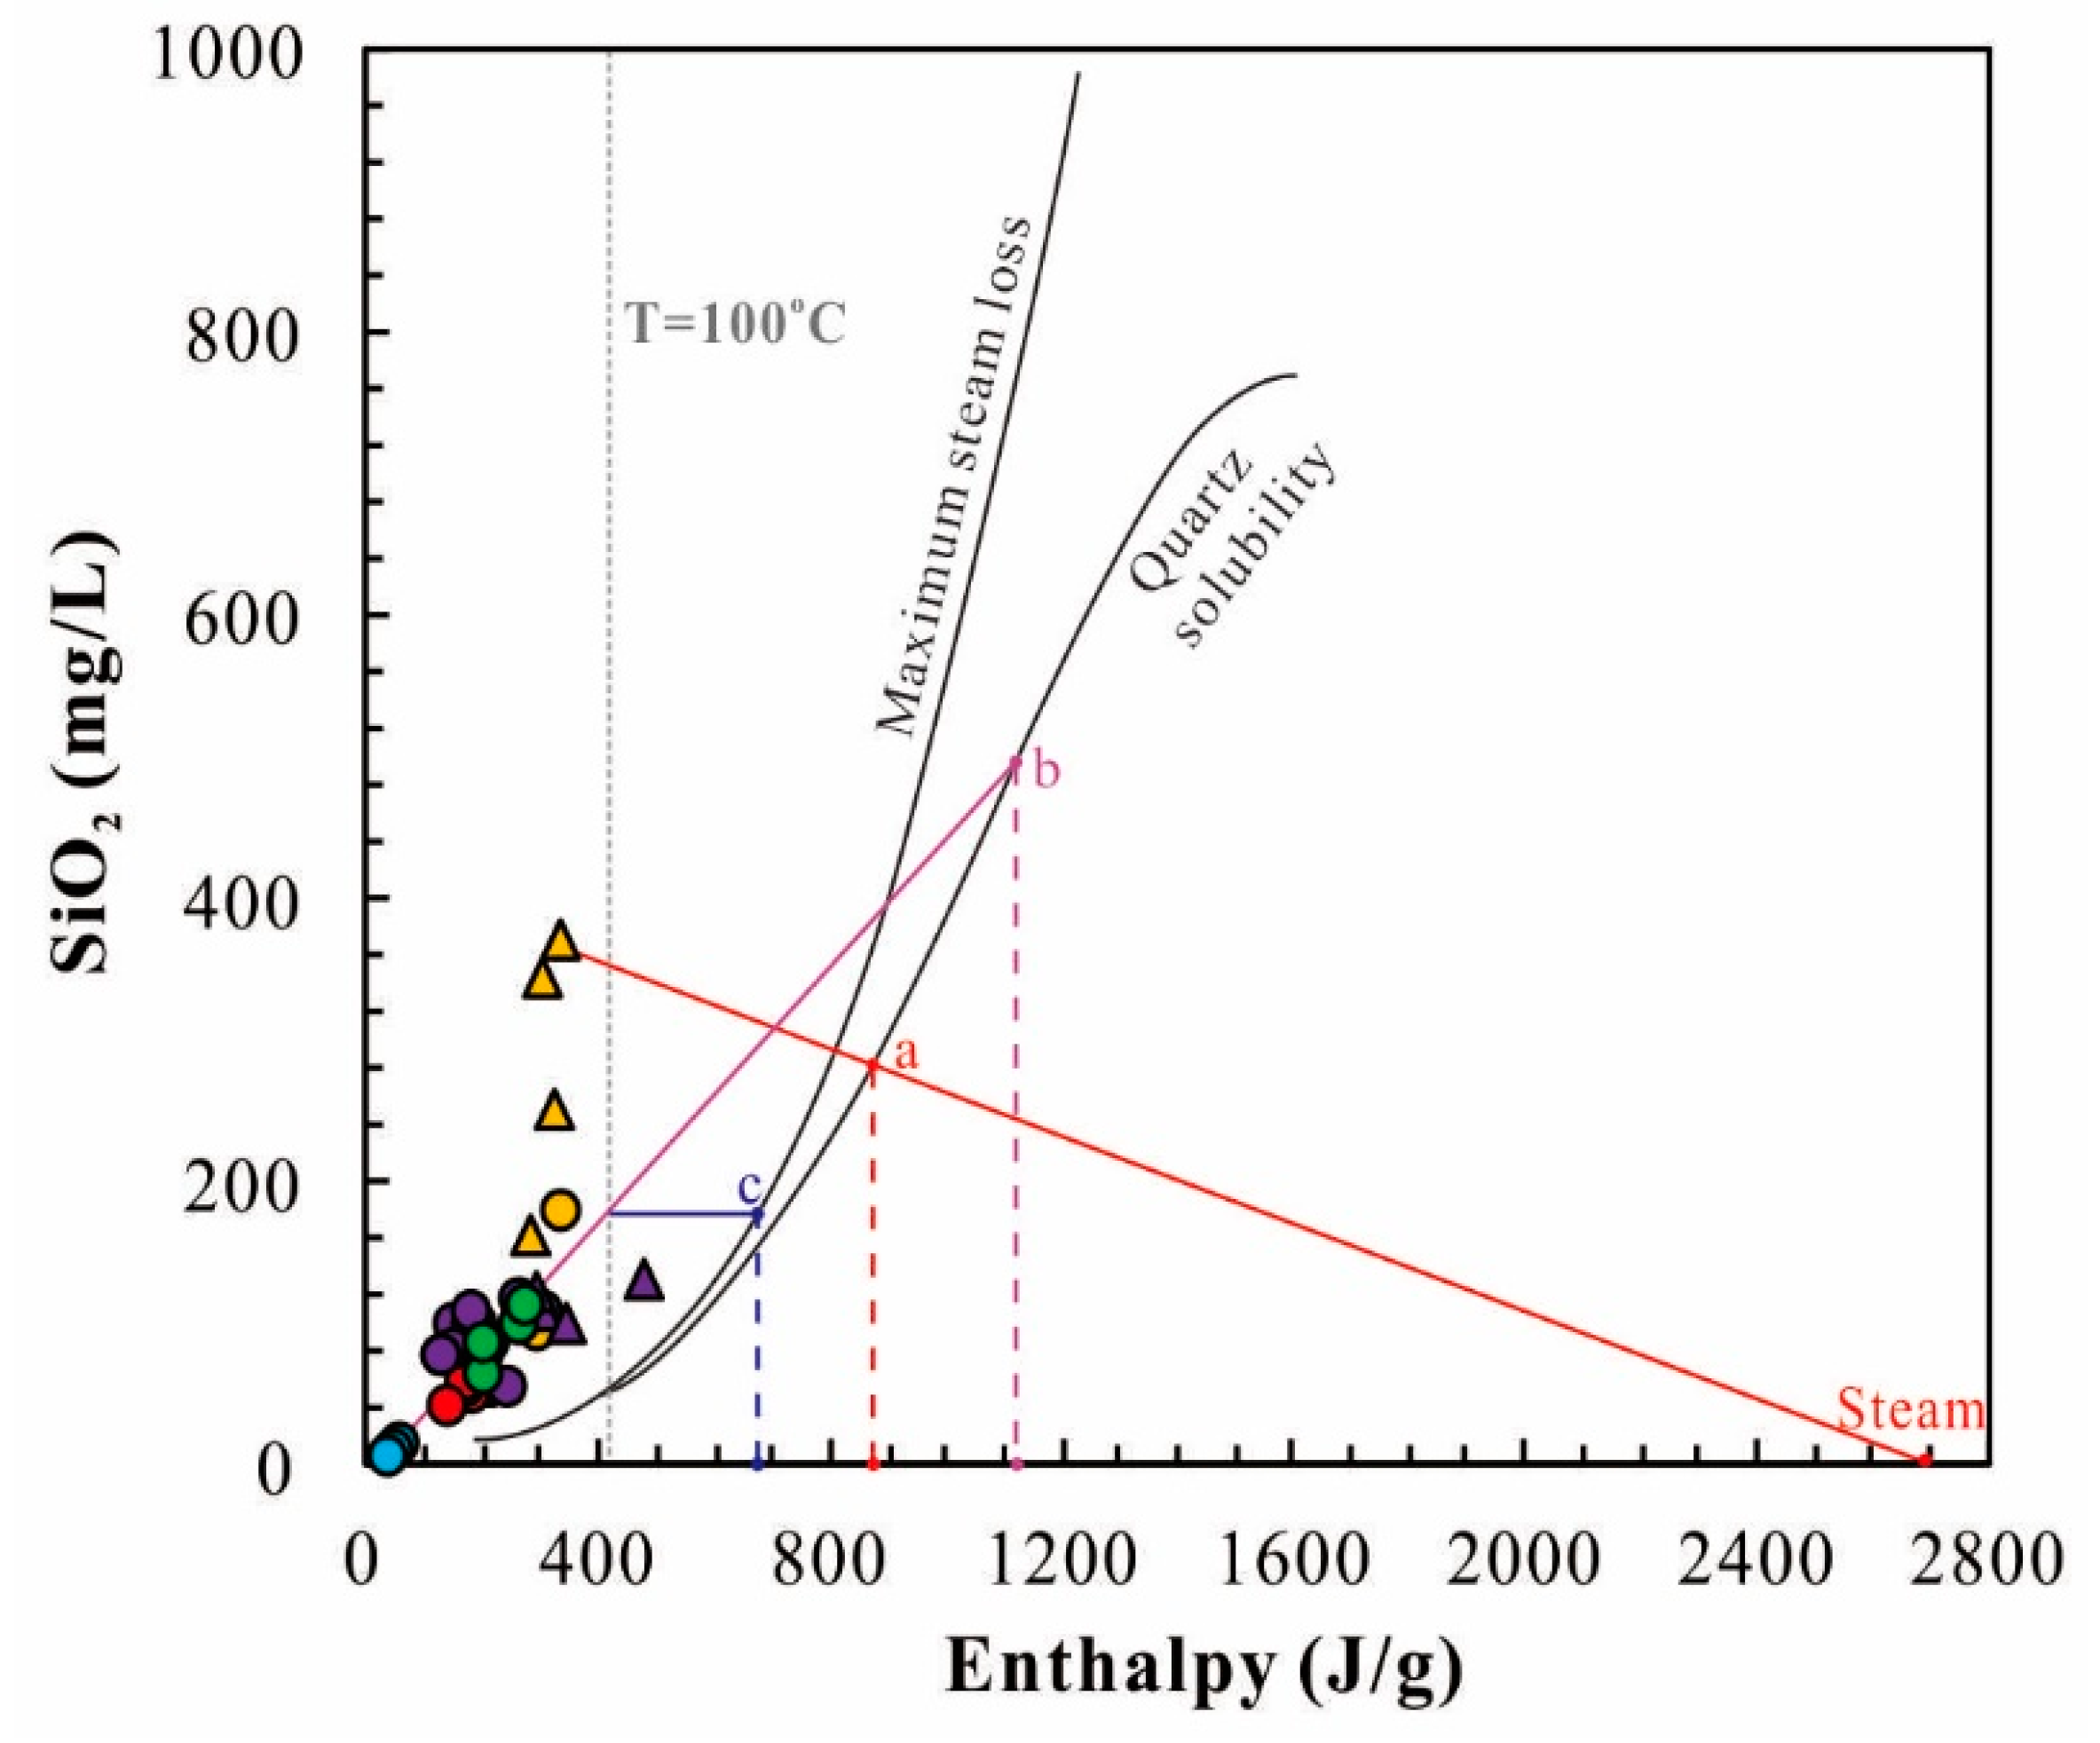
5.2.2. Silicon-Enthalpy Graphic Method
Due to the immature affinity of geothermal waters, the mixing of cold water should be considered in the calculation of reservoir temperature [
30]. As such, it is reliable to use for estimating the reservoir temperature of mixed geothermal water. In this study, cold and geothermal water samples are plotted in the silica enthalpy mixing model and the silica concentration and corresponding enthalpies are determined by the international steam tables [
31].
Figure 9 presents the silica-enthalpy mixing model according to chalcedony and quartz solubilities. Two end-member fluids have been given in this model: the cold water sample as one end member and the geothermal waters as the other end member. A red line linking deep geothermal well water and steam point intersected with the Quartz solubility line at the point a. The point stands for the enthalpies/temperatures for the deep. A purple line was drawn from cold water to the geothermal springs and intersected with the Quartz solubility line at the point b. The horizontal axis of the point b is the reservoir temperature in the condition of no steam separation before mixing. A horizontal blue line is drawn at the intersection between the purple line and the vertical line of the boiling point of water intersected with the maximum steam loss line at point c. The horizontal axis of the point c is the reservoir temperature in the condition of steam separation occurs before mixing. Based on the aforementioned above, the estimated reservoir temperatures of deep geothermal well water and geothermal springs are 208 °C, 265 °C (no steam separation before mixing), and 164 °C (maximum steam loss before mixing), respectively. It is noted that the temperature of deep geothermal well water is lower than that of the geothermal spring. This phenomenon would be attributed to CO
2 degassing that leads to the SiO
2 reprecipitate. The reservoir temperatures (63–150 °C) estimated by the chalcedony geothermometer are compatible with the temperature (164 °C) in the condition of maximum steam loss before mixing. Therefore, the reservoir temperature determined by the silica-enthalpy mixing model is approximately 164 °C when no steam separation occurred before mixing. In addition, the mixture ratio of cold water can be estimated by the length of point b and the end-member of the geothermal spring against the length of point b and the end-member of cold water (
Figure 9). As such, the mixture ratios of cold water are about 70–90%.
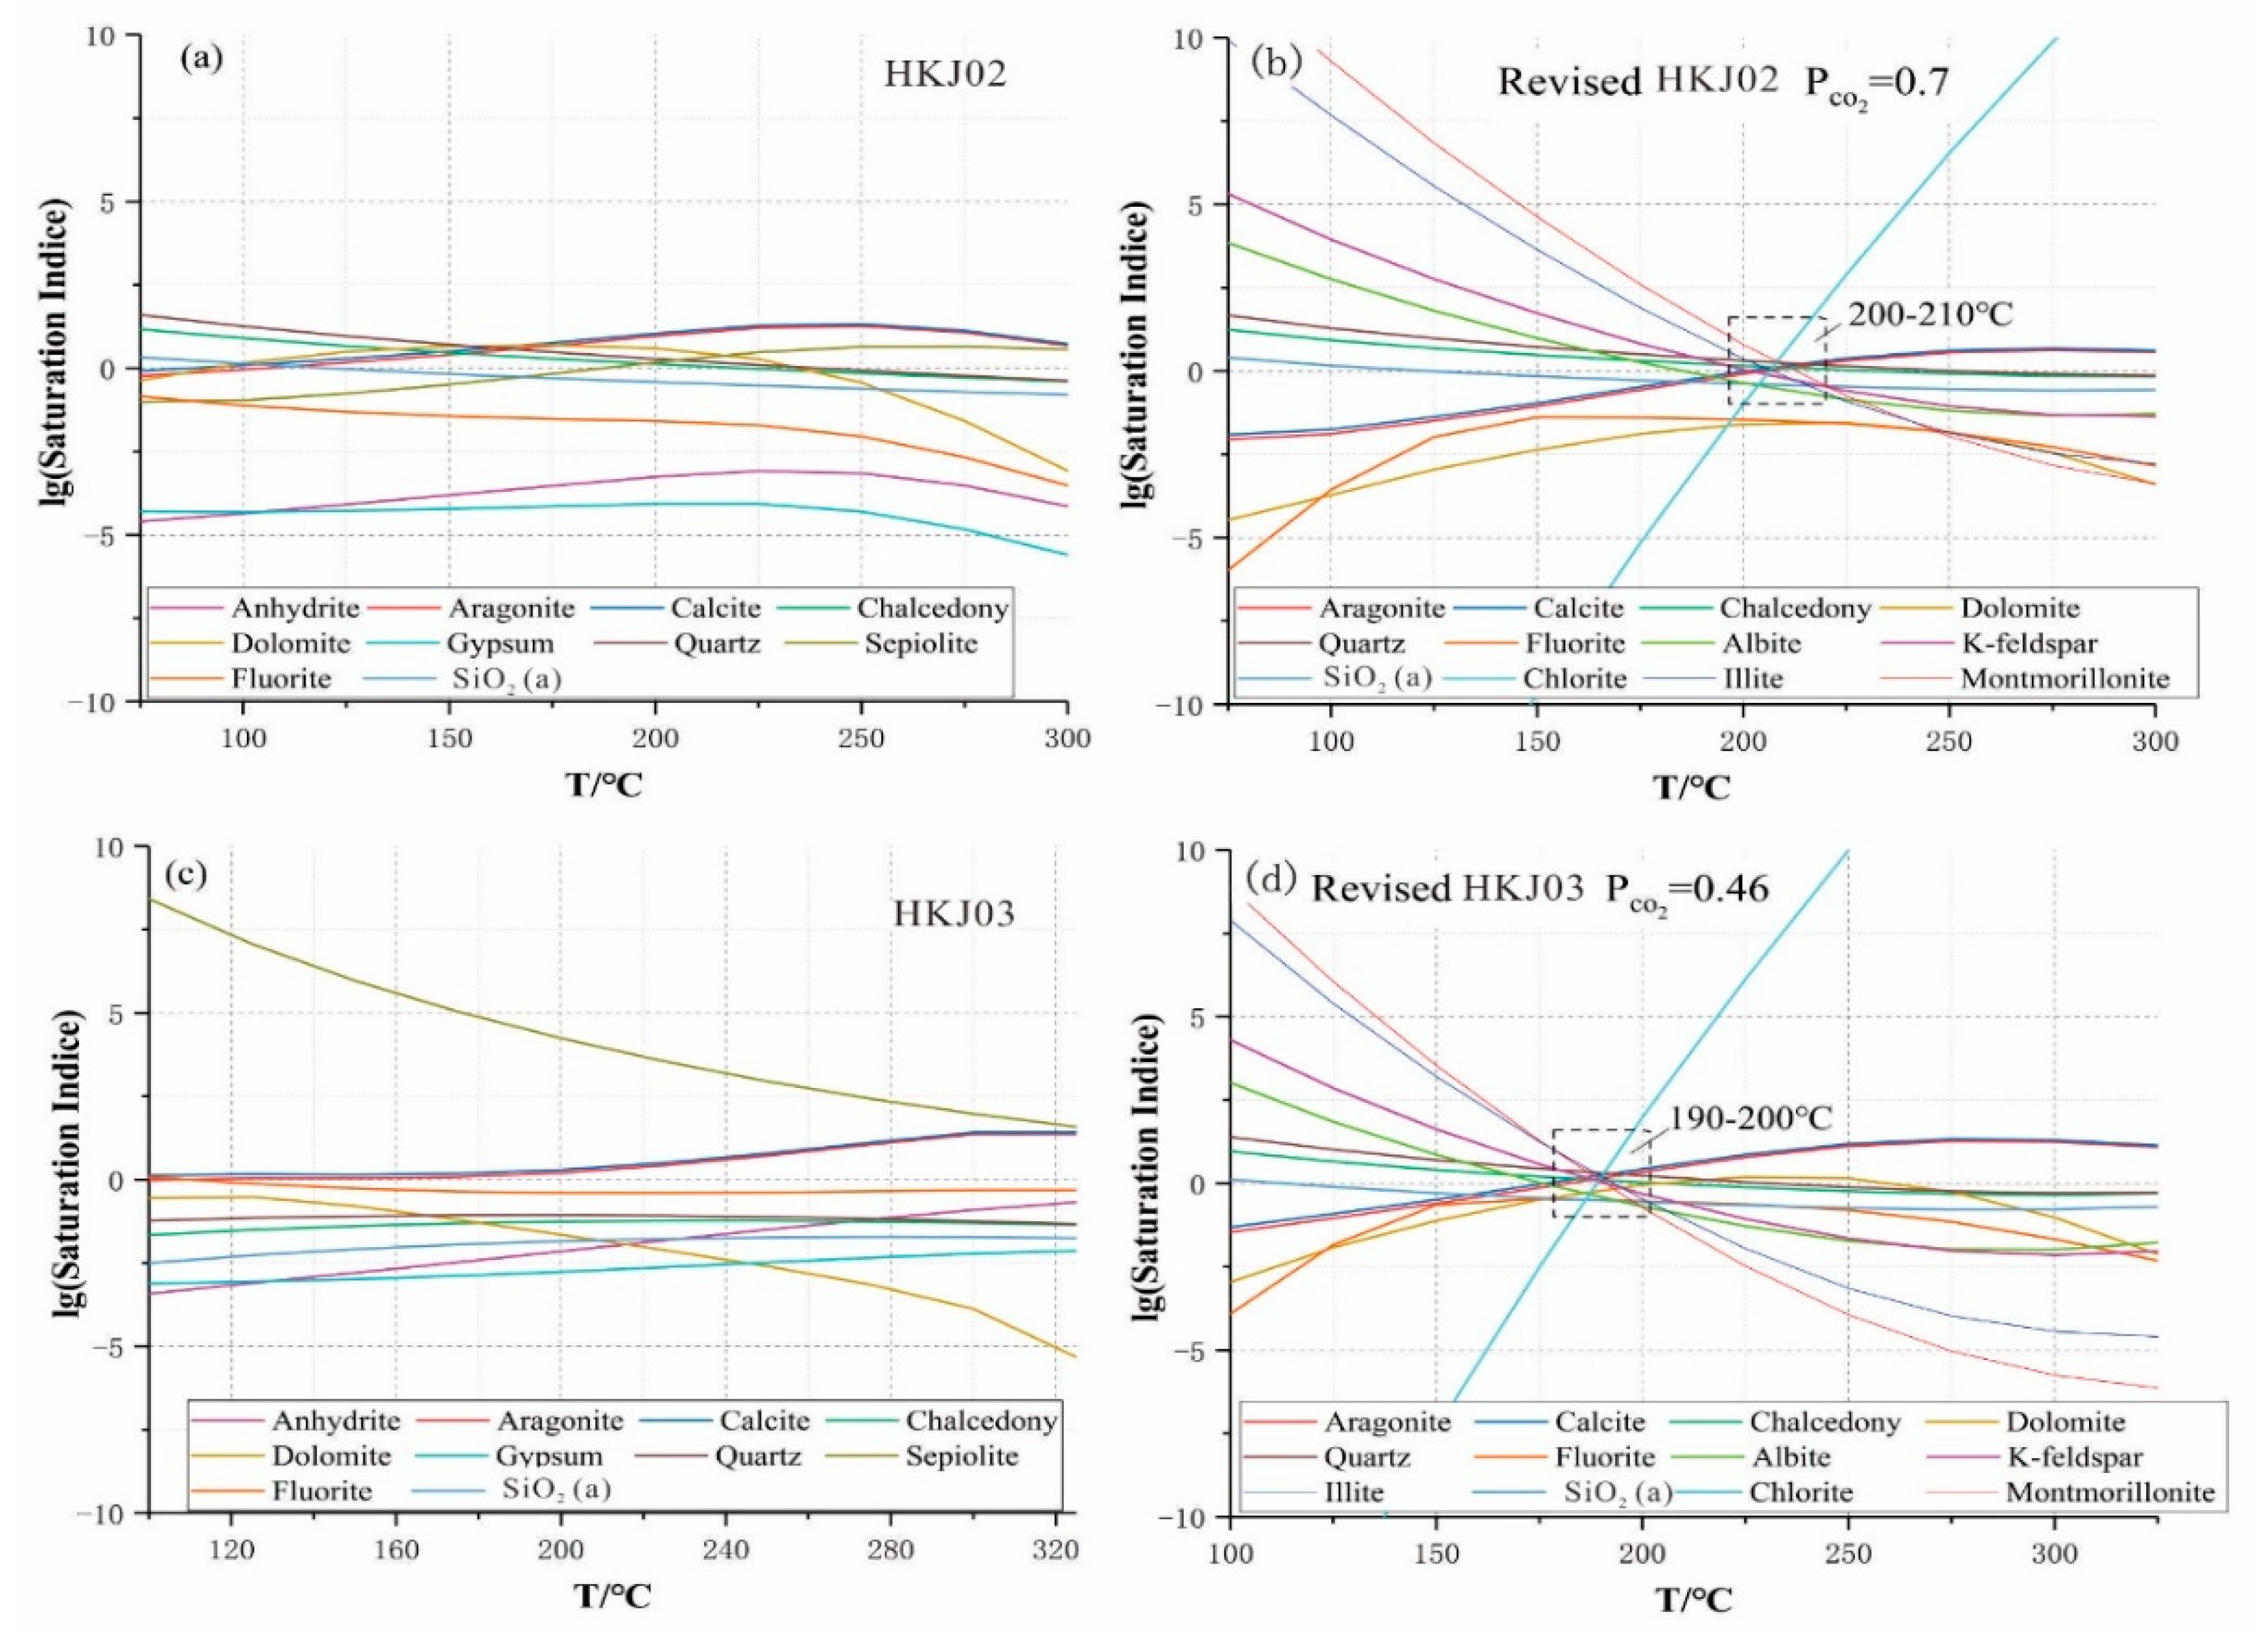
5.2.3. Geothermometrical Modeling
A multi-mineral saturation geothermometer is employed to estimate reservoir temperature when the geothermal water in the reservoir reaches mineral equilibrium [
32]. In this study, the variations of the saturation indices of different mineral temperatures were calculated at a temperature step of 20 °C using SOLVEQ-XPT. The two samples with the highest wellhead temperatures (HKJ02 and HKJ03, see in
Table S1) are taken as the representatives for the Yulingong area. To correct CO
2 degassing and possible aluminum concentration error, the calcite and microcline were forced to reach mineral equilibrium. For the geothermal wells (HKJ02 and HKJ03), saturation indices (SI) with respect to albite, aragonite, calcite, chalcedony, dolomite, quartz, laumontite, fluorite microcline, K-feldspar, illite, SiO
2(a), chlorite, and montmorillonite minerals tend to get closer to zero (SI = 0) around the temperature of 200–210 °C and 190–200 °C (
Figure 10). The temperature range indicates the estimated reservoir temperature at which these minerals reach an equilibrium condition. Meanwhile, the estimated reservoir temperatures estimated by the multi-mineral saturation geothermometer are consistent with the estimated reservoir temperature (208 °C) obtained by the silicon-enthalpy graphic method.
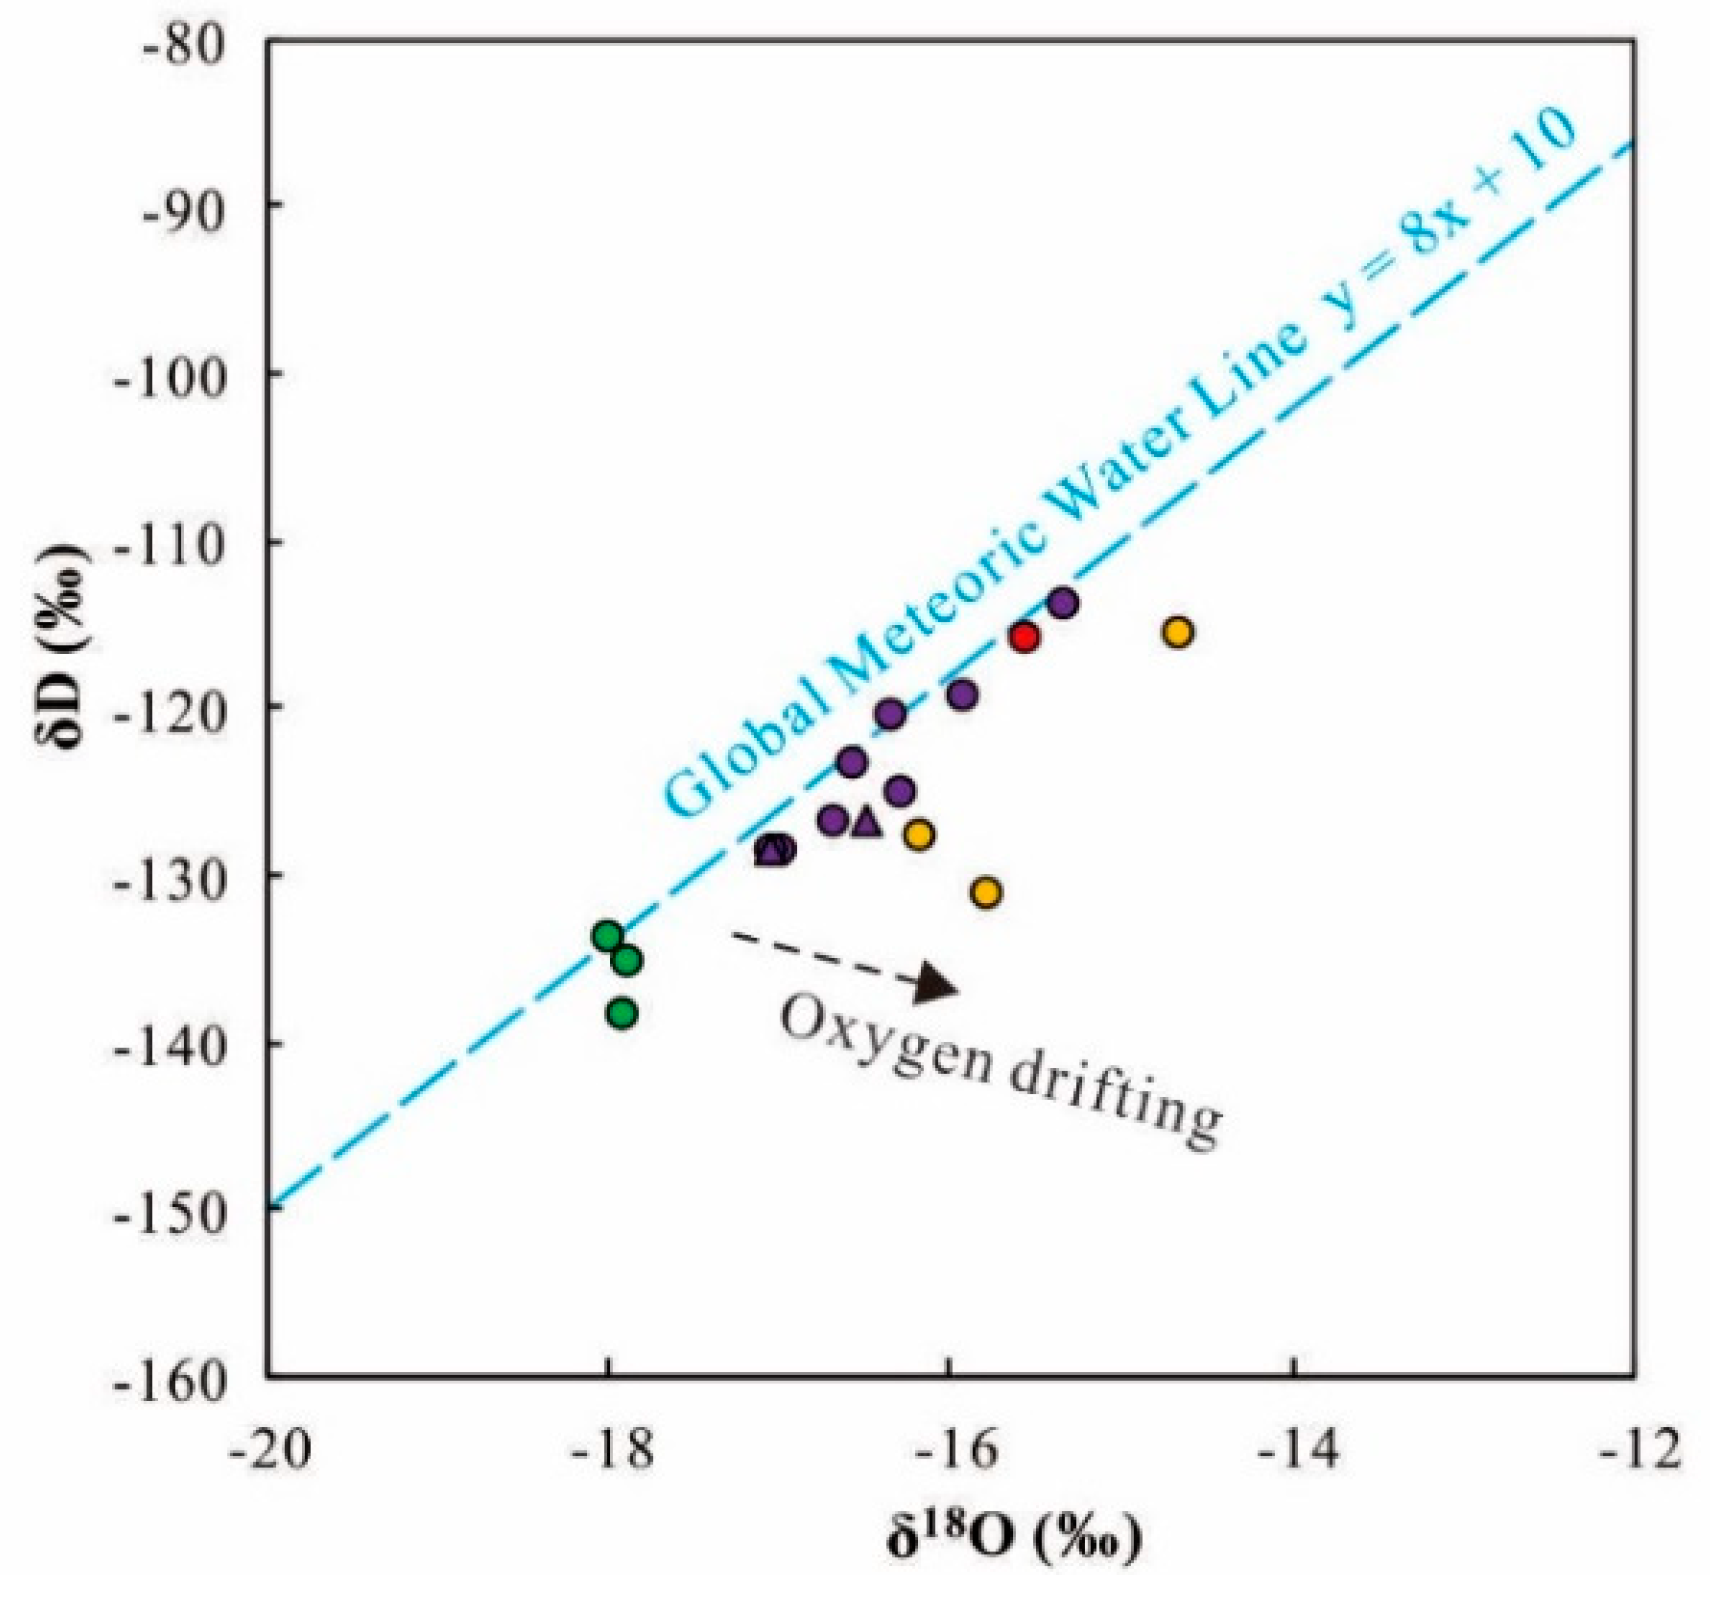
5.3. Recharge Origin Traced by δD and δ18O
H and O stable isotopes (δD and δ
18O) are useful to trace the recharge origin of surface and ground waters. In this study, the δD and δ
18O values of geothermal waters range from −138.5‰ to −113.8‰ (average = −125.9‰) and −18.0‰ to −14.7‰ (average = −16.5‰), respectively (
Table S1). The geothermal waters are plotted close to the Global Meteoric Water Line (GMWL) [
33] in the δD–δ
18O graph, suggesting recharge origin of meteoric water (
Figure 11). It is noteworthy that the plots of geothermal waters are slightly deviated from the global meteoric water line (GMWL), representing the occurrence of oxygen-isotope drifting. This phenomenon may be attributed to the oxygen isotope exchange by the water–rock reaction between geothermal waters and the surrounding carbonate or silicate rocks (calcite or silicate).
Due to the altitude effect of δD and δ
18O, they can be used to calculate the recharge elevation. Considering the existence of oxygen drifting, the δD values of the geothermal waters are more robust to estimate the recharge elevation in this study. The recharge elevations of geothermal water are calculated based on Equation (4) below [
33]:
where H is the recharge elevation (m), h is the reference point elevation, δS is the δD or δ
18O value of sampled geothermal waters, δP is the δD or δ
18O value of recharge water, and K is the δD or δ
18O elevation gradient of atmospheric precipitation (δ/100 m). In this study case, h is 270 m, δP is −52.9‰ for δD and −7.0‰ for δ
18O, and K is −1.12‰/100 m for δD and −0.26‰/100 m for δ
18O [
34]. Accordingly, the recharge elevation of the geothermal waters in the XFZ are calculated as 2923–5162 m (
Table S1).
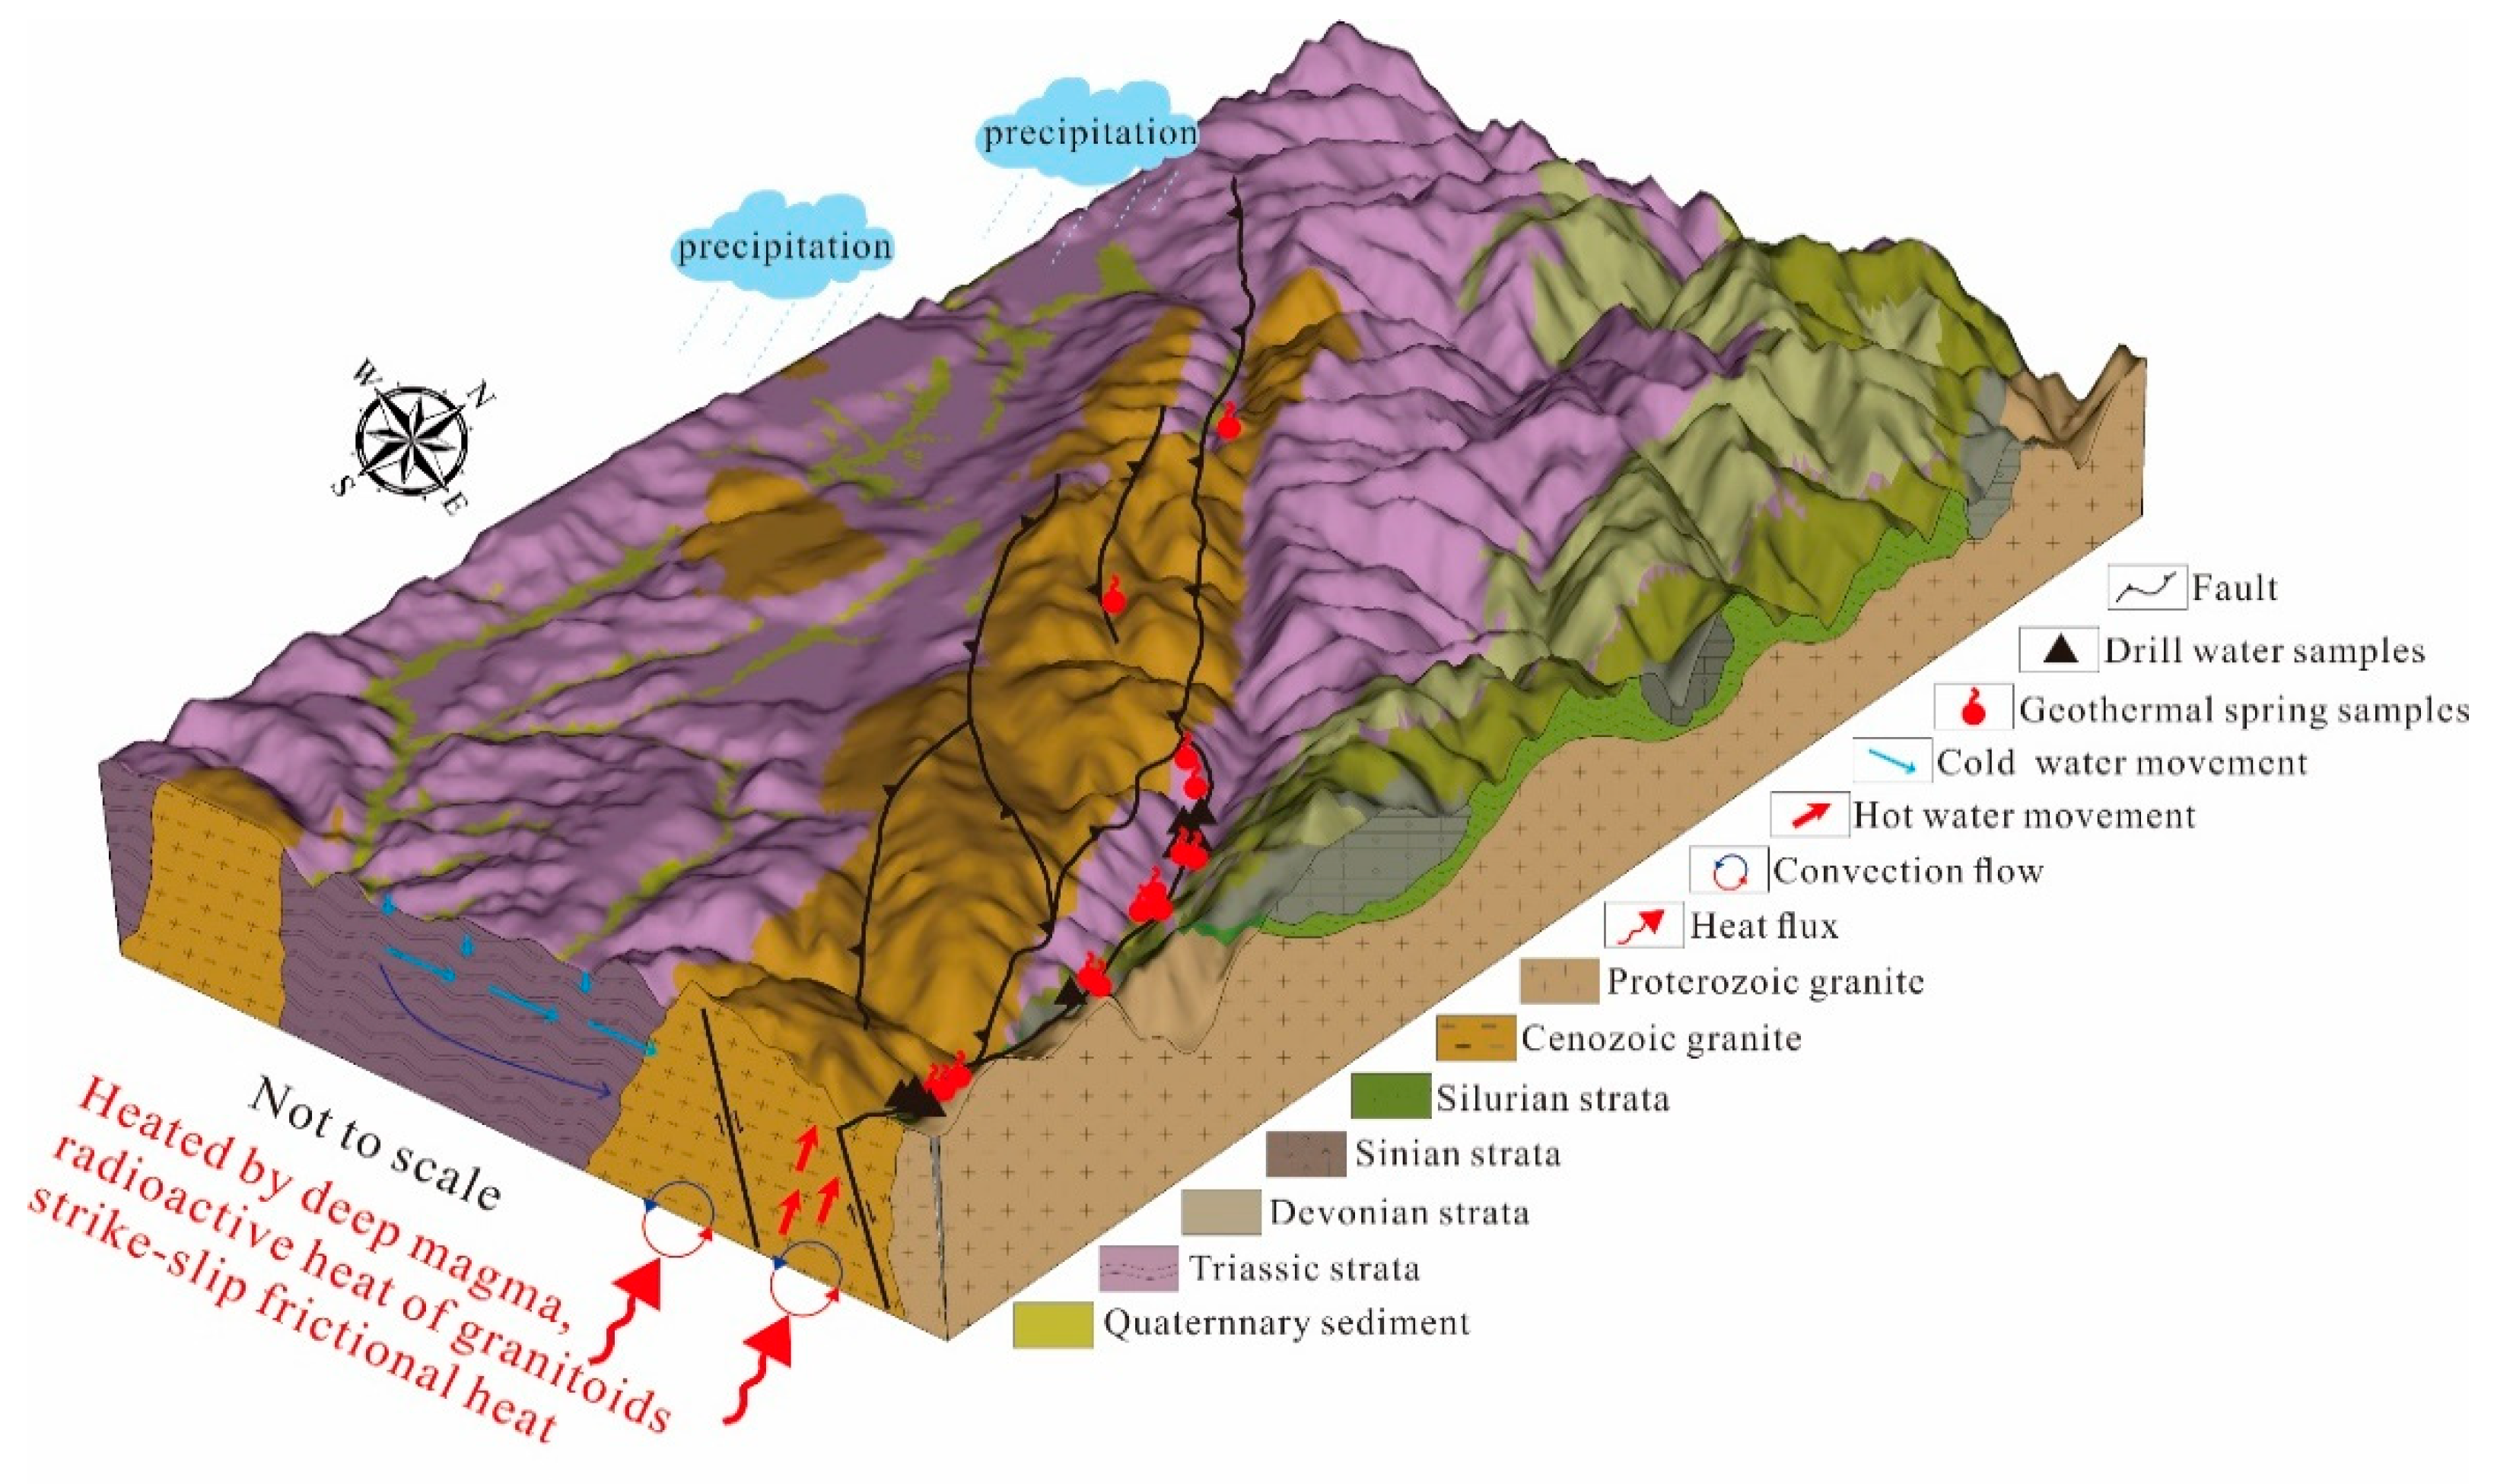
5.4. Conceptual Model
Based on the available geochemical, structural, and hydrogeological data, the following conceptual model is proposed, integrated in
Figure 12.
A previous study proposed the geothermal system of the XFZ is a liquid-dominated system heated by deep magma, radioactive heat of granitoids, and strike-slip frictional heat. D-O isotopes indicate geothermal water is recharged by meteoric water with precipitation elevation of 2923–5162 m and then travel along the developed faults and fractures of the XFZ. Water–rock is common in the circulation of geothermal water because of obvious δ18O drifting. The major ions (e.g., Na+, Ca2+ and HCO3−) of geothermal water are derived from the dissolution of silicate and carbonate minerals and ion exchange. Shallow geothermal water with Ca–HCO3 or Na–HCO3 types is produced by the mixture between Na-Cl-HCO3 type deep geothermal water and Ca–HCO3 surface cold water. Deep and shallow geothermal waters possess the reservoir temperatures of 63–150 °C and 190–210 °C, respectively. No steam separation occurred before mixing. Finally, geothermal water arises and emerges as geothermal spring in the area where faults and fractures exist, mixed by 70%–90% cold water.
6. Conclusions
The physical and chemical processes controlling the chemical composition of the geothermal waters in the XFS were investigated. In this context, the results obtained from geochemical and isotopic studies are listed below.
Shallow geothermal waters represented by geothermal springs and shallow drilled wells are divided into two hydrochemical groups: (1) Ca–Na–HCO3 type in the Erdaoqiao area, and (2) Na–HCO3 in other areas. Deep geothermal waters represented by deep drilled wells are characterized by Na–Cl–HCO3 type. Cold waters are of the Ca–HCO3 type.
Correlations of major ions and principle component analyses agree that the major ionic compositions of geothermal water are primarily determined by the water-rock interaction with silicate and carbonate minerals.
Silica and silicon enthalpy graphic method and geothermometrical modeling yield the reservoir temperatures of 63–150 °C for shallow geothermal waters, and of 190–210 °C for shallow geothermal waters, respectively. Cold water at 70–90% was proposed to be mixed with geothermal water.
The δ18O and δD compositions indicated geothermal waters are recharged by meteoric water from the elevation of 2923–5162 m. Oxygen drifting implies the occurrence of water–rock interaction in the formation of geothermal waters.
Author Contributions
Data curation, X.H.; Formal analysis, X.H. and X.L. (Xin Liao).; Funding acquisition, X.L. (Xiao Li); Investigation, Y.Z.; Project administration, X.L. (Xiao Li); Software, X.L. (Xin Liao); Supervision, Y.Z.; Visualization, X.H.; Writing–original draft, X.L. (Xiao Li) and Y.Z. All authors have read and agreed to the published version of the manuscript.
Funding
This research received no external funding.
Acknowledgments
We thank anonymous reviewers and the Editor-in-Chief for their constructive comments. We thank Jing Yu and Ziwen Hu at the State Key Laboratory of Geohazard Prevention and Geo-environment Protection, Chengdu University of Technology for their assistance and helpful discussions.
Conflicts of Interest
The authors declare no conflict of interest.
References
- Lund, J.W.; Freeston, D.H.; Boyd, T.L. Direct application of geothermal energy: 2005 Worldwide review. Geothermics 2005, 34, 691–727. [Google Scholar] [CrossRef]
- Nukman, M.; Hochstein, M.S.P. The sipoholon geothermal field and adjacent geothermal systems along the north-central sumatra fault belt, indonesia: Reviews on geochemistry, tectonics, and natural heat loss. J. Asian Earth Sci. 2019, 170, 316–328. [Google Scholar] [CrossRef]
- Minissale, A.; Donato, A.; Procesi, M.; Pizzino, L.; Giammanco, S. Systematic review of geochemical data from thermal springs, gas vents and fumaroles of Southern Italy for geothermal favourability mapping. Earth Sci. Rev. 2019, 188, 514–535. [Google Scholar] [CrossRef]
- Chenaker, H.; Houha, B.; Vincent, V. Hydrogeochemistry and geothermometry of thermal water from north-eastern Algeria. Geothermics 2018, 75, 137–145. [Google Scholar] [CrossRef]
- Montanari, D.; Minissale, A.; Doveri, M.; Gola, G.; Trumpy, E.; Santilano, A.; Manzella, A. Geothermal resources within carbonate reservoirs in western Sicily (Italy): A review. Earth Sci. Rev. 2017, 169, 180–201. [Google Scholar] [CrossRef]
- Iskandar, I.; Dermawan, F.A.; Sianipar, J.Y.; Notosiswoyo, S. Characteristic and mixing mechanisms of thermal fluid at the tampomas volcano, west java, using hydrogeochemistry, stable isotope and 222Rn analyses. Geosciences 2018, 8, 103. [Google Scholar] [CrossRef] [Green Version]
- Pang, Z.H.; Kong, Y.L.; Shao, H.B.; Kolditz, O. Progress and perspectives of geothermal energy studies in China: From shallow to deep systems. Environ. Earth Sci. 2018, 77, 580–584. [Google Scholar] [CrossRef] [Green Version]
- Tang, X.; Zhang, J.; Pang, Z.; Hu, S.; Tian, J.; Bao, S. The eastern Tibetan Plateau geothermal belt, western China: Geology, geophysics, genesis, and hydrothermal system. Tectonophysics 2017, 717, 433–448. [Google Scholar] [CrossRef]
- Guo, Q. Hydrogeochemistry of high-temperature geothermal systems in China: A review. J. Appl. Geochem. 2012, 27, 1887–1898. [Google Scholar] [CrossRef]
- Zhang, X.; Hu, Q. Development of geothermal resources in China: A review. J. Earth Sci. 2018, 2, 452–467. [Google Scholar] [CrossRef]
- Tian, J.; Pang, Z.; Guo, Q.; Wang, Y.; Li, J.; Huang, T.; Kong, Y. Geochemistry of geothermal fluids with implications on the sources of water and heat recharge to the Rekeng high-temperature geothermal system in the Eastern Himalayan Syntax. Geothermics 2018, 74, 92–105. [Google Scholar] [CrossRef]
- Wang, C.; Zheng, M. Hydrochemical Characteristics and evolution of hot fluids in the gudui geothermal field in comei county, himalayas. Geothermics 2019, 81, 243–258. [Google Scholar] [CrossRef]
- Wang, X.; Wang, G.; Lu, C.; Gan, H.; Liu, Z. Evolution of deep parent fluids of geothermal fields in the Nimu–Nagchu geothermal belt, Tibet, China. Geothermics 2018, 71, 118–131. [Google Scholar] [CrossRef]
- Wang, X.; Zhou, X.; Zheng, Y.; Song, C.; Long, M.; Chen, T.; Ren, Z.; Yang, M.; Li, X.; Guo, J. Hydrochemical characteristics and mixing behavior of thermal springs along the Bijiang River in the Lanping basin of China. Environ. Earth Sci. 2017, 76, 1–19. [Google Scholar] [CrossRef]
- Tang, X.; Zhang, J.; Pang, Z.; Hu, S.; Wu, Y.; Bao, S. Distribution and genesis of the eastern Tibetan Plateau geothermal belt, western China. Environ. Earth Sci. 2016, 76. [Google Scholar] [CrossRef]
- Zhang, Y.; Xu, M.; Li, X.; Qi, J.; Zhang, Q.; Guo, J.; Yu, L.; Zhao, R. Hydrochemical characteristics and multivariate statistical analysis of natural water system: A case study in Kangding county, southwestern China. Water 2018, 10, 80. [Google Scholar] [CrossRef] [Green Version]
- Li, J.; Yang, G.; Sagoe, G.; Li, Y. Major hydrogeochemical processes controlling the composition of geothermal waters in the Kangding geothermal field, western Sichuan Province. Geothermics 2018, 75, 154–163. [Google Scholar] [CrossRef]
- Qi, J.; Xu, M.; An, C.; Wu, M.; Zhang, Y.; Li, X.; Zhang, Q.; Lu, G. Characterizations of geothermal springs along the Moxi deep fault in the western Sichuan plateau, China. Phys. Earth Planet. Int. 2017, 263, 12–22. [Google Scholar] [CrossRef]
- Luo, J.; Pang, Z.; Kong, Y.; Wang, Y. Geothermal potential evaluation and development prioritization based on geochemistry of geothermal waters from Kangding area, western Sichuan, China. Environ. Earth Sci. 2017, 76, 1–24. [Google Scholar] [CrossRef]
- Guo, Q.; Pang, Z.; Wang, Y.; Tian, J. Fluid geochemistry and geothermometry applications of the Kangding high-temperature geothermal system in eastern Himalayas. J. Appl. Geochem. 2017, 81, 63–75. [Google Scholar] [CrossRef]
- Wei, M.H.; Wang, J.; Tian, T. In Study of the Scaling Trend of Thermal Groundwater in Kangding County of Sichuan Province. Available online: https://pangea.stanford.edu/ERE/db/WGC/papers/WGC/2015/14059.pdf (accessed on 15 November 2019).
- Chen, Z.; Zhou, X.; Du, J.; Xie, C.; Liu, L.; Li, Y.; Yi, L.; Liu, H.; Cui, Y. Hydrochemical characteristics of hot spring waters in the Kangding district related to the Lushan MS. 7.0 earthquake in Sichuan, China. Nat. Hazards Earth Sys. Sci. 2015, 15, 1149–1156. [Google Scholar] [CrossRef] [Green Version]
- Wang, Y.; Pang, Z.; Hao, Y.; Fan, Y.; Tian, J.; Li, J. A revised method for heat flux measurement with applications to the fracture-controlled Kangding geothermal system in the Eastern Himalayan Syntaxis. Geothermics 2019, 77, 188–203. [Google Scholar] [CrossRef]
- Li, B.; Shi, Z.; Wang, G.; Liu, C. Earthquake-related hydrochemical changes in thermal springs in the Xianshuihe Fault zone, Western China. J. Hydrol. 2019, 579. [Google Scholar] [CrossRef]
- Shi, Z.; Liao, F.; Wang, G.; Xu, Q.; Mu, W.; Sun, X. Hydrogeochemical characteristics and evolution of hot springs in eastern Tibetan Plateau Geothermal Belt, western China: Insight from multivariate statistical analysis. Geofluids 2017, 2017, 6546041. [Google Scholar] [CrossRef] [Green Version]
- Bai, M.; Chevalier, M.L.; Pan, J.; Replumaz, A.; Leloup, P.H.; Métois, M.; Li, H. Southeastward increase of the late Quaternary slip-rate of the Xianshuihe fault, eastern Tibet. Geodynamic and seismic hazard implications. Earth Planet. Sci. Lett. 2018, 485, 19–31. [Google Scholar] [CrossRef]
- Piper, A.M. A graphic procedure in the geochemical interpretation of water-analyses. Eos Trans. AGU 1944, 25, 914–928. [Google Scholar] [CrossRef]
- Giggenbach, W.F. Geothermal solute equilibria. Derivation of Na-K-Mg-Ca geoindicators. Geochim. Cosmochim. Acta 1988, 52, 2749–2765. [Google Scholar] [CrossRef]
- Giggenbach, W.F.; Glover, R.B. Tectonic regime and major processes governing the chemistry of water and gas discharges from the rotorua geothermal field, New Zealand. Geothermics 1992, 21, 121–140. [Google Scholar] [CrossRef]
- Truesdell, A.; Fournier, R. Procedure for estimating the temperature of a hot-water component in a mixed water by using a plot of dissolved silica versus enthalpy. USGS J. Res. 1977, 5, 49–52. [Google Scholar]
- Wolfgang, W.; Hans-Joachim, K. International Steam Tables, Properties of Water and Steam Based on the Industrial Formulation IAPWS-IF97, 2nd ed.; Springer: Berlin, Germany, 1999; pp. 172–181. ISBN 978-3-540-21419-9. [Google Scholar]
- Pang, Z.H.; Reed, M. Theoretical chemical thermometry on geothermal waters: Problems and methods. Geochim. Cosmochim. Acta 1998, 62, 1083–1091. [Google Scholar] [CrossRef]
- Craig, H. Isotopic variations in meteoric waters. Science 1961, 133, 1702–1703. [Google Scholar] [CrossRef] [PubMed]
- Song, C.L.; Sun, X.Y.; Wang, G.X. A study on precipitation stable isotopes characteristics and vapor sources of the subalpine Gongga Mountain, China. Resour. Environ. Yangtze Basin 2015, 24, 1860–1869. [Google Scholar]
© 2020 by the authors. Licensee MDPI, Basel, Switzerland. This article is an open access article distributed under the terms and conditions of the Creative Commons Attribution (CC BY) license (http://creativecommons.org/licenses/by/4.0/).


