A Framework to Understand the Progression of Cardiovascular Disease for Type 2 Diabetes Mellitus Patients Using a Network Approach


Abstract
:1. Introduction and Background
2. Methods
2.1. Data Description
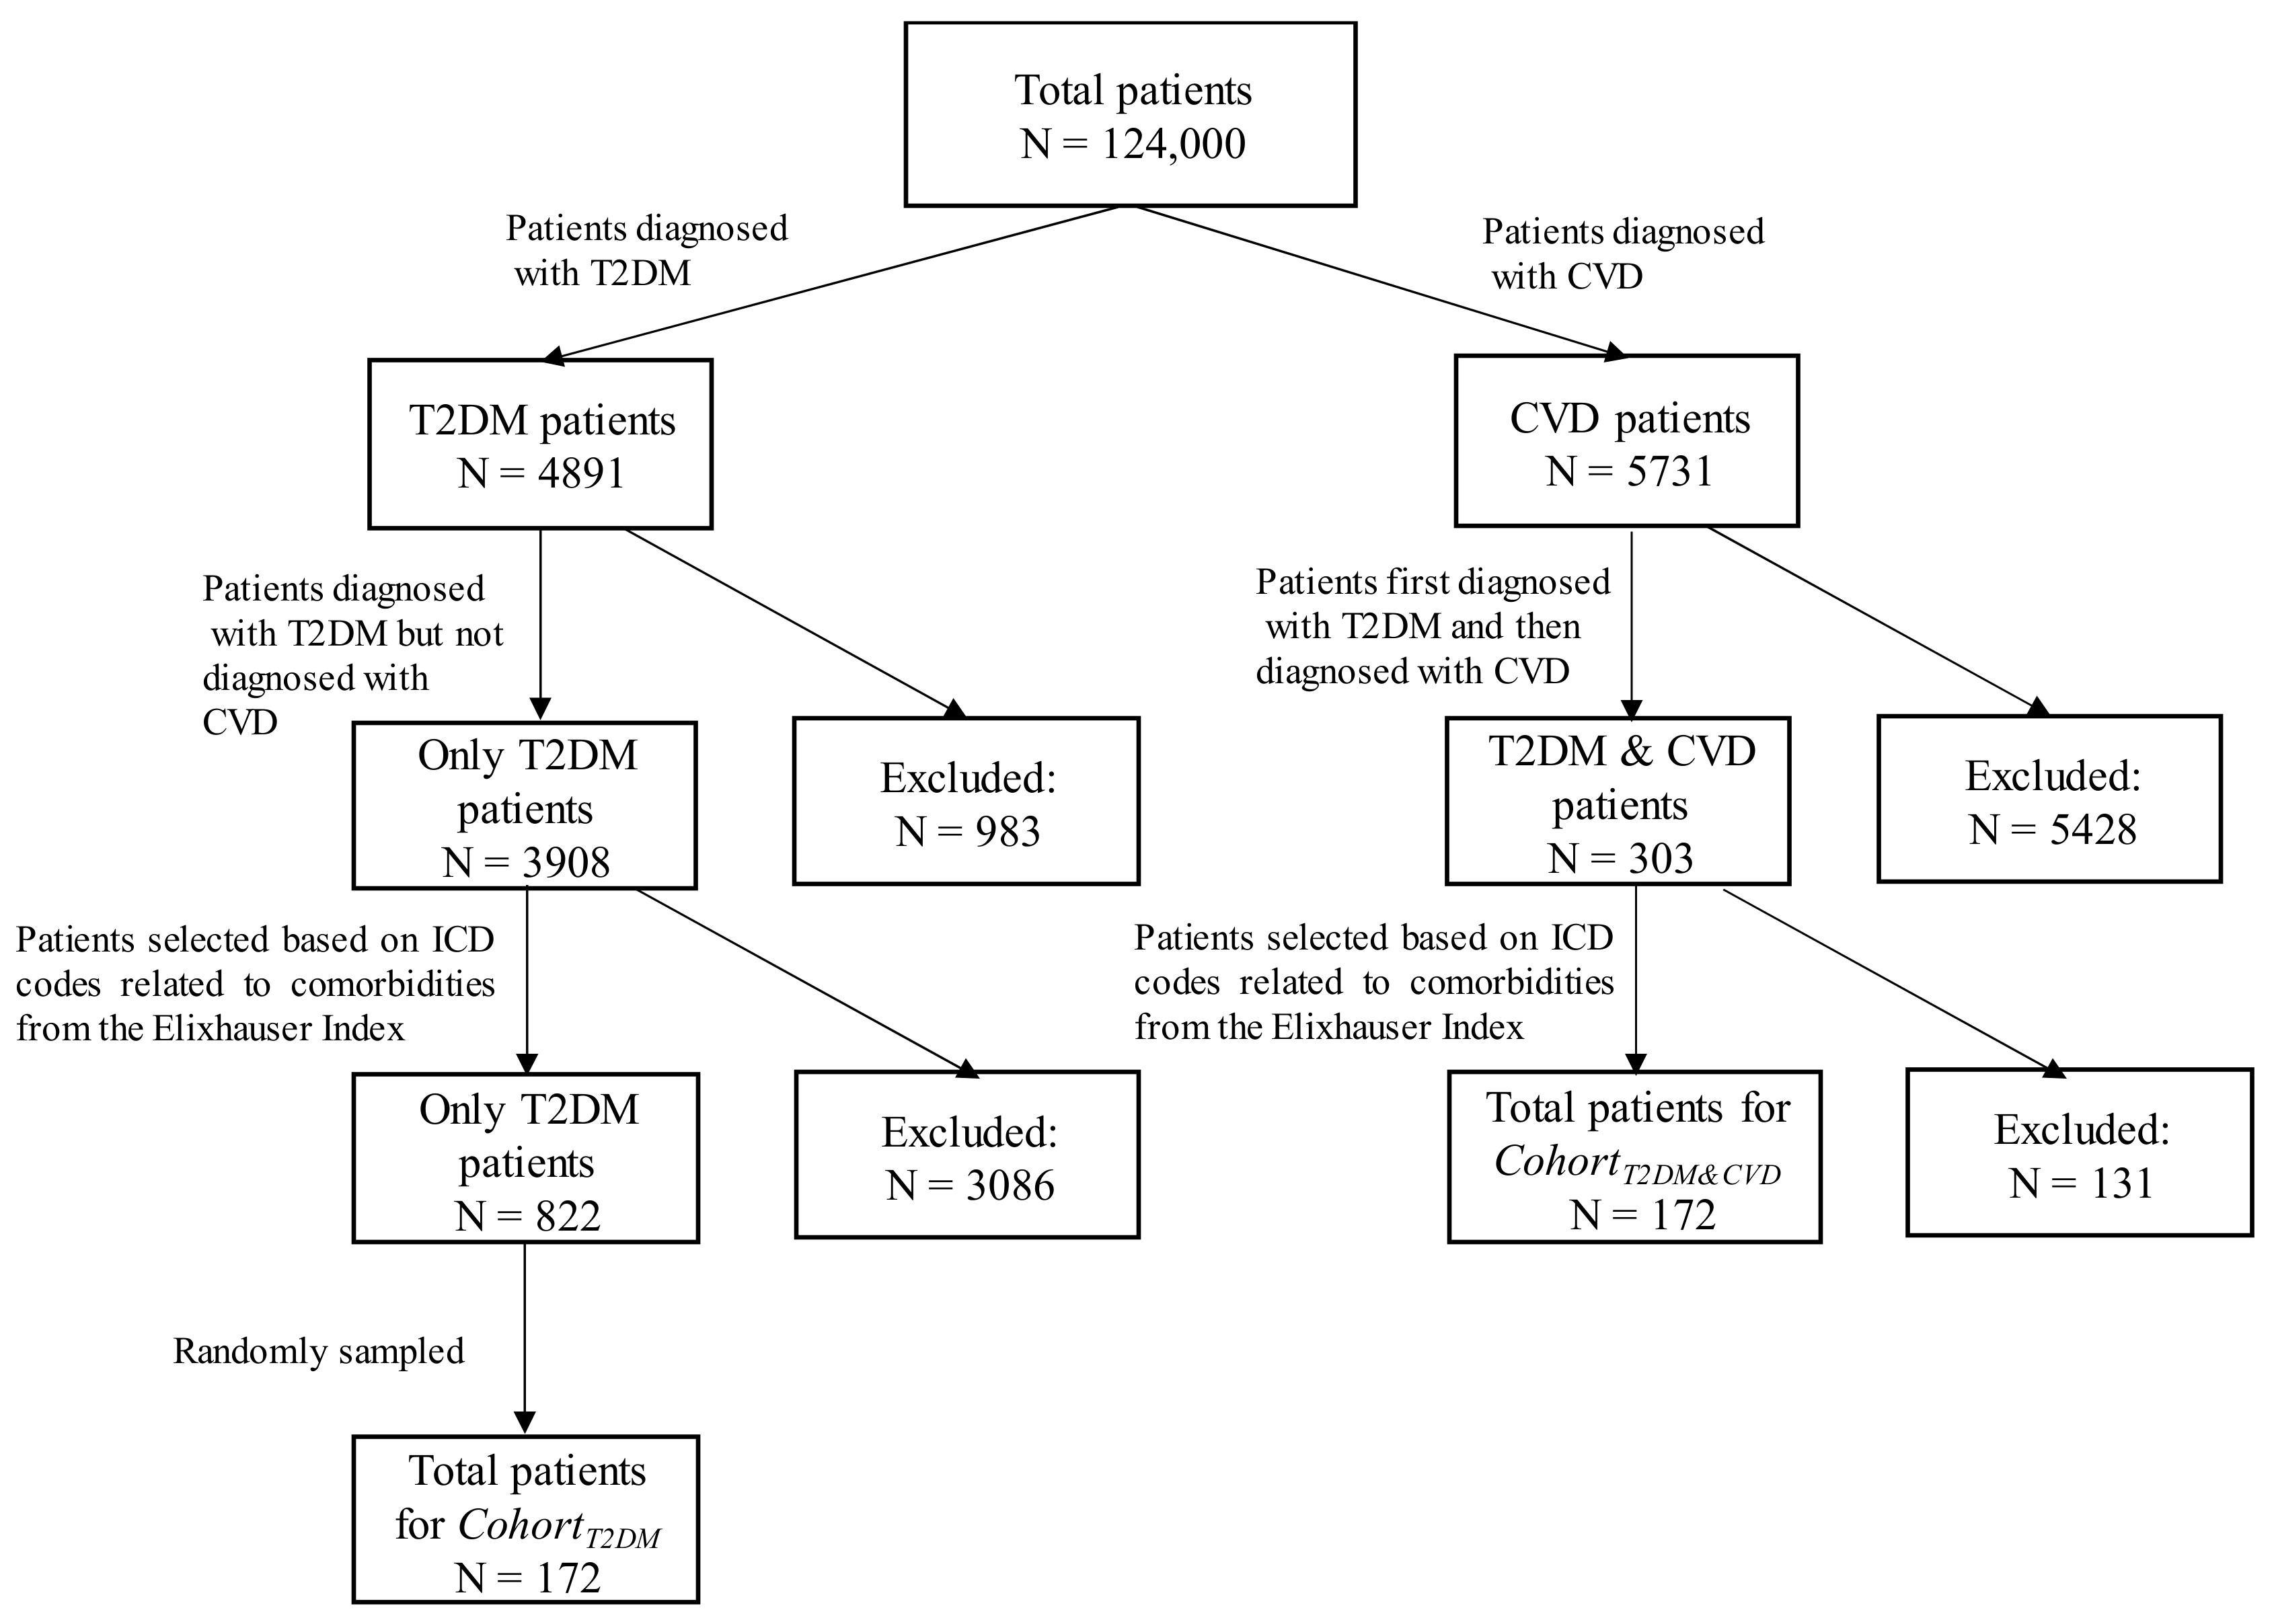
2.2. Study Population
2.3. ICD Code Grouping
2.4. Definition and Creation of Graph Theory-Based Terms Used in the Proposed Model
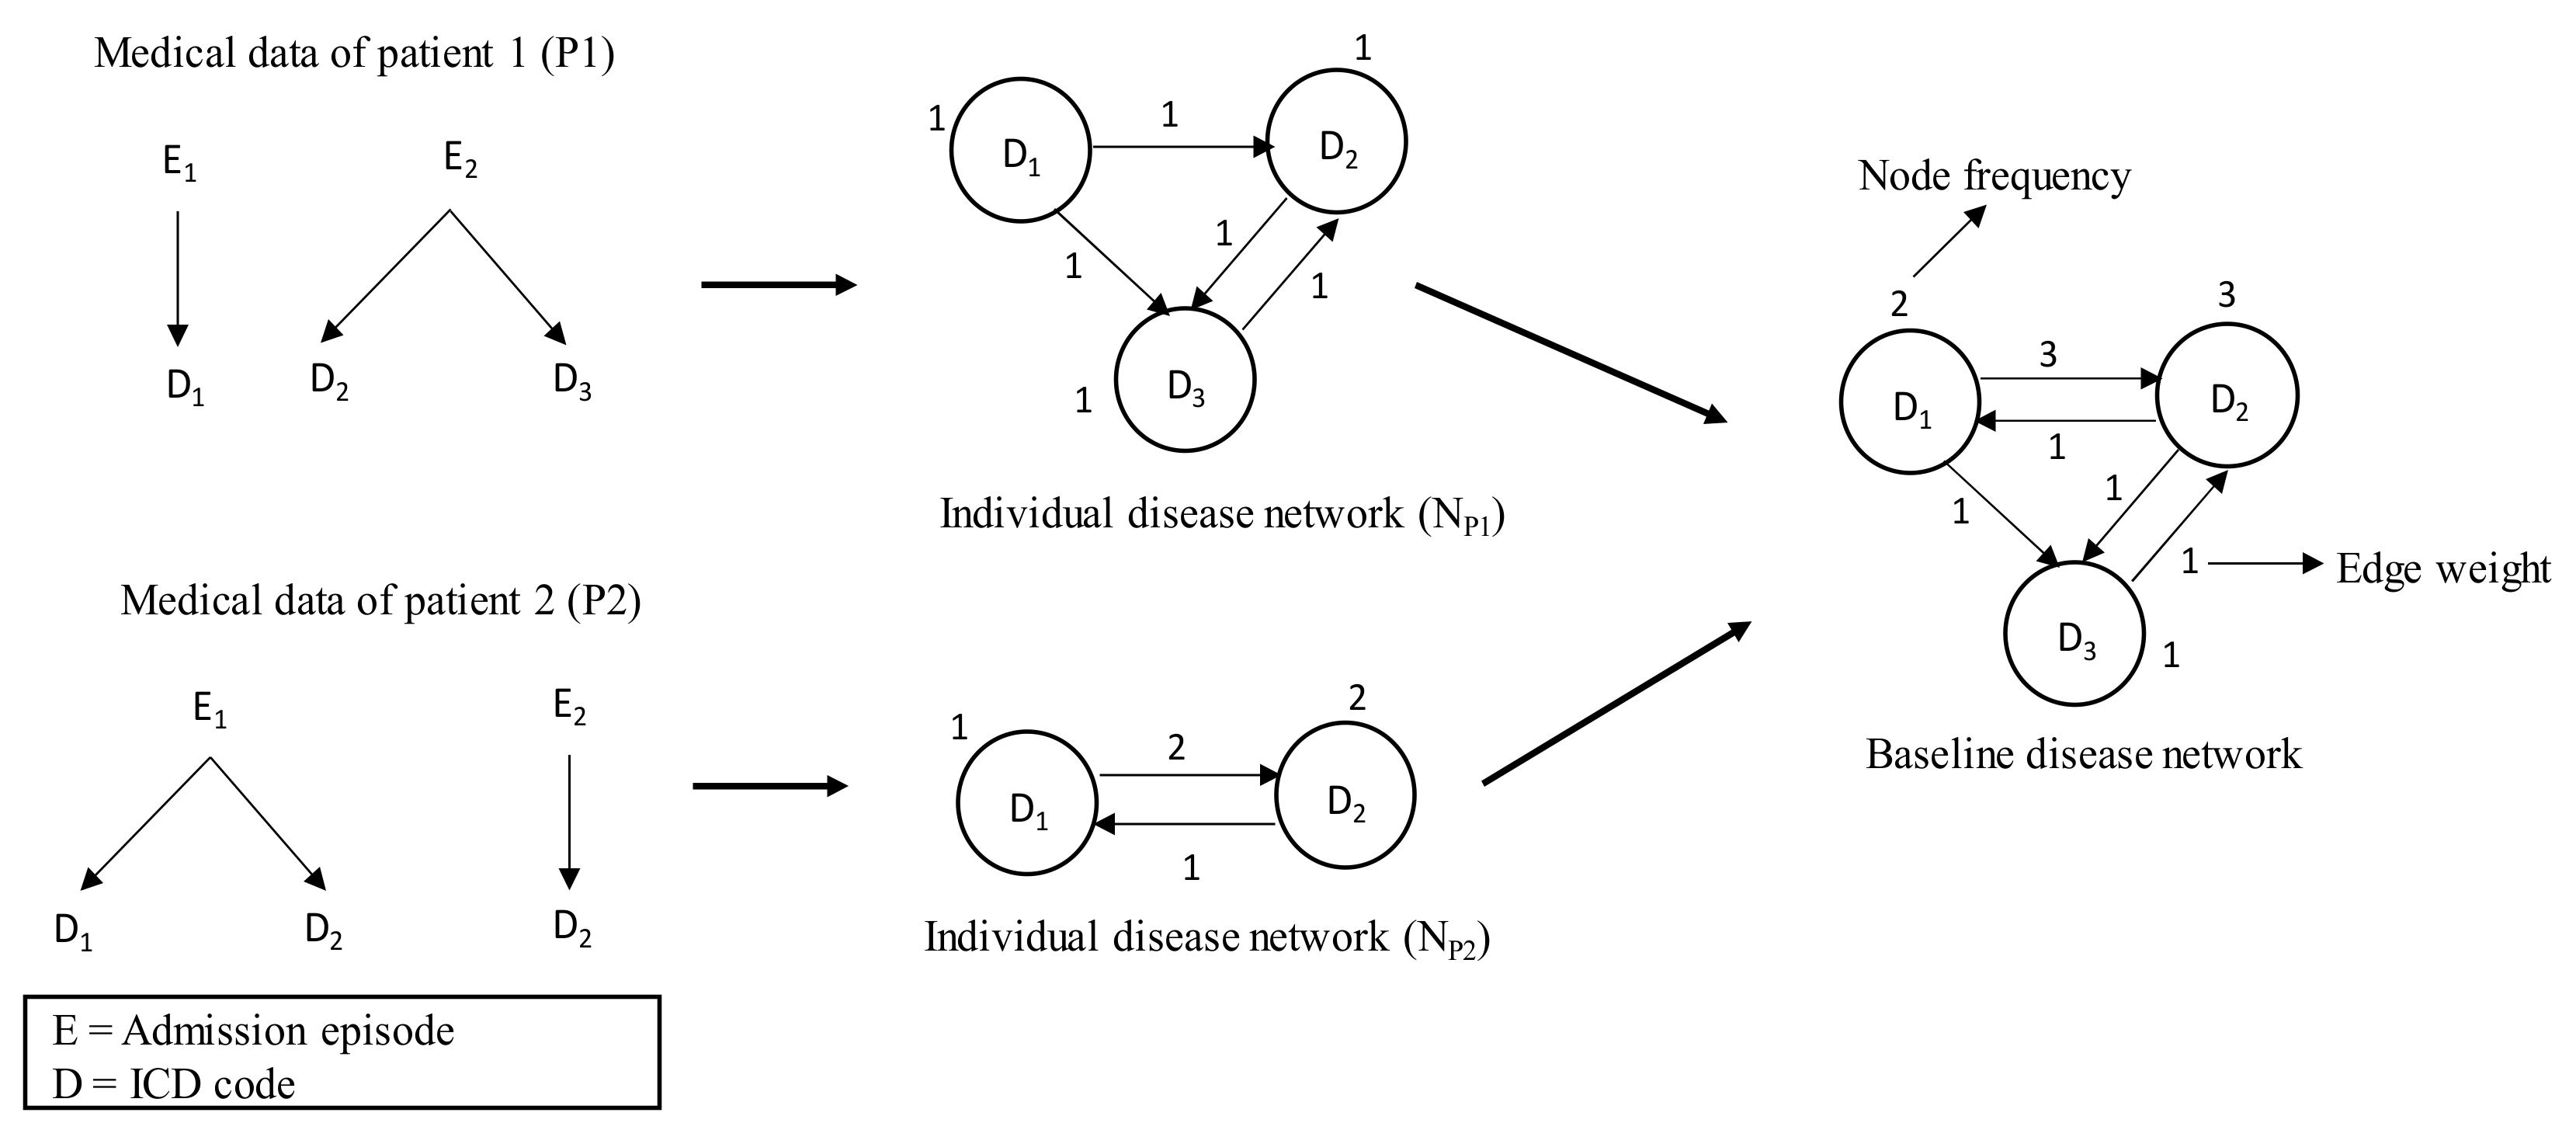
2.4.1. Individual Disease Network and Its Attributes
2.4.2. Baseline Disease Network
2.4.3. Final Disease Network through Attribute Adjustment
2.5. Procedure of the Proposed Framework
3. Results and Analysis
3.1. List of Selected Comorbidities
3.2. Comorbidity Prevalence of NT2DM&CVD and NT2DM
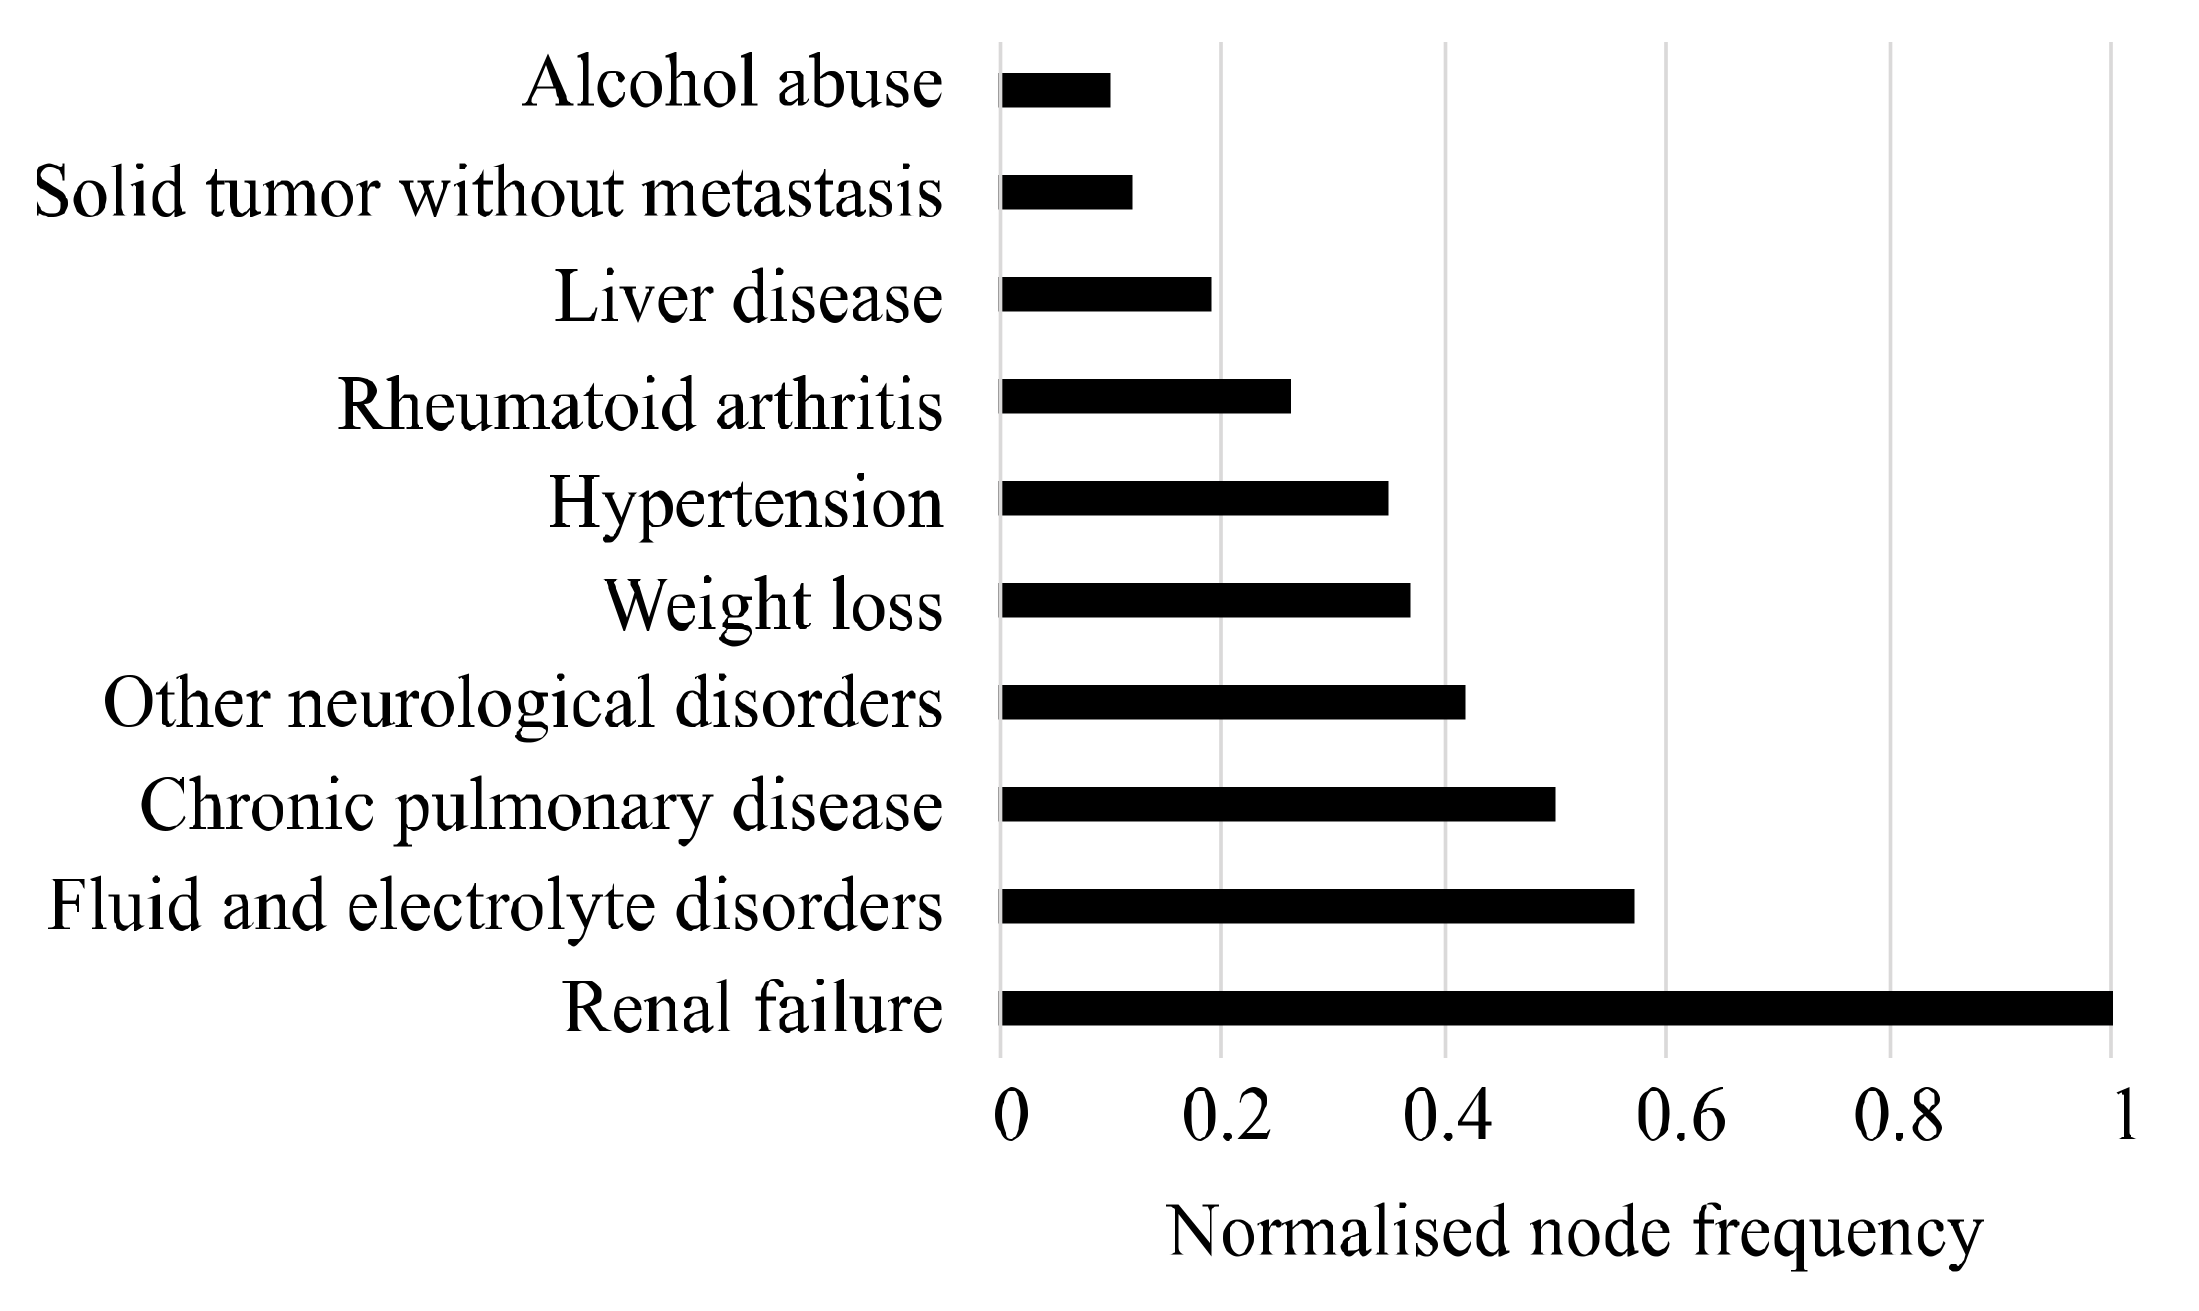
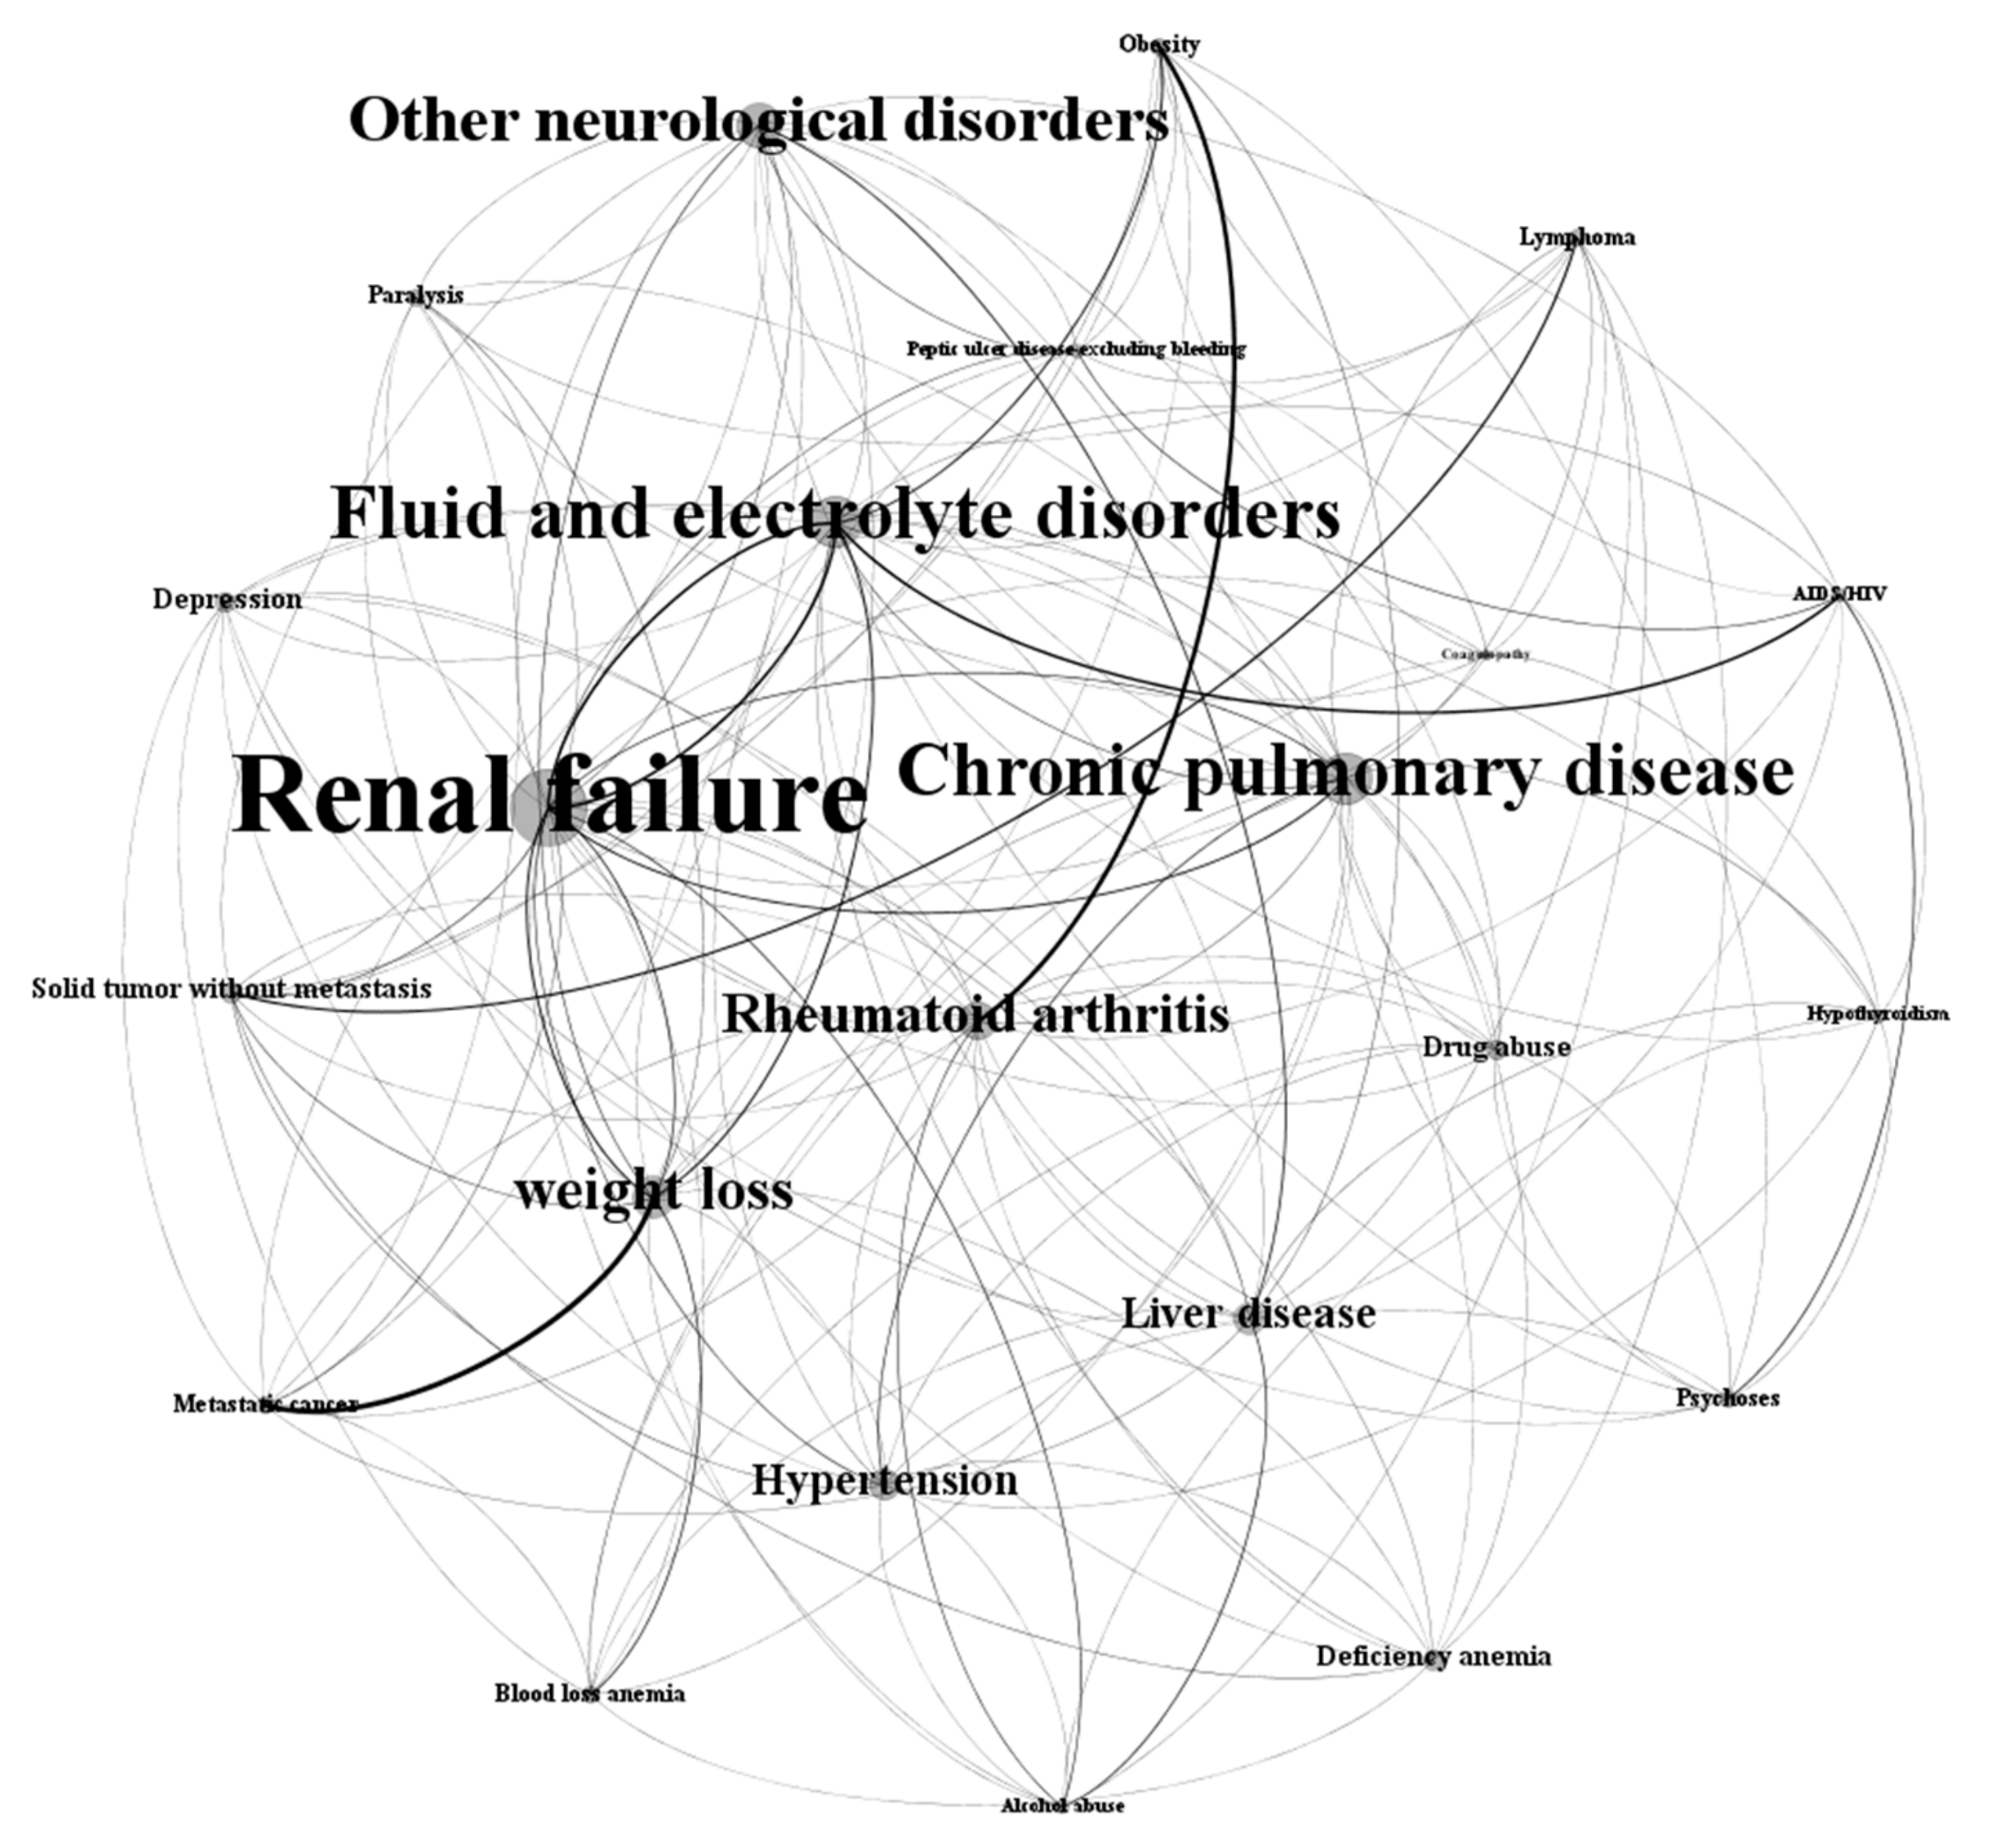
3.3. Attribution Effects on Final Disease Network
3.4. Comparison of Network Measures for Three Disease Networks
4. Discussions
4.1. Age and Sex Distribution of the Patients of Cohorts
4.2. Limitations of the Proposed Framework and Potential Future Works
5. Conclusions
Author Contributions
Funding
Acknowledgments
Conflicts of Interest
References
- National Diabetes Data Group. Classification and diagnosis of diabetes mellitus and other categories of glucose intolerance. Diabetes 1979, 28, 1039–1057. [Google Scholar] [CrossRef]
- International Diabetes Federation. Online Version of IDF Diabetes Atlas. Available online: http://www.diabetesatlas.org (accessed on 20 November 2015).
- AIHW. Cardiovascular Disease, Diabetes and Chronic Kidney Disease: Australian Facts Mortality. 2014. Available online: https://www.aihw.gov.au/reports/heart-stroke-vascular-disease/cardiovascular-diabetes-chronic-kidney-mortality/contents/summary (accessed on 3 October 2019).
- Thrainsdottir, I.S.; Aspelund, T.; Thorgeirsson, G.; Gudnason, V.; Hardarson, T.; Malmberg, K.; Sigurdsson, G.; Rydén, L. The association between glucose abnormalities and heart failure in the population-based Reykjavik study. Diabetes Care 2005, 28, 612–616. [Google Scholar] [CrossRef] [Green Version]
- Dei Cas, A.; Khan, S.S.; Butler, J.; Mentz, R.J.; Bonow, R.O.; Avogaro, A.; Tschoepe, D.; Doehner, W.; Greene, S.J.; Senni, M.; et al. Impact of diabetes on epidemiology, treatment, and outcomes of patients with heart failure. JACC Heart Fail. 2015, 3, 136–145. [Google Scholar] [CrossRef] [PubMed]
- AIWH. Chronic Disease Comorbidity. 2019. Available online: http://www.aihw.gov.au/chronic-diseases/comorbidity/ (accessed on 3 October 2019).
- Tong, B.; Stevenson, C. Comorbidity of Cardiovascular Disease, Diabetes and Chronic Kidney Disease in Australia; Australian Institute of Health and Welfare: Canberra, Australia, 2007.
- Walker, A. Multiple chronic conditions: Patient characteristics and impacts on quality of life and health expenditures. In Proceedings of the Health Services & Policy Research Conference, Canberra, Australia, 13–16 November 2005; The Australian National University: Canberra, Australia, 2005. [Google Scholar]
- MacDonald, M.R.; Petrie, M.C.; Varyani, F.; Östergren, J.; Michelson, E.L.; Young, J.B.; Solomon, S.D.; Granger, C.G.; Swedberg, K.; Yusuf, S.; et al. Impact of diabetes on outcomes in patients with low and preserved ejection fraction heart failure: an analysis of the Candesartan in Heart failure: Assessment of Reduction in Mortality and morbidity (CHARM) programme. Eur. Heart J. 2008, 29, 1377–1385. [Google Scholar] [CrossRef] [PubMed] [Green Version]
- World Health Organisation. International Classifications of Diseases (ICD). Available online: https://www.who.int/classifications/icd/en/ (accessed on 22 May 2019).
- Hossain, M.E.; Khan, A.; Moni, M.A.; Uddin, S. Use of electronic health data for disease prediction: A comprehensive literature review. IEEE ACM Trans. Comput. Biol. Bioinf. 2019. [Google Scholar] [CrossRef] [PubMed]
- Charlson, M.E.; Pompei, P.; Ales, K.L.; MacKenzie, C.R. A new method of classifying prognostic comorbidity in longitudinal studies: Development and validation. J. Chronic Dis. 1987, 40, 373–383. [Google Scholar] [CrossRef]
- Wong, D.T.; Knaus, W.A. Predicting outcome in critical care: The current status of the APACHE prognostic scoring system. Can. J. Anesth. 1991, 38, 374–383. [Google Scholar] [CrossRef]
- Ewing, D.J.; Martyn, C.N.; Young, R.J.; Clarke, B.F. The value of cardiovascular autonomic function tests: 10 years experience in diabetes. Diabetes Care 1985, 8, 491–498. [Google Scholar] [CrossRef]
- Cederholm, J.; Eeg-Olofsson, K.; Eliasson, B.; Zethelius, B.; Nilsson, P.M.; Gudbjörnsdottir, S. Risk prediction of cardiovascular disease in type 2 diabetes: A risk equation from the Swedish National Diabetes Register. Diabetes Care 2008, 31, 2038–2043. [Google Scholar] [CrossRef] [Green Version]
- Elixhauser, A.; Steiner, C.; Harris, D.R.; Coffey, R.M. Comorbidity measures for use with administrative data. Med. Care 1998, 36, 8–27. [Google Scholar] [CrossRef]
- Sharabiani, M.T.; Aylin, P.; Bottle, A. Systematic review of comorbidity indices for administrative data. Med. Care 2012, 50, 1109–1118. [Google Scholar] [CrossRef] [PubMed]
- Southern, D.A.; Quan, H.; Ghali, W.A. Comparison of the Elixhauser and Charlson/Deyo methods of comorbidity measurement in administrative data. Med. Care 2004, 42, 355–360. [Google Scholar] [CrossRef] [PubMed]
- Breslow, M.J.; Badawi, O. Severity scoring in the critically ill: Part 1—Interpretation and accuracy of outcome prediction scoring systems. Chest 2012, 141, 245–252. [Google Scholar] [CrossRef] [PubMed]
- Barabási, A.-L. Network Medicine—From Obesity to the Diseasome. N. Engl. J. Med. 2007, 357, 404–407. [Google Scholar] [CrossRef] [PubMed] [Green Version]
- Loscalzo, J.; Kohane, I.; Barabasi, A.L. Human disease classification in the postgenomic era: A complex systems approach to human pathobiology. Mol. Syst. Biol. 2007, 3. [Google Scholar] [CrossRef]
- Burton, P.R.; Clayton, D.G.; Cardon, L.R.; Craddock, N.; Deloukas, P.; Duncanson, A.; Kwiatkowski, D.P.; McCarthy, M.I.; Ouwehand, W.H.; Samani, N.J.; et al. Genome-wide association study of 14,000 cases of seven common diseases and 3,000 shared controls. Nature 2007, 447, 661–678. [Google Scholar]
- Iezzoni, L.I. Assessing quality using administrative data. Ann. Intern. Med. 1997, 127, 666–674. [Google Scholar] [CrossRef]
- Khan, A.; Uddin, S.; Srinivasan, U. Comorbidity network for chronic disease: A novel approach to understand type 2 diabetes progression. Int. J. Med. Inf. 2018, 115, 1–9. [Google Scholar] [CrossRef]
- Hossain, M.E.; Uddin, S. Understanding the Comorbidity of Multiple Chronic Diseases Using a Network Approach. In Proceedings of the Australasian Computer Science Week Multiconference, Sydney, NSW, Australia, 29–31 January 2019; p. 26. [Google Scholar]
- Hossain, M.E.; Khan, A.; Uddin, S. Understanding the Progression of Congestive Heart Failure of Type 2 Diabetes Patient Using Disease Network and Hospital Claim Data. In Proceedings of the International Conference on Complex Networks and Their Applications, Lisbon, Portugal, 10–12 December 2019; pp. 774–788. [Google Scholar]
- Nichols, G.A.; Hillier, T.A.; Erbey, J.R.; Brown, J.B. Congestive heart failure in type 2 diabetes: Prevalence, incidence, and risk factors. Diabetes Care 2001, 24, 1614–1619. [Google Scholar] [CrossRef] [Green Version]
- Nichols, G.A.; Gullion, C.M.; Koro, C.E.; Ephross, S.A.; Brown, J.B. The incidence of congestive heart failure in type 2 diabetes: An update. Diabetes Care 2004, 27, 1879–1884. [Google Scholar] [CrossRef] [Green Version]
- Korytkowski, M.T.; French, E.K.; Brooks, M.; DeAlmeida, D.; Kanter, J.; Lombardero, M.; Magaji, V.; Orchard, T.; Siminerio, L. Use of an electronic health record to identify prevalent and incident cardiovascular disease in type 2 diabetes according to treatment strategy. BMJ Open Diabetes Res. Care 2016, 4, e000206. [Google Scholar] [CrossRef] [PubMed] [Green Version]
- Davis, D.A.; Chawla, N.V.; Christakis, N.A.; Barabási, A.-L. Time to CARE: A collaborative engine for practical disease prediction. Data Min. Knowl. Discov. 2010, 20, 388–415. [Google Scholar] [CrossRef]
- Gupta, S.; Tran, T.; Luo, W.; Phung, D.; Kennedy, R.L.; Broad, A.; Campbell, D.; Kipp, D.; Singh, M.; Khasraw, M.; et al. Machine-learning prediction of cancer survival: A retrospective study using electronic administrative records and a cancer registry. BMJ Open 2014, 4, e004007. [Google Scholar] [CrossRef] [PubMed] [Green Version]
- Davis, D.A.; Chawla, N.V.; Blumm, N.; Christakis, N.; Barabasi, A.-L. Predicting individual disease risk based on medical history. In Proceedings of the 17th ACM conference on Information and knowledge management, New York, NY, USA, 26–30 October 2008; pp. 769–778. [Google Scholar]
- Zhang, J.; Gong, J.; Barnes, L. HCNN: Heterogeneous Convolutional Neural Networks for Comorbid Risk Prediction with Electronic Health Records. In Proceedings of the 2017 IEEE/ACM International Conference on Connected Health: Applications, Systems and Engineering Technologies (CHASE), Philadelphia, PA, USA, 17–19 July 2017; pp. 214–221. [Google Scholar]
- Jensen, F.V. An Introduction to Bayesian Networks; UCL Press: London, UK, 1996; Volume 210. [Google Scholar]
- Faruqui, S.H.A.; Alaeddini, A.; Jaramillo, C.A.; Potter, J.S.; Pugh, M.J. Mining patterns of comorbidity evolution in patients with multiple chronic conditions using unsupervised multi-level temporal Bayesian network. PLoS ONE 2018, 13, e0199768. [Google Scholar] [CrossRef]
- Himes, B.E.; Dai, Y.; Kohane, I.S.; Weiss, S.T.; Ramoni, M.F. Prediction of chronic obstructive pulmonary disease (COPD) in asthma patients using electronic medical records. J. Am. Med. Inf. Assoc. 2009, 16, 371–379. [Google Scholar] [CrossRef]
- Ideker, T.; Sharan, R. Protein networks in disease. Genome Res. 2008, 18, 644–652. [Google Scholar] [CrossRef] [Green Version]
- Anderson, J.G. Evaluation in health informatics: Social network analysis. Comput. Biol. Med. 2002, 32, 179–193. [Google Scholar] [CrossRef]
- DuGoff, E.H.; Fernandes-Taylor, S.; Weissman, G.E.; Huntley, J.H.; Pollack, C.E. A scoping review of patient-sharing network studies using administrative data. Transl. Behav. Med. 2018, 8, 598–625. [Google Scholar] [CrossRef]
- Soulakis, N.D.; Carson, M.B.; Lee, Y.J.; Schneider, D.H.; Skeehan, C.T.; Scholtens, D.M. Visualizing collaborative electronic health record usage for hospitalized patients with heart failure. J. Am. Med. Inf. Assoc. 2015, 22, 299–311. [Google Scholar] [CrossRef] [Green Version]
- Uddin, S.; Hossain, L.; Hamra, J.; Alam, A. A study of physician collaborations through social network and exponential random graph. BMC Health Serv. Res. 2013, 13, 234. [Google Scholar] [CrossRef] [Green Version]
- Uddin, S.; Khan, A.; Piraveenan, M. Administrative claim data to learn about effective healthcare collaboration and coordination through social network. In Proceedings of the System Sciences (HICSS), 2015 48th Hawaii International Conference, Hawaii, HI, USA, 5–8 January 2015; pp. 3105–3114. [Google Scholar]
- Merrill, A.J.; Sheehan, B.; Carley, K.M.; Stetson, P. Transition networks in a cohort of patients with congestive heart failure. Appl. Clin. Inf. 2015, 6, 548–564. [Google Scholar]
- Dixit, S.K.; Sambasivan, M. A review of the Australian healthcare system: A policy perspective. SAGE Open Med. 2018, 6, 2050312118769211. [Google Scholar] [CrossRef] [PubMed] [Green Version]
- Fetter, R.B.; Shin, Y.; Freeman, J.L.; Averill, R.F.; Thompson, J.D. Case mix definition by diagnosis-related groups. Med. Care 1980, 18, i53. [Google Scholar]
- Quan, H.; Sundararajan, V.; Halfon, P.; Fong, A.; Burnand, B.; Luthi, J.-C.; Saunders, L.D.; Beck, C.A.; Feasby, T.E.; Ghali, W.A. Coding algorithms for defining comorbidities in ICD-9-CM and ICD-10 administrative data. Med. Care 2005, 43, 1130–1139. [Google Scholar] [CrossRef]
- ACCD. Australian Consortium for Classification Development. 2019. Available online: https://www.accd.net.au/Icd10.aspx (accessed on 12 June 2019).
- Deyo, R.A.; Cherkin, D.C.; Ciol, M.A. Adapting a clinical comorbidity index for use with ICD-9-CM administrative databases. J. Clin. Epidemiol. 1992, 45, 613–619. [Google Scholar] [CrossRef]
- Moskowitz, G.B. Social Cognition: Understanding Self and Others; Guilford Publications: New York, NY, USA, 2005. [Google Scholar]
- Garland, A.; Fransoo, R.; Olafson, K.; Ramsey, C.D.; Yogendran, M.; Chateau, D.; McGowan, K.-L. The Epidemiology and Outcomes of Critical Illness in Manitoba; Manitoba Center for Health Policy: 2011. Available online: http://mchp-appserv.cpe.umanitoba.ca/reference/MCHP_ICU_Report_WEB_%2820120403%29.pdf (accessed on 1 December 2011).
- Huo, X.; Gao, L.; Guo, L.; Xu, W.; Wang, W.; Zhi, X.; Li, L.; Ren, Y.; Qi, X.; Sun, D.; et al. Risk of non-fatal cardiovascular diseases in early-onset versus late-onset type 2 diabetes in China: A cross-sectional study. Lancet Diabetes Endocrinol. 2016, 4, 115–124. [Google Scholar] [CrossRef]
- Martín-Timón, I.; Sevillano-Collantes, C.; Segura-Galindo, A.; del Cañizo-Gómez, F.J. Type 2 diabetes and cardiovascular disease: Have all risk factors the same strength? World J. Diabetes 2014, 5, 444. [Google Scholar] [CrossRef]
- AIHW. Comorbidity of Cardiovascular Disease, Diabetes and Chronic Kidney Disease in Australia. 2007. Available online: https://www.aihw.gov.au/getmedia/63851abe-7339-4730-bd82-02dc647690be/cocddackdia.pdf.aspx?inline=true (accessed on 15 October 2019).
- Liamis, G.; Liberopoulos, E.; Barkas, F.; Elisaf, M. Diabetes mellitus and electrolyte disorders. World J. Clin Cases WJCC 2014, 2, 488. [Google Scholar] [CrossRef]
- Barbosa, A.; Sztajnbok, J. Fluid and electrolyte disorders. J. Pediatr. 1999, 75, S223–S233. [Google Scholar] [CrossRef] [Green Version]
- Gansevoort, R.T.; Correa-Rotter, R.; Hemmelgarn, B.R.; Jafar, T.H.; Heerspink, H.J.L.; Mann, J.F.; Matsushita, K.; Wen, C.P. Chronic kidney disease and cardiovascular risk: Epidemiology, mechanisms, and prevention. Lancet 2013, 382, 339–352. [Google Scholar] [CrossRef]
- Bastian, M.; Heymann, S.; Jacomy, M. Gephi: An open source software for exploring and manipulating networks. In Proceedings of the Third International AAAI Conference on Weblogs and Social Media, San Jose, CA, USA, 17–20 May 2009; pp. 361–362. [Google Scholar]
- Halter, J.B.; Musi, N.; Horne, F.M.; Crandall, J.P.; Goldberg, A.; Harkless, L.; Hazzard, W.R.; Huang, E.S.; Kirkman, M.S.; Plutzky, J.; et al. Diabetes and cardiovascular disease in older adults: Current status and future directions. Diabetes 2014, 63, 2578–2589. [Google Scholar] [CrossRef] [PubMed] [Green Version]
- Cigolle, C.T.; Blaum, C.S.; Halter, J.B. Diabetes and cardiovascular disease prevention in older adults. Clin. Geriatr. Med. 2009, 25, 607–641. [Google Scholar] [CrossRef] [PubMed]
- The Emerging Risk Factors Collaboration. Diabetes mellitus, fasting blood glucose concentration, and risk of vascular disease: A collaborative meta-analysis of 102 prospective studies. Lancet 2010, 375, 2215–2222. [Google Scholar] [CrossRef] [Green Version]


| Dataset Contents | |
|---|---|
| Patient ID | Claim ID |
| Gender | Episode ID |
| Age | Diagnosis procedure code |
| Location postcode | ICD types and codes |
| Provider ID | Diagnosis-related group (DRG) codes |
| Admission and discharge date | |
| Comorbidity | ICD-9-AM Codes | ICD-10-AM Codes |
|---|---|---|
| Congestive heart failure | 398.91, 402.11, 402.91, 404.11, 404.13, 404.91, 404.93, 428.x | I09.9, I1.0, I13.0, I13.2, I25.5, I42.0, I42.5–I42.9, 143.x, 150.x, P29.0 |
| Cardiac arrhythmias | 426.10, 426.11, 426.13, 426.2–426.53, 426.6–426.28, 427.0, 427.2427.31, 427.60, 427.9, 785.0, V45.0, V53.3 | I44.1–I44.3, I45.6, I45.9, I47.x, R00.0, Roo.1, R00.8, T82.1, Z45.0, Z95.0 |
| Valvular disease | 093.2, 394.0–397.1, 424.0–424.91, 746.3–746.6, V42.2, V43.3 | A52.0, I05.x–108.x, I09.1, I09.8, I34.x–I39.x, Q23.0–Q23.3, Z95.2–Z95.4 |
| Pulmonary circulation disorders | 416.x, 417.9 | I26.x, I27.x, I28.0, I28.8, I28.9 |
| Peripheral vascular disorders | 440.x, 441.2, 441.4, 441.7, 441.9, 443.1–443.9, 447.1, 557.1, 557.9, V43.4 | I70.x, I71.x, I73.1, I73.8, I73.9, I77.1, I79.0, I79.2, K55.1, K55.8,K55.9, Z95.8, Z95.9 |
| Type 2 diabetes mellitus | 250.0–250.3, 250.4–250.7, 250.9 | E11.0, E11.1, E11.2–E11.9 |
| Selection Criteria for CohortT2DM&CVD | Selection Criteria for CohortT2DM |
|---|---|
| -Must be first diagnosed with T2DM and then diagnosed with CVD. | -Must be diagnosed with T2DM but not be diagnosed with CVD. |
| -Must have at least one or more admissions after the date of first diagnosis with T2DM but before the date of diagnosis with CVD. | -Must have at least one or more admissions before the date of first diagnosis with T2DM. |
| -For each admission, must have at least one or more ICD codes related to comorbidities from the Elixhauser Index. | -For each admission, must have at least one or more ICD codes related to comorbidities from the Elixhauser Index. |
| Comorbidities | |
|---|---|
| Hypertension, uncomplicated | Solid tumor without metastasis |
| Hypertension, complicated | Rheumatoid arthritis/collagen vascular diseases |
| Paralysis | Coagulopathy |
| Other neurological disorders | Obesity |
| Chronic pulmonary disease | Weight loss |
| Hypothyroidism | Fluid and electrolyte disorders |
| Renal failure | Blood loss anemia |
| Liver disease | Deficiency anemia |
| Peptic ulcer disease excluding bleeding | Alcohol abuse |
| AIDS/HIV | Drug abuse |
| Lymphoma | Psychoses |
| Metastatic cancer | Depression |
| Comorbidities for NT2DM&CVD | Prevalence | Comorbidities for NT2DM | Prevalence |
|---|---|---|---|
| Renal failure | 430 | Depression | 331 |
| Solid tumor without metastasis | 300 | Metastatic cancer | 265 |
| Hypertension | 102 | Solid tumor without metastasis | 205 |
| Peptic ulcer disease excluding bleeding | 71 | Obesity | 114 |
| Fluid and electrolyte disorders | 63 | Peptic ulcer disease excluding bleeding | 40 |
| Other neurological disorders | 60 | Drug abuse | 30 |
| Chronic pulmonary disease | 41 | Paralysis | 22 |
| Liver disease | 24 | Psychoses | 18 |
| Obesity | 21 | Hypertension | 12 |
| Weight loss | 17 | Other neurological disorders | 09 |
| Initial Condition | Next Condition | Normalized Weight |
|---|---|---|
| Fluid and electrolyte disorders | Renal failure | 1 |
| Weight loss | Fluid and electrolyte disorders | 0.80 |
| Renal failure | Chronic pulmonary disease | 0.70 |
| Other neurological disorders | Liver disease | 0.65 |
| Renal failure | Weight loss | 0.61 |
| Network Measures | NT2DM | NT2DM&CVD | NFD |
|---|---|---|---|
| Number of nodes | 22 | 21 | 23 |
| Number of edges | 80 | 120 | 166 |
| Graph density | 0.20 | 0.30 | 0.22 |
| Network diameter | 4 | 4 | 4 |
| Average clustering co-efficient | 0.49 | 0.63 | 0.55 |
| Average path length | 2.11 | 1.90 | 1.91 |
| CohortT2DM&CVD Population % | CohortT2DM Population % | |
|---|---|---|
| Age | ||
| 0–30 | 0 | 0 |
| 31–40 | 0.58 | 0 |
| 41–50 | 1.16 | 0.58 |
| 51–60 | 4.65 | 16.86 |
| 61–70 | 18.60 | 25 |
| 71–80 | 31.39 | 26.74 |
| 81–90 | 35.47 | 24.42 |
| 91–100 | 7.56 | 5.23 |
| ≥101 | 0.58 | 1.16 |
| Gender | ||
| Male | 59.30 | 69.65 |
| Female | 40.70 | 30.35 |
© 2020 by the authors. Licensee MDPI, Basel, Switzerland. This article is an open access article distributed under the terms and conditions of the Creative Commons Attribution (CC BY) license (http://creativecommons.org/licenses/by/4.0/).
Share and Cite
Hossain, M.E.; Uddin, S.; Khan, A.; Moni, M.A. A Framework to Understand the Progression of Cardiovascular Disease for Type 2 Diabetes Mellitus Patients Using a Network Approach. Int. J. Environ. Res. Public Health 2020, 17, 596. https://doi.org/10.3390/ijerph17020596
Hossain ME, Uddin S, Khan A, Moni MA. A Framework to Understand the Progression of Cardiovascular Disease for Type 2 Diabetes Mellitus Patients Using a Network Approach. International Journal of Environmental Research and Public Health. 2020; 17(2):596. https://doi.org/10.3390/ijerph17020596
Chicago/Turabian StyleHossain, Md Ekramul, Shahadat Uddin, Arif Khan, and Mohammad Ali Moni. 2020. "A Framework to Understand the Progression of Cardiovascular Disease for Type 2 Diabetes Mellitus Patients Using a Network Approach" International Journal of Environmental Research and Public Health 17, no. 2: 596. https://doi.org/10.3390/ijerph17020596
APA StyleHossain, M. E., Uddin, S., Khan, A., & Moni, M. A. (2020). A Framework to Understand the Progression of Cardiovascular Disease for Type 2 Diabetes Mellitus Patients Using a Network Approach. International Journal of Environmental Research and Public Health, 17(2), 596. https://doi.org/10.3390/ijerph17020596