Serum Concentrations of Selected Organochlorines in Pregnant Women and Associations with Pregnancy Outcomes. A Cross-Sectional Study from Two Rural Settings in Cambodia


Abstract
:1. Introduction
2. Materials and Methods
2.1. Study Sites and Population
2.2. Ethical Approval
2.3. Questionnaire
2.4. Chemical Analysis and Quality Control
2.5. Measurement of Birth Outcomes
2.6. Statistical Analysis
3. Results
3.1. Demographic, Socioeconomic, and Anthropometric Findings
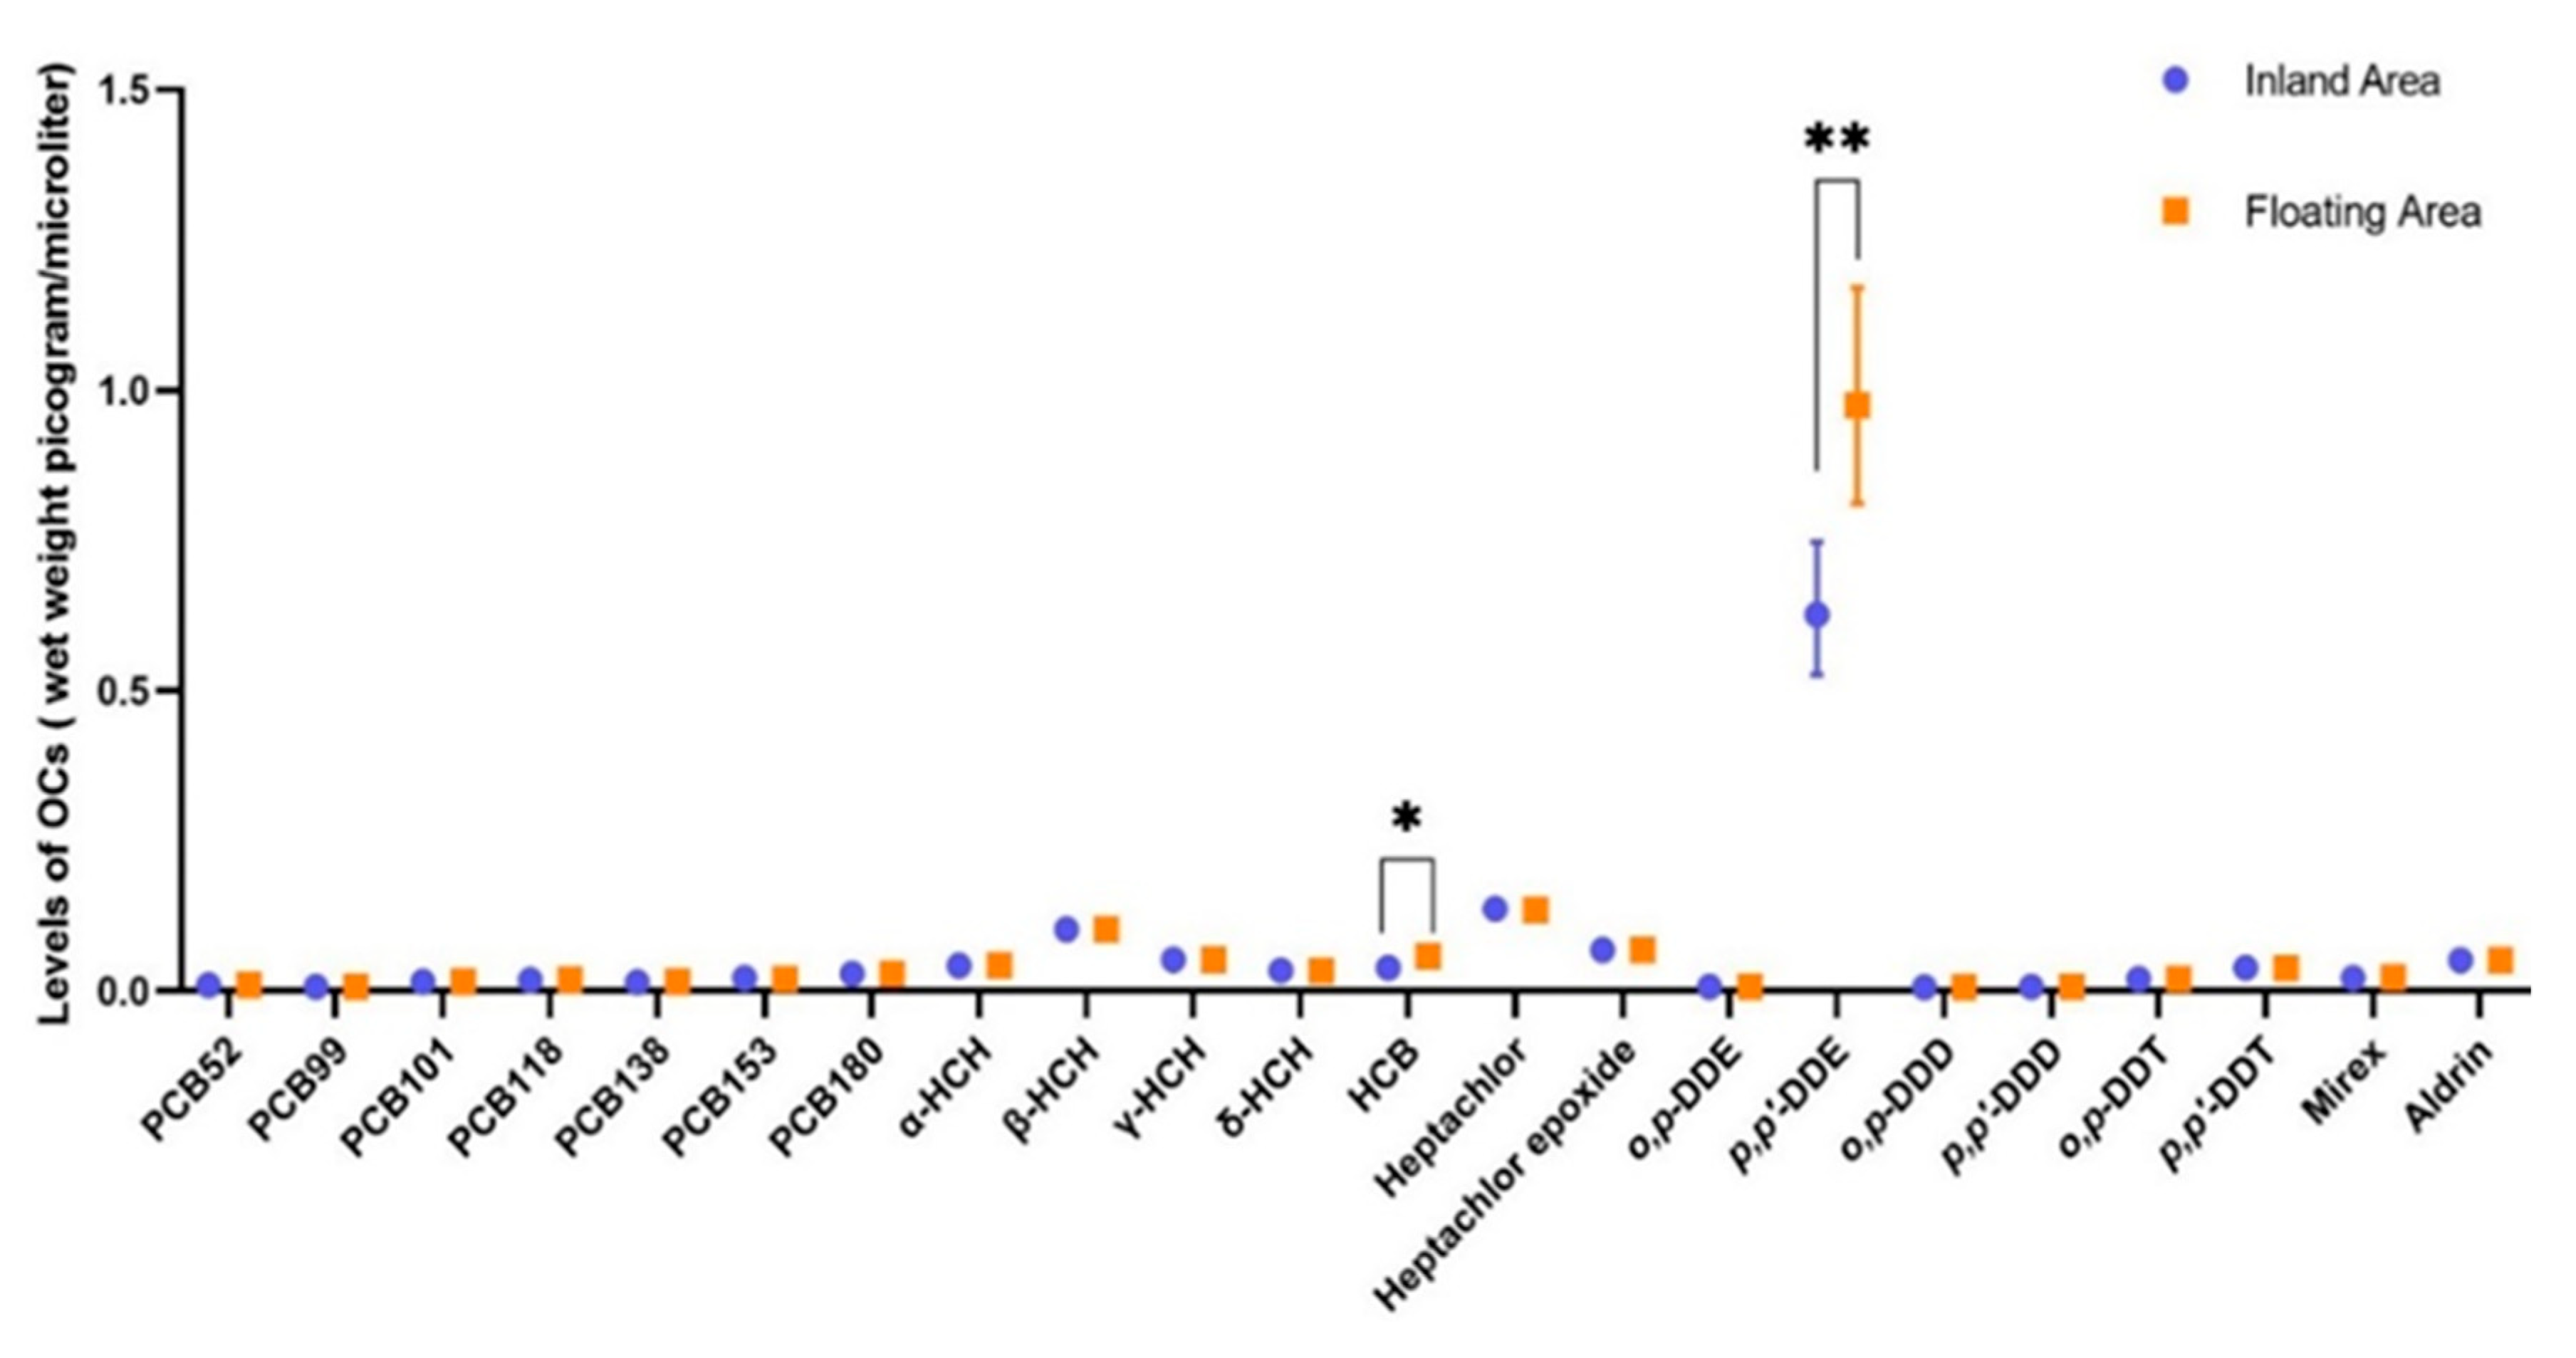
3.2. Distribution of Selected Polychlorinated Biphenyls and Organochlorine Pesticides
3.3. Association between POPs Serum Concentrations and Maternal Characteristics
3.4. Maternal Concentrations of Persistent Organic Pollutants and Pregnancy Outcomes
4. Discussion
5. Conclusions
Supplementary Materials
Author Contributions
Funding
Acknowledgments
Conflicts of Interest
References
- Commission, E.-E. Directive 2010/75/EU of the European Parliament and of the Council of 24 November 2010 on industrial emissions (integrated pollution prevention and control). Off. J. Eur. Union L 2010, 334, 17–119. [Google Scholar]
- Landrigan, P.J.; Fuller, R.; Acosta, N.J.; Adeyi, O.; Arnold, R.; Baldé, A.B.; Bertollini, R.; Bose-O’Reilly, S.; Boufford, J.I.; Breysse, P.N.; et al. The Lancet Commission on pollution and health. Lancet 2018, 391, 462–512. [Google Scholar] [CrossRef] [Green Version]
- Lallas, P.L. The Stockholm Convention on persistent organic pollutants. Am. J. Int. Law 2001, 95, 692–708. [Google Scholar] [CrossRef]
- Bennett, D.; Bellinger, D.C.; Birnbaum, L.S.; Bradman, A.; Chen, A.; Cory-Slechta, D.A.; Engel, S.M.; Fallin, M.D.; Halladay, A.; Hauser, R.; et al. Project TENDR: Targeting Environmental Neuro-Developmental Risks the TENDR Consensus Statement. Environ. Health Perspect. 2016, 124, A118–A122. [Google Scholar] [CrossRef] [PubMed]
- Hertz-Picciotto, I.; Sass, J.B.; Engel, S.; Bennett, D.H.; Bradman, A.; Eskenazi, B.; Lanphear, B.; Whyatt, R. Organophosphate exposures during pregnancy and child neurodevelopment: Recommendations for essential policy reforms. PLoS Med. 2018, 15, e1002671. [Google Scholar] [CrossRef]
- Odland, J.Ø.; Donaldson, S.; Dudarev, A.A.; Carlsen, A. AMAP assessment 2015: Human health in the Arctic. Int. J. Circumpolar Health 2016, 75, 33949. [Google Scholar] [CrossRef]
- Bravo, N.; Grimalt, J.O.; Chashchin, M.; Chashchin, V.P.; Odland, J.Ø. Drivers of maternal accumulation of organohalogen pollutants in Arctic areas (Chukotka, Russia) and 4, 4′-DDT effects on the newborns. Environ. Int. 2019, 124, 541–552. [Google Scholar] [CrossRef]
- Hansen, S.; Odland, J.Ø.; Phi, D.T.; Nieboer, E.; Sandanger, T.M. Maternal levels of organochlorines in two communities in southern Vietnam. Sci. Total Environ. 2009, 408, 225–232. [Google Scholar] [CrossRef]
- United Nations Development Programme (UNDP). Human Development Report 2019: Inequalities in Human Development in the 21st Century. Briefing note for countries on the 2019 Human Development Report: Cambodia. 2019 [Cited 2019]. Available online: http://hdr.undp.org/sites/all/themes/hdr_theme/country-notes/KHM.pdf (accessed on 4 May 2020).
- Office, United Nations Development Programme Human Development Report. Global Multidimensional Poverty Index 2019: Illuminating Inequalities. Oxford Poverty and Human Development Initiative (OPHI), 2019. Available online: http://hdr.undp.org/en/2019-report (accessed on 4 May 2020).
- Steinholt, M.; Ha, S.O.; Houy, C.; Odland, J.Ø.; Odland, M.L. An Increased Risk of Stunting among Newborns in Poorer Rural Settings: A Cross-Sectional Pilot Study among Pregnant Women at Selected Sites in Rural Cambodia. Int. J. Environ. Res. Public Health 2019, 16, 4170. [Google Scholar] [CrossRef] [Green Version]
- Hansen, S.; Nieboer, E.; Bravo, N.; Økland, I.; Matiocevich, S.; Alvarez, M.V.; Nilsen, S.T.; Grimalt, J.O.; Odland, J.Ø. Variations in serum concentrations of selected organochlorines among delivering women in Argentina. The EMASAR study. Environ. Sci. Process. Impacts 2017, 19, 1542–1553. [Google Scholar] [CrossRef] [PubMed] [Green Version]
- Bravo, N.; Hansen, S.; Økland, I.; Garí, M.; Álvarez, M.V.; Matiocevich, S.; Odland, J.Ø.; Grimalt, J.O. Influence of maternal and sociodemographic characteristics on the accumulation of organohalogen compounds in Argentinian women. The EMASAR study. Environ. Res. 2017, 158, 759–767. [Google Scholar] [CrossRef] [PubMed]
- Veyhe, A.S.; Hofoss, D.; Hansen, S.; Thomassen, Y.; Sandanger, T.M.; Odland, J.Ø.; Nieboer, E. The Northern Norway Mother-and-Child Contaminant Cohort (MISA) Study: PCA analyses of environmental contaminants in maternal sera and dietary intake in early pregnancy. Int. J. Hyg. Environ. Health 2015, 218, 254–264. [Google Scholar] [CrossRef] [PubMed]
- De Wit, C. AMAP Assessment 2002: Persistent Organic Pollutants in the Arctic; Arctic Monitoring and Assessment Program: Oslo, Norway, 2004; Volume 16, p. 310. [Google Scholar]
- Yahaya, A.; Okoh, O.O.; Okoh, A.I.; Adeniji, A.O. Occurrences of Organochlorine Pesticides along the Course of the Buffalo River in the Eastern Cape of South Africa and Its Health Implications. Int. J. Environ. Res. Public Health 2017, 14, 1372. [Google Scholar] [CrossRef] [PubMed] [Green Version]
- Kelce, W.R.; Stone, C.R.; Laws, S.C.; Gray, L.E.; Kemppainen, J.A.; Wilson, E.M. Persistent DDT metabolite p,p’–DDE is a potent androgen receptor antagonist. Nat. Cell Biol. 1995, 375, 581–585. [Google Scholar] [CrossRef] [PubMed]
- Kelce, W.R.; Wilson, E.M. Environmental antiandrogens: Developmental effects, molecular mechanisms, and clinical implications. J. Mol. Med. 1997, 75, 198–207. [Google Scholar] [CrossRef] [PubMed]
- Kim, J.; Sun, Q.; Yue, Y.; Yoon, K.S.; Whang, K.-Y.; Clark, J.M.; Park, Y. 4,4′-Dichlorodiphenyltrichloroethane (DDT) and 4,4′-dichlorodiphenyldichloroethylene (DDE) promote adipogenesis in 3T3-L1 adipocyte cell culture. Pestic. Biochem. Physiol. 2016, 131, 40–45. [Google Scholar] [CrossRef] [Green Version]
- King, S.E.; Nilsson, E.; Beck, D.; Skinner, M.K. Adipocyte epigenetic alterations and potential therapeutic targets in transgenerationally inherited lean and obese phenotypes following ancestral exposures. Adipocyte 2019, 8, 362–378. [Google Scholar] [CrossRef] [Green Version]
- Skinner, M.K.; Manikkam, M.; Tracey, R.; Guerrero-Bosagna, C.; Haque, M.; E Nilsson, E. Ancestral dichlorodiphenyltrichloroethane (DDT) exposure promotes epigenetic transgenerational inheritance of obesity. BMC Med. 2013, 11, 228. [Google Scholar] [CrossRef] [Green Version]
- Oluwafemi, O.R.; Njokanma, F.O.; Disu, E.A.; Ogunlesi, T.A. Current pattern of Ponderal Indices of term small-for-gestational age in a population of Nigerian babies. BMC Pediatr. 2013, 13, 110. [Google Scholar] [CrossRef] [Green Version]
- Petit, C.; Chevrier, C.; Durand, G.; Monfort, C.; Rouget, F.; Garlantézec, R.; Cordier, S. Impact on fetal growth of prenatal exposure to pesticides due to agricultural activities: A prospective cohort study in Brittany, France. Environ. Health 2010, 9, 71. [Google Scholar] [CrossRef] [Green Version]
- Eskenazi, B.; An, S.; Rauch, S.A.; Coker, E.S.; Maphula, A.; Obida, M.; Crause, M.; Kogut, K.R.; Bornman, R.; Chevrier, J. Prenatal Exposure to DDT and Pyrethroids for Malaria Control and Child Neurodevelopment: The VHEMBE Cohort, South Africa. Environ. Health Perspect. 2018, 126, 047004. [Google Scholar] [CrossRef] [PubMed]
- Özaltin, E.; Hill, K.; Subramanian, S. Association of maternal stature with offspring mortality, underweight, and stunting in low-to middle-income countries. JAMA 2010, 303, 1507–1516. [Google Scholar] [CrossRef] [PubMed] [Green Version]
- Subramanian, S.V. Association of Maternal Height with Child Mortality, Anthropometric Failure, and Anemia in India. JAMA 2009, 301, 1691–1701. [Google Scholar] [CrossRef] [PubMed] [Green Version]
- Villar, J.; Ismail, L.C.; Victora, C.G.; O Ohuma, E.; Bertino, E.; Altman, D.G.; Lambert, A.; Papageorghiou, A.T.; Carvalho, M.; Jaffer, Y.A.; et al. International standards for newborn weight, length, and head circumference by gestational age and sex: The Newborn Cross-Sectional Study of the INTERGROWTH-21st Project. Lancet 2014, 384, 857–868. [Google Scholar] [CrossRef]
- Brito, N.H.; Noble, K.G. Socioeconomic status and structural brain development. Front. Neurosci. 2014, 8, 276. [Google Scholar] [CrossRef] [Green Version]
- McEwen, B.S.; Gianaros, P.J. Central role of the brain in stress and adaptation: Links to socioeconomic status, health, and disease. Ann. N. Y. Acad. Sci. 2010, 1186, 190–222. [Google Scholar] [CrossRef] [Green Version]
- Alderman, H.; Behrman, J.R.; Glewwe, P.; Fernald, L.; Walker, S. Evidence of Impact of Interventions on Growth and Development during Early and Middle Childhood. In Child and Adolescent Health and Development; Bundy, D.A.P., Ed.; The International Bank for Reconstruction and Development/The World Bank: Washington, DC, USA, 2017. [Google Scholar]
- Grantham-McGregor, S.; Cheung, Y.B.; Cueto, S.; Glewwe, P.; Richter, L.; Strupp, B. Developmental potential in the first 5 years for children in developing countries. Lancet 2007, 369, 60–70. [Google Scholar] [CrossRef] [Green Version]
- Hochberg, Z.; Feil, R.; Constancia, M.; Fraga, M.; Junien, C.; Carel, J.-C.; Boileau, P.; Le Bouc, Y.; Deal, C.L.; Lillycrop, K.; et al. Child health, developmental plasticity, and epigenetic programming. Endocr. Rev. 2011, 32, 159–224. [Google Scholar] [CrossRef]
- Worku, B.N.; Abessa, T.G.; Wondaferash, M.; Vanvuchelen, M.; Bruckers, L.; Kolsteren, P.; Granitzer, M. The relationship of undernutrition/psychosocial factors and developmental outcomes of children in extreme poverty in Ethiopia. BMC Pediatr. 2018, 18, 45. [Google Scholar] [CrossRef] [PubMed] [Green Version]


| Quantitative Variables | All Locations (n = 194) | Inland Area (n = 120) | Floating Area (n = 74) | p Value * | ||||||||
| N (Missing) | Mean (SD) | Median (Min–Max) | N (Missing) | Mean (SD) | Median (Min–Max) | N (Missing) | Mean (SD) | Median (Min–Max) | ||||
| Maternal age | 194 (0) | 26.7 (6.2) | 25.0 (17.0−44.0) | 120 (0) | 26.7 (6.5) | 25.5 (17−44) | 74 (0) | 26.6 (5.7) | 25.0 (18–43) | 0.787 | ||
| Maternal weight (kg) | 194 (0) | 58.8 (8.1) | 58.0 (41.0−84.0) | 120 (0) | 60.3 (7.9) | 60.0 (45.0–84.0) | 74 (0) | 56.4 (8.0) | 56.0 (41.0–79.0) | 0.002 | ||
| Maternal height (cm) | 194 (0) | 155.3 (5.2) | 155.0 (145−167) | 120 (0) | 156.9 (4.8) | 156.0 (145–167) | 74 (0) | 152.6 (4.7) | 153.5 (145–165) | <0.001 | ||
| Maternal BMI (kg/m2) | 194 (0) | 24.4 (3.0) | 24.1 (17.7−34.7) | 120 (0) | 24.5 (2.9) | 24.2 (18.3–32.8) | 74 (0) | 24.2(3.2) | 24.1 (17.7–34.7) | 0.527 | ||
| Education (years) | 156 (38) | 6.3 (3.0) | 6.0 (0−13) | 108 (12) | 7.1 (3.0) | 7 (0–13) | 48 (26) | 4.6 (2.0) | 5.0 (1–9) | <0.001 | ||
| Gravida | 194 (0) | 2.5 (1.8) | 2.0 (1.0−10.0) | 120 (0) | 2.1 (1.5) | 2 (1–10) | 74 (0) | 3.1 (2.1) | 2.0 (1–9) | 0.001 | ||
| Gestational age (weeks) | 144 (50) | 39.1 (1.0) | 39.1 (38−42) | 79 (41) | 40.0 (0.8) | 40.0 (38–42) | 65 (9) | 38.4 (0.7) | 38.0 (38–40) | <0.001 | ||
| Birth weight (kg) | 149 (45) | 3.1 (0.4) | 3.0 (2.0−4.4) | 83 (37) | 3.2 (0.4) | 3.1 (2.4–4.4) | 66 (8) | 3.0 (0.4) | 3 (2.0–3.8) | 0.001 | ||
| Birth length (cm) | 147 (47) | 48.9 (2.9) | 49.0 (32.0−58.0) | 83 (37) | 48.5 (3.4) | 49.0 (32.0–54.0) | 64 (10) | 49.5 (2.2) | 49.0 (46.0–58.0) | 0.311 | ||
| Head circumference | 147 (47) | 31.7 (2.9) | 32.0 (24.7−54.0) | 82 (38) | 32.8 (2.6) | 33.0 (28.0–54.0) | 65 (9) | 30.2 (2.6) | 30.0 (27.0–39.0) | <0.001 | ||
| Ponderal index | 147 (47) | 26.9 (7.3) | 25.5 (15.08−91.55) | 83 (37) | 28.6 (8.9) | 27.0 (21.6–91.55) | 64 (10) | 24.7 (3.4) | 24.7 (15.1–33.7) | <0.001 | ||
| Categorical variables | Category | All locations (n = 194) | Inland area (n = 120) | Floating area (n = 74) | ||||||||
| Count | Percentage | Count | Percentage | Count | Percentage | |||||||
| Parity | Para 0/Para (1−3)/Para (≥4) | 82/93/19 | 42.3/47.9/9.8 | 59/56/5 | 49.2/46.7/4.2 | 23/37/14 | 31.1/50.0/18.9 | |||||
| Newborns gender | Boy/Girl/Missing data | 81/91/22 | 41.7/46.9/11.3 | 58/44/18 | 48.3/36.7/15.0 | 23/47/4 | 31.1/63.5/5.4 | |||||
| Occupation | Housewife/Workers/Farmers/Teachers/Fishing | 67/29/55/4/39 | 34.5/14.9/28.4/2.1/20.1 | 34/28/54/4/0 | 28.3/23.3/45.0/3.3/0 | 33/1/1/0/39 | 44.6/1.4/1.4/0/52.7 | |||||
| Water source | River and Pond/Rainwater/Well/Bottled | 77/64/45/8 | 39.7/32.9/23.2/4.1 | 8/64/45/3 | 6.7/53.3/37.5/2.5 | 69/0/0/5 | 93.2/0/0/6.8 | |||||
| Insecticide use | No/Yes | 85/109 | 43.8/56.2 | 70/50 | 58.3/41.7 | 15/59 | 20.3/79.7 | |||||
| Where use the insecticide | Home and farm/Home only | 36/73 | 33.0/67.0 | 35/15 | 70/30 | 1/58 | 1.7/98.3 | |||||
| Food source | In village/Market/Missing data | 123/70/1 | 63.4/36.1/0.5 | 119/1/0 | 99.2/0.8/0 | 4/69/1 | 5.4/93.2/1.4 | |||||
| Contaminants | GM * | 95% Confidence interval * | Median | Minimum | Maximum |
|---|---|---|---|---|---|
| PCB 52 | 0.010 | 0.010–0.010 | 0.010 | 0.010 | 0.010 |
| PCB 99 | 0.008 | 0.008–0.008 | 0.008 | 0.008 | 0.055 |
| PCB 101 | 0.016 | 0.016–0.016 | 0.016 | 0.016 | 0.020 |
| PCB 118 | 0.018 | 0.017–0.019 | 0.015 | 0.015 | 0.112 |
| PCB 138 | 0.015 | 0.014–0.017 | 0.012 | 0.012 | 0.601 |
| PCB 153 | 0.021 | 0.019–0.023 | 0.014 | 0.014 | 1.173 |
| PCB 180 | 0.029 | 0.028–0.030 | 0.028 | 0.028 | 0.423 |
| α-HCH | 0.043 | 0.043–0.043 | 0.043 | 0.043 | 0.043 |
| β-HCH | 0.103 | 0.103–0.103 | 0.103 | 0.103 | 0.103 |
| γ-HCH | 0.053 | 0.053–0.053 | 0.053 | 0.053 | 0.053 |
| δ-HCH | 0.034 | 0.034–0.035 | 0.034 | 0.034 | 0.070 |
| HCB | 0.046 | 0.042–0.049 | 0.044 | 0.010 | 0.196 |
| Heptachlor | 0.136 | 0.135- 0.138 | 0.135 | 0.135 | 0.352 |
| Heptachlor epoxide | 0.069 | 0.069–0.069 | 0.069 | 0.069 | 0.069 |
| o,p-DDE | 0.008 | 0.008–0.008 | 0.008 | 0.008 | 0.010 |
| p,p’-DDE | 0.742 | 0.651– 0.846 | 0.720 | 0.020 | 8.047 |
| o,p-DDD | 0.007 | 0.007–0.008 | 0.007 | 0.007 | 0.018 |
| p,p’–DDD | 0.008 | 0.008–0.008 | 0.008 | 0.008 | 0.010 |
| o,p-DDT | 0.020 | 0.020–0.020 | 0.020 | 0.020 | 0.020 |
| p,p’-DDT | 0.038 | 0.036–0.041 | 0.033 | 0.030 | 0.519 |
| Mirex | 0.023 | 0.022–0.023 | 0.022 | 0.020 | 0.113 |
| Aldrin | 0.052 | 0.052–0.052 | 0.052 | 0.050 | 0.052 |
| PCB 99 a | PCB 101 a | PCB 118 a | PCB 138 a | PCB 153 a | PCB 180 a | HCB a | Heptachlor a | o,p-DDE a | p,p’-DDE a | o,p-DDD a | p,p’-DDD a | p,p’-DDT a | Mirex a | Aldrin a | |
|---|---|---|---|---|---|---|---|---|---|---|---|---|---|---|---|
| Age | 0.10 | −0.01 | −0.07 | 0.17 | 0.26 * | 0.19 | 0.15 | 0.01 | 0.06 | 0.39 ** | 0.18 | 0.22 | 0.22 | −0.22 | −0.22 |
| BMI | −0.06 | −0.01 | 0.04 | −0.03 | −0.06 | −0.08 | 0.14 | −0.07 | −0.17 | 0.07 | −0.05 | −0.22 | −0.11 | 0.07 | 0.22 |
| Parity b | |||||||||||||||
| Para (1−3) | −0.13 | 0.08 | −0.07 | −0.24 * | −0.33 * | −0.17 | −0.29 * | −0.08 | 0.17 | −0.45 ** | −0.05 | 0.05 | 0.002 | 0.10 | −0.05 |
| Para (≥4) | −0.08 | −0.02 | −0.02 | −0.20 | −0.31 * | −0.12 | −0.25 * | −0.02 | 0.03 | −0.45 ** | −0.08 | −0.04 | −0.11 | 0.42 ** | 0.04 |
| Education | 0.12 | −0.16 | −0.04 | 0.07 | 0.07 | 0.10 | 0.07 | 0.08 | −0.09 | 0.21 * | −0.14 | −0.01 | 0.24 * | −0.04 | 0.01 |
| Residence area c | 0.07 | −0.02 | −0.23 | −0.28 | −0.24 | 0.06 | 0.33 | 0.13 | −0.04 | −0.08 | −0.17 | −0.03 | −0.16 | 0.05 | 0.03 |
| Insecticide use d | 0.05 | 0.07 | 0.11 | 0.06 | 0.002 | 0.13 | −0.08 | −0.09 | −0.18 | 0.19 * | −0.17 | −0.12 | 0.12 | 0.03 | 0.12 |
| Food source e | 0.04 | −0.03 | −0.01 | 0.52 * | 0.36 | 0.04 | 0.35 | −0.02 | 0.05 | 0.34 | 0.11 | 0.09 | 0.14 | −0.29 | −0.09 |
| Water source f | |||||||||||||||
| Rainwater | −0.13 | 0.08 | −0.01 | −0.10 | −0.09 | −0.12 | −0.14 | −0.05 | 0.06 | 0.15 | −0.28 | −0.04 | −0.12 | 0.06 | 0.04 |
| Well | −0.10 | 0.18 | −0.09 | −0.09 | −0.13 | −0.09 | −0.02 | 0.03 | 0.07 | 0.08 | −0.16 | −0.09 | −0.01 | −0.01 | 0.09 |
| Bottled | −0.05 | 0.03 | −0.00 | −0.04 | 0.07 | −0.05 | −0.04 | −0.01 | 0.003 | 0.04 | −0.13 | −0.04 | −0.13 | −0.03 | 0.04 |
| Occupation g | |||||||||||||||
| Worker | 0.02 | −0.01 | −0.11 | 0.00 | 0.15 | 0.03 | 0.12 | 0.13 | −0.01 | 0.12 | −0.27 | 0.02 | −0.14 | −0.04 | −0.02 |
| Farmers | 0.14 | 0.18 | 0.02 | 0.12 | 0.06 | 0.09 | −0.10 | 0.08 | 0.23 | −0.08 | −0.27 | 0.14 | −0.20 | −0.05 | −0.14 |
| Teacher | −0.04 | 0.07 | 0.22 * | 0.07 | 0.19 * | −0.04 | 0.07 | −0.02 | 0.03 | 0.01 | −0.09 | −0.01 | 0.05 | 0.03 | 0.01 |
| Fishing | 0.01 | −0.01 | 0.07 | −0.11 | −0.06 | 0.003 | −0.12 | 0.002 | −0.01 | 0.01 | −0.04 | −0.01 | 0.05 | 0.24 * | 0.01 |
| Gestational Age b (n = 108) | Birth Weight c (n = 109) | Birth Length c (n = 108) | Head Circumference c (n = 108) | Ponderal Index c (n = 108) | ||||||
|---|---|---|---|---|---|---|---|---|---|---|
| Std. β d (95% CI) | p Value | Std. βd (95% CI) | p Value | Std. βd (95% CI) | p Value | Std. βd (95% CI) | p Value | Std. β d (95% CI) | p Value | |
| PCB 99 a | −0.16 (−2.51 to −0.07) | 0.039 | −0.01 (−0.68 to 0.62) | 0.930 | −0.14 (−9.13 to 1.68) | 0.174 | −0.03 (−5.61 to 3.97) | 0.735 | 0.09 (−8.41 to 20.69) | 0.404 |
| PCB 101 a | 0.06 (−10.27 to 22.64) | 0.457 | 0.08 (−4.69 to 12.02) | 0.386 | 0.01 (−66.65 to 75.11) | 0.906 | 0.02 (−54.08 to 70.37) | 0.796 | −0.01 (−201.05 to 178.20) | 0.905 |
| PCB 118 a | −0.02 (−1.15 to 0.94) | 0.842 | −0.08 (−0.71 to 0.33) | 0.468 | −0.22 (−8.79 to −0.19) | 0.041 | 0.06 (−2.73 to 4.98) | 0.564 | 0.21 (−0.35 to 22.73) | 0.057 |
| PCB 138 a | −0.24 (−1.28 to −0.32) | 0.003 | −0.04 (−0.38 to 0.25) | 0.680 | −0.16 (−4.70 to 0.66) | 0.139 | 0.002 (−2.36 to 2.40) | 0.986 | 0.10 (−3.98 to 10.46) | 0.375 |
| PCB 153 a | −0.18 (−1.06 to −0.05) | 0.032 | 0.02 (−0.24 to 0.29) | 0.856 | −0.20 (−4.31 to 0.07) | 0.058 | −0.092 (−2.90 to 1.02) | 0.343 | 0.20 (−0.42 to 11.30) | 0.068 |
| PCB 180 a | −0.15 (−3.16 to 0.02) | 0.052 | −0.07 (−1.15 to 0.51) | 0.446 | −0.20 (−14.07 to −0.35) | 0.040 | −0.02 (−7.01 to 5.31) | 0.785 | 0.12 (−7.50 to 29.77) | 0.239 |
| HCB a | 0.06 (−0.47 to 0.90) | 0.527 | 0.001 (−0.35 to 0.35) | 0.990 | −0.02 (−3.15 to 2.74) | 0.889 | −0.07 (−3.53 to 1.63) | 0.466 | 0.01 (−7.42 to 8.33) | 0.908 |
| Heptachlor a | −0.09 (−5.42 to 1.49) | 0.262 | −0.01 (−1.86 to 1.69) | 0.928 | −0.02 (−16.55 to 13.41) | 0.836 | 0.02 (−11.70 to 14.64) | 0.825 | 0.02 (−36.58 to 43.59) | 0.863 |
| o,p-DDE a | −0.21 (−33.19 to −4.43) | 0.011 | 0.08 (−4.27 to 10.35) | 0.411 | −0.32 (−156.86 to −39.49) | 0.001 | 0.04 (−42.28 to 66.47) | 0.660 | 0.35 (121.95−433.79) | 0.001 |
| p,p’-DDEa | 0.02 (−0.30 to 0.40) | 0.776 | −0.06 (−0.23 to 0.12) | 0.548 | 0.06 (−1.05 to 1.94) | 0.558 | 0.03 (−1.10 to 1.52) | 0.750 | −0.08 (−5.43 to 2.55) | 0.475 |
| o,p-DDD a | −0.15 (−6.73 to 0.28) | 0.071 | 0.21 (0.08−3.64) | 0.041 | −0.08 (−21.37 to 9.28) | 0.436 | −0.004 (−13.75 to 13.24) | 0.970 | 0.15 (−11.02 to 70.35) | 0.151 |
| p,p’-DDD a | −0.10 (−23.42 to 4.96) | 0.200 | 0.04 (−5.58 to 8.46) | 0.684 | −0.25 (−132.95 to 18.26) | 0.010 | 0.06 (−33.59 to 70.40) | 0.484 | 0.28 (64.81−369.92) | 0.006 |
| p,p’-DDT a | −0.11 (−1.71 to 0.25) | 0.144 | −0.02 (−0.56 to 0.46) | 0.849 | −0.07 (−5.87 to 2.68) | 0.462 | −0.10 (−5.87 to 1.62) | 0.262 | 0.04 (−9.46 to 13.47) | 0.729 |
| Mirex a | −0.05 (5.00 to 2.65) | 0.544 | 0.06 (−1.34 to 2.54) | 0.542 | 0.03 (−13.99 to 18.91) | 0.767 | −0.09 (−21.36 to 7.40) | 0.338 | 0.003 (−43.48 to 44.57) | 0.980 |
| Aldrin a | 0.10 (−32.18 to 151.99) | 0.200 | −0.04 (−54.93 to 36.21) | 0.684 | 0.25 (118.52–862.91) | 0.010 | −0.06 (−456.9 to 218.03) | 0.484 | −0.28 (−2400.97 to −420.65) | 0.006 |
Publisher’s Note: MDPI stays neutral with regard to jurisdictional claims in published maps and institutional affiliations. |
© 2020 by the authors. Licensee MDPI, Basel, Switzerland. This article is an open access article distributed under the terms and conditions of the Creative Commons Attribution (CC BY) license (http://creativecommons.org/licenses/by/4.0/).
Share and Cite
Steinholt, M.; Xu, S.; Ha, S.O.; Phi, D.T.; Odland, M.L.; Odland, J.Ø. Serum Concentrations of Selected Organochlorines in Pregnant Women and Associations with Pregnancy Outcomes. A Cross-Sectional Study from Two Rural Settings in Cambodia. Int. J. Environ. Res. Public Health 2020, 17, 7652. https://doi.org/10.3390/ijerph17207652
Steinholt M, Xu S, Ha SO, Phi DT, Odland ML, Odland JØ. Serum Concentrations of Selected Organochlorines in Pregnant Women and Associations with Pregnancy Outcomes. A Cross-Sectional Study from Two Rural Settings in Cambodia. International Journal of Environmental Research and Public Health. 2020; 17(20):7652. https://doi.org/10.3390/ijerph17207652
Chicago/Turabian StyleSteinholt, Margit, Shanshan Xu, Sam Ol Ha, Duong Trong Phi, Maria Lisa Odland, and Jon Øyvind Odland. 2020. "Serum Concentrations of Selected Organochlorines in Pregnant Women and Associations with Pregnancy Outcomes. A Cross-Sectional Study from Two Rural Settings in Cambodia" International Journal of Environmental Research and Public Health 17, no. 20: 7652. https://doi.org/10.3390/ijerph17207652
APA StyleSteinholt, M., Xu, S., Ha, S. O., Phi, D. T., Odland, M. L., & Odland, J. Ø. (2020). Serum Concentrations of Selected Organochlorines in Pregnant Women and Associations with Pregnancy Outcomes. A Cross-Sectional Study from Two Rural Settings in Cambodia. International Journal of Environmental Research and Public Health, 17(20), 7652. https://doi.org/10.3390/ijerph17207652