Association between Peak Expiratory Flow Rate and Exposure Level to Indoor PM2.5 in Asthmatic Children, Using Data from the Escort Intervention Study

 , , ,
, , ,
Abstract
:1. Introduction
2. Materials and Methods
2.1. Study Design
2.2. Study Population
2.3. Measurement of PEFR and Fractional Exhaled Nitric Oxide (FeNO)
2.4. Indoor Air Pollution Data
2.5. Data Analysis
3. Results
4. Discussion
5. Conclusions
Author Contributions
Funding
Acknowledgments
Conflicts of Interest
References
- World Health Organization (WHO). Health Effects of Particulate Matter: Policy Implications for Countries in Eastern Europe, Caucasus, and Central Asia. 2013. Available online: https://www.euro.who.int/en/health-topics/environment-and-health/airquality/publications/2013/health-effects-of-particulate-matter.-policy-implications-for-countries-in-eastern-europe,-caucasus-and-central-asia-2013 (accessed on 5 June 2020).
- Kim, H.; Kim, E.; Bae, C.; Cho, J.; Kim, B.; Kim, S. Regional contributions to particulate matter concentration in the Seoul metropolitan area, South Korea: Seasonal variation and sensitivity to meteorology and emissions inventory. Atmos. Chem. Phys. 2017, 17, 10315–10332. [Google Scholar] [CrossRef] [Green Version]
- Xu, C.; Li, N.; Yang, Y.; Li, Y.; Liu, Z.; Wang, Q.; Zheng, T.; Civitarese, A.; Xu, D. Investigation and modeling of the residential infiltration of fine particulate matter in Beijing, China. J. Air Waste Manag. Assoc. 2017, 67, 694–701. [Google Scholar] [CrossRef] [PubMed]
- Pope, C.A., III; Ezzati, M.; Dockery, D.W. Fine-particulate air pollution and life expectancy in the United States. N. Engl. J. Med. 2009, 360, 376–386. [Google Scholar] [CrossRef] [PubMed] [Green Version]
- Breysse, P.N.; Diette, G.B.; Matsui, E.C.; Butz, A.M.; Hansel, N.N.; McCormack, M.C. Indoor air pollution and asthma in children. Proc. Am. Thorac. Soc. 2010, 7, 102–106. [Google Scholar] [CrossRef]
- Wu, J.; Zhong, T.; Zhu, Y.; Ge, D.; Lin, X.; Li, Q. Effects of particulate matter (PM) on childhood asthma exacerbation and control in Xiamen, China. BMC Pediatr. 2019, 19, 194. [Google Scholar] [CrossRef] [Green Version]
- Liu, A.H.; Babineau, D.C.; Krouse, R.Z.; Zoratti, E.M.; Pongracic, J.A.; O’Connor, G.T.; Wood, R.A.; Khurana Hershey, G.K.; Kercsmar, C.M.; Gruchalla, R.S.; et al. Pathways through which asthma risk factors contribute to asthma severity in inner-city children. J. Allergy Clin. Immunol. 2016, 138, 1042–1050. [Google Scholar] [CrossRef] [Green Version]
- Odajima, H.; Yamazaki, S.; Nitta, H. Decline in peak expiratory flow according to hourly short-term concentration of particulate matter in asthmatic children. Inhal. Toxicol. 2008, 20, 1263–1272. [Google Scholar] [CrossRef]
- Tang, C.S.; Chang, L.T.; Lee, H.C.; Chan, C.C. Effects of personal particulate matter on peak expiratory flow rate of asthmatic children. Sci. Total Environ. 2007, 382, 43–51. [Google Scholar] [CrossRef]
- Park, H.K.; Cheng, K.C.; Tetteh, A.O.; Hildemann, L.M.; Nadeau, K.C. Effectiveness of air purifier on health outcomes and indoor particles in homes of children with allergic diseases in Fresno, California: A pilot study. J. Asthma Off. J. Assoc. Care Asthma 2017, 54, 341–346. [Google Scholar] [CrossRef]
- Jhun, I.; Gaffin, J.M.; Coull, B.A.; Huffaker, M.F.; Petty, C.R.; Sheehan, W.J.; Baxi, S.N.; Lai, P.S.; Kang, C.M.; Wolfson, J.M.; et al. School environmental intervention to reduce particulate pollutant exposures for children with Asthma. J. Allergy Clin. Immunol. Pract. 2017, 5, 154–159. [Google Scholar] [CrossRef] [Green Version]
- Ward, T.J.; Semmens, E.O.; Weiler, E.; Harrar, S.; Noonan, C.W. Efficacy of interventions targeting household air pollution from residential wood stoves. J. Expo. Sci. Environ. Epidemiol. 2017, 27, 64–71. [Google Scholar] [CrossRef] [PubMed]
- Chen, R.; Zhao, A.; Chen, H.; Zhao, Z.; Cai, J.; Wang, C.; Yang, C.; Li, H.; Xu, X.; Ha, S.; et al. Cardiopulmonary benefits of reducing indoor particles of outdoor origin: A randomized, double-blind crossover trial of air purifiers. J. Am. Coll. Cardiol. 2015, 65, 2279–2287. [Google Scholar] [CrossRef] [Green Version]
- Barn, P.; Gombojav, E.; Ochir, C.; Laagan, B.; Beejin, B.; Naidan, G.; Boldbaatar, B.; Galsuren, J.; Byambaa, T.; Janes, C.; et al. The effect of portable HEPA filter air cleaners on indoor PM2.5 concentrations and second hand tobacco smoke exposure among pregnant women in Ulaanbaatar, Mongolia: The UGAAR randomized controlled trial. Sci. Total Environ. 2018, 615, 1379–1389. [Google Scholar] [CrossRef] [PubMed]
- SuJung, P.; Choon-sik, P.; Dae-hyeon, L.; Sangwoon, L.; Soyoung, J.; Sol, Y.; SungRoul, K. Impact of Indoor Pan-frying cooking activity on Change of Indoor PM2.5 Concentration Level in Asthmatics’ Homes. J. Environ. Sci. Int. 2020, 29, 109–117. [Google Scholar]
- Lee, G.H.; Kim, J.H.; Kim, S.; Lee, S.; Lim, D.H. Effects of Indoor Air Purifiers on Children with Asthma. Yonsei Med. J. 2020, 61, 310–316. [Google Scholar] [CrossRef] [PubMed]
- Schulz, K.F.; Altman, D.G.; Moher, D.; Group, C. CONSORT 2010 statement: Updated guidelines for reporting parallel group randomised trials. BMJ 2010, 340, c332. [Google Scholar] [CrossRef]
- Global Initiative for Asthma. Global Strategy for Asthma Management and Prevention; Global Initiative for Asthma: Fontana, CA, USA, 2019; Available online: https://ginasthma.org/wp-content/uploads/2019/06/GINA-2019-main-report-June-2019-wms.pdf (accessed on 5 June 2020).
- BTS COPD Consortium. Spirometry in Practice: A Practical Guide to Using Spirometry in Primary Care; British Thoracic Society (BTS) COPD Consortium: London, UK, 2005; Volume 2. [Google Scholar]
- Smart One. FEV1 and Peak Flow on Your Smart Phone. Available online: https://www.mirsmartone.com/wp-content/uploads/2018/11/SmartOne_ENG_201705-1.pdf (accessed on 5 June 2020).
- Garbe, B. Achieving quality spirometry in the office. Breathe 2010, 6, 211–219. [Google Scholar] [CrossRef]
- Cho, H.-J.; Jung, Y.-H.; Yang, S.-I.; Lee, E.; Kim, H.Y.; Seo, J.-H.; Kwon, J.-W.; Kim, B.-J.; Kim, H.-B.; Lee, S.-Y.; et al. Reference values and determinants of fractional concentration of exhaled nitric oxide in healthy children. Allergy Asthma Immunol. Res. 2014, 6, 169–174. [Google Scholar] [CrossRef] [Green Version]
- Paganelli, R.; Ansotegui, I.J.; Sastre, J.; Lange, C.E.; Roovers, M.H.; de Groot, H.; Lindholm, N.B.; Ewan, P.W. Specific IgE antibodies in the diagnosis of atopic disease. Clinical evaluation of a new in vitro test system, UniCAP, in six European allergy clinics. Allergy 1998, 53, 763–768. [Google Scholar] [CrossRef]
- Kim, S.; Park, S.; Lee, J. Evaluation of Performance of Inexpensive Laser Based PM2.5 Sensor Monitors for Typical Indoor and Outdoor Hotspots of South Korea. Appl. Sci. 2019, 9, 1947. [Google Scholar] [CrossRef] [Green Version]
- Korea Legislation Research Institute. Special act on the Reduction and Management of Fine Dust. 2019. Available online: https://elaw.klri.re.kr/eng_mobile/viewer.do?hseq=50524&type=sogan&key=16 (accessed on 5 June 2020).
- Yu, S.; Park, S.; Park, C.S.; Kim, S. Association between the Ratio of FEV1 to FVC and the exposure level to air pollution in neversmoking adult refractory asthmatics using data clustered by patient in the Soonchunhyang Asthma Cohort Database. Int. J. Environ. Res Public Health 2018, 15, 2349. [Google Scholar] [CrossRef] [Green Version]
- Kajbafzadeh, M.; Brauer, M.; Karlen, B.; Carlsten, C.; van Eeden, S.; Allen, R.W. The impacts of traffic-related and woodsmoke particulate matter on measures of cardiovascular health: A HEPA filter intervention study. Occup. Environ. Med 2015, 72, 394–400. [Google Scholar] [CrossRef] [Green Version]
- Weichenthal, S.; Mallach, G.; Kulka, R.; Black, A.; Wheeler, A.; You, H.; St-Jean, M.; Kwiatkowski, R.; Sharp, D. A randomized double-blind crossover study of indoor air filtration and acute changes in cardiorespiratory health in a First Nations community. Indoor Air 2013, 23, 175–184. [Google Scholar] [CrossRef]
- Awbi, H.B. Air Distribution in Rooms: Ventilation for health and sustainable environment. In Air Distribution in Rooms; Elsevier Science Ltd.: Reading, UK, 2000; Volume 1. [Google Scholar]
- O’Connor, G.T.; Neas, L.; Vaughn, B.; Kattan, M.; Mitchell, H.; Crain, E.F.; Evans, R., III; Gruchalla, R.; Morgan, W.; Stout, J.; et al. Acute respiratory health effects of air pollution on children with asthma in US inner cities. J. Allergy Clin. Immunol. 2008, 121, 1133–1139. [Google Scholar] [CrossRef] [Green Version]
- World Health Organization. WHO Air Quality Guidelines for Particulate Matter, Ozone, Nitrogen Dioxide and Sulfur Dioxide; WHO: Geneva, Switzerland, 2005. [Google Scholar]
- Delfino, R.J.; Gong, H.; Linn, W.S.; Hu, Y.; Pellizzari, E.D. Respiratory symptoms and peak expiratory flow in children with asthma in relation to volatile organic compounds in exhaled breath and ambient air. J. Expo. Anal. Environ. Epidemiol. 2003, 13, 348–363. [Google Scholar] [CrossRef] [PubMed] [Green Version]
- Yoda, Y.; Takagi, H.; Wakamatsu, J.; Ito, T.; Nakatsubo, R.; Horie, Y.; Hiraki, T.; Shima, M. Acute effects of air pollutants on pulmonary function among students: A panel study in an isolated island. Environ. Health Prev. Med. 2017, 22, 33. [Google Scholar] [CrossRef] [PubMed] [Green Version]
- Woo, J.; Rudasingwa, G.; Kim, S. Assessment of daily personal PM2.5 Exposure Level according to four major activities among Children. Appl. Sci. 2020, 10, 159. [Google Scholar] [CrossRef] [Green Version]
- Lewis, T.C.; Robins, T.G.; Dvonch, J.T.; Keeler, G.J.; Yip, F.Y.; Mentz, G.B.; Lin, X.; Parker, E.A.; Israel, B.A.; Gonzalez, L.; et al. Air pollution-associated changes in lung function among asthmatic children in Detroit. Environ. Health Perspect. 2005, 113, 1068–1075. [Google Scholar] [CrossRef] [PubMed] [Green Version]


| Variable | Control (n = 13) | Experiment (n = 13) | p-Value * |
|---|---|---|---|
| Sex (F, %) | 15.3 | 7.6 | 0.3562 |
| Age (years) | 8.5 (7.0–9.0) | 9.5 (6.0–11.0) | 0.7734 |
| BMI (kg/m2) | 17.4 (15.3–23.0) | 18.1 (15.8–23.6) | 0.5714 |
| BMI percentile | 78.6 (48.8–94.6) | 85.6 (61.2–96.9) | 0.4558 |
| Height (cm) | 130.4 (128.2–139.1) | 134.5 (121.7–146.7) | 0.9385 |
| Weight (kg) | 29.3 (26.6–41.6) | 33.5 (23.9–49.5) | 0.8571 |
| IgE (IU/mL) | 131.9 (16.1–527.9) | 259.3 (119.8–462.8) | 0.3418 |
| FeNO (ppb) | 20.5 (18.0–28.0) | 16.0 (10.0–32.0) | 0.6218 |
| PEFR (L/min) | 426.0 (395.0–446.5) | 393.0 (222.0–402.0) | 0.3407 |
| Variable | Control (n = 13) | Experiment (n = 13) | p-Value * |
|---|---|---|---|
| PM2.5 (μg/m3) | 18.9 (17.3–19.4) | 17.0 (12.0–19.9) | 0.4307 |
| CO2 (ppm) | 501.6 (488.4–627.2) | 676.5 (444.2–908.8) | 0.8606 |
| Temperature (°C) | 29.0 (28.1–29.4) | 29.0 (27.7–29.3) | 0.4395 |
| Relative humidity (%) | 54.7 (53.8–57.3) | 55.7 (53.5–56.1) | 0.8438 |
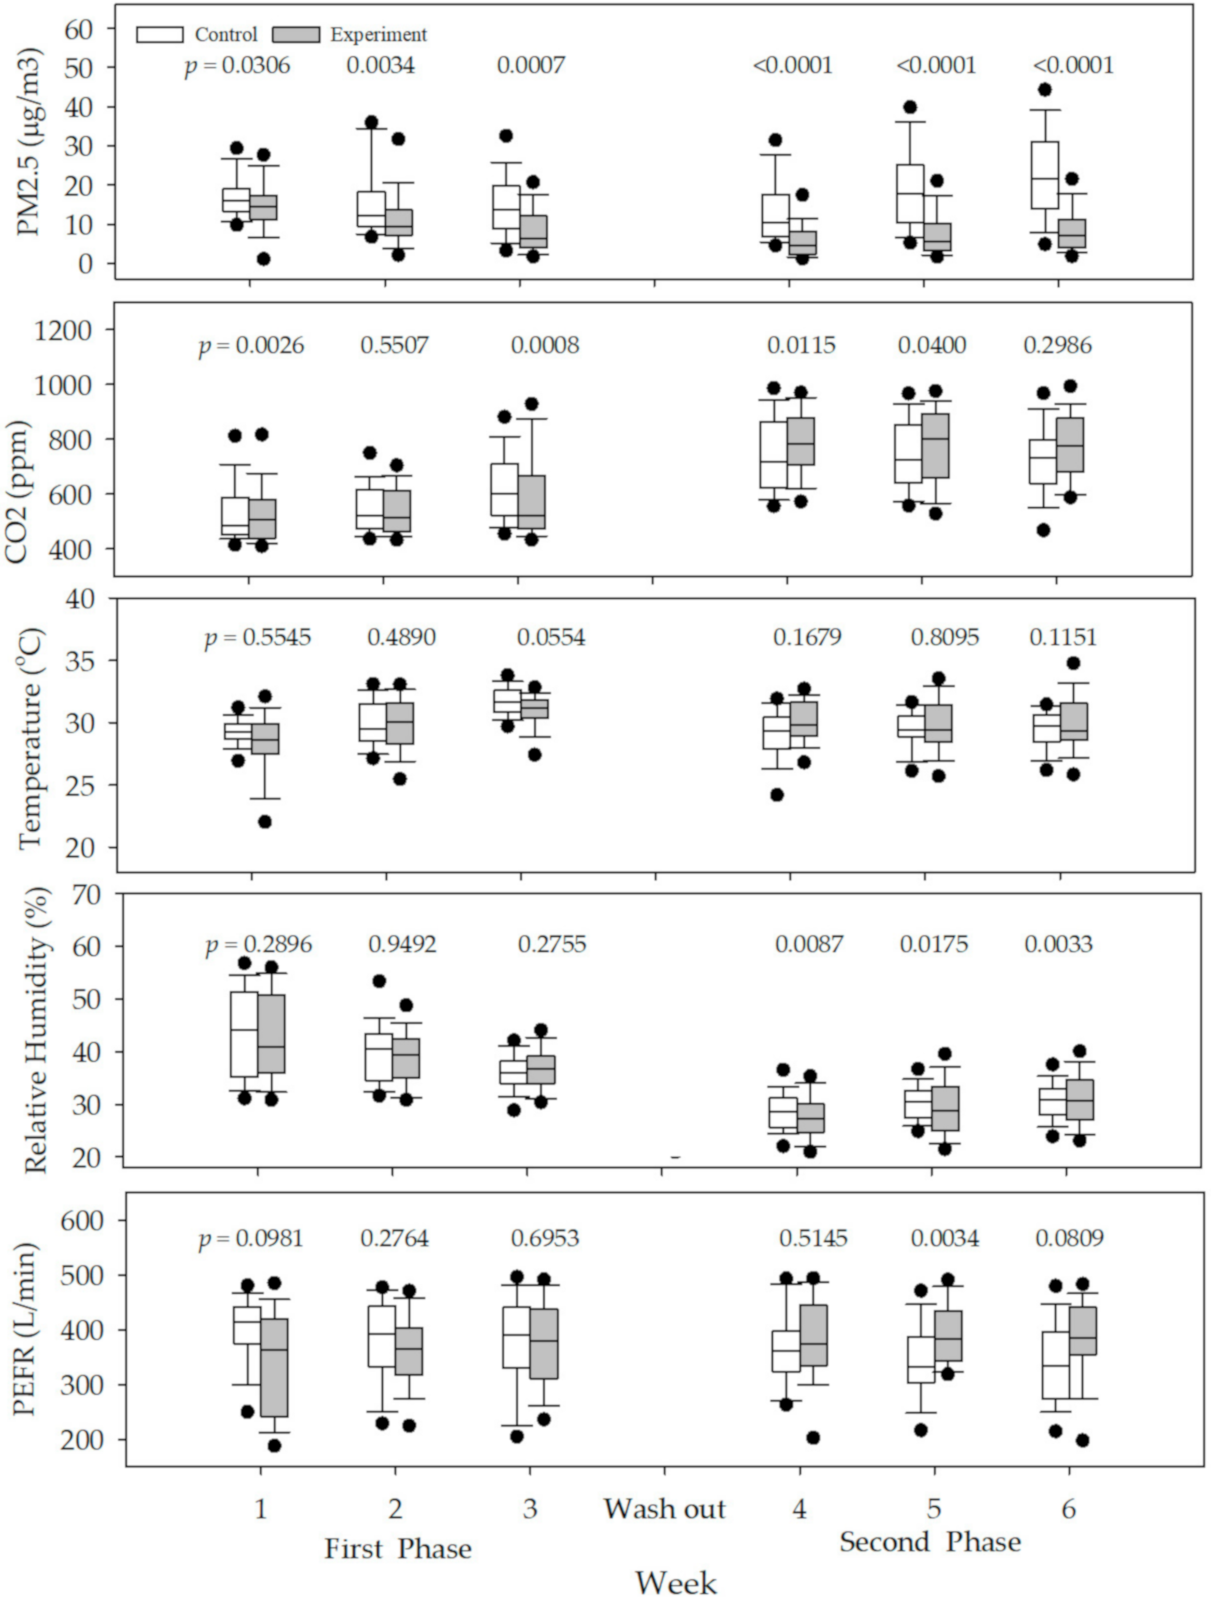
| Variable | Control (Filter Off, n = 247) | Experiment (Filter On, n = 224) | p-Value * | p-Value ** |
|---|---|---|---|---|
| PM2.5 (μg/m3) | 15.3 (10.2–20.5) | 8.8 (4.5–14.2) | <0.001 | 0.0001 |
| CO2 (ppm) | 676.7 (533.9–909.6) | 639.2 (487.0–802.2) | 0.3026 | 0.2559 |
| Temperature (°C) | 29.4 (28.6–30.6) | 29.7 (28.8–31.7) | 0.6050 | 0.0088 |
| Relative humidity (%) | 33.8 (30.7–38.8) | 35.3 (28.6–40.2) | 0.8066 | 0.2800 |
| PEFR(L/min) | 372.0 (319.0–430.0) | 378.0 (328.0–417.0) | 0.6231 | 0.8804 |
| Variable | Multivariate 1 W/Daily Data (−log Likelihood = 154, AIC = 150) | Multivariate 2 W/Weekly Median Data (−log Likelihood = 897, AIC = 899) | |||||
|---|---|---|---|---|---|---|---|
| GMR | 95% CI | GMR | 95% CI | ||||
| Lower | Upper | Lower | Upper | ||||
| PM2.5 (μg/m3) | 0.998 | 0.995 | 0.999 | 0.988 | 0.973 | 0.999 | |
| CO2 (ppm) | 1.0001 | 0.9999 | 1.0003 | 0.9999 | 0.9993 | 1.0004 | |
| Temp (°C) | 1.006 | 0.994 | 1.019 | 0.993 | 0.945 | 1.041 | |
| Humidity (%) | 0.999 | 0.995 | 1.003 | 0.991 | 0.975 | 1.007 | |
| Age (years) | 1.067 | 1.032 | 1.104 | 1.028 | 0.983 | 1.068 | |
| Sex | Female (Ref) | ||||||
| Male | 1.057 | 0.902 | 1.238 | 0.968 | 0.776 | 1.160 | |
| Group | Phase 1 (Ref) | ||||||
| Phase 2 | 0.949 | 0.885 | 1.019 | 0.897 | 0.677 | 1.117 | |
Publisher’s Note: MDPI stays neutral with regard to jurisdictional claims in published maps and institutional affiliations. |
© 2020 by the authors. Licensee MDPI, Basel, Switzerland. This article is an open access article distributed under the terms and conditions of the Creative Commons Attribution (CC BY) license (http://creativecommons.org/licenses/by/4.0/).
Share and Cite
Kim, S.; Lee, J.; Park, S.; Rudasingwa, G.; Lee, S.; Yu, S.; Lim, D.H. Association between Peak Expiratory Flow Rate and Exposure Level to Indoor PM2.5 in Asthmatic Children, Using Data from the Escort Intervention Study. Int. J. Environ. Res. Public Health 2020, 17, 7667. https://doi.org/10.3390/ijerph17207667
Kim S, Lee J, Park S, Rudasingwa G, Lee S, Yu S, Lim DH. Association between Peak Expiratory Flow Rate and Exposure Level to Indoor PM2.5 in Asthmatic Children, Using Data from the Escort Intervention Study. International Journal of Environmental Research and Public Health. 2020; 17(20):7667. https://doi.org/10.3390/ijerph17207667
Chicago/Turabian StyleKim, Sungroul, Jungeun Lee, Sujung Park, Guillaume Rudasingwa, Sangwoon Lee, Sol Yu, and Dae Hyun Lim. 2020. "Association between Peak Expiratory Flow Rate and Exposure Level to Indoor PM2.5 in Asthmatic Children, Using Data from the Escort Intervention Study" International Journal of Environmental Research and Public Health 17, no. 20: 7667. https://doi.org/10.3390/ijerph17207667