Fisher’s Linear Discriminant Function Analysis and its Potential Utility as a Tool for the Assessment of Health-and-Wellness Programs in Indigenous Communities


Abstract
1. Introduction
2. Methods
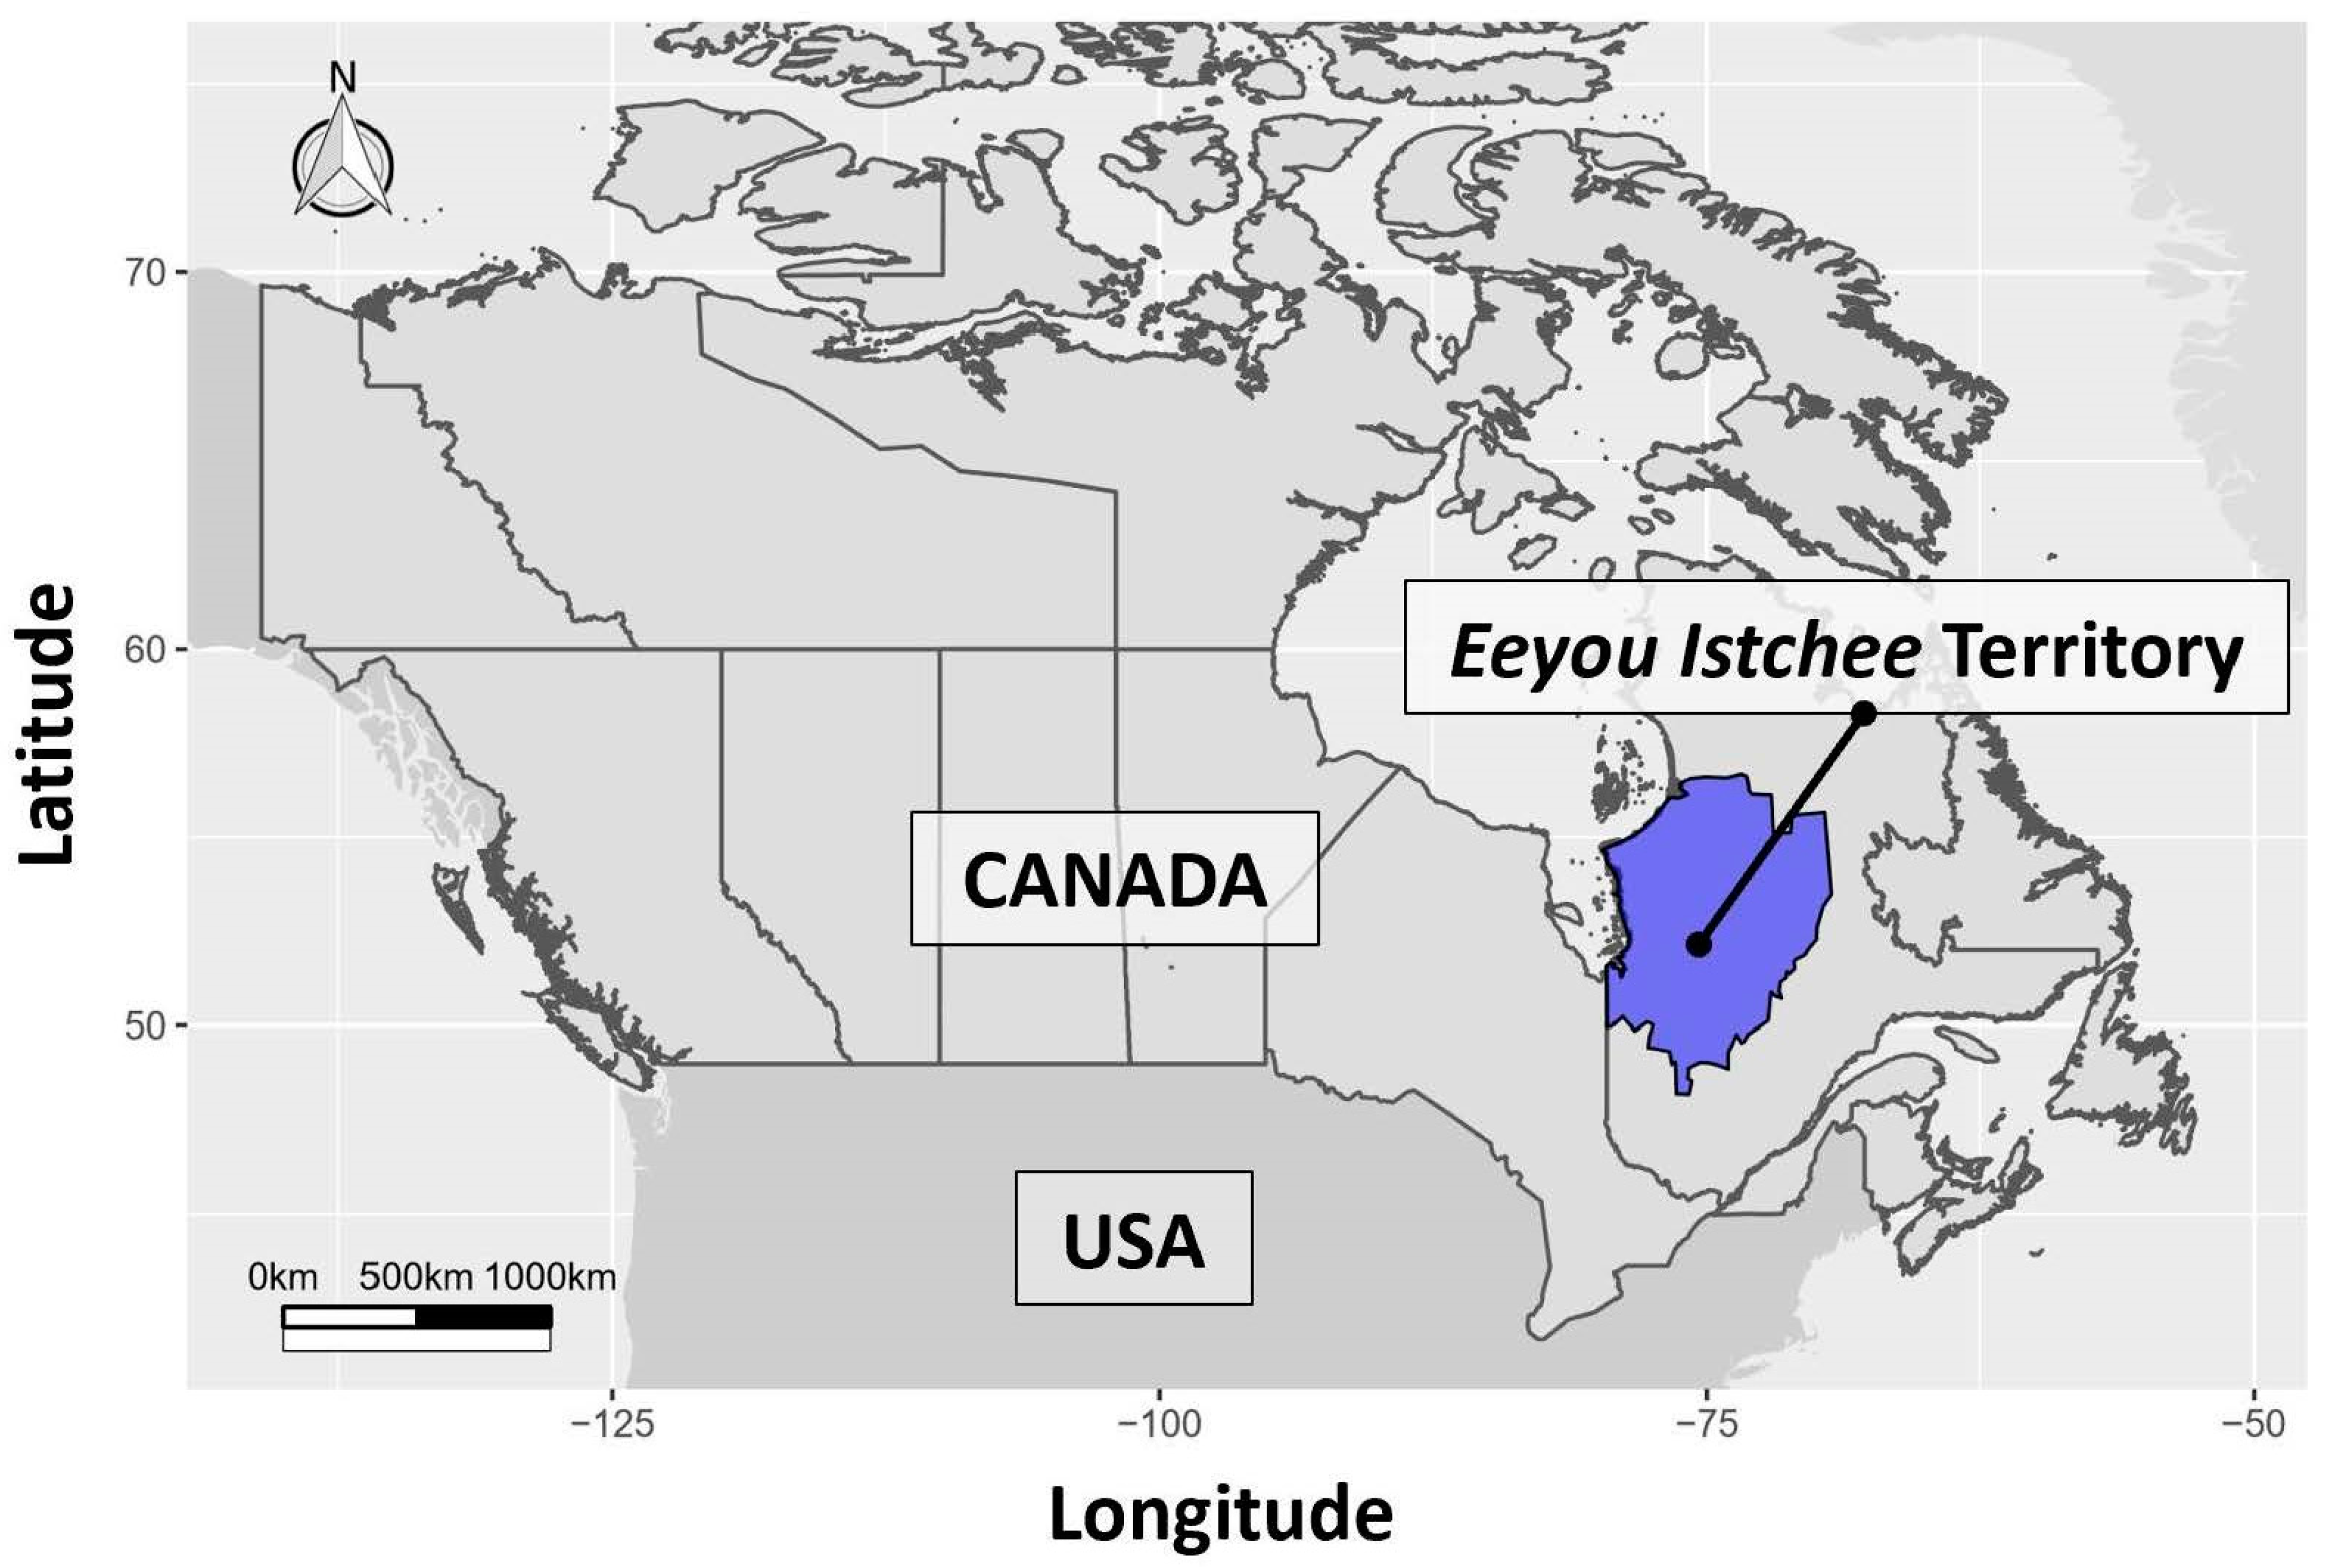
2.1. Data Sources and Study Population
2.2. Discriminant Function Analysis Variables
2.3. Statistical Analysis
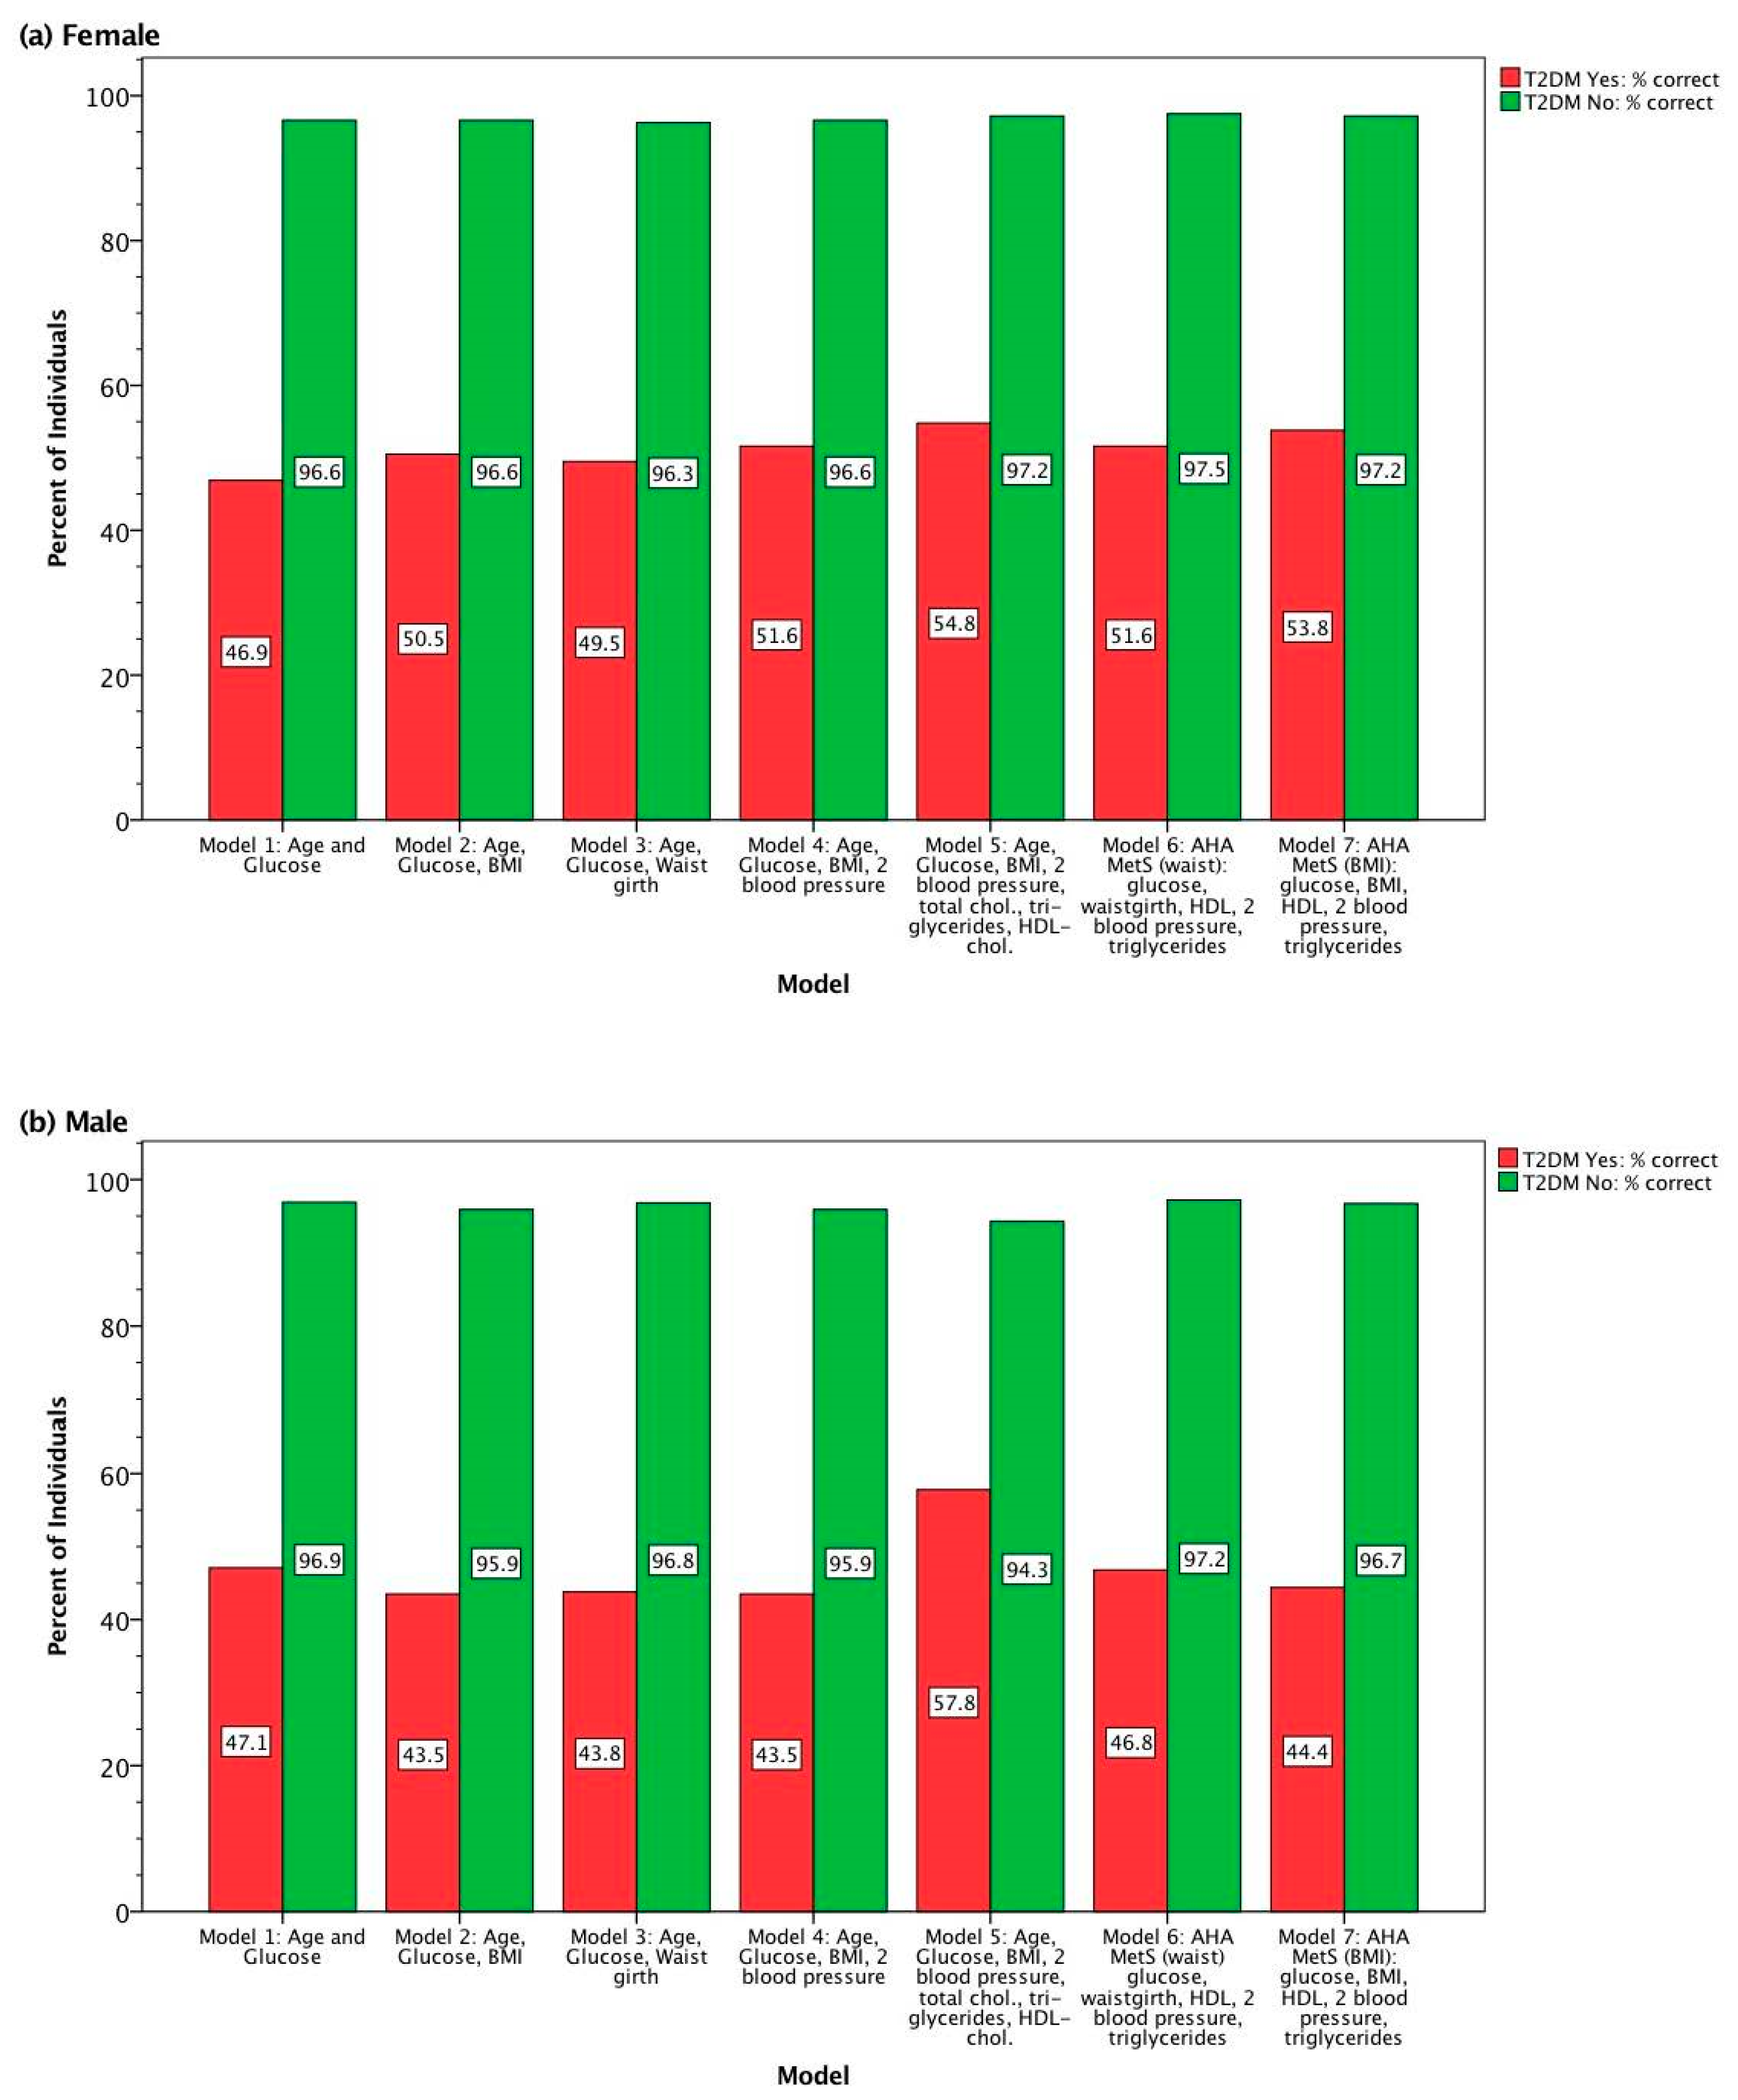
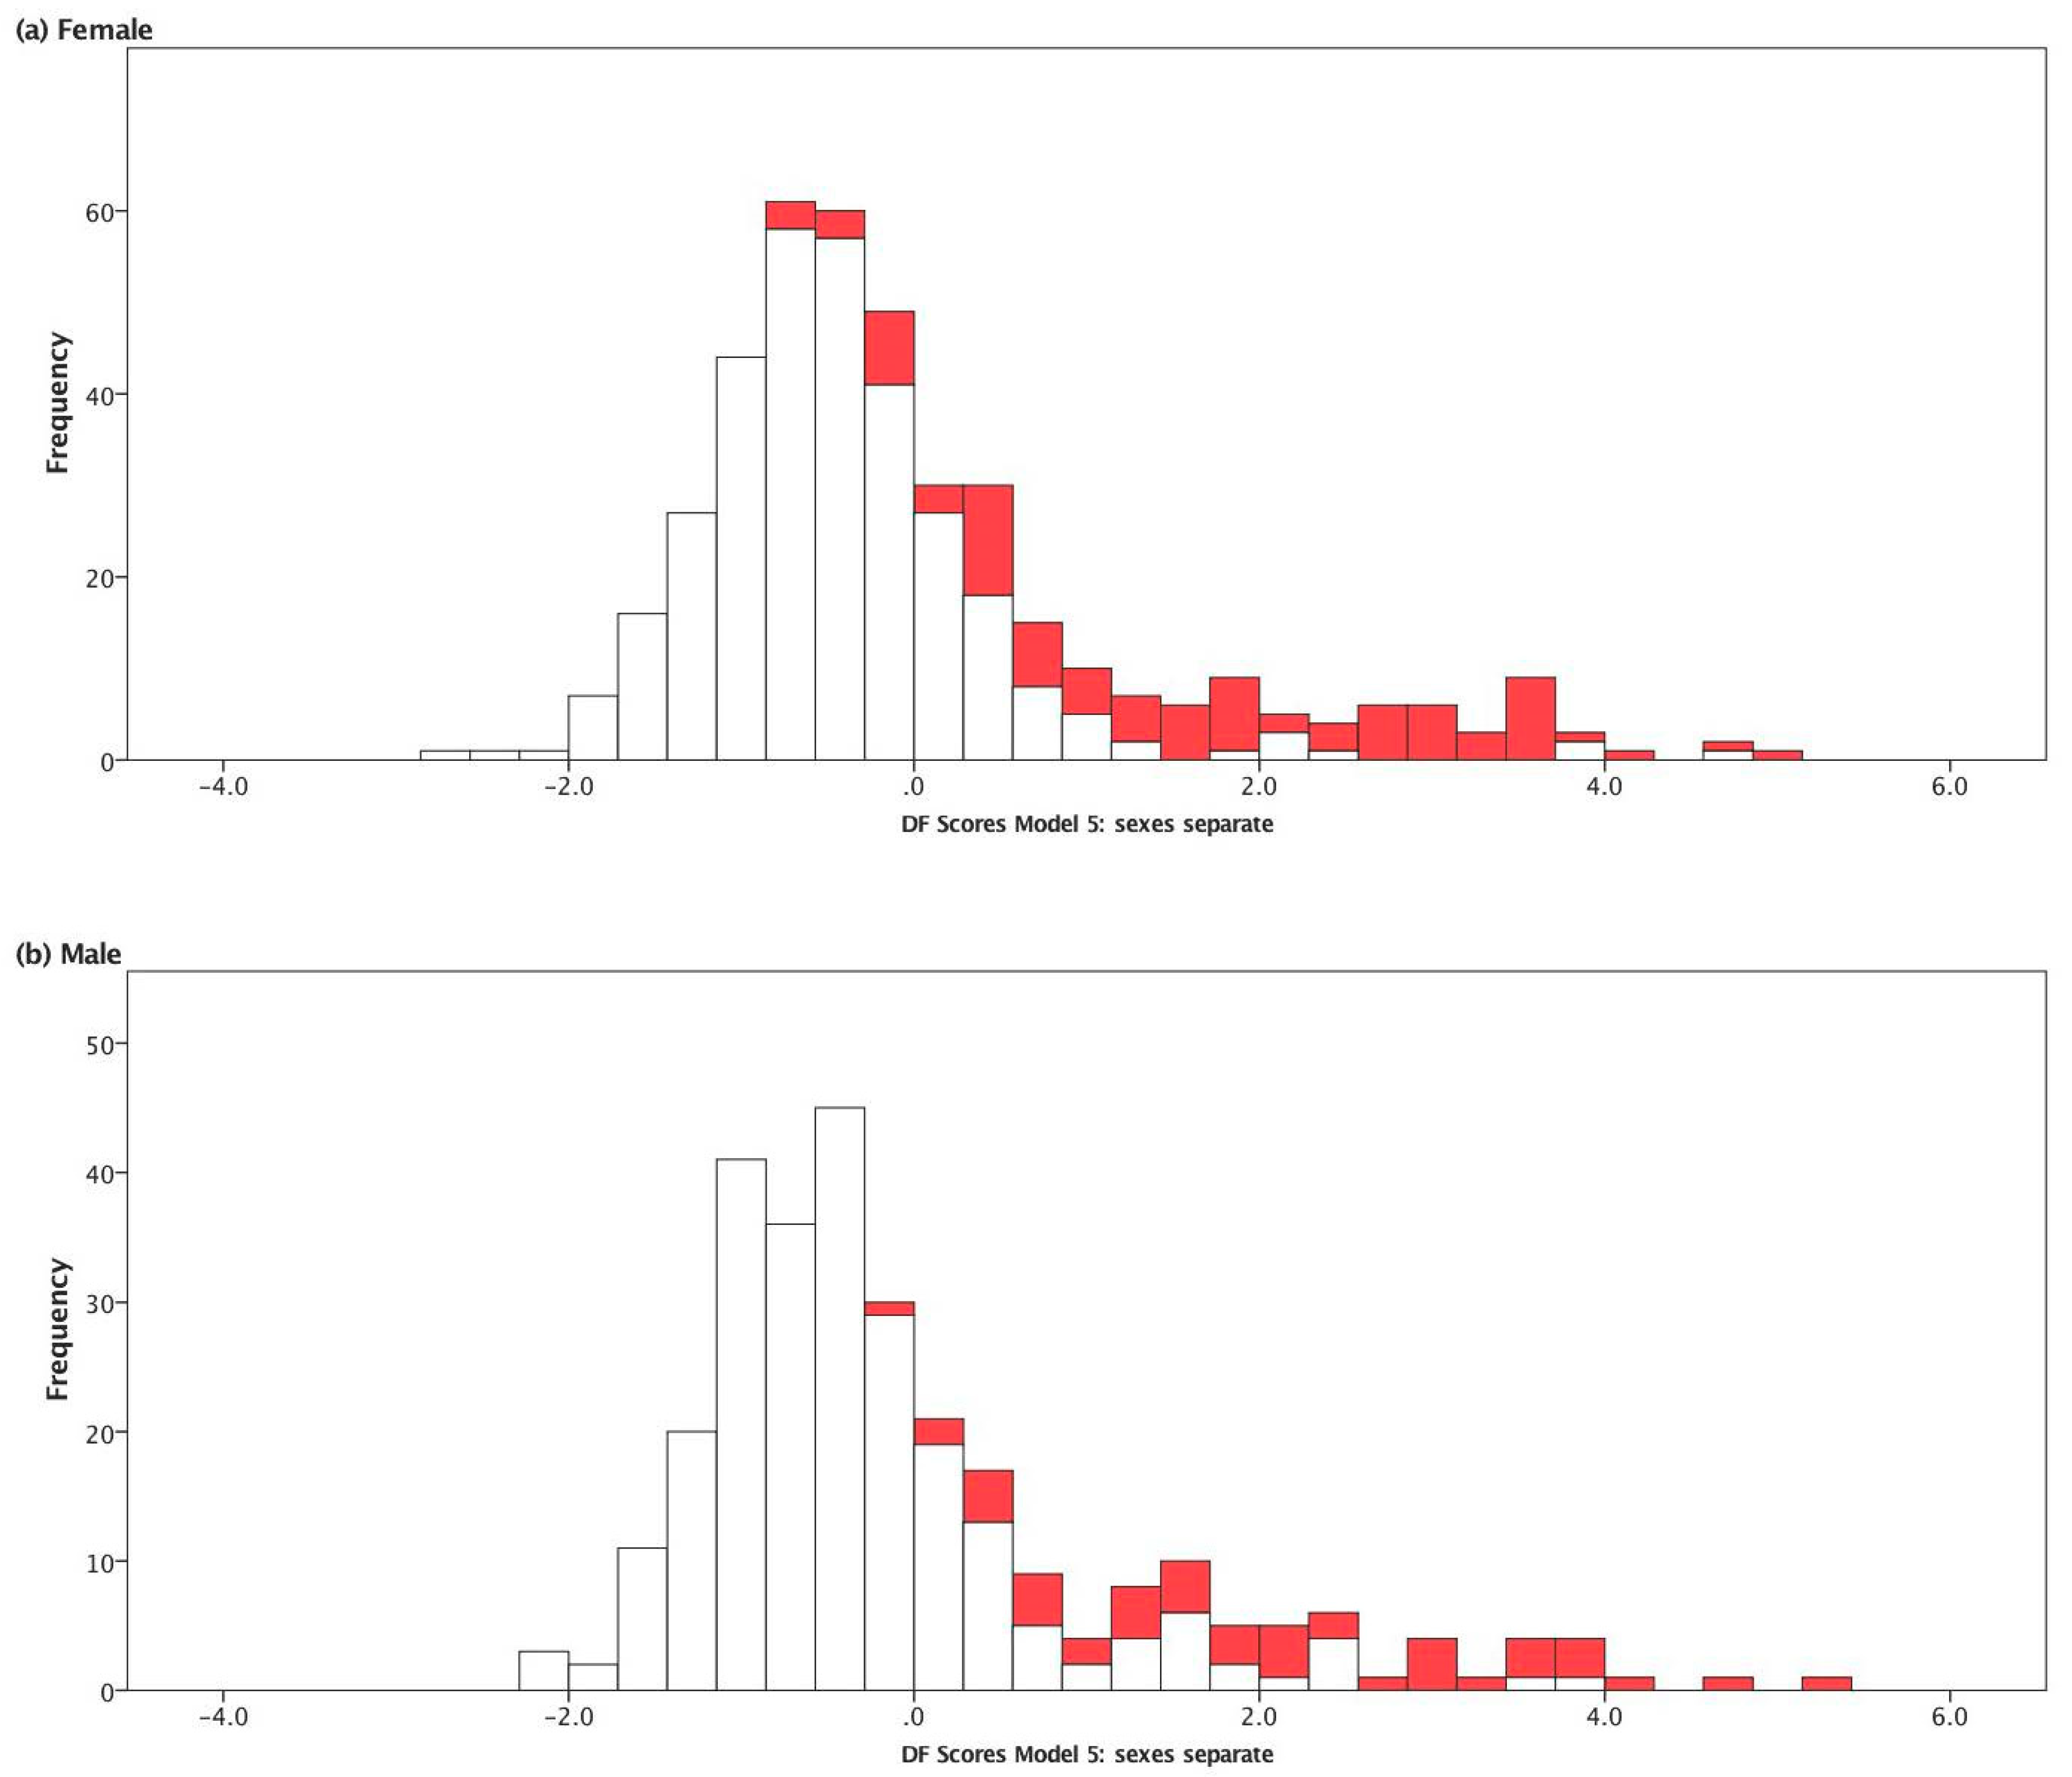
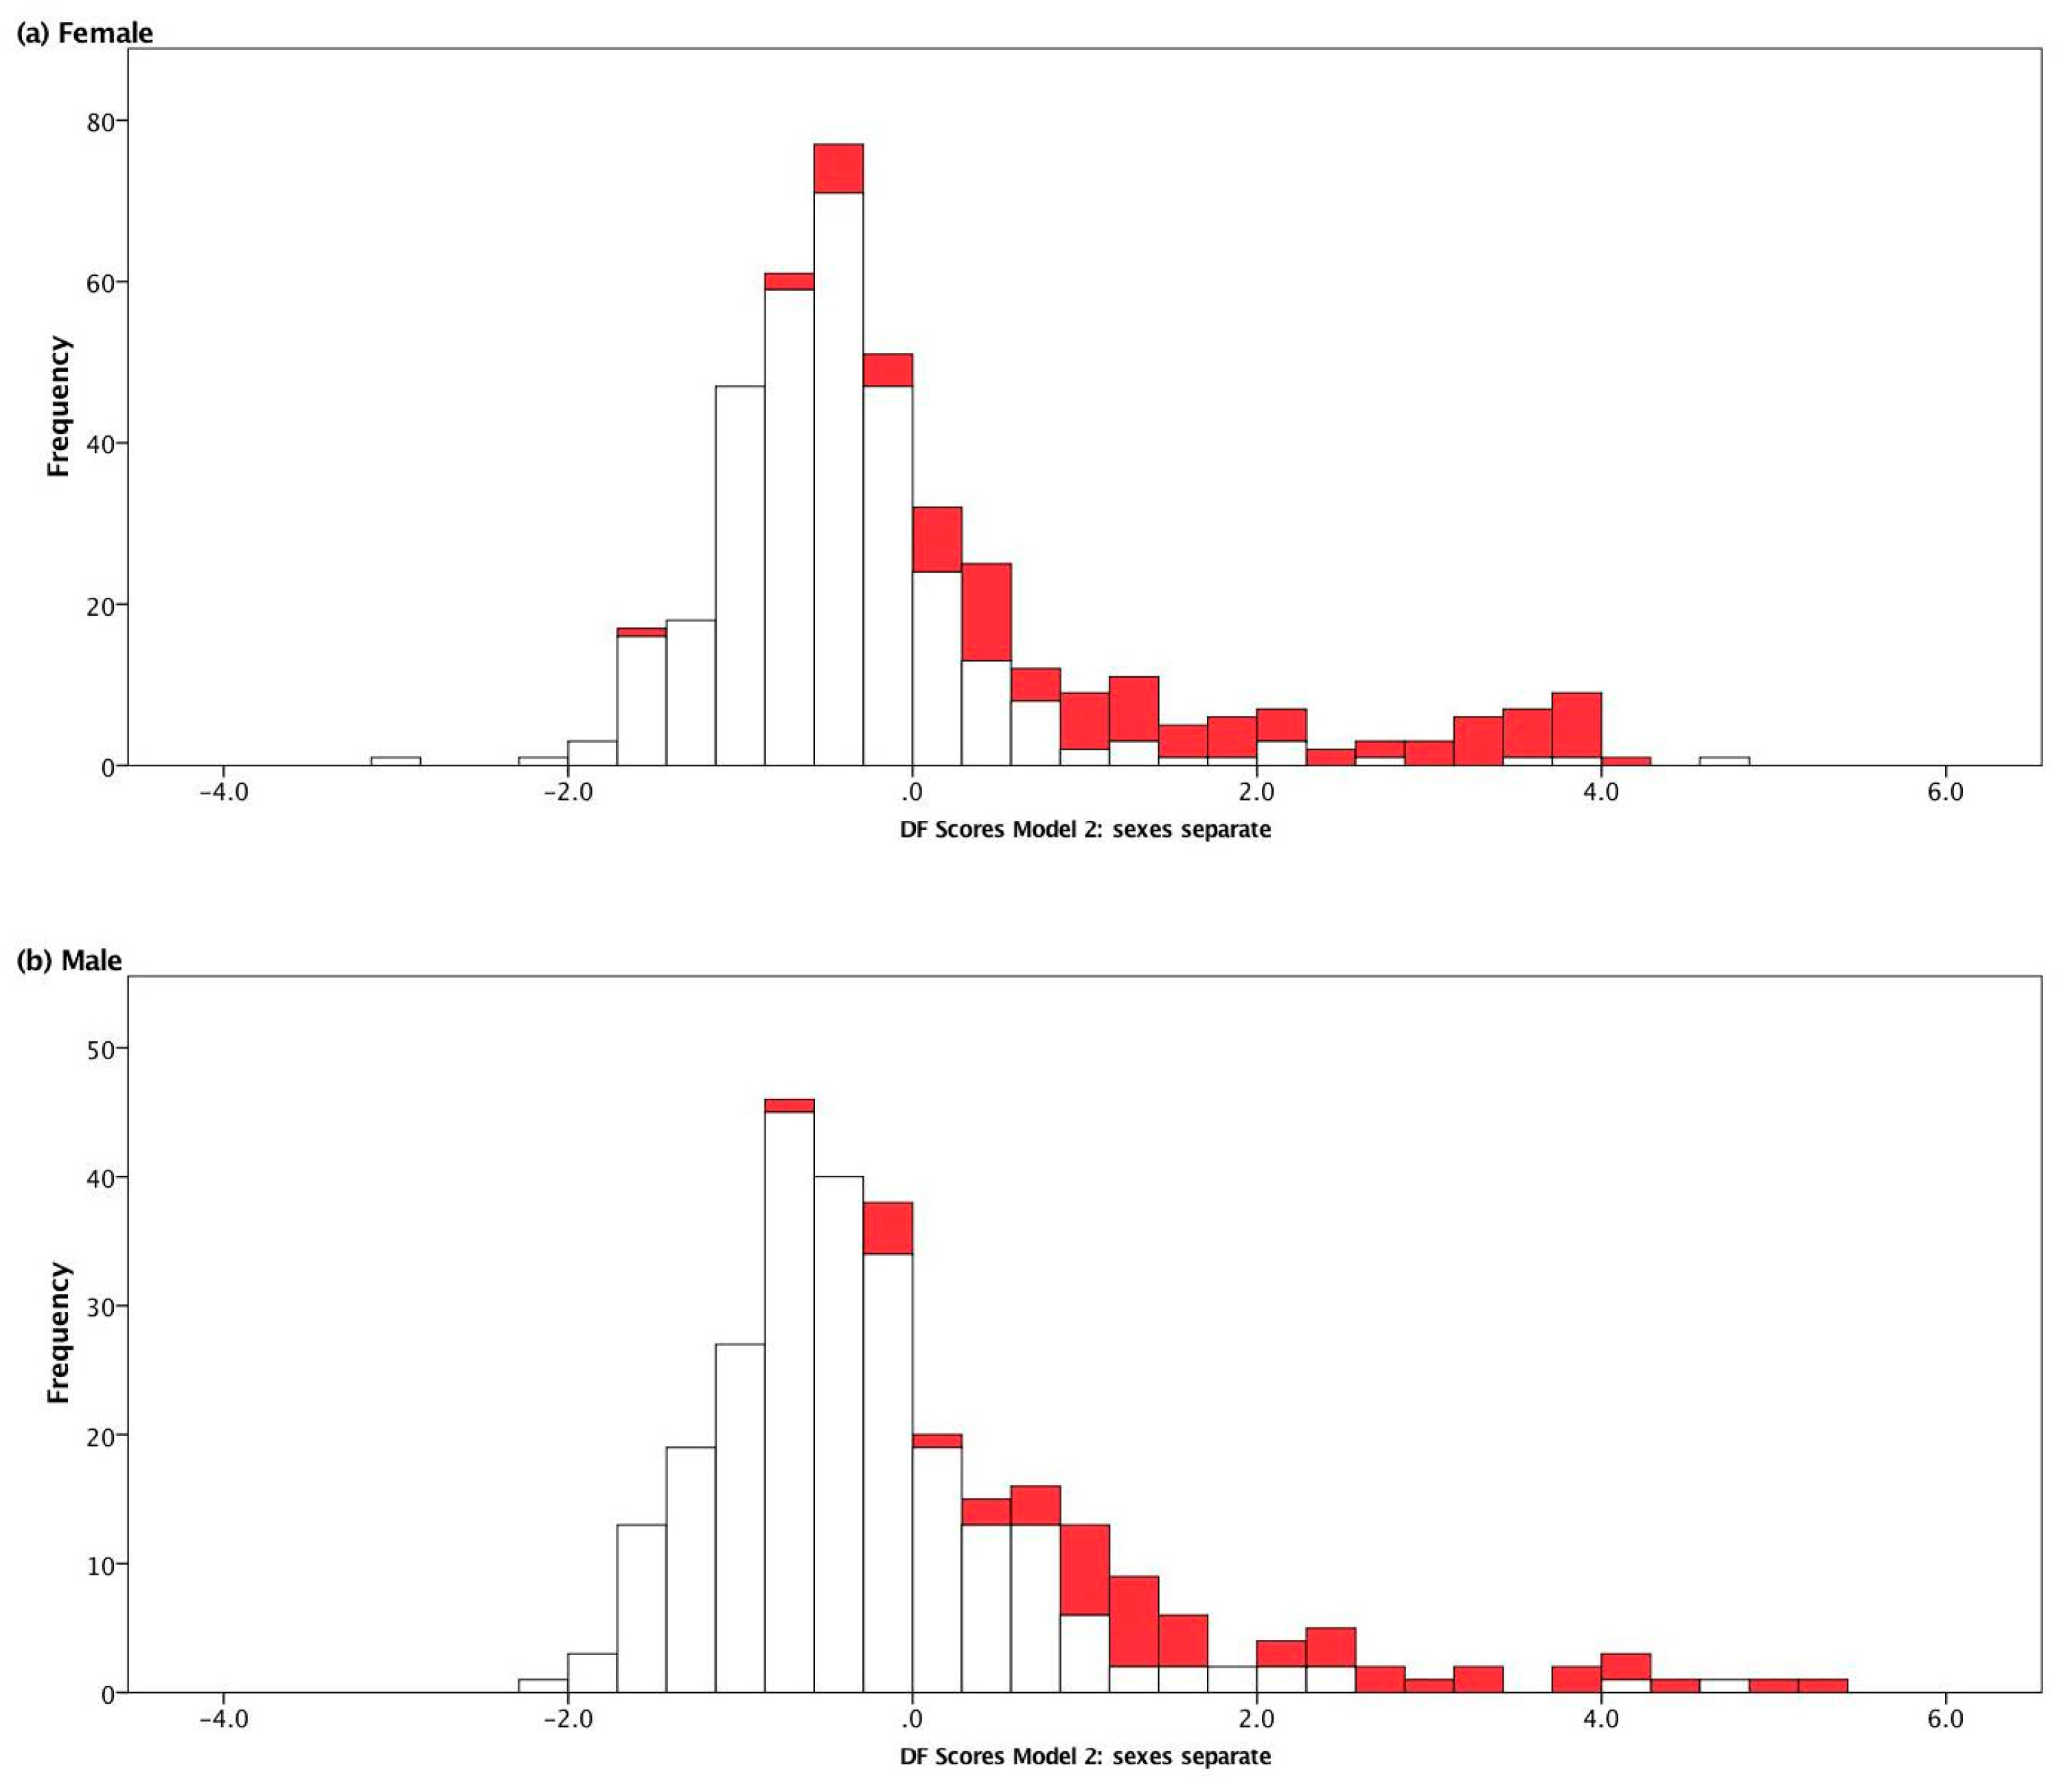
3. Results
4. Discussion
Limitations
5. Conclusions
Author Contributions
Funding
Acknowledgments
Conflicts of Interest
Appendix A

References
- Scully, T. Diabetes in numbers. Nature 2012, 485, S2–S3. [Google Scholar] [CrossRef] [PubMed]
- American Diabetes Association. Classification and diagnosis of diabetes. Diabetes Care 2017, 39, S11–S24. [Google Scholar]
- Chen, L.; Magliano, D.J.; Zimmet, P.Z. The worldwide epidemiology of type 2 diabetes mellitus-Present and future perspectives. Nat. Rev. Endocrinol. 2012, 8, 228–236. [Google Scholar] [CrossRef] [PubMed]
- Yu, C.H.Y.; Zinman, B. Type 2 diabetes and impaired glucose tolerance in aboriginal populations: A global perspective. Diabetes Res. Clin. Pract. 2007, 78, 159–170. [Google Scholar] [CrossRef] [PubMed]
- Gracey, M.; King, M. Indigenous health part 1: Determinants and disease patterns. Lancet 2009, 374, 65–75. [Google Scholar] [CrossRef]
- Government of Canada. Chapter 6: Diabetes in Canada: Facts and Figures from a Public Health Perspective–First Nations, Inuit, and Métis-Canada.ca; Government of Canada: Ottawa, ON, Canada, 2011.
- Institute of Health Economics. Diabetes Care and Management in Indigenous Populations in Canada—A Pan-Canadian Policy Roundtable. Available online: https://www.ihe.ca (accessed on 26 March 2020).
- Leung, L. Diabetes mellitus and the Aboriginal diabetic initiative in Canada: An update review. J. Fam. Med. Prim. Care 2016, 5, 259. [Google Scholar] [CrossRef]
- Harris, S.B.; Bhattacharyya, O.; Dyck, R.; Hayward, M.N.; Toth, E.L. Type 2 Diabetes in Aboriginal Peoples. Can. J. Diabetes 2013, 37, S191–S196. [Google Scholar] [CrossRef][Green Version]
- Halseth, R. The Prevalence of Type 2 Diabetes among First Nations and Considerations for Prevention; National Collaborating Centre for Aboriginal Health: Prince George, BC, Canada, 2019.
- Discriminant Analysis, A Powerful Classification Technique in Data Mining. Available online: https://www.lexjansen.com/wuss/2001/WUSS01036.pdf (accessed on 28 March 2020).
- Hou, S.; Riley, C.B. Is uncorrelated linear discriminant analysis really a new method? Chemom. Intell. Lab. Syst. 2015, 142, 49–53. [Google Scholar]
- Burns, R.B.; Burns, R.A. Business Research Methods and Statistics Using SPSS; SAGE: Los Angeles, LA, USA, 2008; ISBN 9781446204764. [Google Scholar]
- Lakowski, R.; Aspinall, P.A.; Kinnear, P.R. Association between colour vision losses and diabetes mellitus. Ophthalmic Res. 1972, 4, 145–159. [Google Scholar] [CrossRef]
- Amoah, E.; Glickman, J.L.; Malchoff, C.D.; Sturgill, B.C.; Kaiser, D.L.; Bolton, W.K. Clinical identification of nondiabetic renal disease in diabetic patients with type I and type II disease presenting with renal dysfunction. Am. J. Nephrol. 1988, 8, 204–211. [Google Scholar] [CrossRef]
- Rondinelli, R.D.; Robinson, L.R.; Hassanein, K.M.; Stolov, W.C.; Fujimoto, W.Y.; Rubner, D.E. Further studies on the electrodiagnosis of diabetic peripheral polyneuropathy using discriminant function analysis. Am. J. Phys. Med. Rehabil. 1994, 73, 116–123. [Google Scholar] [CrossRef] [PubMed]
- Kordonouri, O.; Danne, T.; Hopfenmüller, W.; Enders, I.; Hövener, G.; Weber, B. Lipid profiles and blood pressure: Are they risk factors for the development of early background retinopathy and incipient nephropathy in children with insulin-dependent diabetes mellitus? Acta Paediatr. Int. J. Paediatr. 1996, 85, 43–48. [Google Scholar] [CrossRef]
- Polat, K.; Güneş, S.; Arslan, A. A cascade learning system for classification of diabetes disease: Generalized Discriminant Analysis and Least Square Support Vector Machine. Expert Syst. Appl. 2008, 34, 482–487. [Google Scholar] [CrossRef]
- Dogantekin, E.; Dogantekin, A.; Avci, D.; Avci, L. An intelligent diagnosis system for diabetes on Linear Discriminant Analysis and Adaptive Network Based Fuzzy Inference System: LDA-ANFIS. Digit. Signal Process. A Rev. J. 2010, 20, 1248–1255. [Google Scholar] [CrossRef]
- Nai-Arun, N.; Punnee, S. Ensemble learning model for diabetes classification. Adv. Mater. Res. 2014, 931, 1427–1431. [Google Scholar] [CrossRef]
- Muller, P.S.; Nirmala, M. Identifying Most Influential Risk Factors of Gestational Diabetes Mellitus Using Discriminant Analysis. Int. J. Pure Appl. Math. 2017, 113, 100–109. [Google Scholar]
- Shirley Muller, P.; Nirmala, M. Effects of pre-pregnancy maternal body mass index on gestational diabetes mellitus. Int. J. Eng. Technol. 2018, 7, 279. [Google Scholar] [CrossRef]
- Tran, T.S.; Hirst, J.E.; Do, M.A.T.; Morris, J.M.; Jeffery, H.E. Early prediction of gestational diabetes mellitus in Vietnam. Diabetes Care 2013, 36, 618–624. [Google Scholar] [CrossRef]
- Tsuji, L.; Ho, E. Traditional environmental knowledge and western science: In search of common ground. Can. J. Native Stud. 2002, 22, 327–360. [Google Scholar]
- Subedi, R.; Roshanafshar, S.; Lawson Greenberg, T. Developing Meaningful Categories for Distinguishing Levels of Remoteness in Canada Analytical Studies: Methods and References; Center for Population Health Data, Statistics Canada: Ottawa, ON, Canada, 2020; ISBN 978-0-660-35652-5.
- Liberda, E.N.; Zuk, A.M.; Tsuji, L.J.S. Complex contaminant mixtures and their associations with intima-media thickness. BMC Cardiovasc. Disord. 2019, 19, 289. [Google Scholar] [CrossRef]
- Yi, L.Z.; Yuan, D.L.; Che, Z.H.; Liang, Y.Z.; Zhou, Z.G.; Gao, H.Y.; Wang, Y.M. Plasma fatty acid metabolic profile coupled with uncorrelated linear discriminant analysis to diagnose and biomarker screening of type 2 diabetes and type 2 diabetic coronary heart diseases. Metabolomics 2008, 4, 30–38. [Google Scholar] [CrossRef]
- Rask-Madsen, C.; Kahn, C.R. Tissue–Specific Insulin Signaling, Metabolic Syndrome, and Cardiovascular Disease. Arterioscler. Thromb. Vasc. Biol. 2012, 32, 2052–2059. [Google Scholar] [CrossRef] [PubMed]
- Yamagishi, K.; Iso, H. The criteria for metabolic syndrome and the national health screening and education system in Japan. Epidemiol. Health 2017, 39, e2017003. [Google Scholar] [CrossRef] [PubMed]
- Grundy, S.M.; Brewer, H.B.; Cleeman, J.I.; Smith, S.C.; Lenfant, C. Definition of Metabolic Syndrome: Report of the National Heart, Lung, and Blood Institute/American Heart Association Conference on Scientific Issues Related to Definition. Circulation 2004, 109, 433–438. [Google Scholar] [CrossRef]
- Crowshoe, L.; Dannenbaum, D.; Green, M.; Henderson, R.; Hayward, M.N.; Toth, E. Type 2 Diabetes and Indigenous Peoples. Can. J. Diabetes 2018, 42, S296–S306. [Google Scholar] [CrossRef]
- Smits, N. A note on Youden’s J and its cost ratio. BMC Med. Res. Methodol. 2010, 10, 2–5. [Google Scholar] [CrossRef]
- Berard, L.D.; Siemens, R.; Woo, V. Monitoring Glycemic Control-Diabetes Canada Clinical Practice Guidelines Expert Committee. Can. J. Diabetes 2018, 42, 47–53. [Google Scholar] [CrossRef]
- National Institutes of Health Calculate Your BMI-Standard BMI Calculator. Available online: https://www.nhlbi.nih.gov/health/educational/lose_wt/BMI/bmicalc.htm (accessed on 20 April 2020).
- Whitehead, S.J.; Ford, C.; Gama, R. A combined laboratory and field evaluation of the Cholestech LDX and CardioChek PA point-of-care testing lipid and glucose analysers. Ann. Clin. Biochem. 2014, 51, 54–67. [Google Scholar] [CrossRef]
- Donato, L.J.; Deobald, G.R.; Wockenfus, A.M.; Hornseth, J.M.; Saenger, A.K.; Karon, B.S. Comparison of two point of care devices for capillary lipid screening in fasting and postprandial adults. Clin. Biochem. 2015, 48, 174–176. [Google Scholar] [CrossRef]
- Shemesh, T.; Rowley, K.G.; Shephard, M.; Piers, L.S.; O’Dea, K. Agreement between laboratory results and on-site pathology testing using Bayer DCA2000+ and Cholestech LDX point-of-care methods in remote Australian Aboriginal communities. Clin. Chim. Acta 2006, 367, 69–76. [Google Scholar] [CrossRef]
- Heikes, K.E.; Eddy, D.M.; Arondekar, B.; Schlessinger, L. Diabetes risk calculator: A simple tool for detecting undiagnosed diabetes and pre-diabetes. Diabetes Care 2008, 31, 1040–1045. [Google Scholar] [CrossRef] [PubMed]
- Yu, W.; Liu, T.; Valdez, R.; Gwinn, M.; Khoury, M.J. Application of support vector machine modeling for prediction of common diseases: The case of diabetes and pre-diabetes. BMC Med. Inform. Decis. Mak. 2010, 10, 16. [Google Scholar] [CrossRef]
- Tapak, L.; Mahjub, H.; Hamidi, O.; Poorolajal, J. Real-data comparison of data mining methods in prediction of diabetes in Iran. Healthc. Inform. Res. 2013, 19, 177–185. [Google Scholar] [CrossRef] [PubMed]
- Habibi, S.; Ahmadi, M.; Alizadeh, S. Type 2 Diabetes Mellitus Screening and Risk Factors Using Decision Tree: Results of Data Mining. Glob. J. Health Sci. 2015, 7, 304–310. [Google Scholar] [CrossRef]
- Chen, P.; Pan, C. Diabetes classification model based on boosting algorithms. BMC Bioinform. 2018, 19, 1–9. [Google Scholar] [CrossRef] [PubMed]
- Rahayu, W.; Santi, V.M.; Putri, B.S. Classification of diabetes events using discriminant analysis. J. Phys. Conf. Ser. 2019, 1402, 077102. [Google Scholar] [CrossRef]
- Christofides, A.; Schauer, C.; Zlotkin, S.H. Iron deficiency anemia among children: Addressing a global public health problem within a Canadian context. Paediatr. Child. Health 2005, 10, 597–601. [Google Scholar] [CrossRef]
- Tahir, E.; Ayotte, P.; Little, M.; Bélanger, R.E.; Lucas, M.; Mergler, D.; Laouan Sidi, E.A.; McHugh, N.G.L.; Lemire, M. Anemia, iron status, and associated protective and risk factors among children and adolescents aged 3 to 19 years old from four First Nations communities in Quebec. Can. J. Public Health 2020, 111, 682–693. [Google Scholar] [CrossRef]
- Delormier, T.; Kuhnlein, H.V. Dietary characteristics of Eastern James Bay Cree women. Arctic 1999, 52, 182–187. [Google Scholar] [CrossRef]
- Willows, N.; Dannenbaum, D.; Vadeboncoeur, S. Prevalence of anemia among Quebec Cree infants from 2002 to 2007 compared with 1995 to 2000. Can. Fam. Physician 2012, 2, e101–e106. [Google Scholar]
- Coban, E.; Ozdogan, M.; Timuragaoglu, A. Effect of iron deficiency anemia on the levels of hemoglobin A1c in nondiabetic patients. Acta Haematol. 2004, 3, 126–128. [Google Scholar] [CrossRef] [PubMed]
- Hardikar, P.S.; Joshi, S.M.; Bhat, D.S.; Raut, D.A.; Katre, P.A.; Lubree, H.G.; Jere, A.; Pandit, A.N.; Fall, C.H.D.; Yajnik, C.S. Spuriously high prevalence of prediabetes diagnosed by HbA 1c in young Indians partly explained by hematological factors and iron deficiency anemia. Diabetes Care 2012, 4, 797–802. [Google Scholar] [CrossRef] [PubMed]
- Guo, W.; Zhou, Q.; Jia, Y.; Xu, J. Increased levels of glycated hemoglobin A1c and iron deficiency anemia: A review. Med. Sci. Monit. 2019, 7, 8371–8378. [Google Scholar] [CrossRef] [PubMed]


| Sex | Variable | 95% C.I. for Mean | ||||||||
|---|---|---|---|---|---|---|---|---|---|---|
| T2DM | N | Median | Geometric Mean | Mean | Lower Bound | Upper Bound | Minimum | Maximum | ||
| Female | Age (year) | Yes | 111 | 48.00 | 46.85 | 48.97 | 46.28 | 51.66 | 25.00 | 91.00 |
| No | 329 | 36.00 | 36.47 | 38.72 | 37.19 | 40.25 | 21.00 | 88.00 | ||
| Waist Girth (cm) | Yes | 96 | 119.75 | 120.67 | 121.71 | 118.41 | 125.01 | 92.50 | 172.00 | |
| No | 324 | 111.25 | 109.90 | 110.87 | 109.30 | 112.45 | 70.00 | 147.00 | ||
| BMI (kg/m2) | Yes | 94 | 38.02 | 37.90 | 38.75 | 37.00 | 40.51 | 24.60 | 69.60 | |
| No | 323 | 34.26 | 33.90 | 34.53 | 33.82 | 35.24 | 16.90 | 58.90 | ||
| Systolic BP (mm Hg; mean of 2nd and 3rd) | Yes | 96 | 122.00 | 122.43 | 123.73 | 120.06 | 127.40 | 65.00 | 185.00 | |
| No | 325 | 117.00 | 117.61 | 118.41 | 116.89 | 119.94 | 85.00 | 180.00 | ||
| Diastolic BP (mm Hg; mean of 2nd and 3rd) | Yes | 96 | 72.75 | 71.06 | 72.13 | 69.69 | 74.56 | 37.00 | 104.00 | |
| No | 324 | 73.00 | 71.60 | 72.41 | 71.25 | 73.57 | 40.00 | 100.00 | ||
| Biochemistry: Glucose (mmol/L) | Yes | 98 | 7.80 | 8.70 | 9.35 | 8.61 | 10.08 | 4.00 | 18.30 | |
| No | 326 | 5.40 | 5.55 | 5.68 | 5.51 | 5.84 | 3.00 | 21.80 | ||
| Biochemistry: Triglycerides (mmol/L) | Yes | 98 | 1.81 | 1.83 | 2.06 | 1.82 | 2.30 | 0.72 | 9.35 | |
| No | 326 | 1.26 | 1.30 | 1.41 | 1.34 | 1.48 | 0.39 | 5.65 | ||
| Biochemistry: Cholesterol HDL (mmol/L) | Yes | 98 | 1.19 | 1.17 | 1.20 | 1.15 | 1.26 | 0.70 | 1.86 | |
| No | 326 | 1.26 | 1.27 | 1.31 | 1.27 | 1.35 | 0.66 | 3.26 | ||
| Biochemistry: Cholesterol (mmol/L) | Yes | 98 | 4.41 | 4.38 | 4.47 | 4.28 | 4.65 | 2.50 | 8.70 | |
| No | 326 | 4.43 | 4.45 | 4.53 | 4.43 | 4.62 | 2.30 | 8.19 | ||
| Male | Age (year) | Yes | 52 | 58.00 | 54.31 | 56.42 | 52.33 | 60.51 | 25.00 | 89.00 |
| No | 263 | 39.00 | 38.72 | 41.08 | 39.30 | 42.86 | 21.00 | 87.00 | ||
| Waist Girth (cm) | Yes | 48 | 117.00 | 117.64 | 118.27 | 114.65 | 121.89 | 83.00 | 163.00 | |
| No | 253 | 109.00 | 108.90 | 109.97 | 108.07 | 111.86 | 40.00 | 202.00 | ||
| BMI (kg/m2) | Yes | 46 | 33.83 | 34.06 | 34.46 | 32.82 | 36.09 | 22.00 | 56.40 | |
| No | 246 | 31.28 | 31.18 | 31.66 | 30.96 | 32.36 | 20.00 | 54.70 | ||
| Systolic BP (mm Hg; mean of 2nd and 3rd) | Yes | 48 | 125.50 | 129.03 | 130.11 | 125.05 | 135.18 | 105.00 | 175.00 | |
| No | 253 | 122.00 | 123.49 | 124.17 | 122.51 | 125.84 | 95.00 | 196.00 | ||
| Diastolic BP (mm Hg; mean of 2nd and 3rd) | Yes | 48 | 75.50 | 75.48 | 76.00 | 73.42 | 78.58 | 56.00 | 97.00 | |
| No | 253 | 78.00 | 76.57 | 77.26 | 76.00 | 78.52 | 45.00 | 112.50 | ||
| Biochemistry: Glucose (mmol/L) | Yes | 51 | 8.00 | 8.77 | 9.36 | 8.29 | 10.43 | 5.00 | 24.40 | |
| No | 256 | 5.50 | 5.63 | 5.72 | 5.56 | 5.87 | 4.20 | 16.80 | ||
| Biochemistry: Triglycerides (mmol/L) | Yes | 50 | 1.58 | 1.60 | 1.76 | 1.53 | 1.98 | 0.45 | 4.58 | |
| No | 256 | 1.36 | 1.43 | 1.70 | 1.51 | 1.89 | 0.45 | 21.35 | ||
| Biochemistry: Cholesterol HDL (mmol/L) | Yes | 50 | 1.16 | 1.11 | 1.16 | 1.08 | 1.24 | 0.15 | 1.81 | |
| No | 256 | 1.16 | 1.16 | 1.19 | 1.16 | 1.23 | 0.64 | 2.36 | ||
| Biochemistry: Cholesterol (mmol/L) | Yes | 50 | 4.28 | 4.15 | 4.23 | 3.99 | 4.46 | 2.70 | 6.79 | |
| No | 256 | 4.88 | 4.85 | 4.94 | 4.82 | 5.05 | 2.66 | 7.85 | ||
| Sex | Model Variables | Model 1 | Model 2 | Model 3 | Model 4 | Model 5 | Model 6 (AHA MetS with Waist) | Model 7 (MetS with BMI) |
|---|---|---|---|---|---|---|---|---|
| Female | Age (year) | <0.0005 | <0.0005 | <0.0005 | <0.0005 | <0.0005 | ~ | ~ |
| Glucose [mmol/L] | <0.0005 | <0.0005 | <0.0005 | <0.0005 | <0.0005 | <0.0005 | <0.0005 | |
| BMI [kg/m2] | ~ | <0.0005 | ~ | <0.0005 | <0.0005 | ~ | <0.0005 | |
| Waist Girth [cm] | ~ | ~ | <0.0005 | ~ | ~ | <0.0005 | ~ | |
| Mean 2,3 Systolic BP [mm Hg] | ~ | ~ | ~ | 0.008 | 0.008 | 0.005 | 0.008 | |
| Mean 2,3 Diastolic BP [mm Hg] | ~ | ~ | ~ | 0.753 | 0.753 | 0.805 | 0.753 | |
| HDL Cholesterol [mmol/L] | ~ | ~ | ~ | ~ | 0.004 | 0.003 | 0.004 | |
| Triglycerides [mmol/L] | ~ | ~ | ~ | ~ | <0.0005 | <0.0005 | <0.0005 | |
| Cholesterol [mmol/L] | ~ | ~ | ~ | ~ | 0.523 | ~ | ~ | |
| Sample size (n) | 424 | 415 | 418 | 414 | 414 | 417 | 414 | |
| Male | Age (year) | <0.0005 | <0.0005 | <0.0005 | <0.0005 | <0.0005 | ~ | ~ |
| Glucose [mmol/L] | <0.0005 | <0.0005 | <0.0005 | <0.0005 | <0.0005 | <0.0005 | <0.0005 | |
| BMI [kg/m2] | ~ | <0.0005 | ~ | <0.0005 | <0.0005 | ~ | 0.001 | |
| Waist Girth [cm] | ~ | ~ | <0.0005 | ~ | ~ | <0.0005 | ~ | |
| Mean 2,3 Systolic BP [mm Hg] | ~ | ~ | ~ | 0.007 | 0.003 | 0.006 | 0.003 | |
| Mean 2,3 Diastolic BP [mm Hg] | ~ | ~ | ~ | 0.607 | 0.756 | 0.605 | 0.756 | |
| HDL Cholesterol [mmol/L] | ~ | ~ | ~ | ~ | 0.917 | 0.591 | 0.917 | |
| Triglycerides [mmol/L] | ~ | ~ | ~ | ~ | 0.641 | 0.509 | 0.641 | |
| Cholesterol [mmol/L] | ~ | ~ | ~ | ~ | <0.0005 | ~ | ~ | |
| Sample size (n) | 307 | 291 | 300 | 291 | 290 | 299 | 290 |
| Sex | Model Variables | Model 1 | Model 2 | Model 3 | Model 4 | Model 5 | Model 6 (AHA MetS with Waist) | Model 7 (MetS Variables with BMI) |
|---|---|---|---|---|---|---|---|---|
| Female | Age (year) | 0.010 | 0.008 | 0.008 | 0.005 | 0.008 | ~ | ~ |
| Glucose [mmol/L] | 10.210 | 9.828 | 9.637 | 9.824 | 8.708 | 9.050 | 9.222 | |
| BMI [kg/m2] | ~ | 2.728 | ~ | 2.625 | 2.037 | ~ | 2.176 | |
| Waist Girth [cm] | ~ | ~ | 4.197 | ~ | ~ | 3.396 | ~ | |
| Mean 2,3 Systolic BP [mm Hg] | ~ | ~ | ~ | 2.199 | 2.022 | 2.972 | 2.868 | |
| Mean 2,3 Diastolic BP [mm Hg] | ~ | ~ | ~ | −1.489 | −1.464 | −1.916 | −2.118 | |
| HDL Cholesterol [mmol/L] | ~ | ~ | ~ | ~ | 2.419 | 0.916 | 0.815 | |
| Triglycerides [mmol/L] | ~ | ~ | ~ | ~ | 3.613 | 2.538 | 2.554 | |
| Cholesterol [mmol/L] | ~ | ~ | ~ | ~ | −3.398 | ~ | ~ | |
| constant | −9.156 | −12.959 | −17.184 | −14.471 | −12.159 | −18.652 | −14.564 | |
| Wilk’s Lambda Test of Function (Chi-square significance) | <0.0005 | <0.0005 | <0.0005 | <0.0005 | <0.0005 | <0.0005 | <0.0005 | |
| Male | Age (year) | 0.023 | 0.028 | 0.023 | 0.026 | 0.023 | ~ | ~ |
| Glucose [mmol/L] | 11.116 | 11.046 | 10.795 | 11.035 | 10.245 | 12.042 | 12.548 | |
| BMI [kg/m2] | ~ | 0.665 | ~ | 0.706 | 1.704 | ~ | 2.116 | |
| Waist Girth [cm] | ~ | ~ | 1.513 | ~ | ~ | 3.111 | ~ | |
| Mean 2,3 Systolic BP [mm Hg] | ~ | ~ | ~ | 1.043 | 0.196 | 3.581 | 4.053 | |
| Mean 2,3 Diastolic BP [mm Hg] | ~ | ~ | ~ | −1.245 | 0.060 | −2.557 | −2.786 | |
| HDL Cholesterol [mmol/L] | ~ | ~ | ~ | ~ | 5.041 | 1.769 | 1.621 | |
| Triglycerides [mmol/L] | ~ | ~ | ~ | ~ | 1.078 | −1.136 | −1.320 | |
| Cholesterol [mmol/L] | ~ | ~ | ~ | ~ | −7.302 | ~ | ~ | |
| constant | −10.425 | −11.519 | −13.238 | −11.348 | −9.294 | −19.394 | −17.056 | |
| Wilk’s Lambda Test of Function (Chi-square significance) | <0.0005 | <0.0005 | <0.0005 | <0.0005 | <0.0005 | <0.0005 | <0.0005 |
| Sex | Model Variables | Model 1 | Model 2 | Model 3 | Model 4 | Model 5 | Model 6 (AHA MetS with Waist) | Model 7 (MetS with BMI) |
|---|---|---|---|---|---|---|---|---|
| Female | Age (year) | 0.141 | 0.116 | 0.110 | 0.072 | 0.107 | ~ | ~ |
| Glucose [mmol/L] | 0.959 | 0.923 | 0.906 | 0.924 | 0.819 | 0.852 | 0.867 | |
| BMI [kg/m2] | ~ | 0.235 | ~ | 0.226 | 0.175 | ~ | 0.187 | |
| Waist Girth [cm] | ~ | ~ | 0.244 | ~ | ~ | 0.198 | ~ | |
| Mean 2,3 Systolic BP [mm Hg] | ~ | ~ | ~ | 0.118 | 0.108 | 0.160 | 0.154 | |
| Mean 2,3 Diastolic BP [mm Hg] | ~ | ~ | ~ | −0.102 | −0.100 | −0.132 | −0.145 | |
| HDL Cholesterol [mmol/L] | ~ | ~ | ~ | ~ | 0.146 | 0.056 | 0.049 | |
| Triglycerides [mmol/L] | ~ | ~ | ~ | ~ | 0.403 | 0.282 | 0.285 | |
| Cholesterol [mmol/L] | ~ | ~ | ~ | ~ | −0.232 | ~ | ~ | |
| Male | Age (year) | 0.327 | 0.380 | 0.335 | 0.359 | 0.314 | ~ | ~ |
| Glucose [mmol/L] | 0.891 | 0.848 | 0.864 | 0.847 | 0.787 | 0.965 | 0.964 | |
| BMI [kg/m2] | ~ | 0.049 | ~ | 0.053 | 0.127 | ~ | 0.158 | |
| Waist Girth [cm] | ~ | ~ | 0.090 | ~ | ~ | 0.185 | ~ | |
| Mean 2,3 Systolic BP [mm Hg] | ~ | ~ | ~ | 0.049 | 0.009 | 0.168 | 0.191 | |
| Mean 2,3 Diastolic BP [mm Hg] | ~ | ~ | ~ | −0.072 | 0.003 | −0.147 | −0.161 | |
| HDL Cholesterol [mmol/L] | ~ | ~ | ~ | ~ | 0.267 | 0.093 | 0.086 | |
| Triglycerides [mmol/L] | ~ | ~ | ~ | ~ | 0.153 | −0.159 | −0.187 | |
| Cholesterol [mmol/L] | ~ | ~ | ~ | ~ | −0.500 | ~ | ~ |
Publisher’s Note: MDPI stays neutral with regard to jurisdictional claims in published maps and institutional affiliations. |
© 2020 by the authors. Licensee MDPI, Basel, Switzerland. This article is an open access article distributed under the terms and conditions of the Creative Commons Attribution (CC BY) license (http://creativecommons.org/licenses/by/4.0/).
Share and Cite
Liberda, E.N.; Zuk, A.M.; Martin, I.D.; Tsuji, L.J.S. Fisher’s Linear Discriminant Function Analysis and its Potential Utility as a Tool for the Assessment of Health-and-Wellness Programs in Indigenous Communities. Int. J. Environ. Res. Public Health 2020, 17, 7894. https://doi.org/10.3390/ijerph17217894
Liberda EN, Zuk AM, Martin ID, Tsuji LJS. Fisher’s Linear Discriminant Function Analysis and its Potential Utility as a Tool for the Assessment of Health-and-Wellness Programs in Indigenous Communities. International Journal of Environmental Research and Public Health. 2020; 17(21):7894. https://doi.org/10.3390/ijerph17217894
Chicago/Turabian StyleLiberda, Eric N., Aleksandra M. Zuk, Ian D. Martin, and Leonard J. S. Tsuji. 2020. "Fisher’s Linear Discriminant Function Analysis and its Potential Utility as a Tool for the Assessment of Health-and-Wellness Programs in Indigenous Communities" International Journal of Environmental Research and Public Health 17, no. 21: 7894. https://doi.org/10.3390/ijerph17217894
APA StyleLiberda, E. N., Zuk, A. M., Martin, I. D., & Tsuji, L. J. S. (2020). Fisher’s Linear Discriminant Function Analysis and its Potential Utility as a Tool for the Assessment of Health-and-Wellness Programs in Indigenous Communities. International Journal of Environmental Research and Public Health, 17(21), 7894. https://doi.org/10.3390/ijerph17217894