Article

Time Series Analysis of Climate and Air Pollution Factors Associated with Atmospheric Nitrogen Dioxide Concentration in Japan

1
Division of Public Health, Osaka Institute of Public Health, Osaka 537-0025, Japan
2
Division of Hygienic Chemistry, Osaka Institute of Public Health, Osaka 537-0025, Japan
3
Department of Environmental Medicine and Behavioural Science, Faculty of Medicine Kindai University, Osakasayama 589-8511, Japan
4
Department of Natural Sciences, College of Liberal Arts, International Christian University, Mitaka 181-8585, Japan
5
Osaka City Research Center of Environmental Science, Osaka 543-0026, Japan
6
Department of Applied Chemistry, Graduate School of Engineering, Osaka Prefecture University, Sakai 599-8531, Japan
*
Author to whom correspondence should be addressed.
Int. J. Environ. Res. Public Health 2020, 17(24), 9507; https://doi.org/10.3390/ijerph17249507
Submission received: 8 December 2020 / Revised: 15 December 2020 / Accepted: 16 December 2020 / Published: 18 December 2020
(This article belongs to the Section Environmental Health)

Abstract

:
Nitrogen dioxide (NO2) is an air pollutant discharged from combustion of human activities. Nitrous acid (HONO), measured as NO2, is thought to impact respiratory function more than NO2. HONO and NO2 have an equilibrium relationship, and their reaction is affected by climate conditions. This study was conducted to discuss the extent of HONO contained in NO2, depending on the level of urbanization. Whether climate conditions that promote HONO production enhanced the level of NO2 measured was investigated using time series analysis. Climate and outdoor air pollution data measured in April 2009–March 2017 in urban (Tokyo, Osaka, and Aichi) and rural (Yamanashi) areas in Japan were used for the analysis. Air temperature had a trend of negative associations with NO2, which might indicate the decomposition of HONO in the equilibrium between HONO and NO2. The associations of relative humidity with NO2 did not have consistent trends by prefecture: humidity only in Yamanashi was positively associated with NO2. In high relative humidity conditions, the equilibrium goes towards HONO production, which was observed in Yamanashi, suggesting the proportion of HONO in NO2 might be low/high in urban/rural areas.

Graphical Abstract

1. Introduction

Nitrogen dioxide (NO2) is an air pollutant discharged from combustion of human activities such as driving cars, and numerous epidemiological studies have suggested a relationship between NO2 and impaired respiratory function or asthma symptoms [1,2,3,4].
NO2 is monitored at air pollution monitoring stations (APMSs) in Japan [5], and previous studies have implied that climate factors affect NO2 levels [1,6,7]. Since climate and air pollutant time series data demonstrate seasonality and autocorrelation effects, those effects should be adjusted to find associations among the factors. A large number of studies investigated the effect of NO2 on human health status such as morbidity and mortality of diseases using time series analysis (e.g., [8,9,10]). In those studies, climate and other pollutant factors were dealt as confounders/covariates of NO2 to control (i.e., an outcome, exposure, and confounders/covariates were the number of cases, NO2, and climate/other pollutant factors, respectively), indicating they are associated with NO2 concentration. However, studies that directly estimate the relationships between climate/co-pollutant factors and NO2 using time series analysis are limited.
In the environment, nitrous acid (HONO) is in equilibrium with NO2, nitric oxide (NO) and H2O (Equation (1)). It is reported that this is the main chemical reaction for HONO production [11,12]:
2 HONO NO + NO 2 + H 2 O
The direction of this reaction depends on climate conditions: high air temperature promotes NO2 production since the forward reaction is endothermic, and high humidity promotes HONO production since an abundance of H2O promotes the reverse reaction [7,13], in which the effects on HONO and NO2 production are also reversed. The other characteristics differ between HONO and NO2 with climate conditions are water solubility and decomposition by sunlight. HONO is much more water-soluble [12] and is more easily decomposed by sunlight [7] than NO2. Moreover, it has been found that conventional assays of NO2 such as the Saltzmann reagent method and NOx analyzer measure HONO as NO2 [14]. A few studies have suggested that HONO impacts respiratory function more than either NO2 or sulfur dioxide alone [15], and that the main sources of indoor HONO are indoor combustion and outdoor NO2 [6]. The World Health Organization [16] reported that it is unclear to what extent the health effects observed in epidemiological studies are attributable to NO2 itself, or rather to primary and secondary combustion-related products (i.e., organic carbon and HONO) with which it is typically correlated. However, it is argued that the available scientific literature has not accumulated sufficient evidence to justify revising the existing WHO air quality guidelines for annual NO2 concentrations. To clarify the effects of NO2 and HONO, monitoring the concentrations of environment HONO at APMSs is desired; however, these concentrations are not currently measured.
In the equilibrium reaction (Equation (1)), HONO production is promoted by a temperature decline and humidity rise, and vice versa for NO2. Thus, the associations of climate factors with NO2 might indicate the effects of these factors on either NO2 or HONO. This study was conducted to investigate the relationships between climate factors and NO2 concentration measured at APMSs using time series analyses. Then, from the main results, the level of HONO (measured as a part of NO2) in NO2 concentration was discussed.

2. Materials and Methods

2.1. Study Area

Tokyo, Osaka, Aichi, and Yamanashi Prefectures were chosen as study areas. Tokyo, Osaka and Aichi were chosen as urban study sites. These prefectures include the three largest cities in Japan, the special wards of Tokyo, Osaka City, and Nagoya City, and are highly populated (first, third, fourth highest populations out of 47 prefectures in Japan in 2015, respectively) [17]. Yamanashi was selected as a rural study area and has a lower population (the seventh lowest out of 47 prefectures) and is located around the mid-point between Tokyo and Aichi.

2.2. Data Collection

Time series data of outdoor air pollution and climate factors between April 2009 and March 2017 were used in this study. From each prefecture studied, the roadside APMS (RAPMS) that had the highest monthly NO2 emission in September 2009 and the closest ambient air pollution monitoring station (AAPMS) from each RAPMS was selected, and hourly outdoor air pollutant concentration data were collected from the monitoring stations [5]. The air pollutants consisted of NO2 (ppb), nitric oxide (NO, ppb), and ozone (O3, ppb). If data were missing for three consecutive hours, the missing data were kept as missing, otherwise they were imputed by linear interpolation. Each daily datum was calculated as the average of the hourly data of that day unless they contained missing data. Then, all daily missing data were imputed further by linear interpolation. The numbers of missing hourly and daily data by the compounds and APMSs are shown in Table S1. The concentration of active O3 (AO) was defined as the difference in concentrations between potential ozone (PO) and NO2 at the RAPMS. PO was calculated as the sum of NO2 and O3 at the AAPMSs. AO was used as the alternative of O3 at the RAPMS for the analysis below because the concentration of O3 is negligibly low at roadside due to high consumption by reactions with NO and others. Daily climate data were also collected from the meteorological station [18] in each prefecture that was the closest to the air pollution monitoring stations. The climate data included the mean air temperature (°C), relative humidity (%), mean wind speed (m/s), total duration of sunshine (hour), and mean global solar radiation (MJ/m2). The average monthly concentrations of outdoor pollutants and the average or total monthly values of climate factors were calculated from the data collected. All the data used were publicly available, and no ethical approval was required.

2.3. Statistical Analysis

2.3.1. Descriptive Analysis

Monthly NO2 concentration dynamics by monitoring stations and regions were plotted to assess NO2 levels for the type of monitoring stations and for the regions.

2.3.2. Time Series Prediction Model for NO2 (SARIMAX Model)

The time series data were divided into training (April 2009–March 2016) and testing (April 2016–March 2017) data to allow for cross-validation. With the training data, time series models for monthly NO2 concentrations were built using seasonal autoregressive integrated moving average (SARIMA) and SARIMA with exogeneous variable (SARIMAX) models [19]. These models were built to assess the relationships between NO2 and the climate factors/outdoor air pollutants after removing the effects of autocorrelation and seasonality which are commonly contained in time series data. The logarithm of monthly average NO2 concentration was used as a response variable. One of the climate factors/air pollutants was added as an exogeneous variable for each model. In total, 64 models were built for the four regions, two monitoring stations, and eight exogeneous variables (including non-exogeneous (SARIMA) models). A SARIMA model is an extension from an ARIMA model to which the seasonal terms are added. An ARIMA model consists of non-seasonal autoregressive and moving average terms and were transformed to stationary from non-stationary series by differencing. The relationships between NO2 and exogeneous variables can be evaluated by adjusting the coefficient of the exogeneous variables given the autocorrelation terms are included in the models. For the non-seasonal terms, the number of previous time series used for autoregression and moving averaging, and the number of differencing to reach stationary series were described as p, d, and q, while those for seasonal terms were P, D, and Q, respectively.
Time series analysis was conducted using the Box-Jenkins approach [20]. The Box-Jenkins approach contains model stabilization, identification, model validation, forecasting and cross-validation. For model stabilization and identification, the Hyndman-Khandakar algorithm [21] for automatic ARIMA modelling was used, which is available in the “forecast” package in R as the “auto.arima” function, to select the best model based on the Akaike Information Criterion (AIC, the lowest AIC models were selected as the best models). The Ljung-Box tests were then used to test the randomness of the residuals for the model validation. If the model failed to pass the Ljung-Box test, differenced data were used to select the best fit model based on AIC [19] using the “auto.arima” function. Finally, using the testing data, a forecasting for the preceding 12 months was conducted. The model fitting and forecasting were evaluated using the root mean squared errors (RMSEs). All the analyses were performed using Statistical Software R version 4.0.0 [22].

3. Results

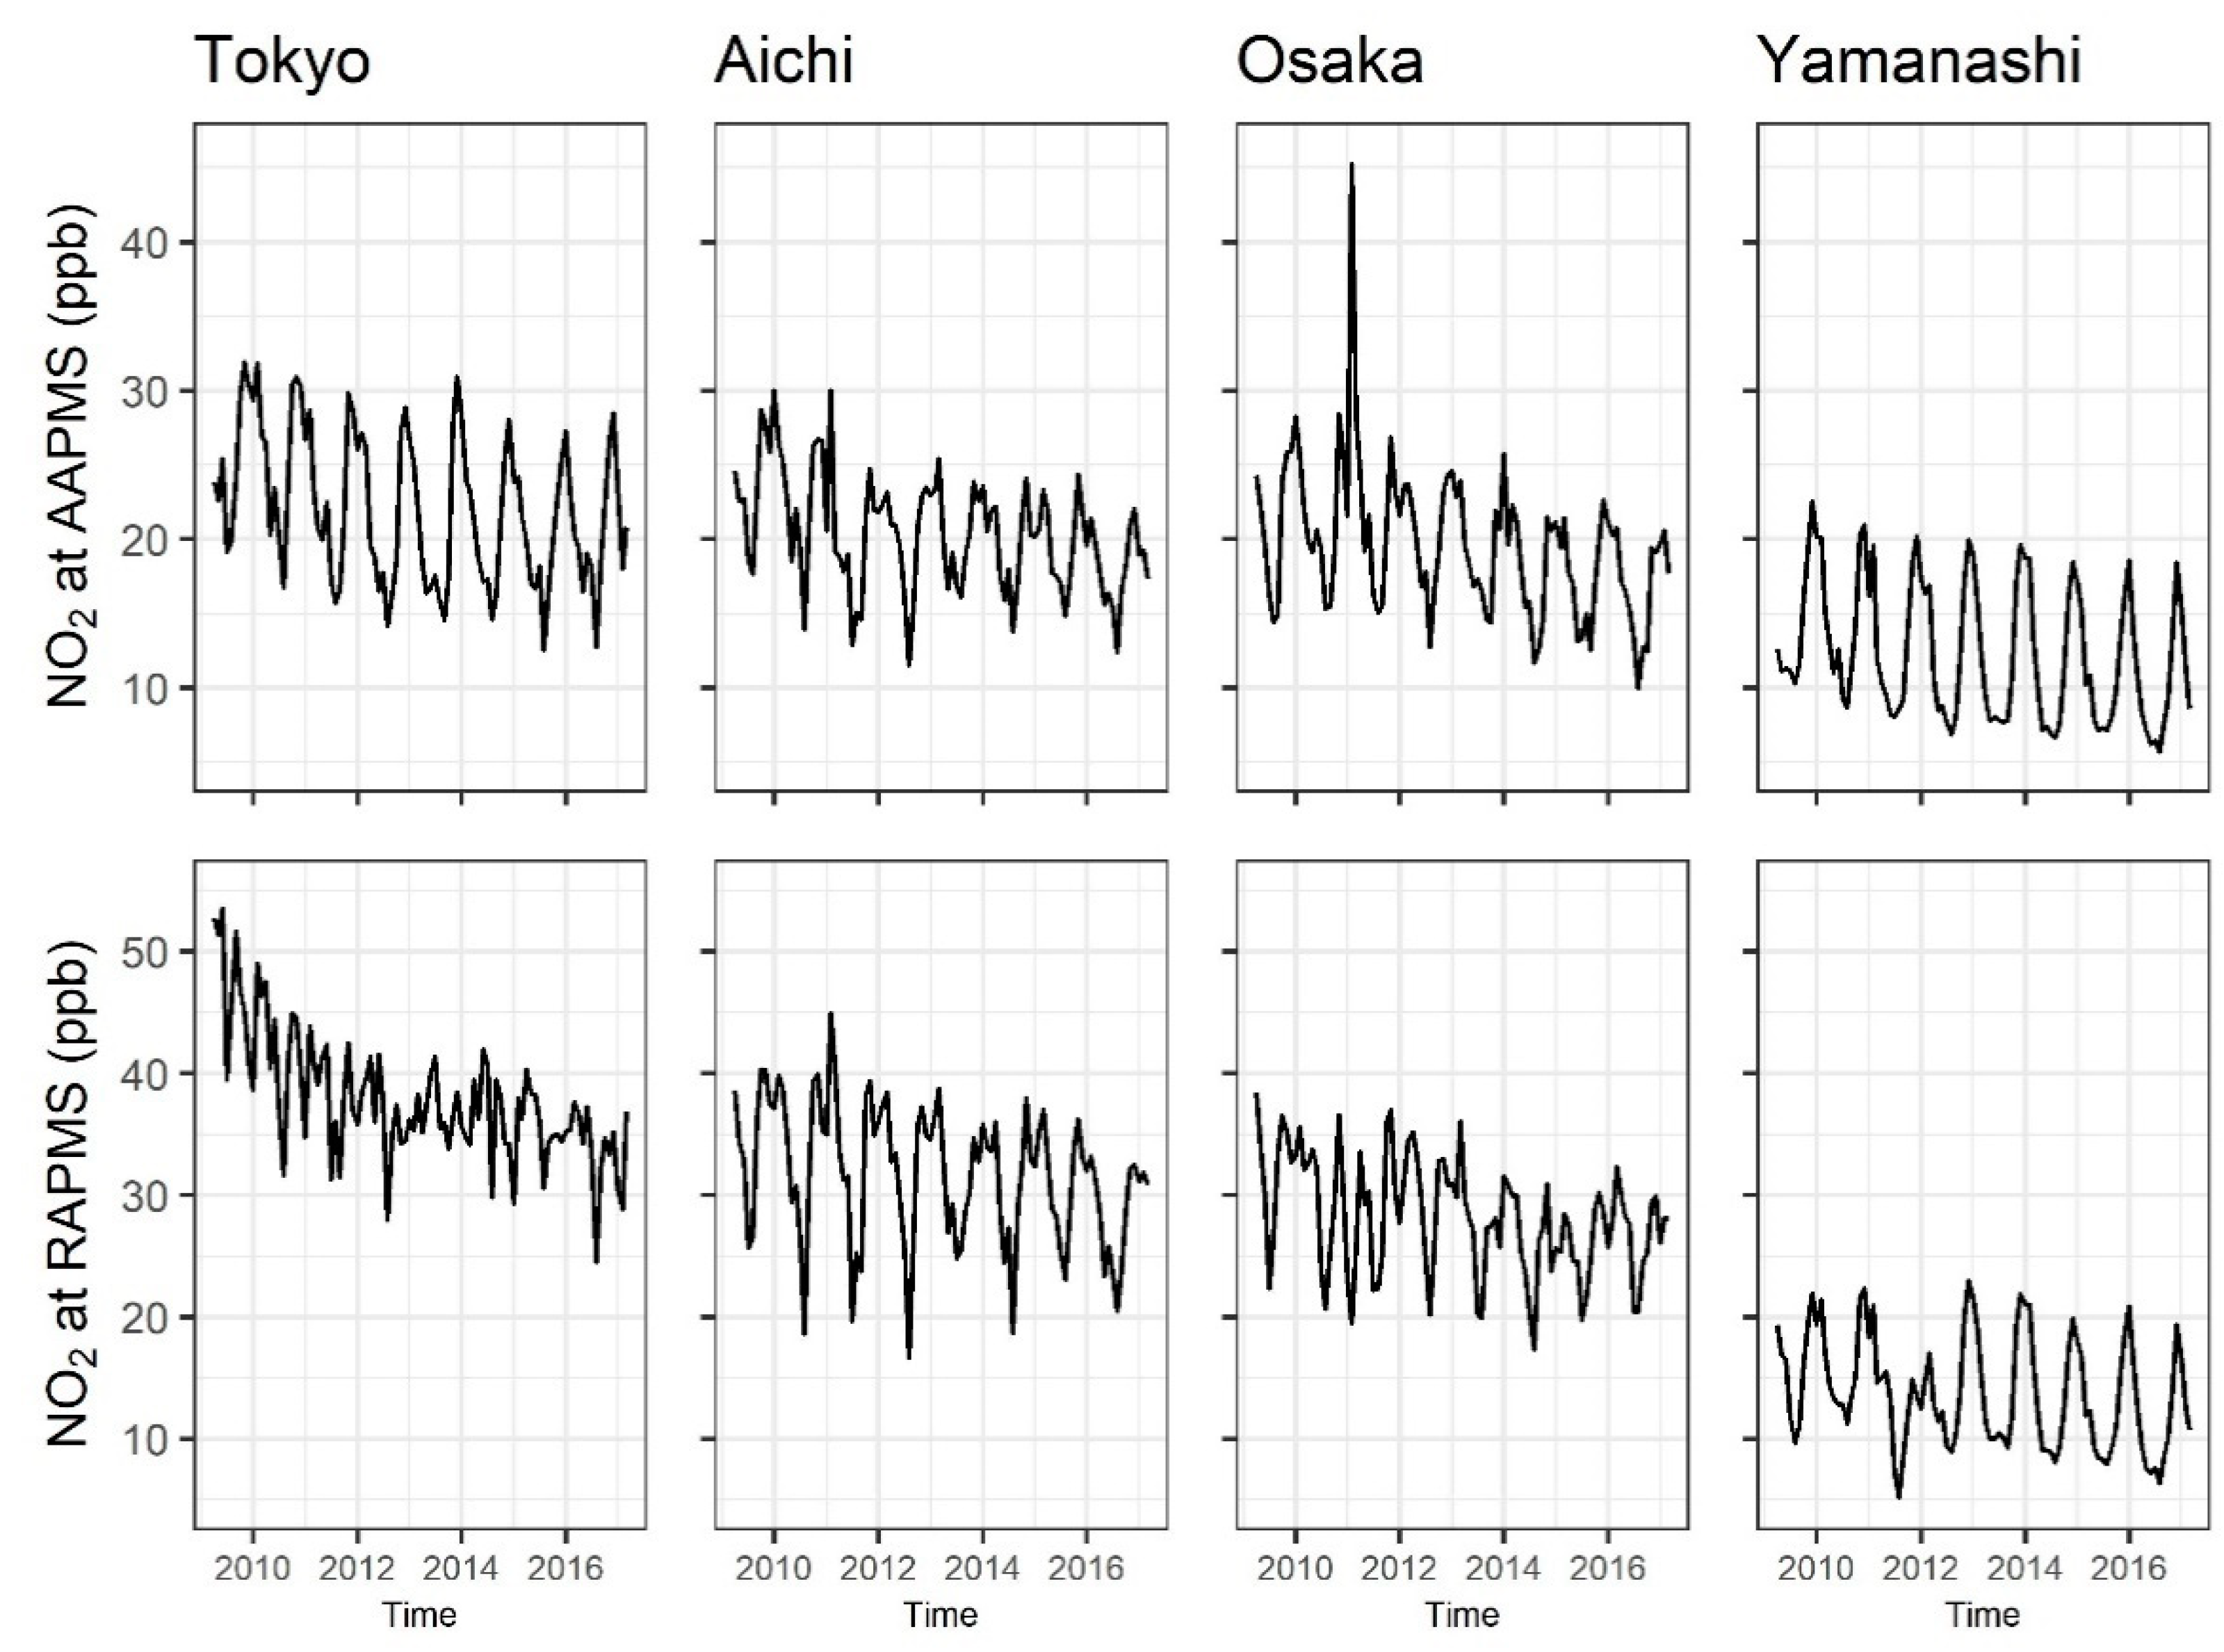
3.1. Descriptive Analysis (NO2 Dynamics in April 2009–March 2017)

Among the four study areas, Tokyo had the highest NO2 concentration both at AAPMS and RAPMS, and Yamanashi has the lowest (Table 1 and Figure 1). The dynamics of NO2 had annual seasonality showing the highest/lowest concentrations in summer (August)/winter (basically November–February), respectively; however, the seasonality at RAPMS was less clear than that at AAPMS (Table 1).

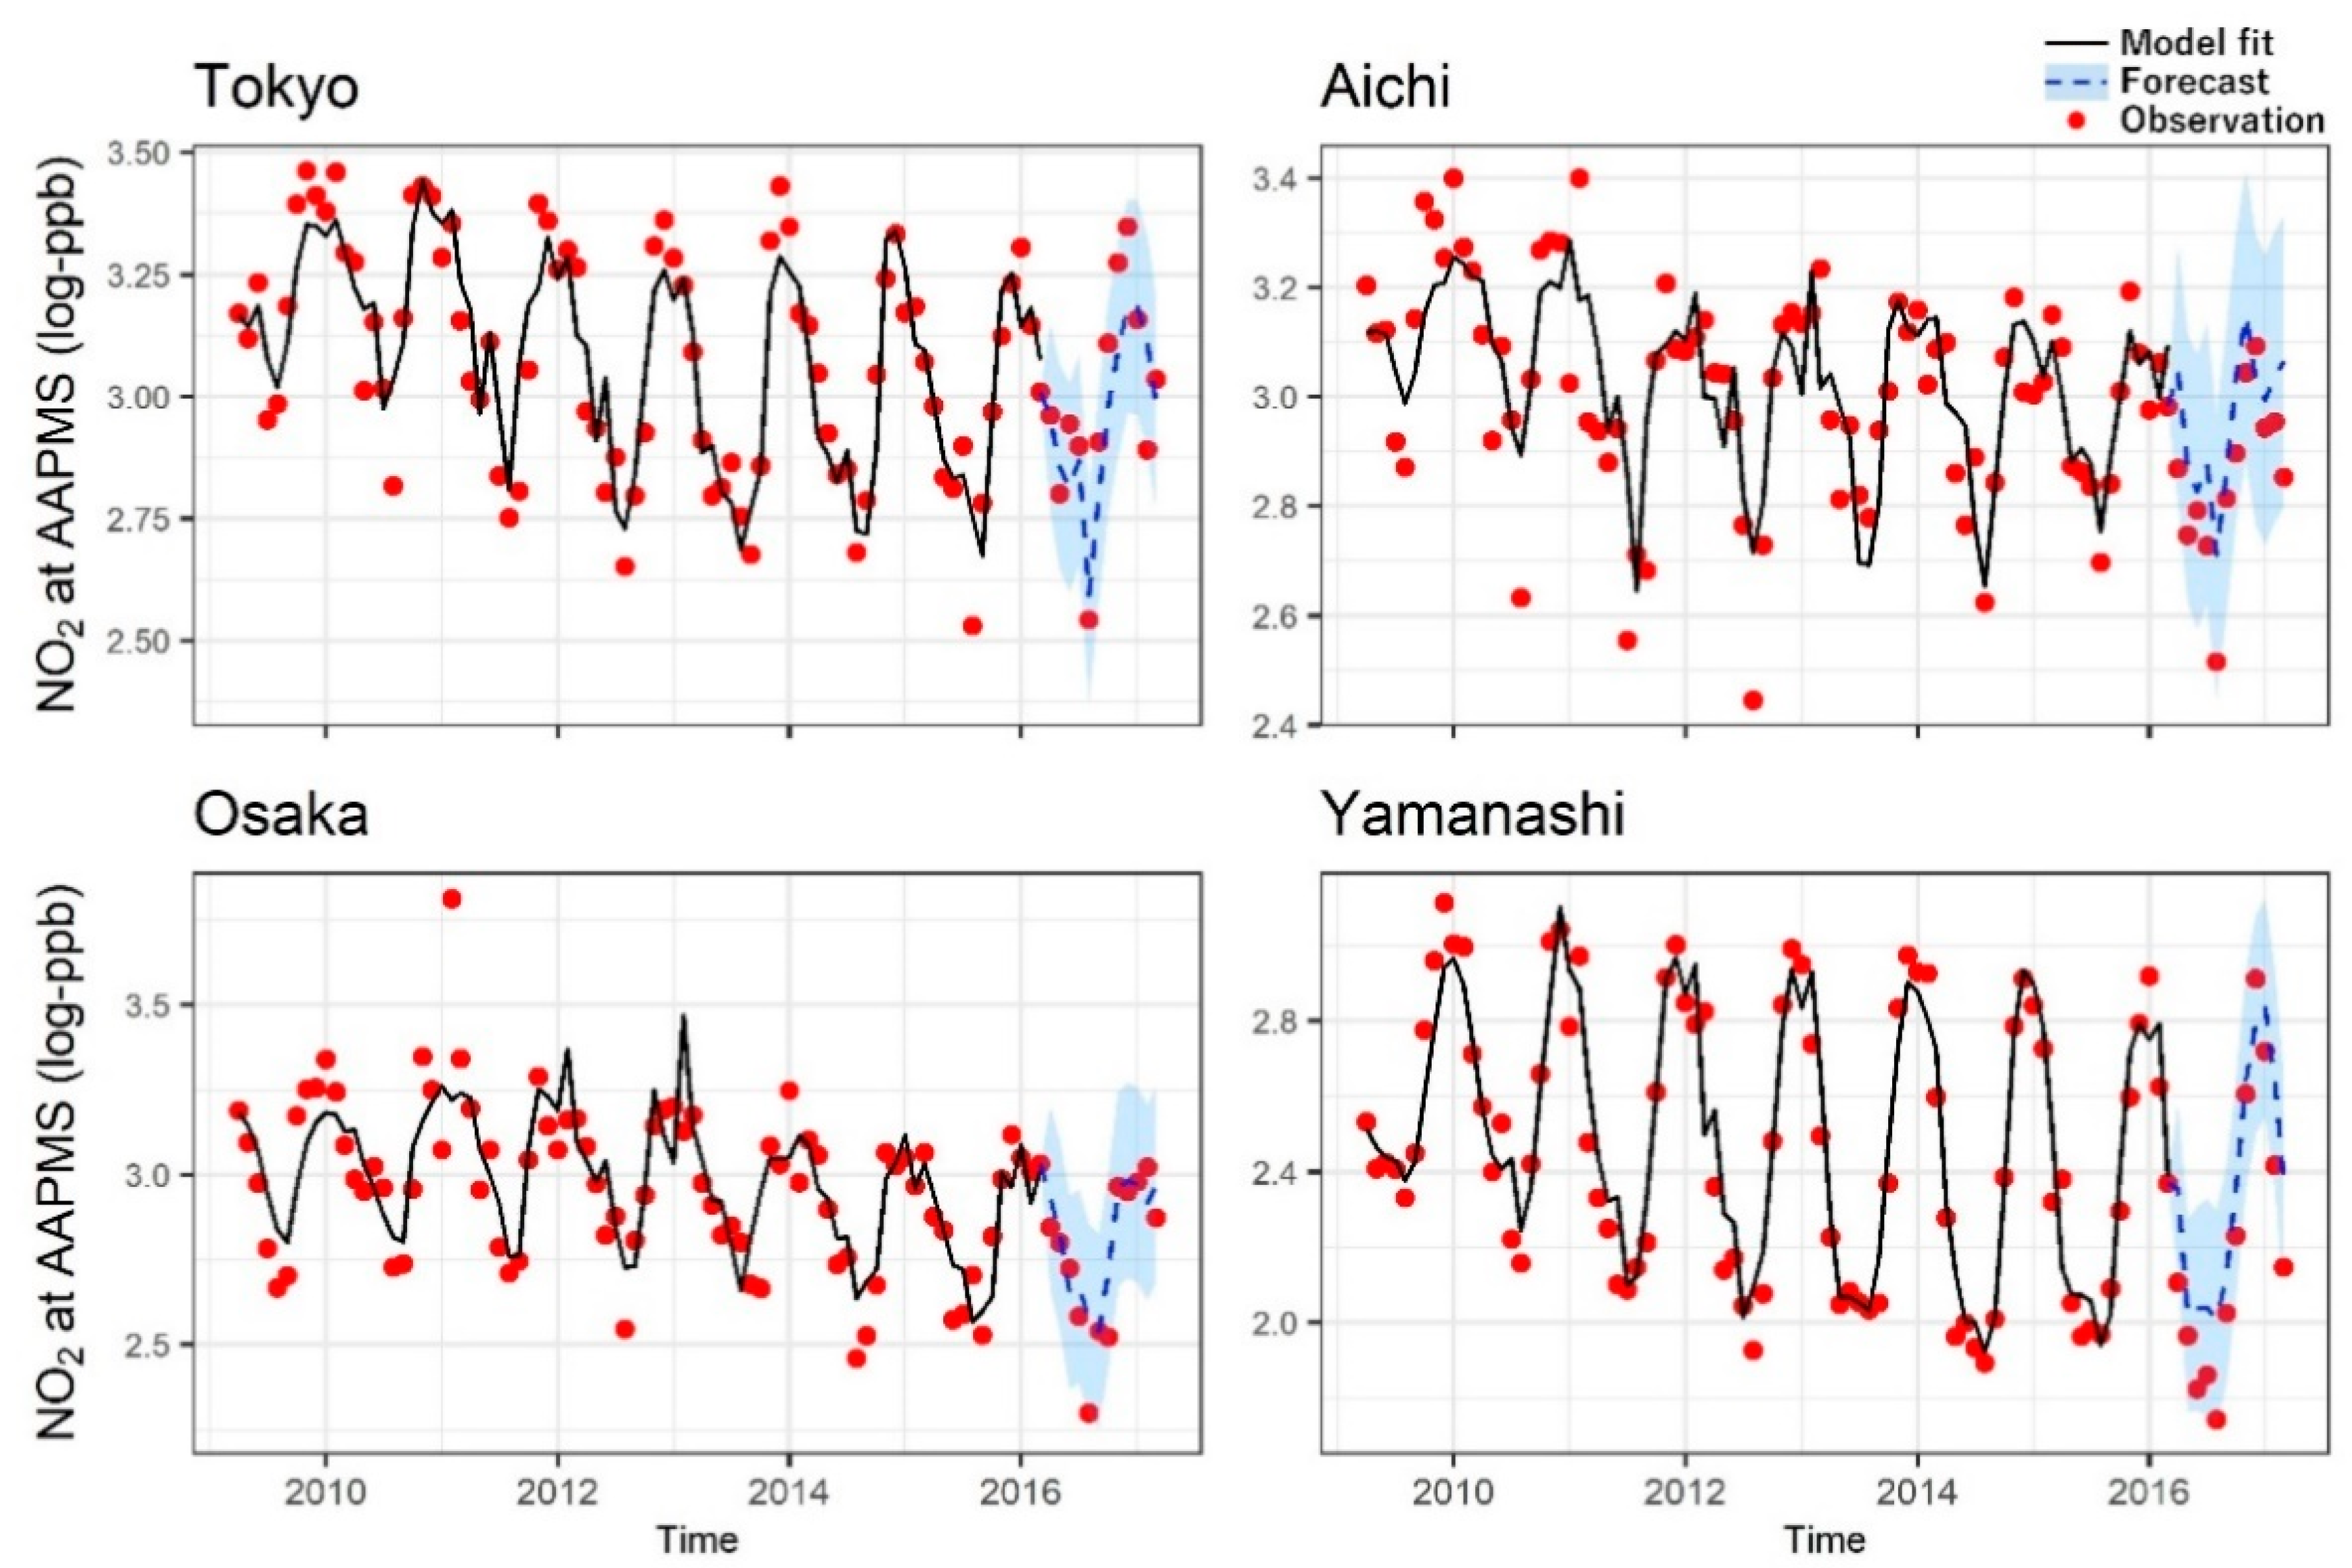
3.2. Climate and Air Pollution Factors Associated with Nitrogen Dioxide (NO2) Concentration at Ambient Air Pollution Monitoring Station (AAPMS)

Overall, air temperature, wind speed, solar radiation, and O3 at AAPMS had a trend of negative associations with NO2, while NO had positive associations (Table 2, the result of model validations is available in Table S2).
Specifically, air temperature had significant negative associations with NO2 in all the prefectures except Yamanashi. Wind speed had negative associations with NO2 in all the prefectures. Solar radiation had negative associations with NO2 in all the prefectures except Osaka. O3 was negatively and significantly associated with NO2 only in Yamanashi. NO had positive associations with NO2 in all the prefectures. The associations of relative humidity and sunshine duration with NO2 did not have consistent trends by prefecture (Table 2). Humidity in Osaka was negatively associated with NO2 while that in Yamanashi was positively associated. Sunshine duration had a trend of negative association with NO2 except in Osaka; Yamanashi had a significant negative association, while Osaka had a positive association. RMSEs for forecasting were close to those for model fitting (Table S2), and most of the testing data were within the 95% confidence interval (CI) of the forecasting (see Figure 2 as examples).

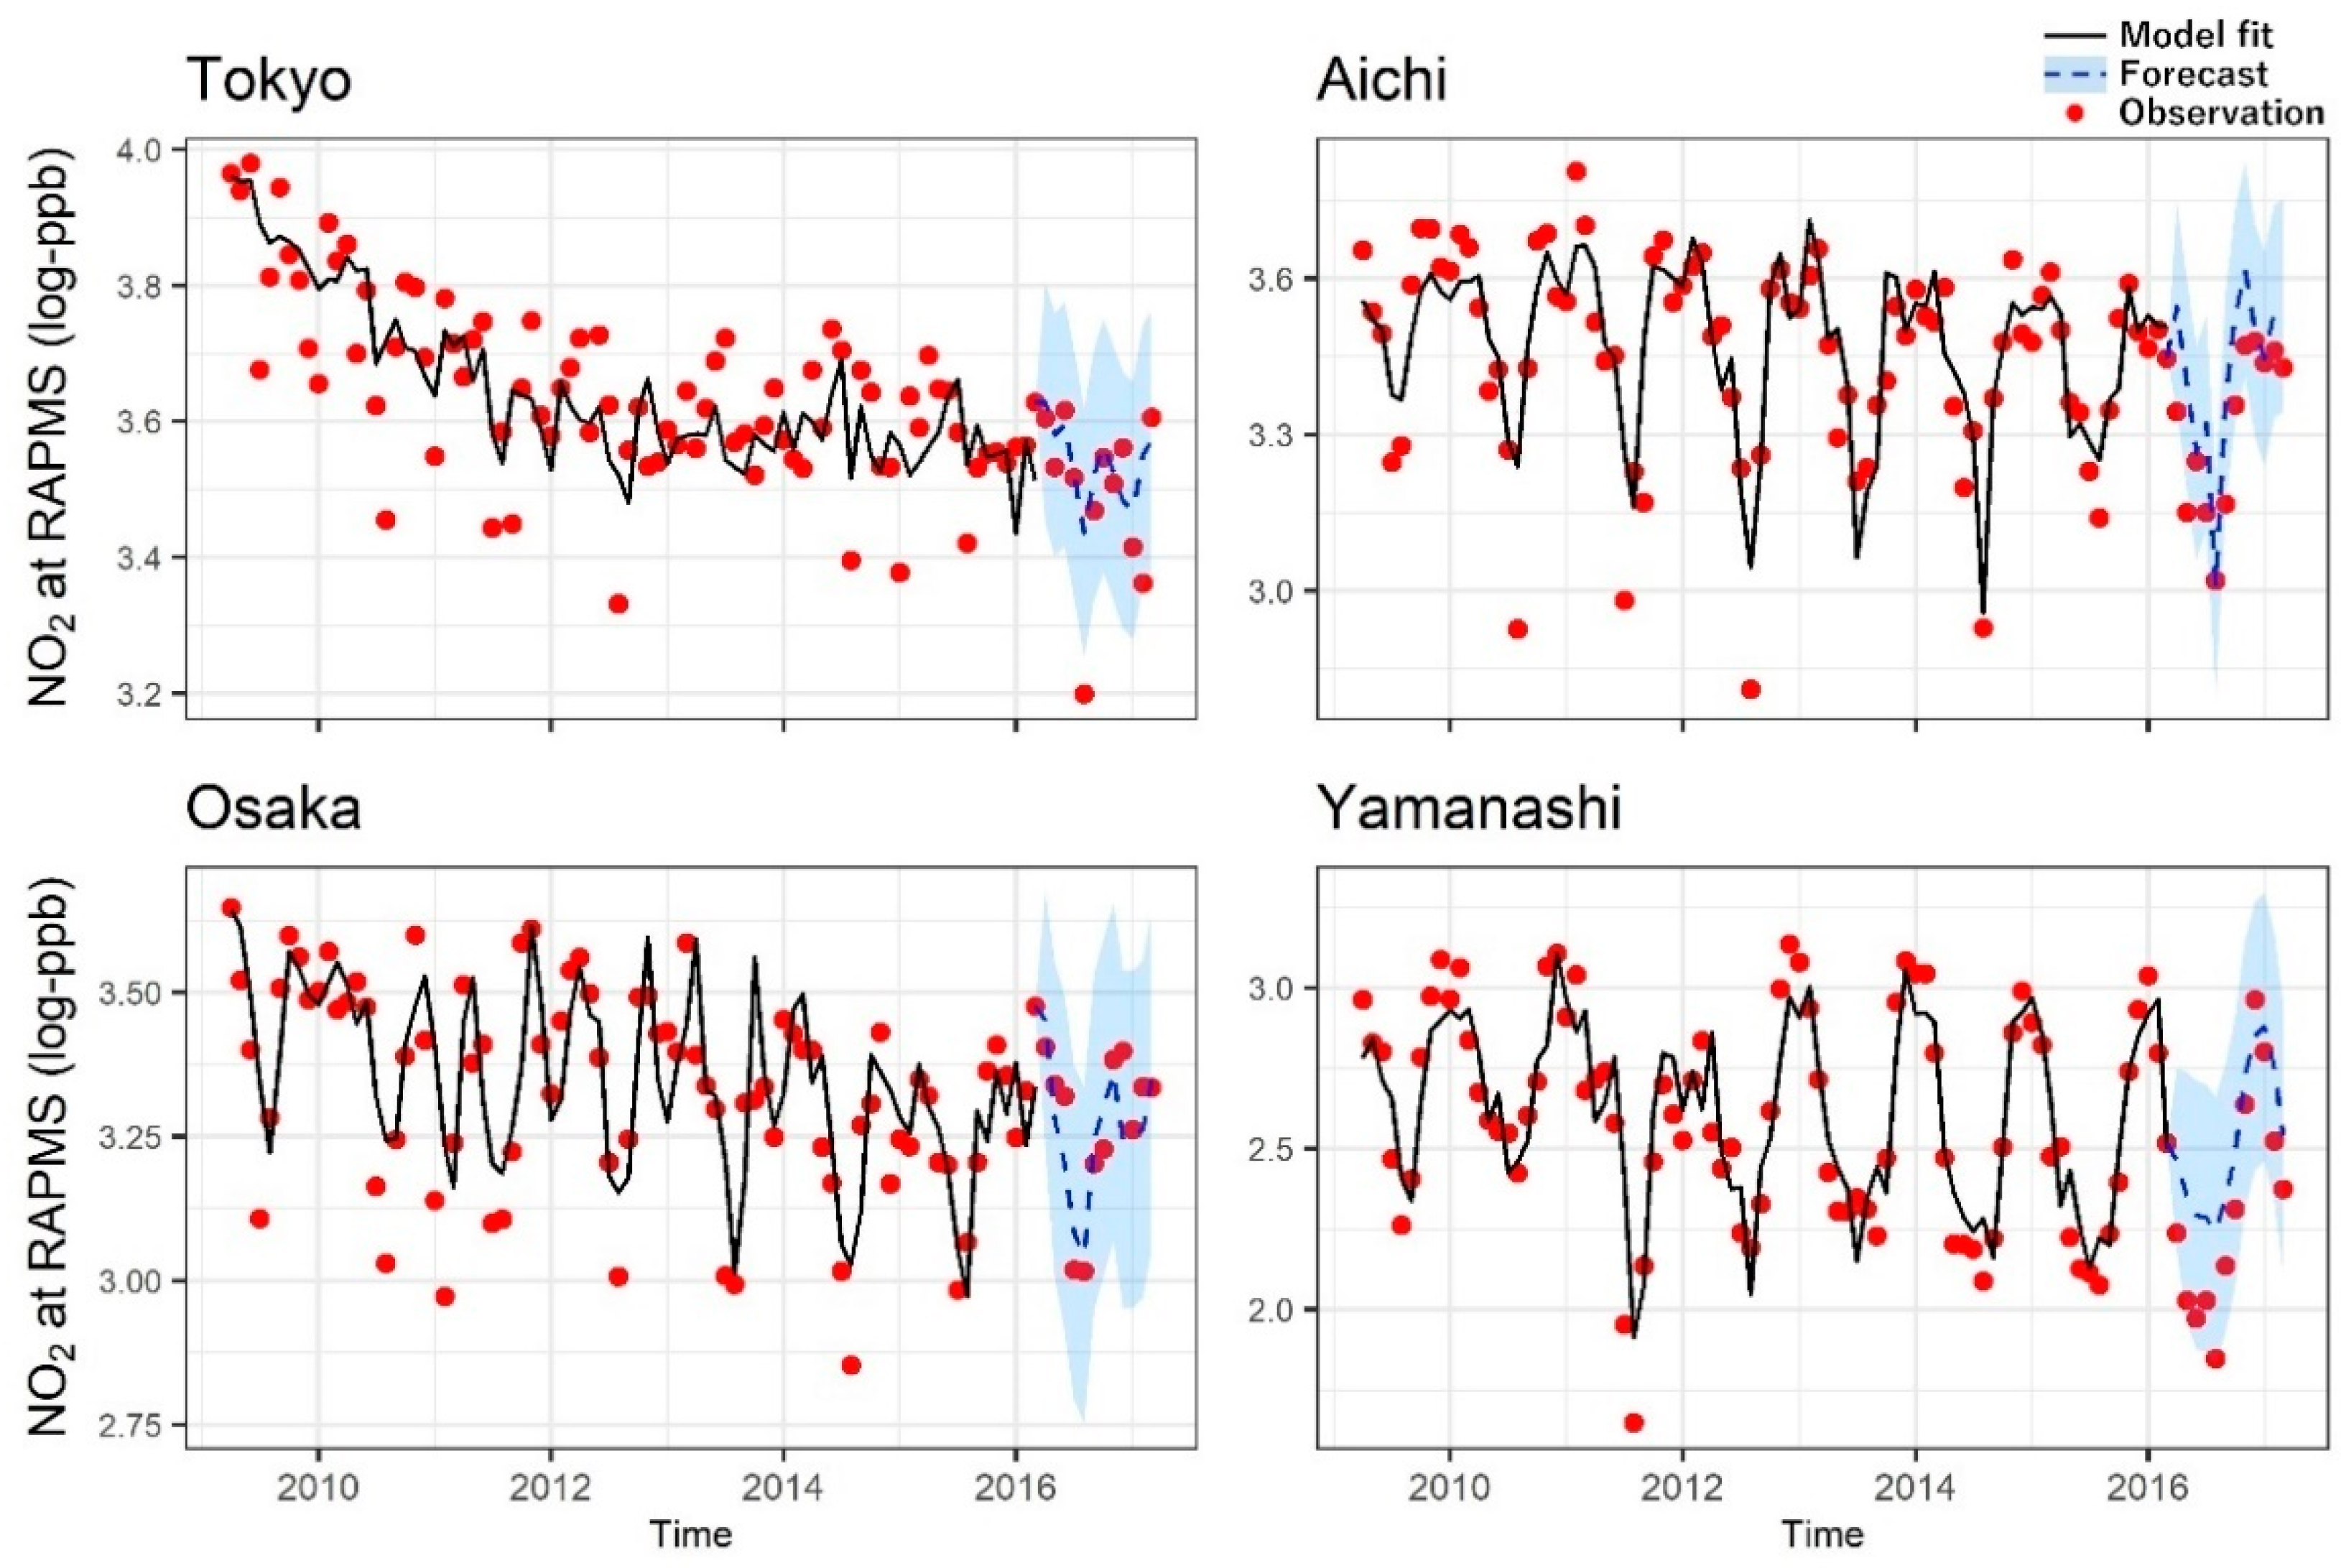
3.3. Climate and Air Pollution Factors Associated with Nitrogen Dioxide (NO2) Concentration at Roadside Air Pollution Monitoring Station (RAPMS)

Air temperature, wind speed, NO, and AO (the alternative of O3) at RAPMS had similar trends as those at AAPMS, and the first two were negatively associated with NO2, while NO was positively associated (Table 2, the result of model validations is available in Table S3). Specifically, air temperature had significant negative associations with NO2 in all the prefectures except Tokyo. Wind speed had negative associations with NO2 in all the prefectures. NO had positive associations with NO2 in all the prefectures. AO had significant negative associations with NO2 in Osaka and Yamanashi. The associations of relative humidity with NO2 did not have a consistent trend by prefecture (Table 2) as observed at AAPMS. The trend of relative humidity at RAPMS was the same as that at AAPMS: in Osaka it was negatively associated with NO2 while in Yamanashi it was positively associated. Sunshine duration had a trend of positive association with NO2 except in Osaka; significant associations were observed in Tokyo and Osaka at RAPMS. No significant relationship between solar radiation and NO2 was observed at RAPMS.
RMSEs for forecasting were close to those for model fitting (Table S3), and most of the testing data were within the 95% CI of the forecasting (see Figure 3 as examples, showing SARIMA model fittings and forecastings).

4. Discussion

NO2 air pollutant concentration shows seasonality, that is, low in summer and high in winter. The seasonality of NO2 at RAPMS was not clear compared to that at AAPMS, especially in urban areas (Tokyo, Aichi, and Osaka, i.e., NO2 levels at AAPMSs had regular annual patterns as shown in Figure 1 while those at RAPMSs in urban areas had irregular shape). Although the reasons for this are not clear, it might be affected by the emission of air pollutants from road traffic. According to the Ministry of Land, Infrastructure, Transport and Tourism, Japan [23], the average traffic volume of measuring points within 2 square kilometres of the centre of the RAPMSs in Tokyo, Aichi, and Osaka were 53,892, 51,894, and 43,004 cars per day in 2015, respectively, and the volumes were higher than in Yamanashi at 13,910 cars per day. NO2 was high in the urban areas and low in the rural area. The traffic volume could be one of the factors that affects NO2 concentrations in the atmosphere.
Air temperature, wind speed, and solar radiation at AAPMSs had a trend of negative association with NO2, while NO had a positive association (Table 2). The effect of solar radiation and wind speed on HONO and NO2 are consistent. HONO is decomposed by solar light [7], and the effect of decomposition by sunlight for NO2 is much weaker [24]. Wind decreases the concentrations of NO2 and HONO in the atmosphere [1,7]. When considering the relationships between climate factors and NO2 concentration in the atmosphere, the equilibrium relationship (Equation (1)) can also be considered. Given a high air temperature, the reaction proceeds toward the right side (i.e., producing NO2), while it goes to the left side (producing HONO) given high humidity [7]. Although the proportion of HONO out of NO2 is a few percent, the change in HONO concentration must be larger than NO2 from the equilibrium Equation (1) (i.e., one molecule of NO2 produces two HONO molecules). The negative relationship between air temperature and the NO2 concentration measured at AAPMS from this study suggests that the identified associations showed the same trends for HONO with climate factors, and that a certain proportion of HONO was in measured NO2.
The associations of relative humidity and sunshine duration with NO2 did not have consistent trends by prefecture. In the case of relative humidity, the relationship observed in Yamanashi seemed to be an effect of humidity on HONO in terms of the equilibrium relationship between HONO and NO2 (Equation (1)), while that in Osaka was an effect on NO2. Urban areas are more polluted by NO/NO2 compared to rural areas due to higher amounts of combustion, and the level of HONO does not reach an equilibrium concentration. Because of this, it is suggested that the proportion of HONO in measured NO2 was low/high in urban/rural areas, respectively, and the change in HONO concentration could be more sensitive in rural areas. This idea is consistent with a report saying the HONO/NOx ratio at roadsides was low [25], while that indoors, which may correlate with the ambient HONO/NOx concentrations, was high [6]. As described in (Equation (1)), HONO is produced from NO and NO2 discharged from, for example, cars. This reaction takes time to reach the equilibrium status [26], and it indicates that rural areas are polluted by HONO not locally but diffusely.
The trends of association of climate factors/air pollutants with NO2 at RAPMS were almost consistent with those at AAPMS although a significant relationship between solar radiation and NO2 was not observed at RAPMS. The lower effects of solar radiation on NO2 measured at RAPMSs suggested a higher proportion of NO and NO2 concentration due to their higher emission, thus, a lower proportion of HONO could be considered at RAPMS than at AAPMS (i.e., the level of HONO had not reached the equilibrium concentration at RAPMSs) because the effect of decomposition by sunlight for NO2 is much weaker than that for HONO [24]
Correlations between NO2 and O3 previously reported vary depending on the temporal averaging periods (i.e., from within-hourly to annual or longer-term correlations) and also depending on the studies [1]. One study using monthly averaging period, which is the same averaging period as the current study, showed similar results to this study (i.e., negative correlation between NO2 and O3). O3 is consumed by reactions with NO producing NO2 ( NO + O 3 NO 2 + O 2   ), and its concentration can be negligibly low due to high consumption where NO concentration is high. The negative relationship between O3 and NO2 from this study can be explained by this reaction and the extent of O3 concentrations, which was relatively low. The relationships between NO2 and O3 concentrations may have seasonal patterns, although the evidence is limited [1]; however, the present study did not deal with the effect modification of seasons, and further studies are required to assess the interaction effect between O3 and seasons on NO2 concentrations.
SARIMAX models can estimate coefficient of exogeneous variables by adjusting autocorrelation and seasonality effects. However, in this study only one exogeneous variable was used for each SARIMA model for the estimation. It should be noted that other confounders were not adjusted because underlying causal relationships between factors were not well established, and data used were limited to climate factors and air pollutants.

5. Conclusions

The relationships between climate factors and NO2 concentrations measured in the atmosphere, the differences between the types of monitoring stations, and differences between urban and rural areas were assessed using SARIMA and SARIMAX models in this study. Overall, wind speed was negatively and NO was positively associated with NO2 concentration. Air temperature had a negative association with NO2, which might indicate the decomposition of HONO (that was in measured NO2) in the equilibrium (Equation (1)). Humidity in Osaka was negatively associated with NO2 (the reaction of NO2) while that in Yamanashi was positively associated (the reaction of HONO), indicating the proportion of HONO in NO2 might be low/high in urban/rural areas, respectively. The associations between solar radiation and NO2 concentrations were only observed at the AAPMSs where the proportion of HONO in NO2 measured might have been higher. The findings from this study may suggest that the equilibrium reaction of HONO had a large impact against the ambient NO2 concentrations. To test the hypotheses that arose from this study (i.e., the level of HONO in NO2 in different settings), monitoring of HONO concentration and further analyses of the relationship between HONO and climate/pollutant factors are required.

Supplementary Materials

The following is available online at https://www.mdpi.com/1660-4601/17/24/9507/s1, Table S1: The numbers of missingness of hourly and daily data by the compounds and air pollution monitoring stations; Table S2: Climate and air pollution factors associated with NO2 concentration in the atmosphere from SARIMAX models at AAPMSs in Tokyo, Aichi, Osaka, and Yamanashi Prefectures, Japan; Table S3: Climate and air pollution factors associated with NO2 concentration in the atmosphere from SARIMAX models at RAPMS in Tokyo, Aichi, Osaka, and Yamanashi Prefectures, Japan.

Author Contributions

Conceptualization, N.T. and M.O.; methodology, T.M., H.M., Y.I. and M.O.; software, T.M. and H.M.; validation, H.M., K.A., C.M., Y.I., N.T., and M.O.; formal analysis, T.M.; investigation, H.M. and M.O.; resources, T.M.; data curation, T.M. and H.M.; writing—Original draft preparation, T.M.; writing—Review and editing, H.M., K.A., C.M., Y.I., N.T., and M.O.; visualization, T.M.; supervision, T.M. and M.O.; project administration, M.O.; funding acquisition, T.M. All authors have read and agreed to the published version of the manuscript.

Funding

This research was funded by the Japan Society for the Promotion of Science (JSPS) Grant-in-Aid for Scientific Research, grant number KAKENHI 19K24219.

Acknowledgments

We thank the Japan Society for the Promotion of Science (JSPS) for the research grant support.

Conflicts of Interest

The authors declare no conflict of interest. The funders had no role in the design of the study; in the collection, analyses, or interpretation of data; in the writing of the manuscript, or in the decision to publish the results.

References

  1. United States Environmental Protection Agency. Integrated Science Assessment for Oxides of Nitrogen—Health Criteria; EPA: Research Triangle Park, NC, USA, 2016.
  2. Liu, Q.; Wang, W.; Jing, W. Indoor air pollution aggravates asthma in Chinese children and induces the changes in serum level of miR-155. Int. J. Environ. Health Res. 2019, 29, 22–30. [Google Scholar] [CrossRef] [PubMed]
  3. Puklová, V.; Žejglicová, K.; Kratěnová, J.; Brabec, M.; Malý, M. Childhood respiratory allergies and symptoms in highly polluted area of Central Europe. Int. J. Environ. Health Res. 2019, 29, 82–93. [Google Scholar] [CrossRef] [PubMed]
  4. Deng, Q.; Lu, C.; Li, Y.; Sundell, J.; Norbäck, D. Exposure to outdoor air pollution during trimesters of pregnancy and childhood asthma, allergic rhinitis, and eczema. Environ. Res. 2016, 150, 119–127. [Google Scholar] [CrossRef] [PubMed]
  5. Ministry of the Environment, Government of Japan. Status of Air Pollution, 2018. Available online: http://www.env.go.jp/air/osen/jokyo_h30/index.html (accessed on 16 July 2020).
  6. Ohyama, M.; Nakajima, T.; Minejima, C.; Azuma, K.; Oka, K.; Itano, Y.; Kudo, S.; Takenaka, N. Association between indoor nitrous acid, outdoor nitrogen dioxide, and asthma attacks: Results of a pilot study. Int. J. Environ. Health Res. 2019, 29, 632–642. [Google Scholar] [CrossRef] [PubMed]
  7. Wang, L.; Wen, L.; Xu, C.; Chen, J.; Wang, X.; Yang, L.; Wang, W.; Yang, X.; Sui, X.; Yao, L.; et al. HONO and its potential source particulate nitrite at an urban site in North China during the cold season. Sci. Total Environ. 2015, 538, 93–101. [Google Scholar] [CrossRef] [PubMed]
  8. Dales, R.; Burnett, R.T.; Smith-Doiron, M.; Stieb, D.M.; Brook, J.R. Air pollution and sudden infant death syndrome. Pediatrics 2004, 113, e628–e631. [Google Scholar] [CrossRef] [PubMed] [Green Version]
  9. Linn, W.S.; Szlachcic, Y.; Henry, G.; Kinney, P.L.; Berhane, K.T. Air pollution and daily hospital admissions in Metropolitan Los Angeles. Environ. Health Perspect. 2000, 108, 427–434. [Google Scholar] [PubMed]
  10. Morgan, G.; Corbett, S.; Wlodarczyk, J.; Lewis, P. Air pollution and daily mortality in Sydney, Australia, 1989 through 1993. Am. J. Public Health 1998, 88, 759–764. [Google Scholar] [CrossRef] [PubMed] [Green Version]
  11. Sjödin, Å.; Ferm, M. Measurements of nitrous acid in an urban area. Atmos. Environ. 1985, 19, 985–992. [Google Scholar] [CrossRef]
  12. Oka, K. Measurement of Gaseous Nitrous Acid at Osaka Urban Site. Bull. Res. Inst. Environ. Agric. Fish. Osaka Prefect. Gov. 2008, 1, 13–21. [Google Scholar]
  13. Chan, W.H.; Nordstrom, R.J.; Calvert, J.G.; Shaw, J.H. Kinetic Study of HONO Formation and Decay Reactions in Gaseous Mixtures. Environ. Sci. Technol. 1976, 10, 674–682. [Google Scholar] [CrossRef]
  14. Pitts, J.N.; Winer, A.M.; Harris, G.W. Trace nitrogenous species in urban atmospheres. Environ. Health Perspect. 1983, 52, 153–157. [Google Scholar] [CrossRef] [PubMed]
  15. Ohyama, M.; Horie, I.; Isohama, Y.; Azuma, K.; Adachi, S.; Minejima, C.; Takenaka, N. Effects of nitrous acid exposure on baseline pulmonary resistance and Muc5ac in rats. Inhal. Toxicol. 2018, 30, 149–158. [Google Scholar] [CrossRef] [PubMed]
  16. World Health Organization. WHO Air Quality Guidelines for Particulate Matter, Ozone, Nitrogen Dioxide and Sulfur Dioxide; WHO: Geneva, Switzerland, 2005; Volume 195. [Google Scholar]
  17. Statistics Bureau, Ministry of Internal Affairs and Communications Japan. Final Report of 2015, Population and Households of Japan. Available online: http://www.stat.go.jp/english/data/kokusei/2015/final_en/final_en.html#Summary (accessed on 16 July 2020).
  18. Japan Meteorological Agency. Meteorological Data Download. Available online: https://www.data.jma.go.jp/gmd/risk/obsdl/index.php (accessed on 16 July 2020).
  19. Hyndman, R.J.; Athanasopoulos, G. ARIMA models. In Forecasting: Principles and Practice; OTexts: Melbourne, Australia, 2018. [Google Scholar]
  20. Box, G.E.P.; Jenkins, G.M.; Reinsel, G.C.; Ljung, G.M. Time Series Analysis: Forecasting and Control, 5th ed.; John Wiley & Sons, Inc.: Hoboken, NJ, USA, 2016; ISBN 9781118675021. [Google Scholar]
  21. Hyndman, R.J. Yeasmin Khandakar Automatic Time Series Forecasting: The forecast Package for R. J. Stat. Softw. 2008, 27, 22. [Google Scholar] [CrossRef] [Green Version]
  22. R Core Team. R: A Language and Environment for Statistical Computing; R Foundation for Statistical Computing: Vienna, Austria, 2020. [Google Scholar]
  23. Ministry of Land Infrastructure Transport and Tourism. National Transportation Census, 2015. Available online: https://www.mlit.go.jp/road/census/h27/index.html (accessed on 16 July 2020).
  24. Kuprov, R.; Eatough, D.J.; Cruickshank, T.; Olson, N.; Cropper, P.M.; Hansen, J.C. Composition and secondary formation of fine particulate matter in the Salt Lake Valley: Winter 2009. J. Air Waste Manag. Assoc. 2014, 64, 957–969. [Google Scholar] [CrossRef] [PubMed] [Green Version]
  25. Trinh, H.T.; Imanishi, K.; Morikawa, T.; Hagino, H. Gaseous nitrous acid (HONO) and nitrogen oxides (NOx) emission from gasoline and diesel vehicles under real-world driving test cycles. J. Air Waste Manage. Assoc. 2017, 67, 412–420. [Google Scholar] [CrossRef] [PubMed] [Green Version]
  26. Kaiser, E.W.; Wu, C.H. A kinetic study of the gas phase formation and decomposition reactions of nitrous acid. J. Phys. Chem. 1977, 81, 1701–1706. [Google Scholar] [CrossRef]
Figure 1. Monthly average nitrogen dioxide (NO2) concentration in April 2009–March 2017 in the study areas, Tokyo, Aichi, Osaka, and Yamanashi, Japan. Upper figures are NO2 concentrations at ambient air pollution monitoring stations (AAPMSs) while lowers are at roadside air pollution monitoring stations (RAPMSs).
Ijerph 17 09507 g001
Figure 2. Fitting and forecasting for nitrogen dioxide (NO2) concentration at ambient air pollution monitoring stations (AAPMSs) using seasonal autoregressive integrated moving average (SARIMA) models. Log scale NO2 concentrations were used for the analyses. Red dots are observations. Black lines show model fits for NO2 using data in April 2009–March 2016 (training data). Blue dotted lines (estimates) and shadows (95% confidence intervals) show the forecasting for NO2 using data in April 2016–March 2017 (testing data).
Ijerph 17 09507 g002
Figure 3. Fitting and forecasting for nitrogen dioxide (NO2) concentration at roadside air pollution monitoring stations (RAPMSs) using seasonal autoregressive integrated moving average (SARIMA) models. Log scale NO2 concentrations were used for the analyses. Red dots are observations. Black lines show model fits for NO2 using data in April 2009–March 2016 (training data). Blue dotted lines (estimates) and shadows (95% confidence intervals) show the forecasting for NO2 using data in April 2016–March 2017 (testing data).
Ijerph 17 09507 g003
Table 1. Mean (standard deviation) NO2 concentration (ppb) by month between April 2009 and March 2017 at AAPMSs and RAPMSs in Tokyo, Aichi, Osaka, and Yamanashi Prefectures, Japan.
AAPMS RAPMS
MonthTokyoAichiOsakaYamanashiTokyoAichiOsakaYamanashi
January26.5 (2.0)22.2 (3.5)22.9 (2.9)17.8 (1.6)34.5 (3.1)34.3 (2.2)28.0 (3.5)18.5 (3.0)
February25.2 (4.1)23.0 (3.6)24.6 (8.6)16.3 (3.0)37.9 (6.2)36.7 (4.2)28.6 (4.7)17.8 (3.2)
March23.1 (2.4)21.9 (2.9)22.5 (3.0)12.3 (2.7)38.8 (3.7)36.2 (3.7)30.9 (3.5)14.4 (2.5)
April21.1 (2.7)21.0 (2.3)20.8 (2.7)10.6 (1.6)41.5 (5.8)33.6 (3.0)32.1 (3.5)13.3 (3.0)
May18.8 (2.2)18.4 (2.3)18.7 (1.7)8.7 (1.6)39.4 (5.4)29.5 (3.5)29.5 (3.7)11.6 (3.3)
June19.6 (3.6)19.0 (2.5)17.4 (2.9)8.7 (2.2)42.4 (5.0)29.0 (2.8)28.1 (2.9)11.2 (3.1)
July18.2 (1.1)16.7 (2.0)16.1 (2.1)8.1 (1.5)37.2 (3.4)24.7 (2.3)21.7 (1.8)9.5 (2.0)
August15.2 (2.3)14.4 (2.0)13.8 (2.2)7.7 (1.4)32.7 (6.3)21.8 (3.7)21.1 (2.6)8.4 (2.0)
September18.2 (3.6)18.0 (2.8)14.3 (1.6)8.8 (1.7)37.6 (6.5)28.3 (4.0)26.6 (2.9)9.9 (1.7)
October22.5 (4.9)22.2 (3.5)17.6 (3.8)12.1 (2.4)38.6 (4.8)34.8 (4.3)30.5 (4.2)12.7 (2.1)
November27.8 (3.0)24.4 (2.1)23.3 (3.3)16.9 (2.5)38.2 (5.0)37.2 (2.8)32.5 (3.4)17.7 (2.7)
December28.9 (1.8)23.1 (2.2)22.8 (2.5)19.5 (1.9)36.8 (2.7)34.2 (1.7)29.0 (2.9)20.1 (3.0)
NO2, nitrogen dioxide; AAPMSs, ambient air pollution monitoring stations; RAPMSs, roadside air pollution monitoring stations.
Table 2. Climate and air pollution factors associated with NO2 concentration in the atmosphere from SARIMAX models at AAPMSs/RAPMSs in Tokyo, Aichi, Osaka, and Yamanashi Prefectures, Japan.
Model 1
(SARIMA/ SARIMAX)
AAPMSRAPMS
Coefficient 2 (95%CI)
Tokyo
SARIMANANA
Temperature−0.022 (−0.029, −0.015)−0.001 (−0.005, 0.003)
Humidity0.004 (−0.001, 0.008)0.002 (−0.001, 0.004)
Wind speed−0.181 (−0.242, −0.120)−0.297 (−0.344, −0.251)
Solar radiation−0.021 (−0.033, −0.009)−0.002 (−0.01, 0.005)
Sunshine duration−0.018 (−0.037, 0.001)−0.021 (−0.039, −0.003)
NO0.024 (0.016, 0.031)0.006 (0.005, 0.008)
O3/AO 3−0.003 (−0.009, 0.002)−0.003 (−0.012, 0.001)
Aichi
SARIMANANA
Temperature−0.015 (−0.020, −0.009)−0.016 (−0.022, −0.009)
Humidity−0.003 (−0.010, 0.004)−0.005 (−0.010, 0.000)
Wind speed−0.270 (−0.343, −0.196)−0.169 (−0.238, −0.100)
Solar radiation−0.019 (−0.031, −0.007)−0.002 (−0.014, 0.011)
Sunshine duration−0.013 (−0.034, 0.008)−0.002 (−0.020, 0.016)
NO0.020 (0.013, 0.028)0.009 (0.007, 0.012)
O3/AO 3−0.001 (−0.008, 0.005)0.001 (−0.005, 0.007)
Osaka
SARIMANANA
Temperature−0.022 (−0.026, −0.018)−0.011 (−0.013, −0.008)
Humidity−0.010 (−0.019, −0.001)−0.006 (−0.012, −0.001)
Wind speed−0.306 (−0.413, −0.199)−0.257 (−0.317, −0.198)
Solar radiation0.002 (−0.025, 0.029)0.01 (−0.006, 0.026)
Sunshine duration0.061 (0.031, 0.091)0.025 (0.003, 0.047)
NO0.033 (0.027, 0.039)0.015 (0.012, 0.018)
O3/AO 3−0.002 (−0.009, 0.005)−0.006 (−0.011, −0.001)
Yamanashi
SARIMANANA
Temperature−0.012 (−0.034, 0.010)−0.031 (−0.038, −0.024)
Humidity0.010 (0.006, 0.013)0.005 (0.001, 0.010)
Wind speed−0.198 (−0.251, −0.144)−0.120 (−0.208, −0.032)
Solar radiation−0.016 (−0.029, −0.004)−0.005 (−0.022, 0.012)
Sunshine duration−0.025 (−0.043, −0.006)0.012 (−0.008, 0.032)
NO0.034 (0.021, 0.047)0.038 (0.025, 0.050)
O3/AO 3−0.007 (−0.012, −0.002)−0.009 (−0.015, −0.005)
Notes: The first 7 years [April 2009–March 2016, 84-point (12 months times 7 years) time series data] were used as training data and the last 1 year [April 2016–March 2017, 12-point (12 months times 1 year) time series data] were as training data for each model. AAPMS, ambient air pollution monitoring stations; RAPMS, roadside air pollution monitoring stations; SARIMA, seasonal autoregressive integrated moving average; SARIMAX, seasonal autoregressive integrated moving average with exogeneous variables; CI, confidence interval; NO2, nitrogen dioxide; NO, nitric oxide; O3, ozone. 1 This column shows the types of models. The exogeneous variables are shown for SARIMAX models. An exogeneous variable was included in each SARIMAX model. 2 Coefficients in log scale for exogeneous variable. 3 O3/AO were used for the analyses at AAPMSs/RAPMSs, respectively.
Publisher’s Note: MDPI stays neutral with regard to jurisdictional claims in published maps and institutional affiliations.

