Abstract
Groundwater quality deterioration has become an environmental problem of widespread concern. In this study, we used a water quality index (WQI) and multivariate statistical techniques to assess groundwater quality and to trace pollution sources in the Hutuo River alluvial-pluvial fan, China. Measurement data of 17 variables in 27 monitoring sites from three field surveys were obtained and pretreated. Results showed that there were 53.09% of NO3−, 18.52% of SO42− and 83.95% of total hardness (TH) in samples that exceeded the Grade III standard for groundwater quality in China (GB/T 14848-2017). Based on WQI results, sampling sites were divided into three types: high-polluted sites, medium-polluted sites and low-polluted sites. The spatial variation in groundwater quality revealed that concentrations of total dissolved solids (TDS), Cl−, TH and NO3− were the highest in high-polluted sites, followed by medium-polluted and low-polluted sites. The temporal variation in groundwater quality was controlled by the dilution of rainwater. A principal component analysis (PCA) revealed that the primary pollution sources of groundwater were domestic sewage, industrial sewage and water–rock interactions in the dry season. However, in the rainy and transition seasons, the main pollution sources shifted to domestic sewage and water–rock interactions, nonpoint pollution and industrial sewage. According to the absolute principal component scores-multivariate linear regression (APCS-MLR), most water quality parameters were primarily influenced by domestic sewage. Therefore, in order to prevent the continuous deterioration of groundwater quality, the discharge of domestic sewage in the Hutuo River alluvial-pluvial fan region should be controlled.
1. Introduction
The availability of good-quality groundwater is vital for the physical health and socio-economic development of the local populations that depend on it. Nowadays, the rapid growth in human populations and economic development has caused the severe deterioration of groundwater quality [1], especially in developing countries [2,3,4].
Groundwater quality is mainly controlled by two sets of factors: one is anthropogenic activity factors, such as domestic and industry sewage, agriculture fertilizer, urban development, exploitation of water resources and mining operations [4,5,6], while the other comprises natural processes, including aquifer lithology, soil characteristics, and groundwater–rock interaction [1]. According to Qin et al. [1], the major factors controlling groundwater quality in the coastal alluvial aquifers of the lower Liaohe River Plain, China were Holocene transgression and mixing, surface water infiltration, multi-factor processes, rainfall regimes and agricultural fertilizer contamination and geogenic fluoride enrichment. Herojeet et al. [7] recently demonstrated that groundwater chemistry in an alluvial aquifer of Nalagarh Valley, India was strongly controlled by water–rock interaction, ion exchange and leaching of parent materials, agricultural runoff and the seepage of industrial and domestic wastes material.
An effective way to mitigate and control the continuous deterioration of groundwater quality is to understand the spatial and temporal variations and identify the major pollution sources, which requires continuous and regular water quality monitoring programs. However, such monitoring systems generate voluminous databases and their analysis requires robust analytical tools [8]. In recent years, multivariate statistical techniques (such as principal component analysis (PCA), factor analysis (FA) and absolute principal component score-multiple linear regression (APCS-MLR)) have been widely used in the water environment to evaluate both temporal and spatial variations of water quality [8,9,10], to provide qualitative information about potential pollution sources [6,11,12,13,14,15], and to estimate source distributions for each pollution variable [4,11].
The Hutuo River alluvial-pluvial fan is located in the western portion of the North China Plain. Nowadays, with rapid urbanization and industrialization, the groundwater quality has been seriously affected by anthropogenic activities [16]. A previous study found that groundwater quality in the Hutuo River region was primarily affected by inorganic materials including total hardness, iron, manganese, total dissolved solids and nitrate nitrogen [17]. Zhang et al. [4] found that the poor groundwater quality in the Hutuo River region is due to intense anthropogenic activities as well as aquifer vulnerability to contamination. In this study, we mainly distinguish the temporal and spatial patterns of groundwater quality, evaluate the spatiotemporal variation in groundwater quality using a water quality index (WQI) and identify the temporal and spatial variation in groundwater pollution sources by using PCA and absolute principal component score-multiple linear regression (APCS-MLR) in the Hutuo River alluvial-pluvial fan region.
2. Materials and Methods
2.1. Study Area
The study area lies on the middle and upper part (37°50′–38°24′, 113°51′–114°55′) of the Hutuo River alluvial-pluvial fan in southwestern Hebei Province, China (Figure 1). Its total area covers approximately 2442 km2 and supports important agricultural and industrial activities. This region has a temperate semi-humid and semi-arid continental monsoon climate, with an average annual temperature of 13.3–15.0 °C [16], and the annual precipitation is mainly concentrated in June to September with precipitation of 450–750 mm (Supplementary Figure S1).
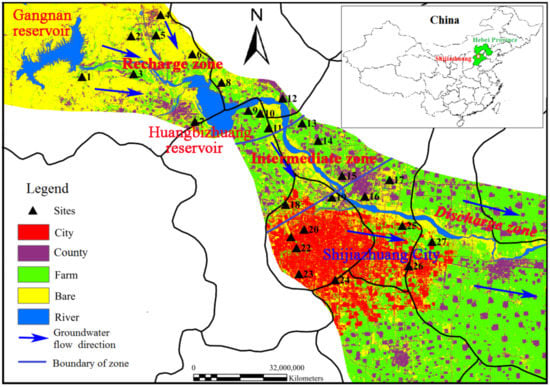
Figure 1.
Water quality monitor sites and land use types of the Hutuo River alluvial-pluvial fan in China.
The aquifer of the study region is part of the Hebei plain quaternary thick aquifer system, whose lithology is primarily composed of gravel, pebbles and coarse and fine sands [18]. The types of groundwater include fissure water and loose stratum pore water, and the groundwater flow runs from the northwest to the southeast. In the upper part of the Hutuo River alluvial-pluvial fan, the aquifer’s thickness is 10–35 m and its groundwater depth is 2–35 m, with very good hydraulic conductivity and water-richness. In the middle part of the Hutuo river alluvial-pluvial fan, the depth of the groundwater is greater, at 40–50 m, for which the main lithology comprises coarse sand and medium sand, and its water conductivity and water-richness are also good. The recharge sources of this groundwater include (1) atmospheric precipitation infiltration, (2) infiltration of river water, and (3) return of farmland irrigation water. The groundwater discharge is dominated by artificial pumping [17].
With the rapid urbanization and industrialization over recent years (according to the Shijiazhuang Statistical Yearbooks of 1995 and 2014, the land area in the city increased from 85 to 264 km2), and persistent groundwater over-exploitation has resulted in a decline of the regional groundwater table, such that large depression cones have formed locally [19]. Additionally, the chemical environment of shallow groundwater has been greatly changed by anthropogenic activities. This water chemistry has been transformed from HCO3-type water to HCO3-Cl, HCO3-SO4, and SO4-HCO3 types [18]. Several studies showed that the concentrations of groundwater NO3−, TH and total dissolved solids (TDS) in this region exceeded China’s drinking water standards [4,20,21]. Consequently, this is now a hidden hazard threatening the region’s economic and social development and the safety of drinking water for its local populations.
2.2. Groundwater Sampling and Laboratory Analyses
Groundwater samples were collected from the Hutuo River alluvial-pluvial fan region in January (i.e., dry season) of 2015, in October (i.e., transition season from rainy to dry) of 2015 and in August (i.e., rainy season) of 2016. Groundwater samples were obtained from three field surveys carried out in the dry, wet and transition seasons from the upstream to the downstream of Hutuo River, and consisted of 27 sampling sites (Figure 1). All the wells chosen for sampling groundwater are commonly used for domestic and/or agricultural purposes; their mean depth to the groundwater table was 9.78 m (min–max: 4.0–50.0 m). The samples’ pH and electrical conductivity (EC) were measured in the field using a WTW Multi 340i/SET multiparameter instrument (Germany).
Samples were collected by pumping groundwater from the wells, and stored in one 500 mL and one 1.5 L high-density polyethylene sampling bottle for analyzing the water quality parameters. The hydrochemical parameters of each groundwater sample were analyzed at the laboratory of Groundwater Mineral Water and Environmental Monitoring Center, based at the Institute of Hydrogeology and Environmental Geology, the Chinese Academy of Geological Sciences. The analyses of ions (i.e., nitrate [NO3−], nitrite [NO2−], chloride [Cl−], sulfate [SO42−] and ammonia [NH4+]) were carried out using spectrophotometry (Perkin-Elmer Lambda 35, United States) and the detection limit values of the NO3−, NO2−, Cl−, SO42− and NH4+ were 0.664 mg/L, 0.003 mg/L, 1.0 mg/L, 0.75 mg/L and 0.026 mg/L, respectively. Analyses of cations (i.e., potassium [K+], sodium [Na+], calcium [Ca2+] and magnesium [Mg2+]) as well as two trace elements (Fe and Mn) in groundwater samples were performed using inductively coupled plasma-mass spectrometry (Agilent 7500ce ICP-MS, Tokyo, Japan) and the detection limit values of the K+, Na+, Ca2+, Mg2+, Fe and Mn were 0.05 mg/L, 0.01 mg/L, 4.0 mg/L, 3.0 mg/L, 0.0045 mg/L and 0.0005 mg/L, respectively. Bicarbonate [HCO3−] was determined using an acid–base titration and the detection limit value of the HCO3− was 5.0 mg/L. Total dissolved solids (TDS) were quantified using gravimetric methods, and chemical oxygen demand (COD) was determined using alkaline permanganate oxidation, while the TH of each sample was measured according to the ethylene diamine tetraacetic acid titration method.
2.3. Data Analysis
2.3.1. Principal Component Analysis (PCA)
PCA is a very powerful technique for variable reduction, dispensing with non-homogeneity in the sampling data, missing values and periodic trends, in order to elucidate spatial–temporal patterns in water quality and latent pollution sources [22]. A PCA works by extracting eigenvalues and their related loadings from the covariance matrix of the original variables to produce new orthogonal variables through varimax rotation, which are linear combinations of the original variables [23]. These new orthogonal variables (PC) allow data reduction with minimum loss of the original information, thereby providing information on the most meaningful parameters that describe the whole data set. Here, PCA was used to identify the main pollution sources of groundwater in different seasons.
2.3.2. Absolute Principal Component Score-Multiple Linear Regression (APCS-MLR)
Absolute principal component score-multiple linear regression (APCS-MLR) can be used to estimate the contribution of each pollution source to the total, by combining MLR with the de-normalized APCS values produced by PCA and the measured concentrations of a particular pollutant [24]. After determining the number and identify of latent sources influencing the groundwater quality in the Hutuo River alluvial-pluvial fan (via the PCA), these source contributions were derived using the computations of APCS-MLR.
2.3.3. Water Quality Index (WQI)
A robust WQI is an important indicator for assessing groundwater quality and its suitability for drinking purposes [14,25,26]. The WQI was calculated by assigning a weight (Wi) to each water quality parameter according to its relative importance in the overall quality of groundwater for drinking purposes. Water quality standards mainly refer to the Grade III standard for groundwater quality in China [20]. When this standard was lacking for a given parameter, the World Health Organization (2011) [27] standards were used. The assigned weight (Wi) and relative weight (RWi) for each parameter can be found in Supplementary Table S1.
The WQI was calculated as follows:
where Qi is the quality rating, Ci is the concentration (mg/L) of each water quality parameter, Si is the water quality standard for each water quality parameter and SIi is the sub-index of the i parameter.
SIi = Wi × Qi
Calculated WQI values are usually classified into five categories (Supplementary Table S2): excellent, good, poor, very poor and unsuitable for human drinking [14].
3. Results and Discussion
3.1. Groundwater Quality Characteristic of the Hutuo River Alluvial-Pluvial Fan
Descriptive summary statistics of the groundwater quality data from the three sampling surveys that exceeded the national guidelines are given in Table 1. The mean groundwater pH and TDS values were 7.48 and 848.97 mg/L, respectively, among which 1.23% of pH and 22.22% of TDS samples exceeded the Grade III standard for groundwater quality in China [20]. Groundwater NO3−, SO42− and TH had mean values of 121.90 mg/L, 181.82 mg/L and 600.32 mg/L, respectively; 53.09% of NO3−, 18.52% of SO42− and 83.95% of TH samples surpassed the Grade III standard for groundwater quality in China [20]. According to this set of results, the mean concentrations of NO3−, SO42− and TH were very high in the Hutuo River alluvial-pluvial fan region. This indicated that its groundwater quality was generally impacted by human activity [6,13].

Table 1.
Groundwater quality parameters and summary basic statistics of the Hutuo River alluvial-pluvial fan.
3.2. Water Quality Classification
In this study, the WQI was used to assess the groundwater quality according to China’s current quality standard [20]. Results for calculated WQIs during the dry, rainy and transition seasons are given in Table 2. The WQI ranged from 29.3 to 233.6. The maximum WQI value was obtained in the dry season and its minimum value was found in the rainy season.
Table 2.
Statistics of water quality index classification for different seasons in the Hutuo River alluvial-pluvial fan.
In the dry season, there were 2, 15, 8 and 2 groundwater samples that had excellent, good, poor and very poor water quality, respectively, correspondingly accounting for 7.41%, 55.56%, 29.63% and 7.41% of the total groundwater samples. However, groundwater quality was improved in both the rainy and transition seasons, which may be attributed to the dilution caused by aquifer recharge in the two seasons [7]. In the rainy season, 2, 19, 4 and 2 of the groundwater samples were deemed of excellent, good, poor and very poor water quality, respectively; similarly, 3, 19 and 5 groundwater samples in the transition season were respectively classed as excellent, good and poor. It is worth noting that groundwater quality in the transition season (lacking any “very poor” samples) was slightly better than in the rainy season. A plausible explanation for this result is that rainwater infiltration of the aquifer lags behind the timing of rainfall; hence, in the transition season, the rainwater has completely entered the aquifer and diluted the groundwater pollutants’ concentrations.
3.3. Spatio-Temporal Variation in Groundwater Quality
According to the dry season’s WQI results, very poor water (sites 1 and 6) was considered to be dirty and could be defined as having a high pollution status (HP); poor water (sites 2, 4, 9–13 and 27) corresponded to moderate pollution (MP) and excellent and good water (i.e., at the other sites) was considered to be clean and thus defined as having a low pollution status (LP). Among the hydrochemical variables, those of pH, TDS, Cl−, TH, NO3− and Fe were selected to analyze the spatial and temporal variation of groundwater quality in the study region.
Overall, groundwater quality varied spatially as follows: the high-polluted sites were mainly located in the upper part of the study area, the medium-polluted sites in both its upper and middle parts, and the low-polluted sites occurred only in its lower part (Figure 1). This spatial pattern may be related to the area’s groundwater depths. Previous studies have found that those areas with shallow groundwater depth were easily affected by human activities [4]. As shown in Figure 2, the concentration of TDS, Cl−, TH and NO3− were the highest in the high-polluted sites, followed by the medium-polluted sites and then the low-polluted sites. By contrast, the pH and Fe levels were similar among the three pollution types.
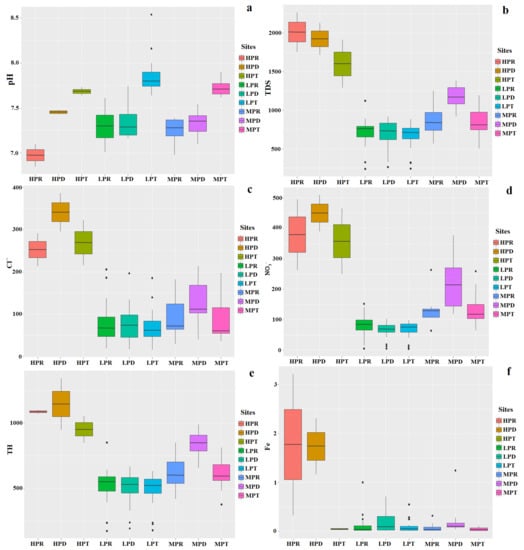
Figure 2.
Spatial and temporal pattern of the (a) pH, (b) TDS, (c) Cl−, (d) NO3−, (e) TH and (f) Fe values of r in the Hutuo River alluvial-pluvial fan. Note: HPR = High-polluted sites in rainy season; HPD = High-polluted sites in dry season; HPT = High-polluted sites in transition season; LPR = Low-polluted sites in rainy season; LPD = Low-polluted sites in dry season; LPT = Low-polluted sites in transition season; MPR = Medium-polluted sites in rainy season; MPD = Medium-polluted sites in dry season; MPT = Medium-polluted sites in transition season.
Trends in the temporal variation of groundwater quality were inconsistent in the three pollution types (Figure 2), in that Cl−, TH and NO3− concentrations in the high- and medium-polluted sites were higher in the dry than the rainy season. This finding is probably also related to the dilution effect of groundwater pollutants by rainwater [7]; however, no regularity was apparent at the low-pollution sites. The pH at the sites of all three pollution types showed that the transition season was higher than the dry and rainy season. The concentrations of TDS and Fe did not show significant regularity for the three types of polluted sites.
3.4. Correlations between the Water Quality Variables
Figure 3a–c shows the correlation matrixes of the 14 variables in each of the three seasons. A significant negative correlation (−0.40) between pH and HCO3− occurred in the dry season, and also between pH and TDS, TH, Ca2+, Cl−, SO42−, NO3− and HCO3− (r-values ranging from −0.39 to −0.78) in both the rainy season and transition season. The stronger correlation between pH and other indicators found for the rainy and transition seasons are mainly due to the massive amount of rainwater that permeates into the aquifer, as this would have promoted water–rock interactions, raising the concentration of ions and lowering the pH of the groundwater.
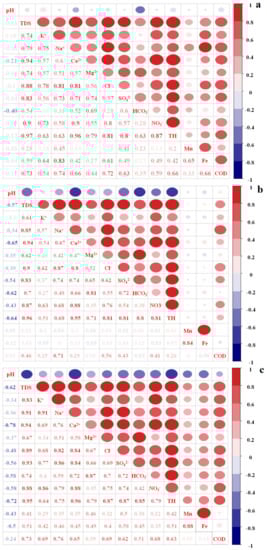
Figure 3.
Pearson’s correlation matrix of physicochemical and hydrochemical parameters of groundwater samples in the dry season (a), transition season (b) and rainy season (c).
Positive and relatively strong correlations were found among TDS, K+, Na+, Ca2+, Mg2+, Cl−, SO42−, NO3−, HCO3− and TH in the dry season (r-values: 0.54–0.97), rainy season (r-values: 0.61–0.96), and transition season (r-values: 0.67–0.95). These high correlations implied that groundwater chemistry was mainly controlled by these ions that came from common sources. Cl−, SO42− and NO3− are important indicators of the impact of human activities upon groundwater quality [28]. Therefore, the groundwater quality in the study region has clearly been affected by human activities.
The presence of Fe in groundwater possibly represents metal pollution derived from industrial effluents [29]. Positive and relatively strong correlations were found between Fe and Mn (r-values: 0.65–0.88) in the three seasons, which indicates they shared a common source of pollution.
3.5. Identifying the Main Groundwater Pollution Sources via PCA
PCA with varimax rotation explained 79.69%, 83.12% and 79.68% of the total variance in the dry season, transition season and rainy season, respectively (Table 3). For the dry season, factor I explains 57.80% of the total variance and includes a strong positive loading of TDS, TH, NO3−, Ca2+ and Cl− and a moderate positive loading of K+, SO42−, Na+, Mg2+ and COD.
Table 3.
Loadings of 14 selected variables on VARIMAX rotated factors of the three seasons.
Nitrate contamination in groundwater is attributed to anthropogenic activities including municipal wastewater discharge, agricultural runoff with a significant amount of chemical fertilizer and atmospheric deposition [30,31]. In this study region, the higher NO3− concentration (the mean value is 121.90 mg/L) in groundwater possibly comes mainly from domestic wastewater [17]. Indeed, during the study period, we found that the villages and towns in the upstream of the Hutuo River area did not construct a network of sewage pipes, and large volumes of domestic sewage were drained directly into nearby rivers and ditches without treatment; this domestic sewage inevitably infiltrates into groundwater. In addition, in the dry season, agricultural chemical fertilizers are not a main pollution source of nitrate in groundwater due to the lack of the driving force of rainfall runoff. Therefore, it is difficult for fertilizer to seep into the groundwater.
Chloride may originate from domestic sewage, chemical fertilizers, manure, road salt and the natural dissolution of minerals [32,33]. In the study area, the chemical fertilizers and road salt were possibly not the main pollution sources of Cl−. In this region, chlorine fertilizer was rarely applied and road salts was primary used in urban areas; after the snow melts on the road, it flows directly into the urban sewage treatment plant through the city’s sewage network. Thus, the two do not have a direct impact on groundwater in the Hutuo River basin. Therefore, Cl− most likely comes from domestic wastewater in the region.
In addition, the higher concentration of TH, Ca2+, K+, SO42−, Na+ and Mg2+ may be related to the a large discharge of domestic sewage [33]. Due to the untreated discharge of domestic sewage, a large amount of K+ and Na+ ions enters the soil layer along with the liquid medium, thereby displacing Ca2+ and Mg2+ ions into the groundwater [19]. Accompanied by cationic exchange, the ions of K+ and Na+ are adsorbed onto the aquifer and the ions of Ca2+ and Mg2+ are desorbed into groundwater. Thus, the domestic sewage input to the aquifer leads to an increase in Ca2+, Mg2+ and TH in the groundwater. Therefore, PC1 is considered to denote to the domestic sewage.
Factor 2, which describes 11.33% of the total variance, has a high positive loading for Fe and Mn. Fe and Mn could be a response to a dominant reduction in the conditions in the aquifer [13]. In addition, the higher concentration of Fe and Mn in the water environment may originate from industrial effluents [34]. Indeed, there are steel processing plants in the upper areas of the region (located in Pingshan county). Many samples of groundwater in the upper areas of the region such as G1 (1.165 mg/L), G3 (0.577 mg/L), G6 (2.308 mg/L) and G7 (0.369 mg/L) had high concentrations of Fe in the dry season (Figure 1). In this study area, the aquifer system had an oxidizing environment (the average concentration of dissolved oxygen in groundwater in the three season was 6.82 mg/L). Therefore, PC2 refers to industrial sewage pollution.
Factor 3, which describes 10.56% of the total variance, has a strong positive loading for HCO3− and a strong negative loading for pH, and weak positive loadings on Mg2+, Ca2+ and TH. In these regions, the higher concentration of HCO3−, Mg2+ and Ca2+ in groundwater is in relation with cation exchange and water–rock interaction [1,13]. The intensive cation exchange occurring in the Hutuo River area influences groundwater HCO3−, Mg2+ and Ca2+ concentration. In recent years, the groundwater table has dropped rapidly along with the rapid development of industry and agriculture, added to the thickness of the vadose zone and enhanced the cation exchange process. This causes an increased in the concentration of HCO3−, Mg2+ and Ca2+ in groundwater. Therefore, PC3 is considered to denote water–rock interactions.
For the wet season, factor I explains 65.31% of the total variance and includes a strong negative loading of pH and a strong positive loading of Ca2+, NO3− and TH, and a moderate positive loading of HCO3−, Mg2+, TDS, Cl− and SO42−, likely representing the domestic sewage and water–rock interactions. Factor 2, which describes 10.00% of the total variance, has a high positive loading for COD and K+ and a moderate positive loading for TDS, Na+, Cl−, SO42−, Ca2+ and TH. The higher concentration of COD in groundwater is in relation to the non-point pollution. Young et al. (2011) [35] found that the COD is dominant pollutants from the urban highways. Zhang et al. (2013) [36] also found that the concentrations of COD on asphalt roads were 3–5 times higher than on concrete roads. In the research region, road materials in urban and rural areas are mainly asphalt. Thus, we assume that the higher concentration of COD in the groundwater may be the result of nonpoint pollution. In addition, the higher concentrations of K+, TDS, Na+, Cl−, SO42−, Ca2+ and TH may be related to nonpoint pollution. Rainfall runoff carries a large amount of ions that were deposited on the road and leaches into the groundwater, and the ion exchange ability was also increases during the runoff infiltration process, which in turn increases the concentration of these ions. Therefore, PC2 is considered to denote “nonpoint pollution sources”. Factor 3, which describes 7.80% of the total variance, has a high positive loading for Mn and Fe, likely representing industrial sewage pollution.
The pollution pattern in the transition season was similar to that in the wet season. Factor I explains 54.64% of the total variance and includes a strong positive loading of TH, HCO3−, Ca2+, NO3−, TDS, SO42− and Mg2+, a strong negative loading of pH and a moderate positive loading of Na+ and Cl−, likely representing domestic sewage and water–rock interactions. Factor 2, which describes 13.32% of the total variance, has a high positive loading for COD and K+ and has a moderate positive loading for Cl−, Na+ and TDS. Thus, PC2 is considered to denote “nonpoint pollution sources”. Factor 3, which describes 11.72% of the total variance, has a high positive loading for Mn and Fe, likely representing industrial sewage pollution.
3.6. Source Apportionment Using APCS-MLR
After identifying the pollution sources, the contributions of each source to each water quality variable were calculated using APCS-MLR. As shown in Table 4, most water quality parameters in the dry season were mainly influenced by domestic sewage (60.84% of TDS, 34.33% of K+, 57.98% of Na+, 50.62% of Ca2+, 41.66% of Mg2+, 54.09% of Cl−, 55.20% of NO3−, 41.32% of SO42−, 41.40% of TH and 71.06% of COD), industrial sewage (36.12% of Mn and 55.59% of Fe) and water–rock interactions (31.08% of pH and 43.64% of HCO3−).
Table 4.
Source contribution (in %) of each variable in three seasons in the Hutuo River alluvial-pluvial fan.
For the wet season, most water quality variables were primarily influenced by domestic sewage and water–rock interactions (26.72% of pH, 68.15% of Ca2+, 79.73% of Mg2+, 59.72% of NO3−, 37.98% of HCO3− and 78.85% of TH), nonpoint pollution (60.02% of TDS, 53.31% of K+, 57.36% of Na+, 44.50% of Cl−, 42.92% of SO42− and 43.05% of COD) and industrial sewage (53.73% of Mn and 52.90% of Fe).
For the transition season, most water quality variables were primarily influenced by domestic sewage and water–rock interactions (61.11% of pH, 46.97% of TDS, 63.19% of Ca2+, 64.54% of Mg2+, 55.57% of NO3−, 62.51% of SO42−, 41.16% of HCO3− and 41.72% of TH), nonpoint pollution (32.60% of K+, 55.00% of Na+, 45.62% of Cl− and 57.09% of COD) and industrial sewage (38.71% of Mn and 39.56% of Fe).
Based on all of the above discussion, the major source was domestic sewage in the three seasons in the Hutuo River alluvial-pluvial fan area. As shown in Table 4, the contribution of unidentified sources to pollution in the Hutuo River alluvial-pluvial fan area for all water quality variables ranged from 0.41% to 68.92% for the dry season, from 9.47% to 73.28% for the wet season, and from 11.88% to 61.29% for the transition season. The contribution ratio of the unidentified sources to groundwater quality parameters was higher than the river [27,37,38], which may be due to the fact that the sources of groundwater pollution are varied and complex, and that the statistical technology has certain limitations. Therefore, field surveys are important to further identify the pollution sources.
4. Conclusions
In this study, the water quality index and multivariate statistical techniques (PCA and APCS-MLR) were applied to assess the spatial and temporal variation in groundwater quality and to trace the pollution sources in different seasons in the Hutuo River alluvial-pluvial fan, using three field sampling data sets. Results showed that the mean concentration of groundwater NO3−, SO42− and TH were 121.90 mg/L, 181.82 mg/L and 600.32 mg/L, respectively; 53.09% of NO3−, 18.52% of SO42− and 83.95% of the TH samples exceeded the Grade III standard for groundwater quality in China (GB/T 14848-2017). This indicated that the groundwater quality was seriously affected by human activity in the Hutuo River alluvial-pluvial fan region.
We used WQI to assess groundwater quality. The results showed that the calculated WQI ranged from 29.3 to 233.6 and that the maximum value of the WQI was in the dry season and the minimum value was in the rainy season. The groundwater quality in the transition season and rainy season was better than in the dry season due to the rain having diluted the pollutants in the groundwater.
The spatial variations of groundwater quality showed that the concentration of TDS, Cl−, TH and NO3− are the highest in the high-polluted sites, followed by the medium-polluted sites and the low-polluted sites; however, the pH and Fe concentration shows no significant changes between the three pollution types. The temporal variations of groundwater quality were controlled by the rainwater dilution and showed that the temporal variation patterns’ parameters were not consistent in different season.
PCA results show that the primary sources of groundwater pollution were domestic sewage, industrial sewage and water–rock interactions in the dry season. However, in the rainy and transition seasons, nonpoint pollution has an important effect on groundwater quality, and the main pollution sources changed to domestic sewage and water–rock interactions, as well as nonpoint pollution and industrial sewage. Based on the APCS-MLR, we found that most water quality parameters were primarily influenced by domestic sewage. Therefore, in order to prevent the continuous deterioration of groundwater quality it is necessary to control the discharge of domestic sewage in the Hutuo River alluvial-pluvial fan region.
Supplementary Materials
The following are available online at https://www.mdpi.com/1660-4601/17/3/1055/s1, Figure S1: Temporal variations of rainfall during 2015–2017; Table S1: Relative weight of physicochemical parameters and water quality standard; Table S2: Water quality classification ranges and types of water based on WQI values.
Author Contributions
Conceptualization, Q.Z. and X.Z.; methodology, Q.Z.; software, L.W. (Long Wang); validation, H.W. and X.Z.; formal analysis, Q.Z.; investigation, L.W. (Long Wang) and L.W. (Lijun Wang); resources, X.Z.; data curation, L.W. (Long Wang); writing—original draft preparation, Q.Z.; writing—review and editing, Q.Z.; visualization, H.W.; supervision, X.Z. and L.W. (Long Wang); project administration, X.Z.; funding acquisition, X.Z. All authors have read and agreed to the published version of the manuscript.
Funding
This research was funded by the projects of China Geological Survey, grant number DD20189112, the open funds of the State Key Laboratory of Urban and Regional Ecology of China, grant number SKLURE2019-2-3, and the National Natural Science Foundation of China 41401593 and 41602271.
Acknowledgments
The authors gratefully acknowledge the editor and anonymous reviewers for their valuable comments on this manuscript. The authors also appreciate the financial support from the different organizations.
Conflicts of Interest
The authors declare no conflict of interest.
References
- Qin, R.; Wu, Y.; Xu, Z.; Xie, D.; Zhang, C. Assessing the impact of natural and anthropogenic activities on groundwater quality in coastal alluvial aquifers of the lower Liaohe River Plain, NE China. Appl. Geochem. 2013, 31, 142–158. [Google Scholar] [CrossRef]
- Golchin, I.; Moghaddam, M.A. Hydro-geochemical characteristics and groundwater quality assessment in Iranshahr plain aquifer, Iran. Environ. Earth Sci. 2016, 75, 317. [Google Scholar] [CrossRef]
- Lapworth, D.J.; Krishan, G.; Macdonald, A.M.; Rao, M.S. Groundwater quality in the alluvial aquifer system of northwest India: New evidence of the extent of anthropogenic and geogenic contamination. Sci. Total Environ. 2017, 599–600, 1433–1444. [Google Scholar] [CrossRef] [PubMed]
- Zhang, Q.; Wang, H.; Wang, Y.; Yang, M.; Zhu, L. Groundwater quality assessment and pollution source apportionment in an intensely exploited region of northern China. Environ. Sci. Pollut. Res. 2017, 24, 16639–16650. [Google Scholar] [CrossRef]
- Gu, H.; Chi, B.; Li, H.; Jiang, J.; Qin, W.; He, W. Assessment of groundwater quality and identification of contaminant sources of Liujiang basin in Qinhuangdao, North China. Environ. Earth Sci. 2015, 73, 6477–6493. [Google Scholar] [CrossRef]
- Huang, G.; Sun, J.; Zhang, Y.; Chen, Z.; Liu, F. Impact of anthropogenic and natural processes on the evolution of groundwater chemistry in a rapidly urbanized coastal area, South China. Sci. Total Environ. 2013, 463, 209–221. [Google Scholar] [CrossRef]
- Herojeet, R.; Rishi, M.S.; Lata, R.; Sharma, R. Application of environmetrics statistical models and water quality index for groundwater quality characterization of alluvial aquifer of Nalagarh Valley, Himachal Pradesh, India. Sustain. Water Resour. Manag. 2016, 2, 39–53. [Google Scholar] [CrossRef]
- Hakan, A. Application of multivariate statistical techniques in the assessment of groundwater quality in seawater intrusion area in Bafra Plain, Turkey. Environ. Monit. Assess. 2013, 185, 2439. [Google Scholar]
- Zhang, B.; Song, X.; Zhang, Y.; Han, D.; Tang, C.; Yu, Y.; Ma, Y. Hydrogeochemical characteristics and water quality assessment of surface water and groundwater in Songnen plain, Northeast China. Water Res. 2012, 46, 2737–2748. [Google Scholar] [CrossRef]
- Pereira, H.G.; Renca, S.; Sataiva, J. A case study on geochemical anomaly identification through principal component analysis supplementary projection. Appl. Geochem. 2003, 18, 37–44. [Google Scholar] [CrossRef]
- Gholizadeh, M.H.; Melesse, A.M.; Reddi, L. Water quality assessment and apportionment of pollution sources using APCS-MLR and PMF receptor modeling techniques in three major rivers of South Florida. Sci. Total Environ. 2016, 566–567, 1552–1567. [Google Scholar] [CrossRef]
- Busico, G.; Cuoco, E.; Kazakis, N.; Colombani, N.; Mastrocicco, M.; Tedesco, D.; Voudouris, K. Multivariate statistical analysis to characterize/discriminate between anthropogenic and geogenic trace elements occurrence in the Campania plain, Southern Italy. Environ. Pollut. 2018, 234, 260–269. [Google Scholar] [CrossRef] [PubMed]
- Kim, K.; Yun, S.; Choi, B.; Chae, G.; Joo, Y.; Kim, K.; Kim, H. Hydrochemical and multivariate statistical interpretations of spatial controls of nitrate concentrations in a shallow alluvial aquifer around oxbow lakes (Osong area, central Korea). J. Cont. Hydrol. 2009, 107, 114–127. [Google Scholar] [CrossRef] [PubMed]
- Boateng, T.K.; Opoku, F.; Acquaah, S.O.; Akoto, O. Groundwater quality assessment using statistical approach and water quality index in Ejisu-Juaben Municipality, Ghana. Environ. Earth Sci. 2016, 75, 489. [Google Scholar] [CrossRef]
- Rao, N.S. Spatial control of groundwater contamination, using principal component analysis. J. Earth Syst. Sci. 2014, 123, 715–728. [Google Scholar] [CrossRef]
- Zhang, Q.; Wang, H.; Wang, L. Tracing nitrate pollution sources and transformations in the over-exploited groundwater region of North China using stable isotopes. J. Contam. Hydrol. 2018, 218, 1–9. [Google Scholar] [CrossRef] [PubMed]
- Li, Y.; Zhang, Z.; Fei, Y.; Chen, H.; Qian, Y.; Yu, D. Investigation of quality and pollution characteristics of groundwater in the Hutuo River Alluvial Plain, North China. Plain. Environ. Earth Sci. 2016, 75, 1–10. [Google Scholar] [CrossRef]
- Foster, S.; Garduno, H.; Evans, R.; Olson, D.; Tian, Y.; Zhang, W.; Han, Z. Quaternary aquifer of the north china plain—assessing and achieving groundwater resource sustainability. Hydrogeol. J. 2004, 12, 81–93. [Google Scholar] [CrossRef]
- Zhang, Q.; Miao, L.; Wang, H.; Hou, J.; Li, Y. How Rapid Urbanization Drives Deteriorating Groundwater Quality in a Provincial Capital of China. Pol. J. Environ. Stud. 2020, 29, 441–450. [Google Scholar] [CrossRef]
- Ministry of Natural Resources of the People’s Republic of China. Standard for Groundwater Quality, (GB/T 14848-2017); General Administration of Quality Supervision, Inspection and Quarantine of the People’s Republic of China: Beijing, China, 2017. (In Chinese)
- Kai, Y.U.; Hao, A.; Duo, L.I.; Liu, Z. Distribution of groundwater salt pollution and pollution mechanism in Shijiazhuang. Earth Sci. Front. 2001, 8, 151–154. [Google Scholar]
- Helena, B.; Pardo, R.; Vega, M.; Barrado, E.; Fernandez, J.M.; Fernandez, L. Temporal evolution of groundwater composition in an alluvial aquifer (Pisuerga River, Spain) by principal component analysis. Water Res. 2000, 34, 807–816. [Google Scholar] [CrossRef]
- Kaiser, H.F. The varimax criterion for analytic rotation in factor analysis. Psychometrika 1958, 23, 187–200. [Google Scholar] [CrossRef]
- Su, S.; Zhi, J.; Lou, L.; Fang, H.; Xia, C.; Wu, J. Spatio-temporal patterns and source apportionment of pollution in Qiantang River (China) using neural-based modeling and multivariate statistical techniques. Phys. Chem. Earth 2011, 36, 379–386. [Google Scholar] [CrossRef]
- Avvannavar, S.M.; Shrihari, S. Evaluation of water quality index for drinking purposes for river Netravathi, Mangalore, South India. Environ. Monit. Assess. 2008, 143, 279–290. [Google Scholar] [CrossRef] [PubMed]
- Lumb, A.; Sharma, T.C.; Bibeault, J.F. A review of genesis and evolution of water quality index (WQI) and some future directions. Water Qual. Expo. Health 2011, 3, 11–24. [Google Scholar] [CrossRef]
- World Health Organization. Guidelines for Drinking-Water Quality, 4th ed.; World Health Organization: Geneva, Switzerland, 2011. [Google Scholar]
- Del Campo, M.M.; Esteller, M.V.; Expósito, J.L.; Hirata, R. Impacts of urbanization on groundwater hydrodynamics and hydrochemistry of the Toluca Valley aquifer (Mexico). Environ. Monit. Assess. 2014, 186, 2979–2999. [Google Scholar] [CrossRef] [PubMed]
- Juahir, H.; Zain, S.M.; Yusoff, M.K.; Hanidza, T.I.T.; Armi, A.S.M.; Toriman, M.E.; Mokhtar, M. Spatial water quality assessment of Langat River Basin (Malaysia) using environmetric techniques. Environ. Monit. Assess. 2011, 173, 625–641. [Google Scholar] [CrossRef]
- Bordeleau, G.; Savard, M.M.; Martel, R.; Ampleman, G.; Thiboutot, S. Determination of the origin of groundwater nitrate at an air weapons range using the dual isotope approach. J. Contam. Hydrol. 2008, 98, 97–105. [Google Scholar] [CrossRef]
- Xue, D.; Botte, J.; Baets, B.D.; Accoe, F.; Nestler, A.; Taylor, P. Present limitations and future prospects of stable isotope methods for nitrate source identification in surface- and groundwater. Water Res. 2009, 43, 1159–1170. [Google Scholar] [CrossRef]
- Jiang, Y.; Wu, Y.; Groves, C.; Yuan, D.; Kambesis, P. Natural and anthropogenic factors affecting the groundwater quality in the Nandong karst underground river system in Yunan, China. J. Contam. Hydrol. 2009, 109, 49–61. [Google Scholar] [CrossRef]
- Jin, Z.; Xue, Q.; Chen, L.; Jin, M.; Li, F. Using dual isotopes to evaluate sources and transformations of nitrate in the West Lake watershed, eastern China. J. Contam. Hydrol. 2015, 177–178, 64–75. [Google Scholar] [CrossRef] [PubMed]
- Bu, H.; Tan, X.; Li, S.; Zhang, Q. Temporal and spatial variations of water quality in the Jinshui River of the South Qinling Mts.; China. Ecotoxicol. Environ. Saf. 2010, 73, 907–913. [Google Scholar] [CrossRef] [PubMed]
- Young, L.J.; Hyoungjun, K.; Youngjin, K.; Han, M.Y. Characteristics of the event mean concentration (EMC) from rainfall runoff on an urban highway. Environ. Pollut. 2011, 159, 884–888. [Google Scholar]
- Zhang, Q.; Wang, X.; Hou, P.; Wan, W.; Ren, Y.; Ouyang, Z.; Yang, L. The temporal changes in road stormwater runoff quality and the implications to first flush control in Chongqing, China. Environ. Monit. Assess. 2013, 185, 9763–9775. [Google Scholar] [CrossRef]
- Su, S.; Li, D.; Zhang, Q.; Xiao, R.; Huang, F.; Wu, J. Temporal trend and source apportionment of water pollution in different functional zones of Qiantang River, China. Water Res. 2011, 45, 1781–1795. [Google Scholar] [CrossRef]
- Zhou, F.; Huang, G.H.; Guo, H.; Zhang, W.; Hao, Z. Spatio-temporal patterns and source apportionment of coastal water pollution in eastern Hong Kong. Water Res. 2007, 41, 3429–3439. [Google Scholar] [CrossRef]


© 2020 by the authors. Licensee MDPI, Basel, Switzerland. This article is an open access article distributed under the terms and conditions of the Creative Commons Attribution (CC BY) license (http://creativecommons.org/licenses/by/4.0/).