Role of the Built and Online Social Environments on Expression of Dining on Instagram


Abstract
1. Introduction
- (i) What is the relationship between the built environment (measured through types of restaurants in neighborhood) and dining posting behavior by users who post in those neighborhoods? (ii) What is the relationship between the social environment (measured through proportion of a user’s social network in Abu Dhabi that posts about dining) and dining posting behavior by users in Abu Dhabi?
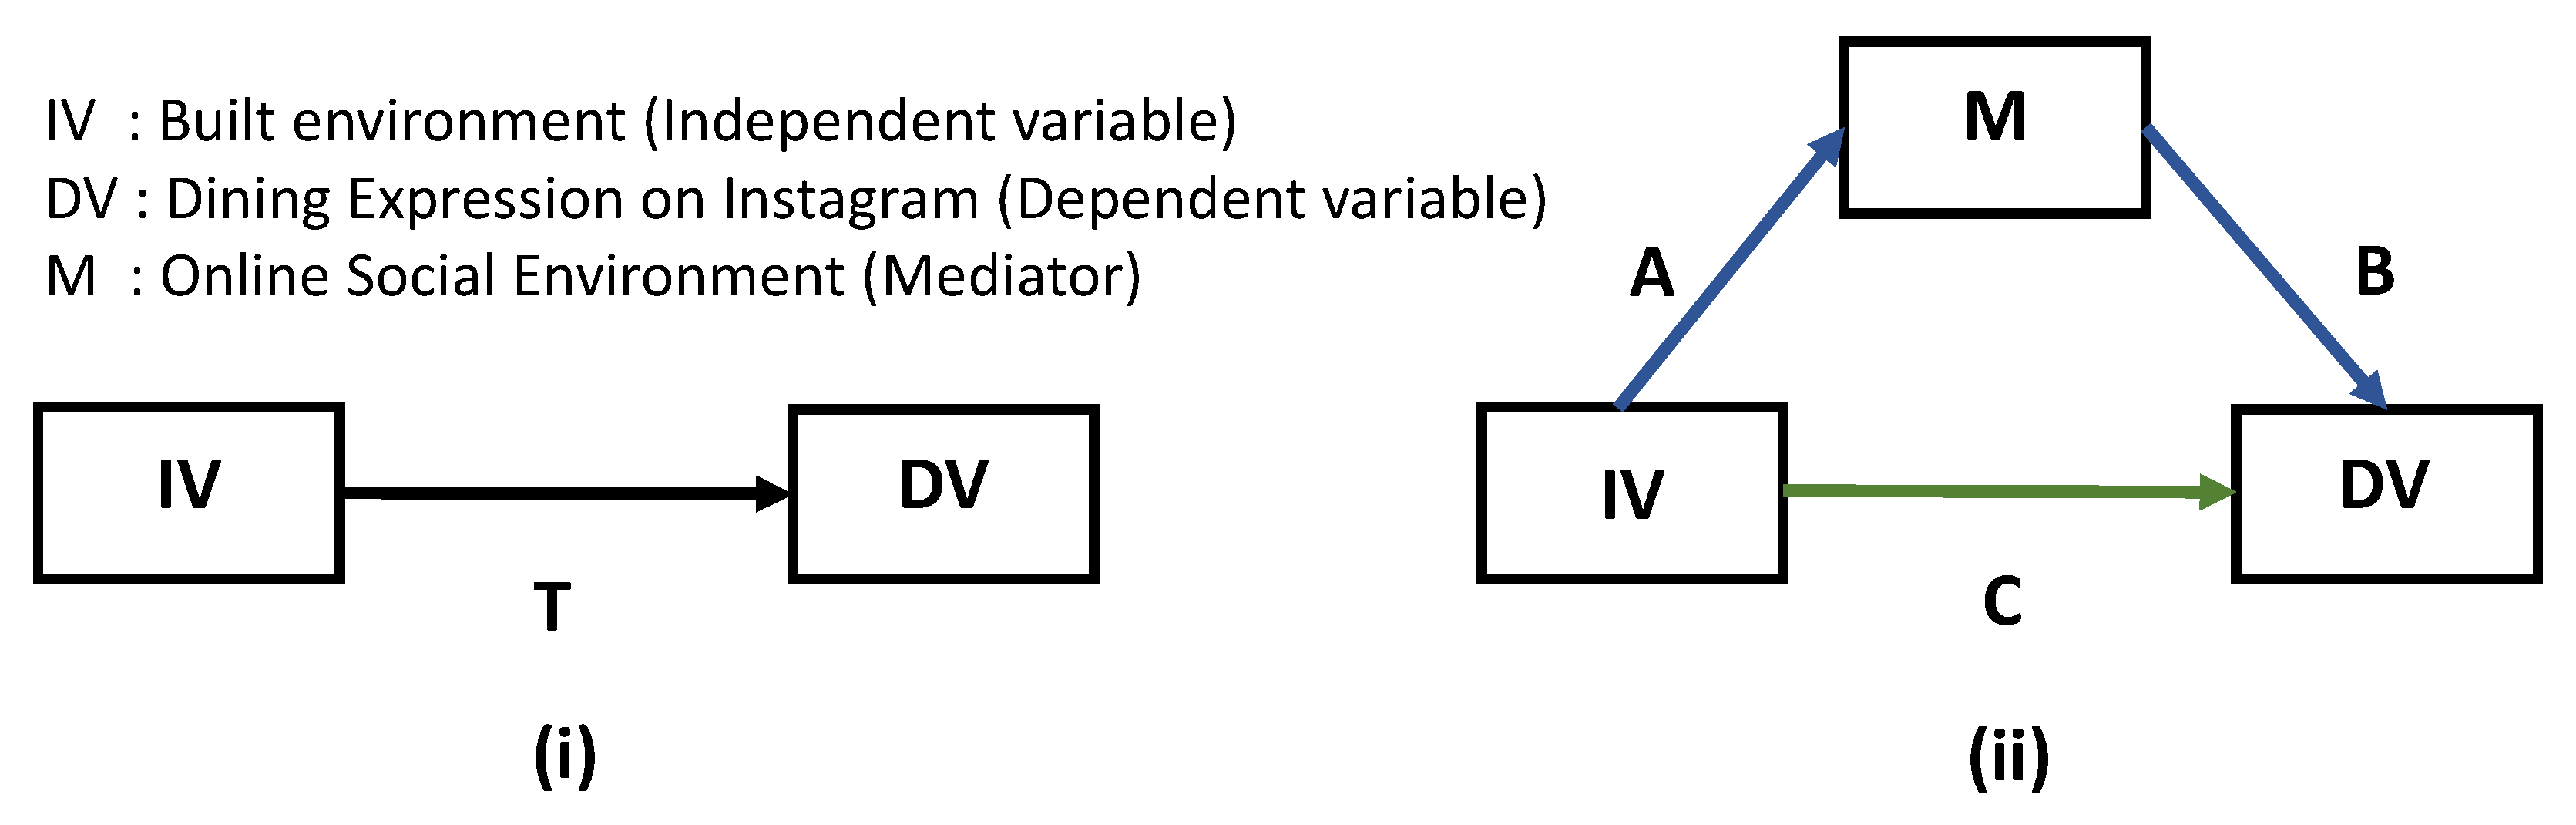
- Does the social environment moderate the relationship between the built environment and proportion of dining posts a user posts?
- Does the social environment mediate the relationship between the built environment and proportion of dining posts a user posts?
2. Methods
2.1. Data Collection
2.1.1. Instagram Data
2.1.2. Sample Selection
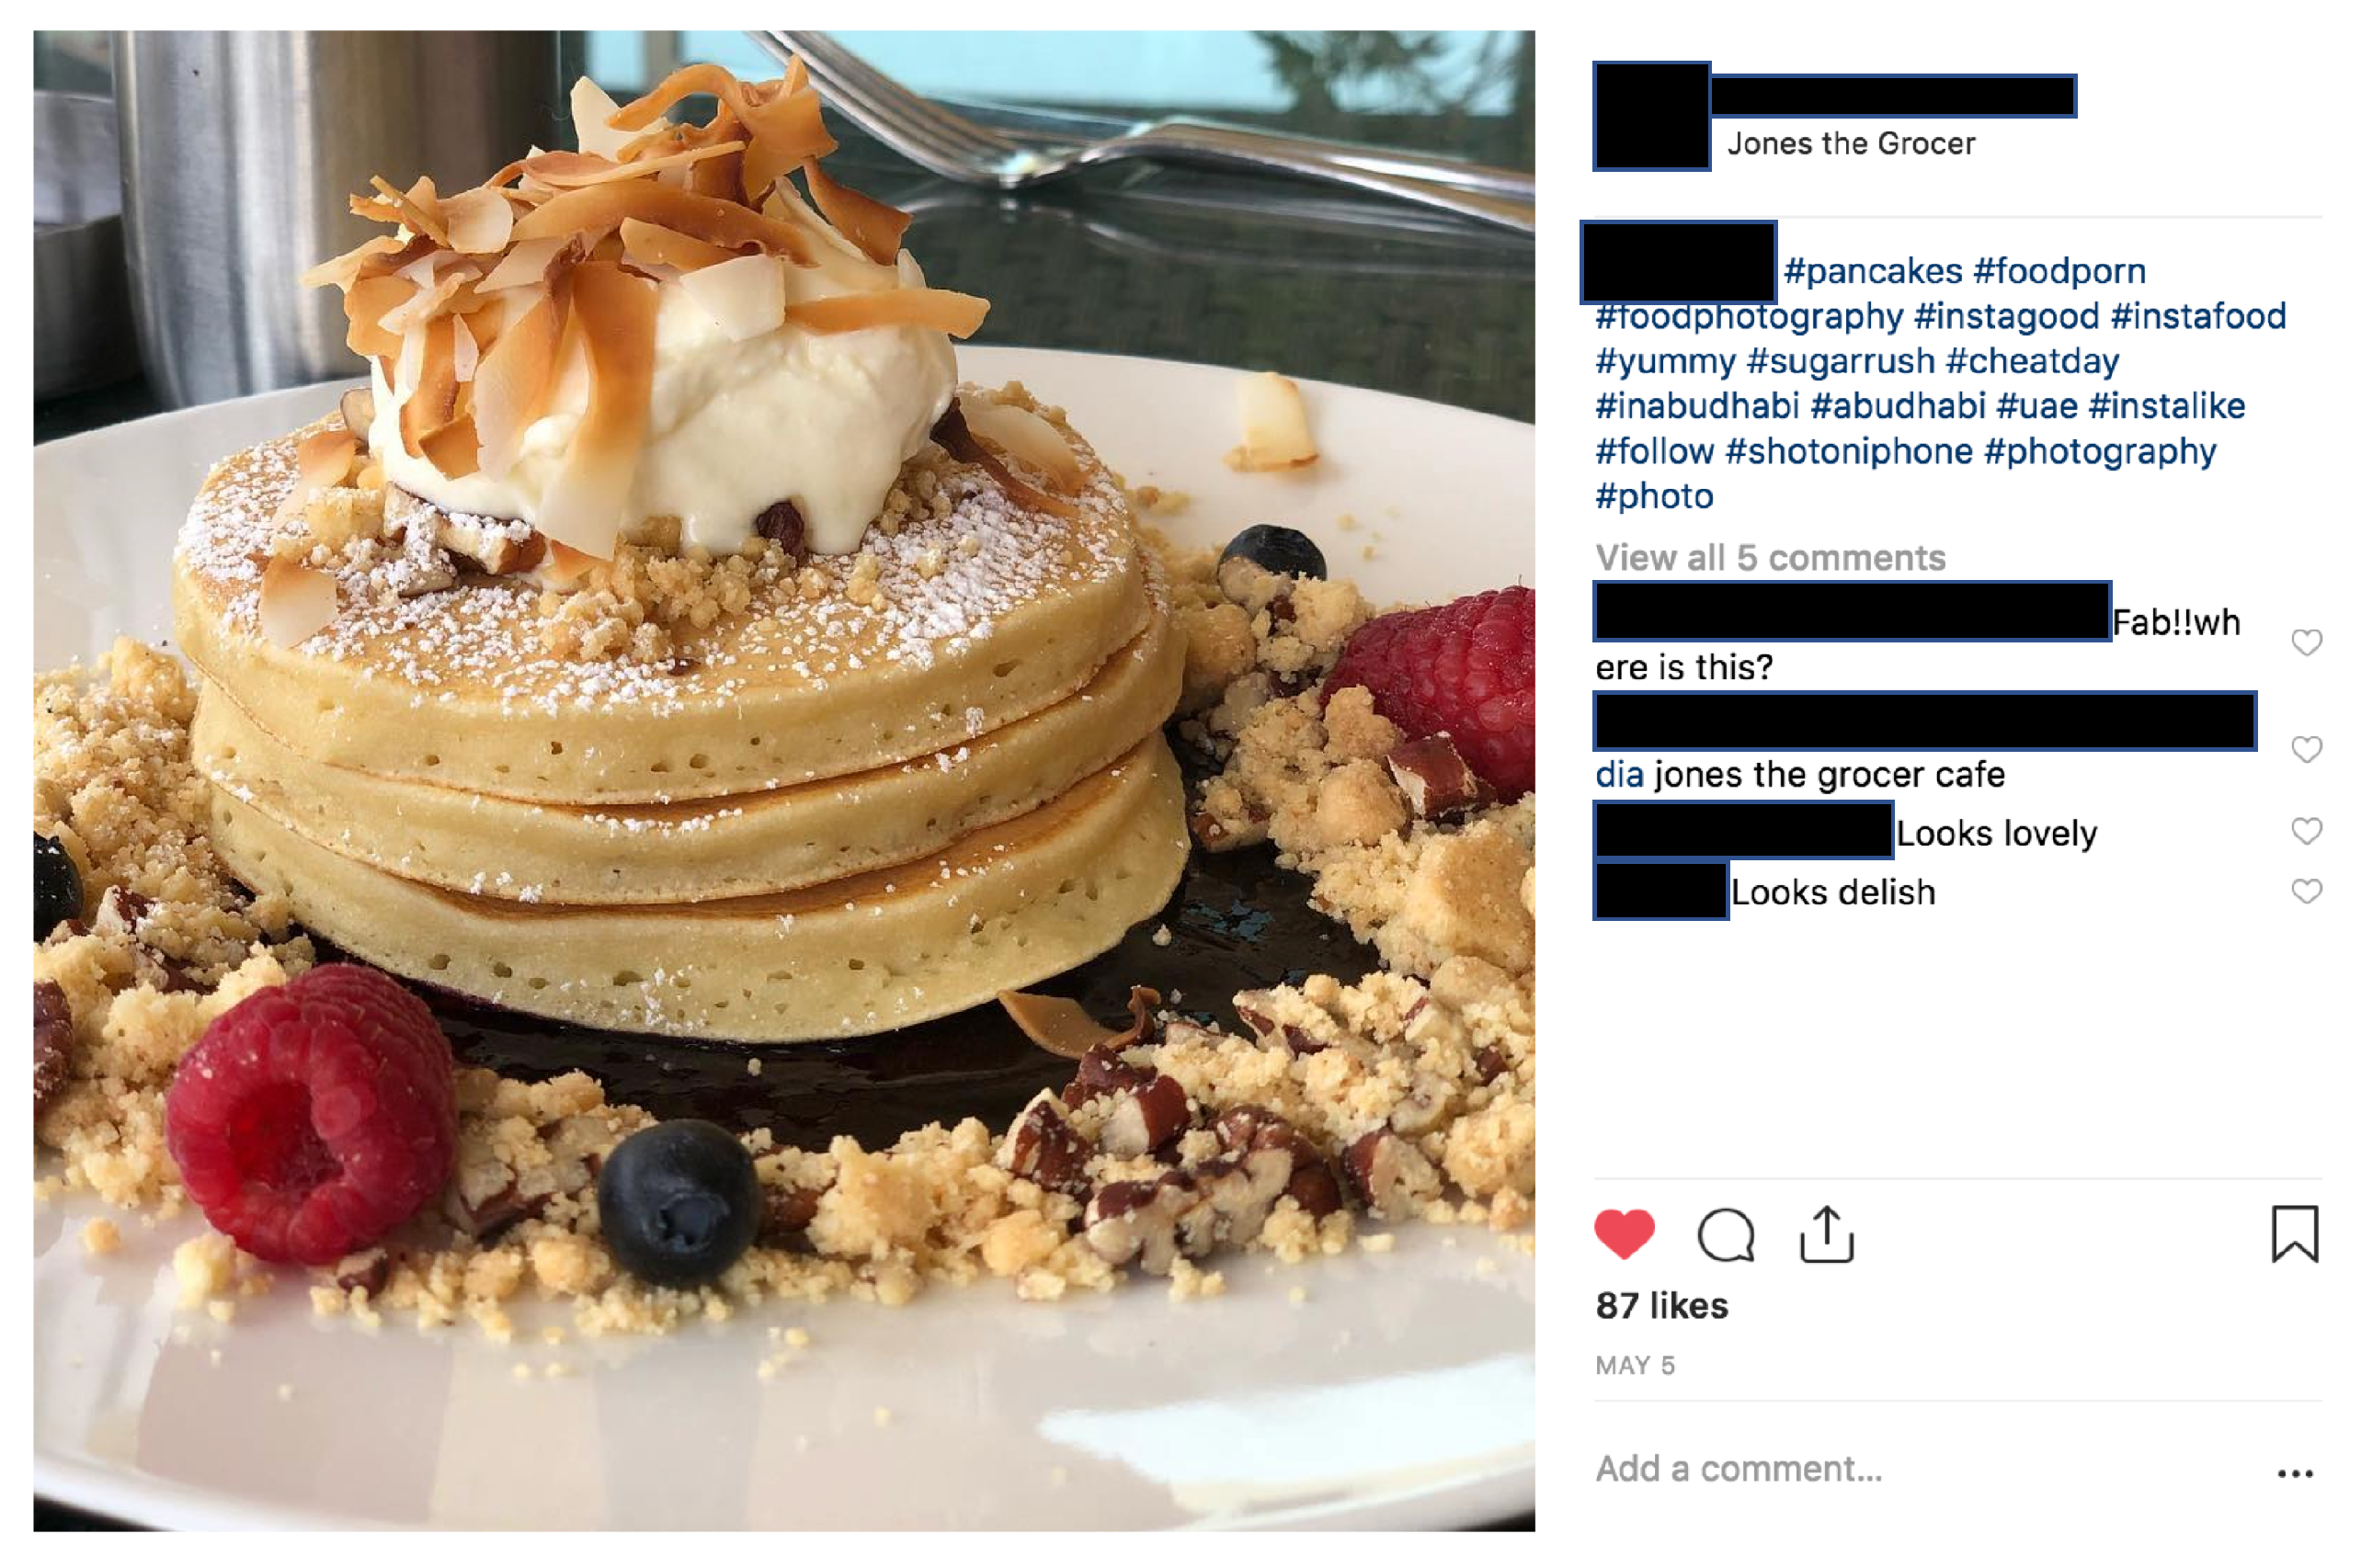
2.1.3. User Dining Posts (Dependent Variables)
2.1.4. Networks (Possible Mediator Variables)
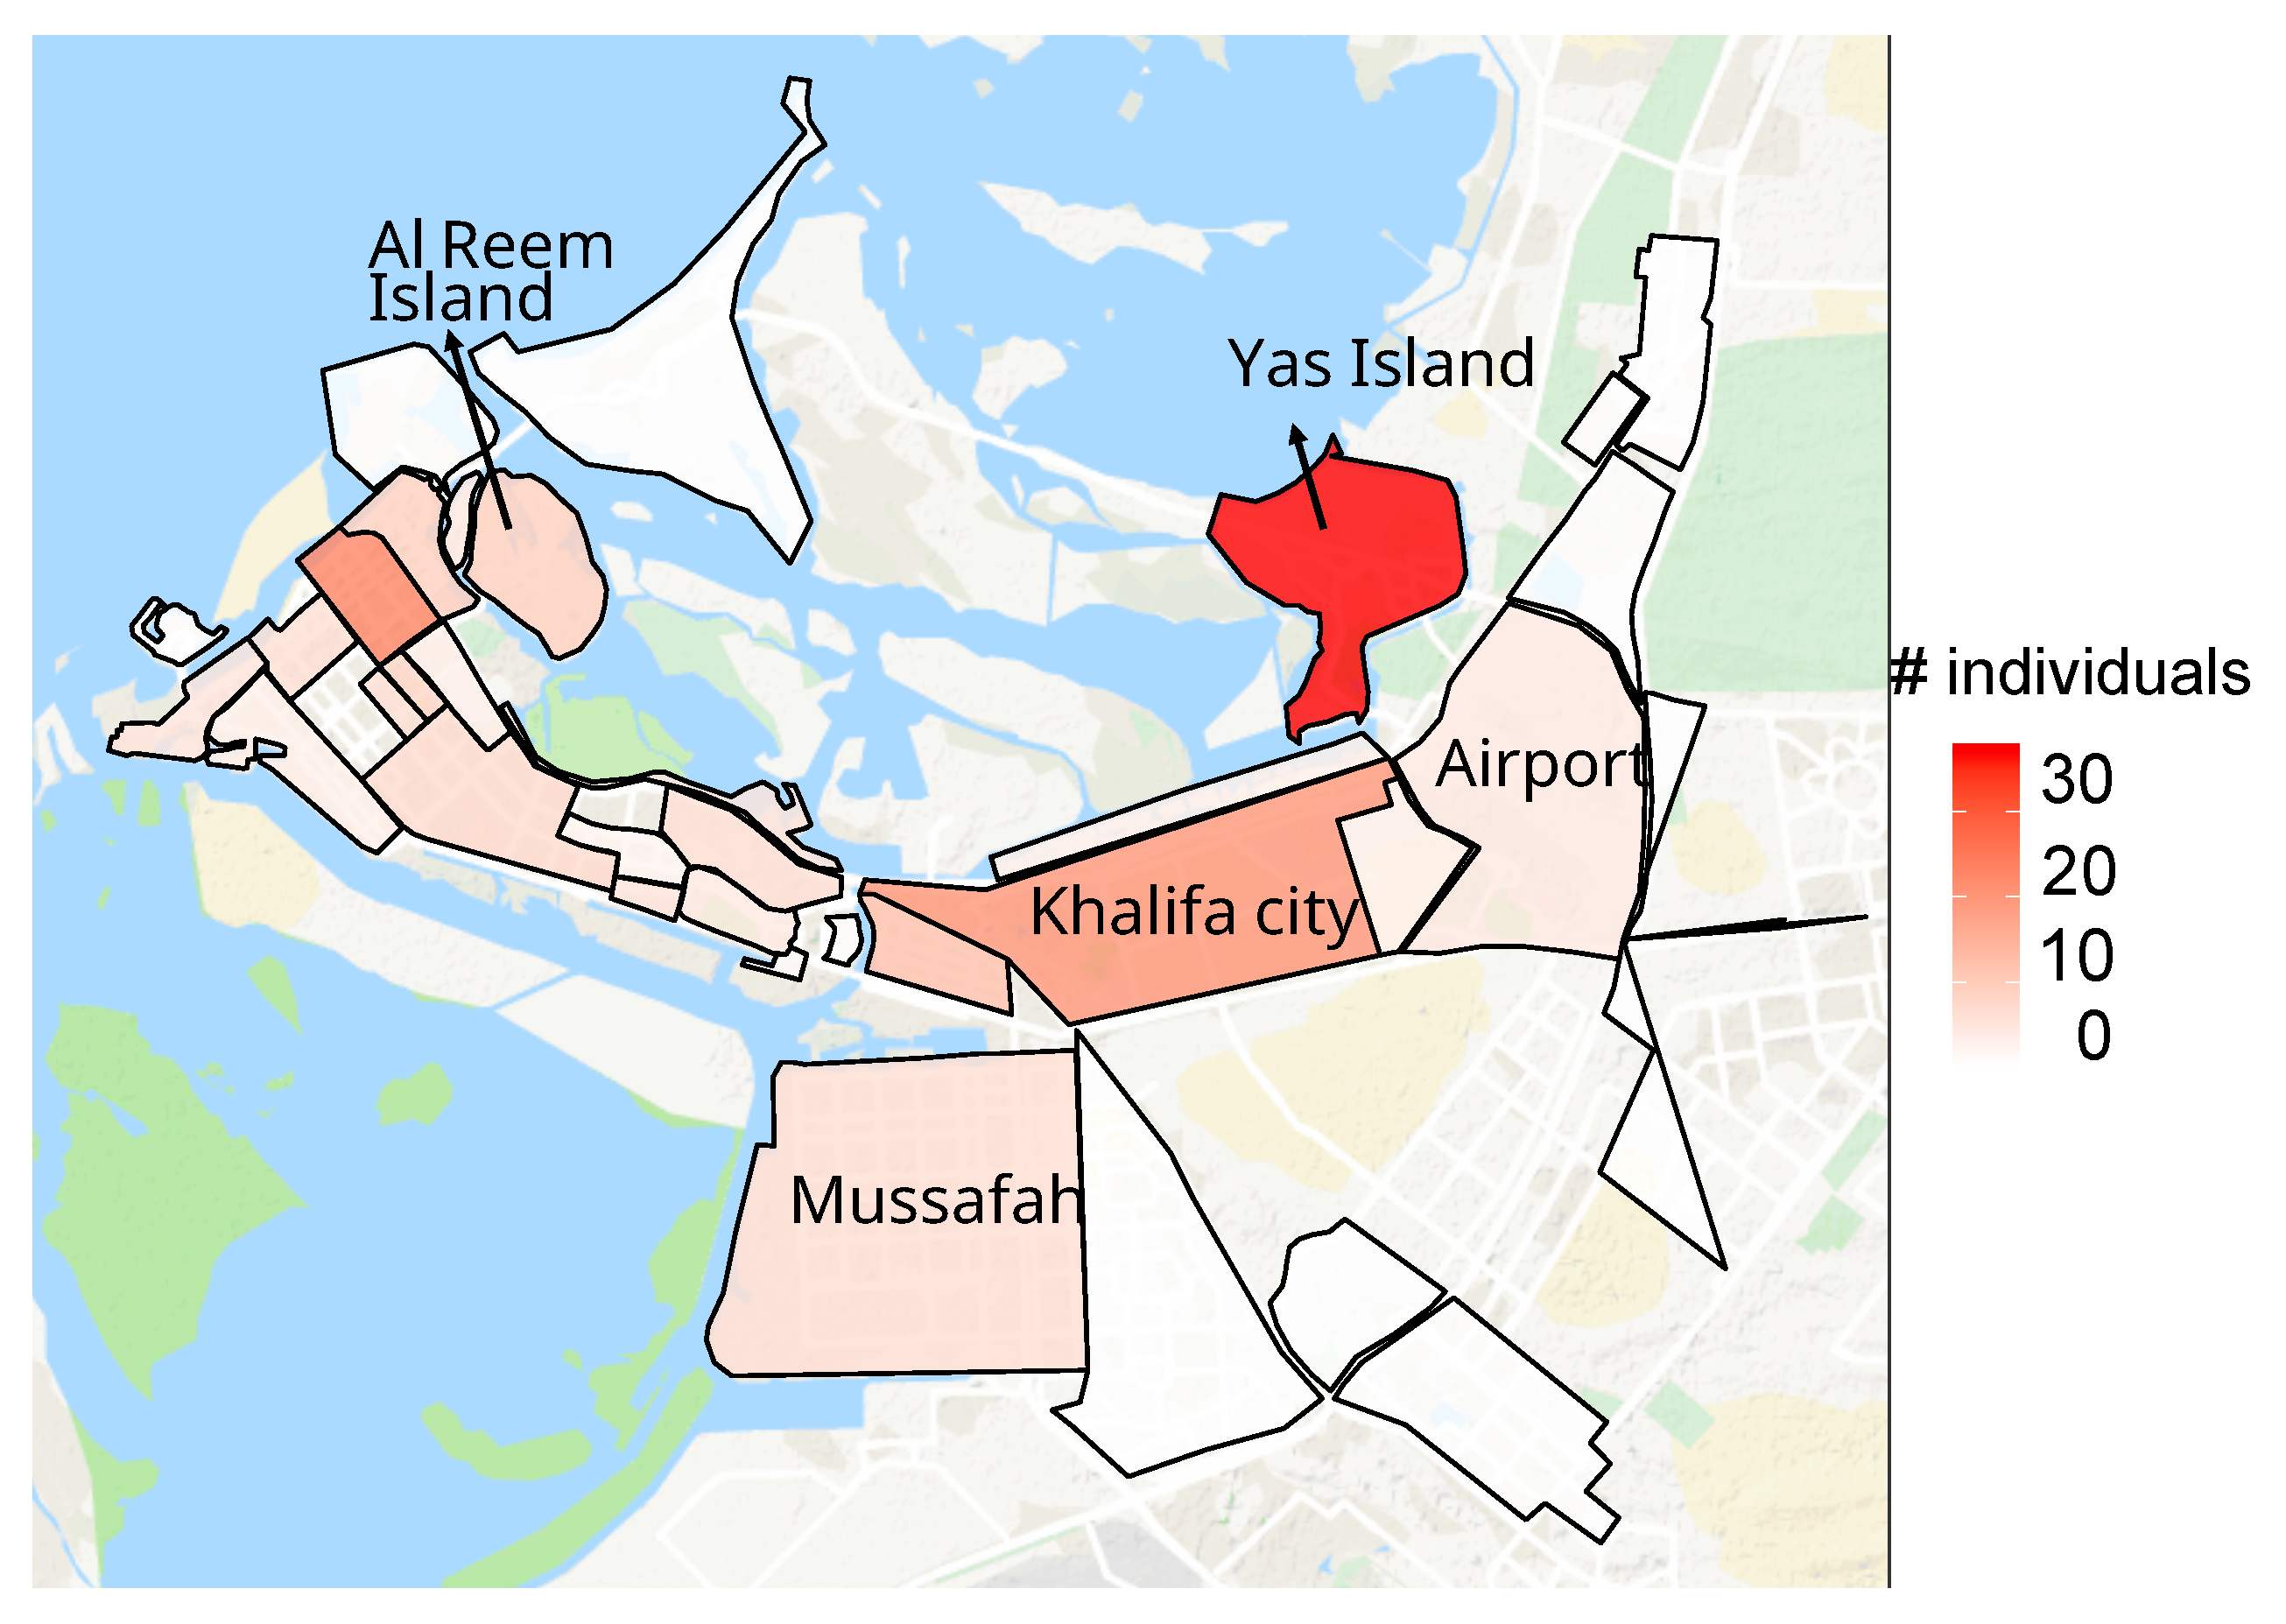
2.1.5. Mapping Posts and Users to Neighborhoods
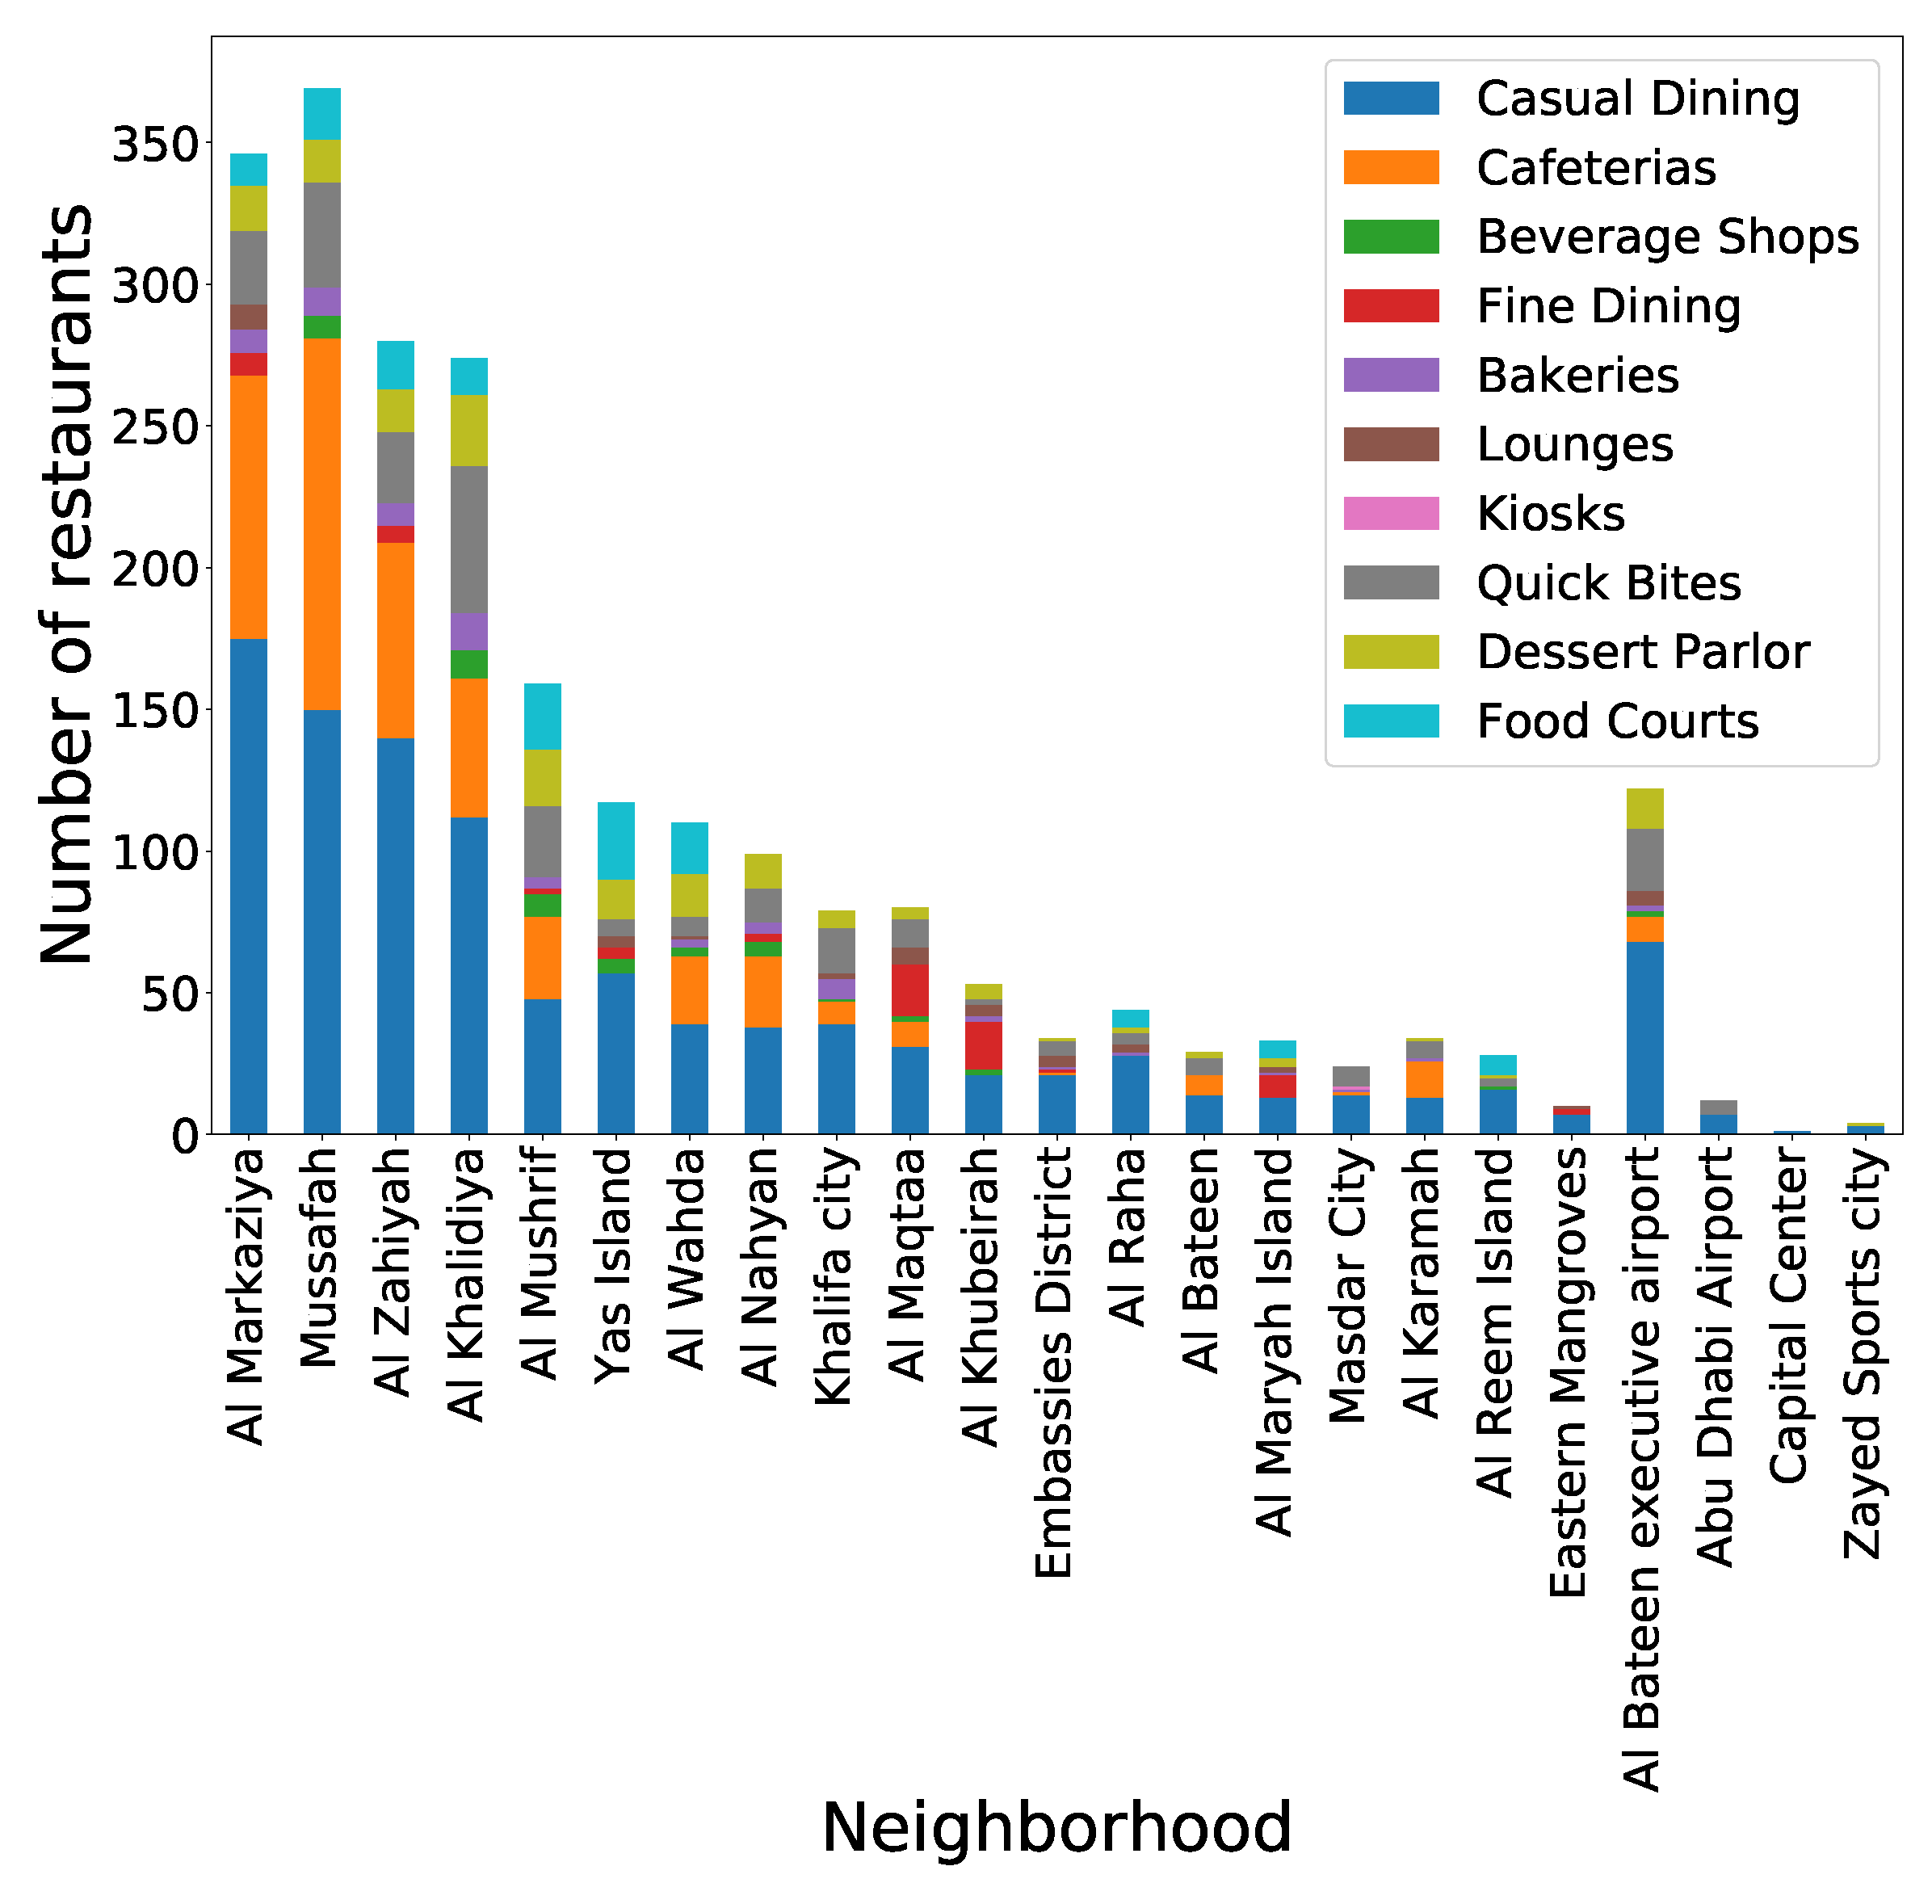
2.1.6. Neighborhood Built Environment (Independent Variables)
2.1.7. Ethics and Privacy
2.2. Analysis Approach
2.2.1. Moderation Analysis
2.2.2. Mediation Analysis
3. Results
3.1. Descriptive Analysis of Posts
3.2. Moderation Analysis Results
3.3. Mediation Analysis Results
3.4. Mediation Results Across Different Times of the Day
4. Conclusions
4.1. Interpretation of Findings
4.2. Limitations
4.3. Future Work
4.4. Importance and Utility of Findings
Author Contributions
Funding
Conflicts of Interest
Appendix A. Filtering Instagram Data
Appendix B. Data Distribution

Appendix C. Network Variables
Appendix D. Detailed Regression Results

| Feature (Number of) | std.err | p | |
|---|---|---|---|
| Intercept | 0.5509 | 0.1356 | 0.0081 ** |
| : | |||
| Casual dining | −0.1823 | 0.0981 | 0.0642 . |
| Cafeterias | 1.8492 | 0.4309 | 0.0852 . |
| Beverage shops | −0.0128 | 0.9191 | 0.0567 . |
| Fine dining | 0.8913 | 0.0109 | 0.0632 . |
| Quick bites | 0.1268 | 0.5171 | 0.1200 |
| Bakeries | −1.0831 | 0.5432 | 0.0924 . |
| Lounges | 0.3421 | 0.0004 | 0.0761 . |
| Kiosks | 0.0942 | 0.4005 | 0.5412 |
| Food courts | 0.2556 | 0.1067 | 0.0616 . |
| M: | |||
| Dining profiles | 0.9481 | 0.4321 | 0.1002 |
| Non dining profiles | 0.0021 | 0.0042 | 0.2021 |
| Personal profiles | 0.0231 | 0.0428 | 0.0600 . |
| Business profiles | 0.0421 | 0.0231 | 0.2009 |
| Gender | 0.0031 | 0.0012 | 0.1200 |
| Feature (Number of) | std.err | p | |
|---|---|---|---|
| Intercept | −0.5454 | 0.2002 | 0.0064 ** |
| : | |||
| Casual dining | −0.0838 | 0.0194 | 0.0017 ** |
| Cafeterias | 0.0992 | 0.0204 | 0.0001 *** |
| Beverage shops | 0.4188 | 0.1054 | 0.0023 ** |
| Fine dining | −0.1358 | 0.0347 | 0.0001 *** |
| Quick bites | −0.0623 | 0.0183 | 0.0006 *** |
| Bakeries | 0.0089 | 0.4562 | 0.4367 |
| Lounges | 0.0010 | 0.5732 | 0.6752 |
| Kiosks | −15.4985 | 0.1431 | 0.9900 |
| Food courts | −7.8610 | 0.1293 | 0.7861 |
| M: | |||
| Dining profiles | 0.3413 | 0.0010 | 0.0011 ** |
| Non dining profiles | −0.0021 | 0.0005 | 0.3210 |
| Personal profiles | 0.0098 | 0.0023 | 0.1287 |
| Business profiles | 0.0023 | 0.0391 | 0.6542 |
| Gender | 0.0053 | 0.0013 | 0.0891 . |
| Feature (Number of) | std.err | p | |
|---|---|---|---|
| Intercept | 0.4736 | 0.1111 | 0.0002 *** |
| : | |||
| Casual dining | −0.5231 | 0.0161 | 0.0011 ** |
| Cafeterias | 0.4772 | 0.0143 | 0.0008 *** |
| Beverage shops | 1.0128 | 0.0491 | 0.0001 *** |
| Fine dining | −0.1199 | 0.0273 | 0.0001 *** |
| Quick bites | −0.0468 | 0.0171 | 0.0621 . |
| Bakeries | 0.1841 | 0.0452 | 0.0042 ** |
| Lounges | 0.3391 | 0.0684 | 0.0001 *** |
| Kiosks | 1.6142 | 0.4275 | 0.0001 *** |
| Food courts | −3.4536 | 0.0067 | 0.9749 |
| M: | |||
| Dining profiles | 2.0085 | 0.0004 | 0.0001 *** |
| Non dining profiles | 0.0002 | 0.2901 | 0.3400 |
| Personal profiles | 0.0010 | 0.7810 | 0.2297 |
| Business profiles | 0.0302 | 0.0832 | 0.6000 |
| Gender | 0.0001 | 0.3405 | 0.1000 |
| Feature (Number of) | std.err | p | |
|---|---|---|---|
| Intercept | 0.1736 | 0.1011 | 0.0001 *** |
| : | |||
| Casual dining | −1.4101 | 0.0112 | 0.0002 *** |
| Cafeterias | 0.9390 | 0.0043 | 0.0700 . |
| Beverage shops | 0.0438 | 0.0021 | 0.1001 |
| Fine dining | −0.1199 | 0.0219 | 0.3001 |
| Quick bites | −0.1408 | 0.0198 | 0.6002 |
| Bakeries | 0.2684 | 0.0422 | 0.0029 ** |
| Lounges | 0.1802 | 0.0124 | 0.0007 *** |
| Kiosks | 0.1142 | 0.0325 | 0.0891 . |
| Food courts | 0.3997 | 0.1027 | 0.0042 ** |
| M: | |||
| Dining profiles | 1.5042 | 0.0001 | 0.0019 ** |
| Non dining profiles | 0.0001 | 0.0901 | 0.0910. |
| Personal profiles | 0.0210 | 0.1210 | 0.0600 . |
| Business profiles | 0.0092 | 0.0222 | 0.1008 |
| Gender | 0.0081 | 0.1205 | 0.0901 . |
References
- De Choudhury, M.; Sharma, S.; Kiciman, E. Characterizing dietary choices, nutrition, and language in food deserts via social media. In Proceedings of the 19th ACM Conference on Computer-Supported Cooperative Work & Social Computing, San Francisco, CA, USA, 27 February–2 March 2016; pp. 1157–1170. [Google Scholar]
- De Choudhury, M.; Counts, S.; Horvitz, E. Predicting postpartum changes in emotion and behavior via social media. In Proceedings of the SIGCHI Conference on Human Factors in Computing Systems, Paris, France, 27 April–2 May 2013; pp. 3267–3276. [Google Scholar]
- Huang, T.; Elghafari, A.; Relia, K.; Chunara, R. High-resolution temporal representations of alcohol and tobacco behaviors from social media data. Proc. ACM Hum. Comput. Interact. 2017, 1, 54. [Google Scholar] [CrossRef] [PubMed]
- Liu, J.; Weitzman, E.R.; Chunara, R. Assessing behavior stage progression from social media data. In Proceedings of the 2017 ACM Conference on Computer Supported Cooperative Work and Social Computing, Portland, OR, USA, 25 February–1 March 2017; pp. 1320–1333. [Google Scholar]
- Relia, K.; Akbari, M.; Duncan, D.; Chunara, R. Socio-spatial Self-organizing Maps: Using Social Media to Assess Relevant Geographies for Exposure to Social Processes. Proc. ACM Hum. Comput. Interact. 2018, 2, 145. [Google Scholar] [CrossRef] [PubMed]
- West, R.; White, R.W.; Horvitz, E. From cookies to cooks: Insights on dietary patterns via analysis of web usage logs. In Proceedings of the 22nd international conference on World Wide Web, Rio de Janeiro, Brazil, 13–17 May 2013; pp. 1399–1410. [Google Scholar]
- Kaur, H.; Johnson, I.; Miller, H.J.; Terveen, L.G.; Lampe, C.; Hecht, B.; Lasecki, W.S. Oh The Places You’ll Share: An Affordances-Based Model of Social Media Posting Behaviors. In Proceedings of the Extended Abstracts of the 2018 CHI Conference on Human Factors in Computing Systems, Montreal, QC, Canada, 21–26 April 2018. [Google Scholar]
- Gibson, J.J. The Ecological Approach to Visual Perception: Classic Edition; Psychology Press: Hove, UK, 2014. [Google Scholar]
- Chunara, R.; Bouton, L.; Ayers, J.W.; Brownstein, J.S. Assessing the online social environment for surveillance of obesity prevalence. PLoS ONE 2013, 8. [Google Scholar] [CrossRef] [PubMed]
- Bai, H.; Chunara, R.; Varshney, L.R. Social capital deserts: Obesity surveillance using a location-based social network. In Proceedings of the Data for Good Exchange (D4GX), New York, NY, USA, 28 September 2015. [Google Scholar]
- Abbar, S.; Mejova, Y.; Weber, I. You tweet what you eat: Studying food consumption through twitter. In Proceedings of the 33rd Annual ACM Conference on Human Factors in Computing Systems, Seoul, Korea, 18–23 April 2015; pp. 3197–3206. [Google Scholar]
- Mejova, Y.; Haddadi, H.; Noulas, A.; Weber, I. # foodporn: Obesity patterns in culinary interactions. In Proceedings of the 5th International Conference on Digital Health, Florence, Italy, 18–20 May 2015; pp. 51–58. [Google Scholar]
- Srinivasan, S.; O’fallon, L.R.; Dearry, A. Creating healthy communities, healthy homes, healthy people: initiating a research agenda on the built environment and public health. Am. J. Public Health 2003, 93, 1446–1450. [Google Scholar] [CrossRef] [PubMed]
- Sallis, J.F.; Glanz, K. The role of built environments in physical activity, eating, and obesity in childhood. Future Child. 2006, 16, 89–108. [Google Scholar] [CrossRef] [PubMed]
- Cruwys, T.; Bevelander, K.E.; Hermans, R.C. Social modeling of eating: A review of when and why social influence affects food intake and choice. Appetite 2015, 86, 3–18. [Google Scholar] [CrossRef] [PubMed]
- Robinson, E.; Thomas, J.; Aveyard, P.; Higgs, S. What everyone else is eating: A systematic review and meta-analysis of the effect of informational eating norms on eating behavior. J. Acad. Nutr. Diet. 2014, 114, 414–429. [Google Scholar] [CrossRef] [PubMed]
- Mejova, Y.; Abbar, S.; Haddadi, H. Fetishizing food in digital age:# foodporn around the world. In Proceedings of the Tenth International AAAI Conference on Web and Social Media, Cologne, Germany, 17–20 May 2016. [Google Scholar]
- Christakis, N.A.; Fowler, J.H. The spread of obesity in a large social network over 32 years. N. Engl. J. Med. 2007, 357, 370–379. [Google Scholar] [CrossRef] [PubMed]
- Cohen, D.A.; Finch, B.K.; Bower, A.; Sastry, N. Collective efficacy and obesity: the potential influence of social factors on health. Soc. Sci. Med. 2006, 62, 769–778. [Google Scholar] [CrossRef] [PubMed]
- Valenzuela, S.; Arriagada, A.; Scherman, A. The social media basis of youth protest behavior: The case of Chile. J. Commun. 2012, 62, 299–314. [Google Scholar] [CrossRef]
- Walker, M.; Thornton, L.; De Choudhury, M.; Teevan, J.; Bulik, C.M.; Levinson, C.A.; Zerwas, S. Facebook use and disordered eating in college-aged women. J. Adolesc. Health 2015, 57, 157–163. [Google Scholar] [CrossRef] [PubMed]
- Li, F.; Harmer, P.; Cardinal, B.J.; Bosworth, M.; Johnson-Shelton, D. Obesity and the built environment: does the density of neighborhood fast-food outlets matter? Am. J. Health Promot. 2009, 23, 203–209. [Google Scholar] [CrossRef] [PubMed]
- Morland, K.B.; Evenson, K.R. Obesity prevalence and the local food environment. Health Place 2009, 15, 491–495. [Google Scholar] [CrossRef] [PubMed]
- Insight, G.M. UAE Social Media Usage Statistics. 2018. Available online: https://www.globalmediainsight.com/blog/uae-social-media-statistics/ (accessed on 1 December 2018).
- Abu Dhabi Tourism Bureau. Food & Cuisine. 2018. Available online: https://visitabudhabi.ae/en/travel/essential.info/food.and.cuisine.aspx (accessed on 1 December 2018).
- Elhais, H. Photography Law in Dubai: Points to Consider Before Taking a Picture. 2019. Available online: https://www.lexology.com/library/detail.aspx?g=55e4fc6a-056f-4fe1-ae3a-55ec4d016262 (accessed on 28 December 2019).
- Fritz, M.S.; MacKinnon, D.P. Required sample size to detect the mediated effect. Psychol. Sci. 2007, 18, 233–239. [Google Scholar] [CrossRef] [PubMed]
- Holsten, J.E. Obesity and the community food environment: A systematic review. Public Health Nutr. 2009, 12, 397–405. [Google Scholar] [CrossRef] [PubMed]
- Baron, R.M.; Kenny, D.A. The moderator–mediator variable distinction in social psychological research: Conceptual, strategic, and statistical considerations. J. Personal. Soc. Psychol. 1986, 51, 1173. [Google Scholar] [CrossRef]
- Duncan, D.T.; Goedel, W.C.; Chunara, R. Quantitative methods for measuring neighborhood characteristics in neighborhood health research. In Neighborhoods and Health; Oxford University Press: Oxford, UK, 2018; pp. 57–90. [Google Scholar]
- Hutto, C.J.; Yardi, S.; Gilbert, E. A longitudinal study of follow predictors on twitter. In Proceedings of the Sigchi Conference on Human Factors in Computing Systems, Paris, France, 27 April–2 May 2013; pp. 821–830. [Google Scholar]
- Bakhshi, S.; Shamma, D.A.; Kennedy, L.; Gilbert, E. Why We Filter Our Photos and How It Impacts Engagement. In Proceedings of the Ninth International AAAI Conference on Web and Social Media, Oxford, UK, 26–29 May 2015. [Google Scholar]
- Sharma, S.S.; De Choudhury, M. Measuring and characterizing nutritional information of food and ingestion content in instagram. In Proceedings of the 24th International Conference on World Wide Web, Florence, Italy, 18–22 May 2015; pp. 115–116. [Google Scholar]
- Holland, P.W. Causal inference, path analysis and recursive structural equations models. ETS Res. Rep. Ser. 1988. [Google Scholar] [CrossRef]
- Von Korff, M.; Koepsell, T.; Curry, S.; Diehr, P. Multi-level analysis in epidemiologic research on health behaviors and outcomes. Am. J. Epidemiol. 1992, 135, 1077–1082. [Google Scholar] [CrossRef] [PubMed]
- Manikonda, L.; Hu, Y.; Kambhampati, S. Analyzing User Activities, Demographics, Social Network Structure and User-Generated Content on Instagram. Available online: https://www.researchgate.net/publication/267570461_Analyzing_User_Activities_Demographics_Social_Network_Structure_and_User-Generated_Content_on_Instagram (accessed on 1 December 2018).
- Ha, Y.i.; Kim, J.; Won, D.; Cha, M.; Joo, J. Characterizing Clickbaits on Instagram. In Proceedings of the Twelfth International AAAI Conference on Web and Social Media, Stanford, CA, USA, 25–28 June 2018. [Google Scholar]


| Feature (Number of) | Feature Description | Mean | Range (Min, Max) |
|---|---|---|---|
| : | |||
| Casual dining | Eateries with general menu | 35.32 | (0, 187) |
| Cafeterias | Counters/stalls serving food | 20.08 | (0, 164) |
| Beverage shops | Shops serving juices/beverages | 1.67 | (0, 10)) |
| Fine dining | Formal settings catering selected menu | 2.06 | (0, 18) |
| Quick bites | Informal setting with specific menu | 9.17 | (0, 52) |
| Bakeries | Shops serving baked items | 2.15 | (0, 13) |
| Lounges | Formal setting serving food, drinks | 1.15 | (0, 9) |
| Kiosks | Small shops/carts serving specific menu | 0.15 | (0, 3) |
| Food Courts | Indoor setting inside malls | 4.86 | (0, 27) |
| M: | |||
| Dining profiles | Network profiles that post about dining | 59.60 | (0, 381) |
| Non-dining profiles | Network profiles that do not post about dining | 183.91 | (0,966) |
| Personal profiles | Personal profiles in the users’ network | 163.32 | (0, 915) |
| Business profiles | Business profiles in the users’ network | 79.89 | (0, 538) |
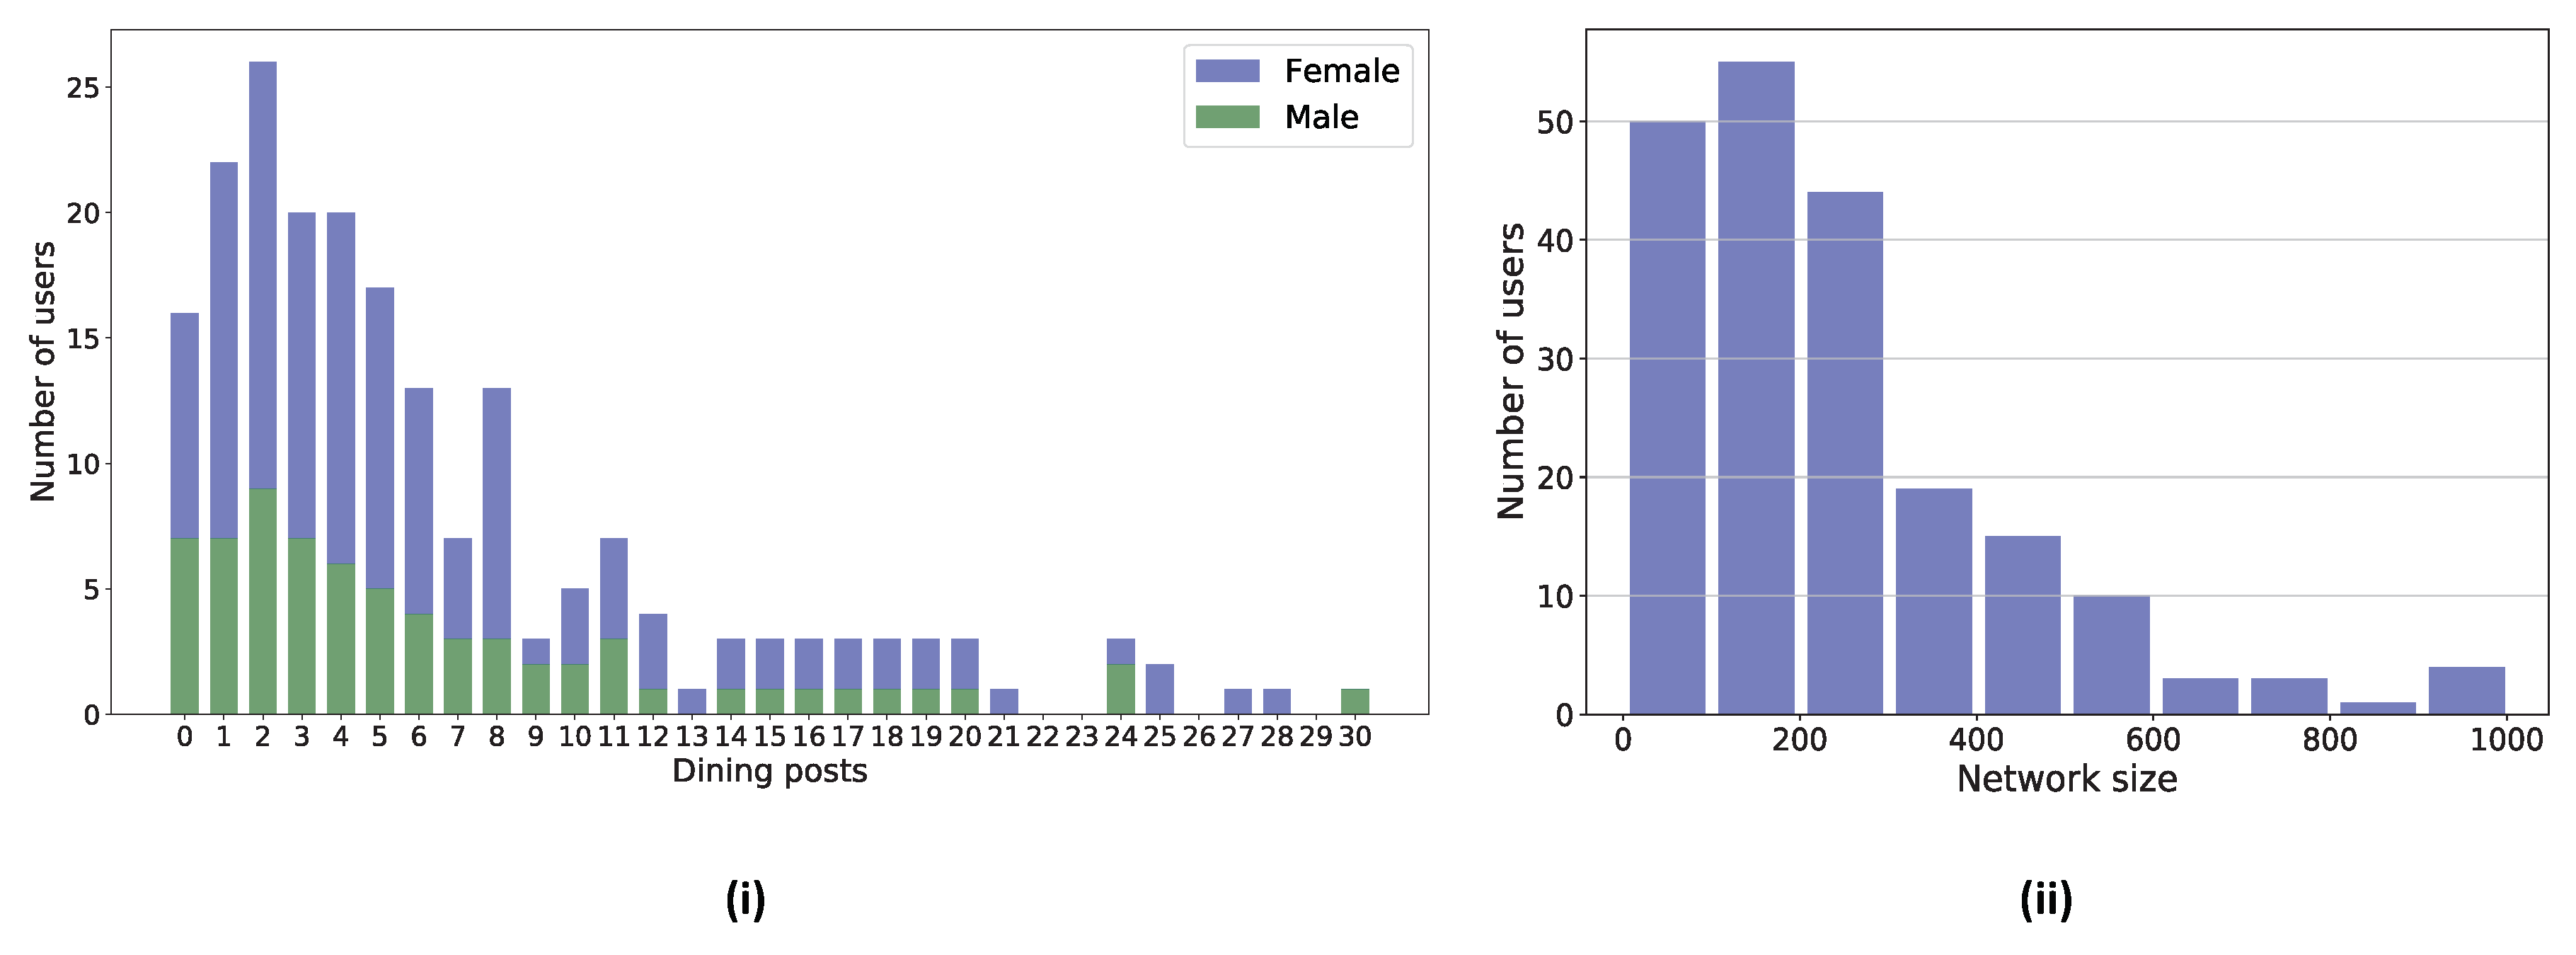
| Gender | Gender of the user; female (F) represented as 1 | 0.66 | F: 120, M: 80 |
| : | |||
| Total dining posts made by the user in 30 days | 6.51 | (0, 30) | |
| Dining posts made during morning | 0.86 | (0, 10) | |
| Dining posts made during afternoon | 2.21 | (0, 18) | |
| Dining posts made during evening | 3.62 | (0, 24) |
| Feature (Number of) | std.err | p | |
|---|---|---|---|
| Intercept | 0.1240 | 0.0021 | 0.0410 * |
| Casual dining | −0.4389 | 0.0012 | <0.0001 *** |
| Cafeterias | 0.0646 | 0.0263 | 0.1132 |
| Beverage shops | 0.3140 | 0.1280 | 0.1424 |
| Fine dining | −0.1162 | 0.0352 | 0.9801 |
| Quick bites | −0.6641 | 0.0176 | 0.8710 |
| Bakeries | 1.4124 | 0.0012 | 0.0328 * |
| Lounges | 0.6158 | 0.0310 | 0.0190 * |
| Food Courts | −0.3475 | 0.0002 | <0.0001 *** |
| Feature (Number of) | std.err | p | |
|---|---|---|---|
| Intercept | 0.1093 | 0.0010 | 0.0320 * |
| Dining profiles | 1.5042 | 0.0001 | 0.0019 *** |
| Non dining profiles | 0.0001 | 0.0901 | 0.0910 . |
| Personal profiles | 0.0210 | 0.1210 | 0.0600 . |
| Business profiles | 0.0092 | 0.0222 | 0.1008 |
| Without Moderator | With Moderator | |
|---|---|---|
| Feature (Number of) | (Mean Adjusted R-Squared: | (Mean Adjusted R-Squared: |
| 0.0238) | 0.1687) | |
| Intercept | 0.1341 * | 0.1091 * |
| Casual dining | −0.438 *** | −0.343 ** |
| Bakeries | 1.412 * | 0.049 * |
| Lounges | 0.615 * | 0.078 * |
| Food Courts | −0.347 ** | 0.025 * |
| Moderator (M): | ||
| Dining profiles | - | 0.170 * |
| Interaction terms: | ||
| Causal dining * M | - | 0.011 * |
| Bakeries * M | - | 0.011 * |
| Lounges * M | - | 0.010 * |
| Food Courts * M | - | 0.012 * |
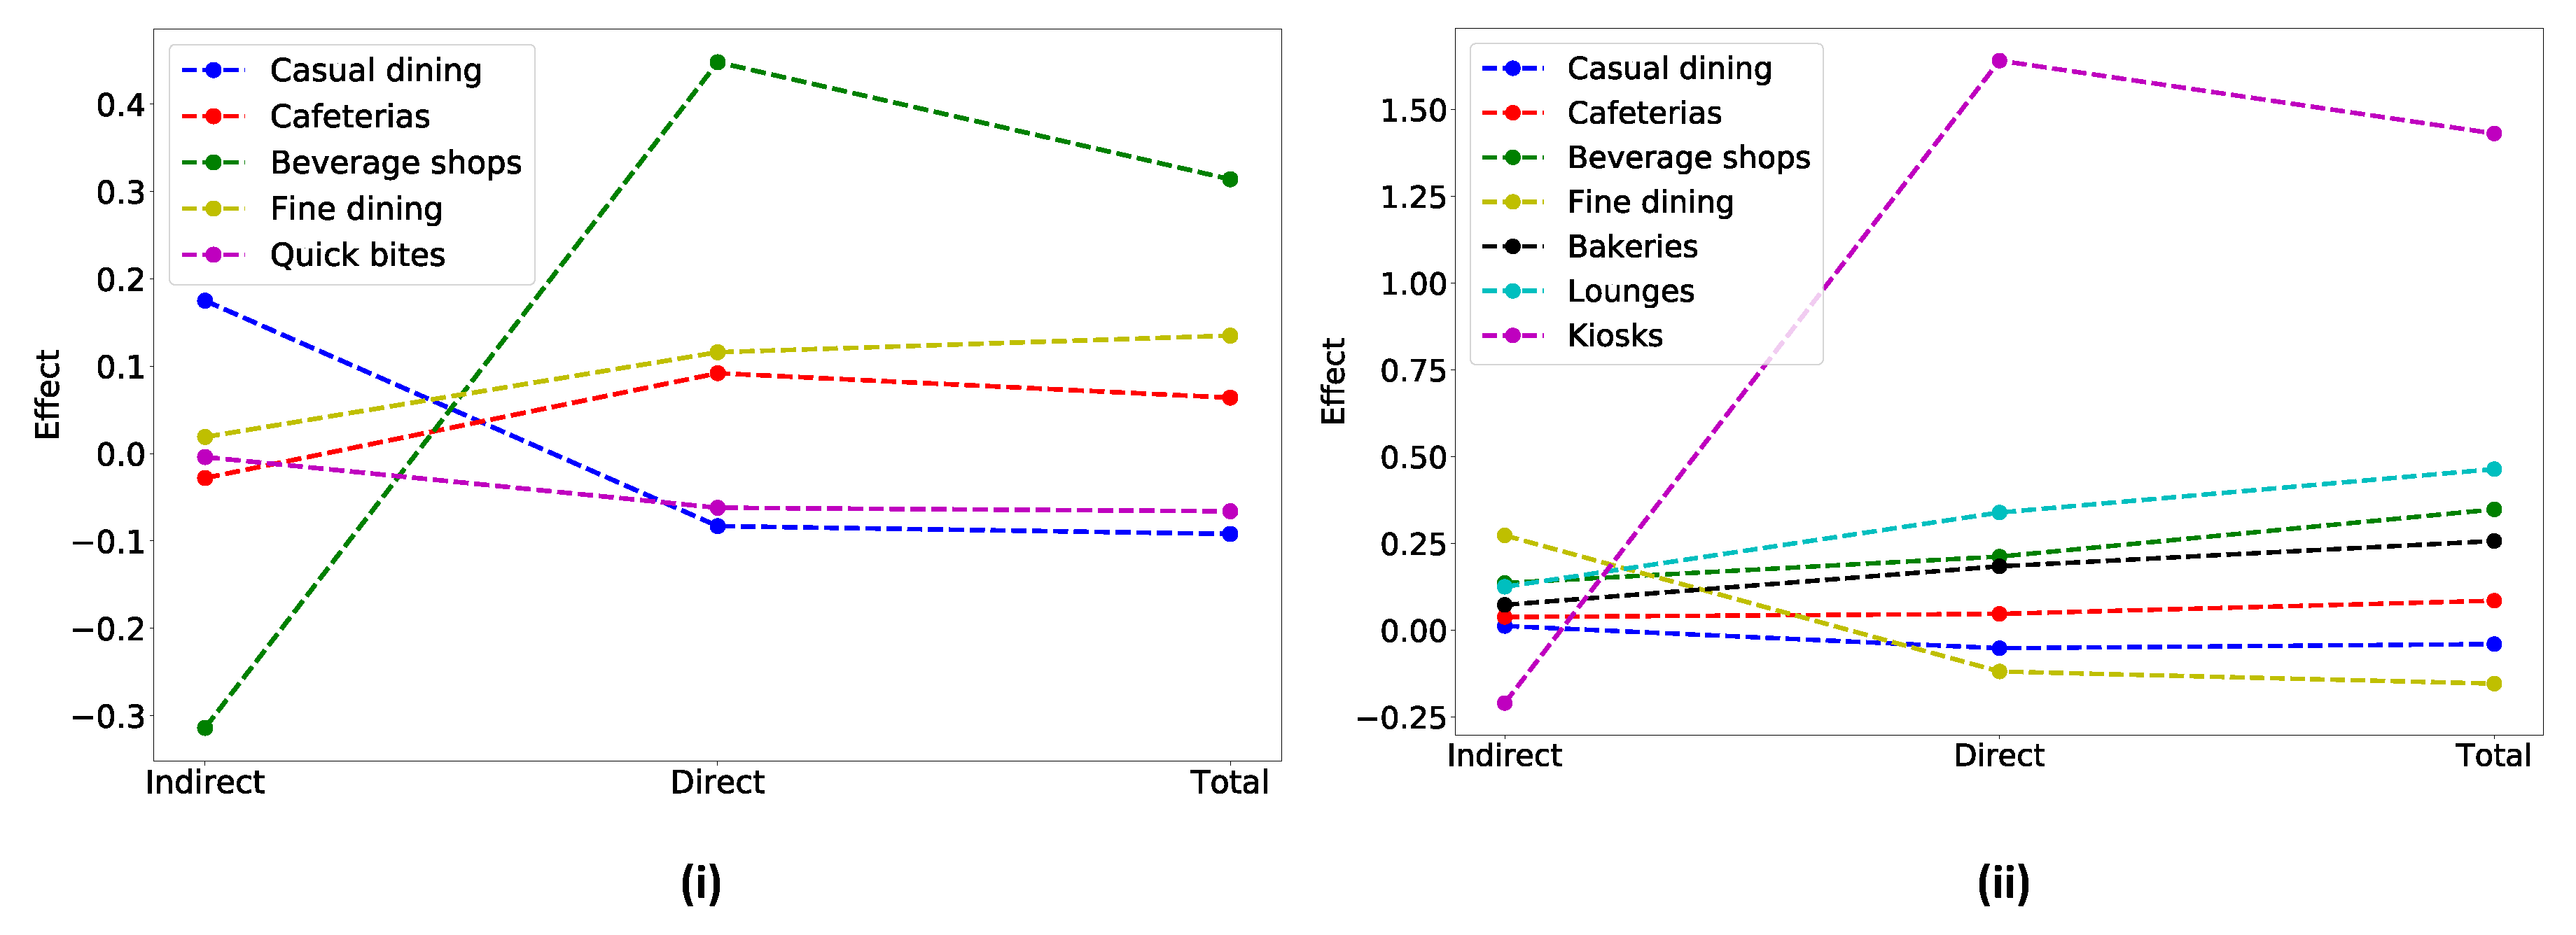
| Total Effect | Direct Effect | Indirect Effect | |
|---|---|---|---|
| (Number of) | |||
| Casual dining | −0.44 (−1.96, 1.08) | −1.41 (−2.12, −0.70) | 0.97 |
| Bakeries | 1.41 ( 0.12, 2.71) | 0.27 (−0.21, 0.75) | 1.14 |
| Lounges | 0.62 ( 0.02, 1.21) | 0.18 (−0.07, 0.44) | 0.44 |
| Food courts | −0.35 (−0.56,−0.14) | 0.40 ( 0.22, 0.57) | −0.74 |
© 2020 by the authors. Licensee MDPI, Basel, Switzerland. This article is an open access article distributed under the terms and conditions of the Creative Commons Attribution (CC BY) license (http://creativecommons.org/licenses/by/4.0/).
Share and Cite
Mhasawade, V.; Elghafari, A.; Duncan, D.T.; Chunara, R. Role of the Built and Online Social Environments on Expression of Dining on Instagram. Int. J. Environ. Res. Public Health 2020, 17, 735. https://doi.org/10.3390/ijerph17030735
Mhasawade V, Elghafari A, Duncan DT, Chunara R. Role of the Built and Online Social Environments on Expression of Dining on Instagram. International Journal of Environmental Research and Public Health. 2020; 17(3):735. https://doi.org/10.3390/ijerph17030735
Chicago/Turabian StyleMhasawade, Vishwali, Anas Elghafari, Dustin T. Duncan, and Rumi Chunara. 2020. "Role of the Built and Online Social Environments on Expression of Dining on Instagram" International Journal of Environmental Research and Public Health 17, no. 3: 735. https://doi.org/10.3390/ijerph17030735
APA StyleMhasawade, V., Elghafari, A., Duncan, D. T., & Chunara, R. (2020). Role of the Built and Online Social Environments on Expression of Dining on Instagram. International Journal of Environmental Research and Public Health, 17(3), 735. https://doi.org/10.3390/ijerph17030735