Article

Shallow Groundwater Quality and Its Controlling Factors in the Su-Xi-Chang Region, Eastern China

1
Technology Innovation Center of Geo-Environmental Restoration, Ministry of Natural Resources, No. 388 Lumo Road, Wuhan 430074, China
2
School of Environmental Studies, China University of Geosciences, No. 68 Jincheng Street, Wuhan 430078, China
3
Key Laboratory of Earth Fissures Geological Disaster, Ministry of Natural Resources, No. 700 Zhujiang Road, Nanjing 210018, China
4
Geological Survey, China University of Geosciences, No. 388 Lumo Road, Wuhan 430074, China
*
Author to whom correspondence should be addressed.
Int. J. Environ. Res. Public Health 2020, 17(4), 1267; https://doi.org/10.3390/ijerph17041267
Submission received: 18 December 2019 / Revised: 10 February 2020 / Accepted: 11 February 2020 / Published: 16 February 2020

Abstract

:
Understanding factors influencing groundwater quality is critical to the development of best management practices at the large watershed scale. In this study, the shallow groundwater (10–20 m depth) in the Su-Xi-Chang region, eastern China, was investigated as part of a monitoring program from 2007 to 2008 to analyze the regional groundwater quality as well as the hydrogeochemical processes and their controlling factors. Conventional physicochemical water parameters (pH, turbidity, electrical conductivity, dissolved oxygen, total phosphorus), major cations (Na+, Ca2+, Mg2+ and NH4+) and anions (Cl, NO3 and SO42−) were measured. Hydrochemical methods and multivariate statistical methods were applied to analyze the hydrogeochemical signatures, origins, the similarities among the variables and to identify the main pollution sources in the groundwater. The results showed that (1) the concentrations of TDS (224.89–1086.70 mg/L) and turbidity (0.1–18.60 NTU) were higher than the class II groundwater quality standards in China and the WHO drinking water standards, (2) there were extremely high concentrations of ammonia (0.01–32.90 mg/L), with a mean value of 0.72 mg/L and (3) the nitrate concentrations (average value of 22.07 mg/L) exceeded the class III groundwater quality standards. The study also provided evidence that weathering, dissolution of carbonate, halite and silicate and cation exchange were the possible primary hydrogeochemical control mechanisms in the groundwater. The sources of ammonia, total phosphorus, sulfates and nitrates included rock–water interactions and anthropogenic activities. The groundwater administration of pollution sinks and sources, long-term legal frameworks and economic incentives should be improved to optimize watershed scale management in the context of rapid development in China.

1. Introduction

The water crisis is one of the most serious problems in the 21st century which is in fact continuing to get worse due to anthropogenic activities [1,2,3,4]. These activities involve the discharge of increasing amounts of contaminants into water bodies and excessive development and utilization of surface water and groundwater resources [3,5,6,7,8,9]. Owing to rapid urbanization, industrialization and intensified land reclamation, surface water has become destabilized, degraded and contaminated worldwide, which makes the availability and quality of groundwater, particularly shallow groundwater (0~60 m), an environmental concern [10,11,12].
Shallow groundwater is the major source of potable, domestic and industrial water throughout the world because in the absence of surface water, developing and utilizing groundwater is the compelling option. Moreover, where groundwater is available, obtaining shallow groundwater is more economical and convenient than deep groundwater [13,14,15]. However, the shallow groundwater has direct recharging and discharging relationships with local precipitation and surface water and is greatly affected by anthropogenic activities due to shallow buried conditions and rapid circulation [16,17,18]. Therefore, the quality and safety of shallow groundwater have drawn global attention. Investigating the spatial and temporal variation of shallow groundwater quality at a large scale is particularly useful for developing an effective water management system [19,20,21].
The Su-Xi-Chang region (including the municipalities of Suzhou, Wuxi and Changzhou) is located in the lower reaches of the Yangtze River in the southern Jiangsu Province. Sitting on the Yangtze River estuary and adjacent to Shanghai, the Su-Xi-Chang region is one of the fastest growing, most prosperous and representative regions in China. In this region, surface water and groundwater have frequent and intense interactions. Meanwhile, the resources of surface water and groundwater are abundant. Due to the shallow burial of shallow groundwater, the aquifer is easily polluted by the sewage discharged from factories and pesticide residues from farmland, which may also inversely influence the surface water body (e.g., Yangtze River, Taihu Lake, East Sea and the Yellow Sea) horizontally and deep groundwater vertically. Hence, it is extremely important to carry out research on shallow groundwater in areas where anthropogenic activities are frequent and the economy is developed, such as the Su-Xi-Chang region. However, few scientific, systematic and long-term groundwater measuring or monitoring programs have been conducted in this region in recent decades. Many studies regarding the occurrence of land subsidence due to excessive groundwater exploration have been performed in local areas [22,23,24,25]. Nevertheless, the hydrochemical characteristics, groundwater formation mechanisms and anthropogenic impacts on groundwater quality due to rapid urbanization and industrialization are less commonly reported.
During the past decade, several approaches have been developed to assess the impacts of anthropogenic activities on water quality. There are two main obstacles to overcome. First, adequate long-term measurements of water quality data are even scarcer than data on water fluxes. Second, the transformation of small-scale process descriptions to the watershed or catchment scale remains an unsolved problem [26]. Multivariate statistical methods can be used to characterize and evaluate the temporal and spatial variations of groundwater quality from complicated datasets [11,27,28,29,30]. Spatially referenced regressions of contaminant transport in watershed attribute models have been used as a hybrid process-based and statistical modeling approach for estimating pollutant sources and contaminant transport in waters [31,32]. Recent studies in large watersheds that have utilized remote sensing data and geographical information techniques have been oriented toward quantifying the combined influence of watershed characteristics, land-use changes and social and economic factors on nutrient discharge into rivers [21,30,33,34,35,36].
The objectives of the present study were to (1) detect the conventional physicochemical parameters (pH, turbidity, electric conductivity, dissolved oxygen, total phosphorus) of the groundwater, (2) determine the concentrations of major cations (Na+, Ca2+, Mg2+ and NH4+) and anions (Cl, NO3‑ and SO42−) in the groundwater, (3) analyze the hydrogeochemical signatures, processes, origins and mechanisms in the study area and (4) identify the anthropogenic impacts on groundwater quality variations in the Su-Xi-Chang region in eastern China.

2. Outline of Study Area and Methodology

2.1. Study Area

The Su-Xi-Chang region is situated in the Taihu Lake plain in the Southern Yangtze Delta in the eastern part of China and constitutes approximately 14,649 km2 of the territory; additionally, the average elevation is below 50 m (decreases from the west to the east), as illustrated in Figure 1. It borders the Mogan Mountain and Maodong Plain in the west, the East Sea and the Yellow Sea in the east, the Yangtze River in the north and Zhejiang Province in the south [23]. The northern subtropical monsoon climate dominates this region year-round, with an average annual temperature of 17.5 °C and a mean annual precipitation of 1055 mm, all of which are beneficial for hydrological cycling and hydrogeochemical transformation [37].

2.2. Hydrogeological Conditions

Various groundwater types, complex buried conditions and uneven spatial distributions of groundwater were observed in the study area, which clearly indicates the regional characteristics [22,24,38]. Pore water in unconsolidated materials is the primary type of groundwater in the plain area. According to the origins, ages, buried distributions, hydraulic connections and hydrochemical characteristics of the aquifers, they were divided into phreatic aquifers and the confined aquifers in the area were labeled from top to bottom as I, II and III [23,25]. The soil intervals between the aquifers are viscous and the lithology is dominated by loam and sandy loam with medium-fine sand, which were regarded as lenses for aquitard or aquifuge (Figure 2).
The pore-phreatic aquifer, which is the target aquifer in this study, consisting of Holocene and Upper Pleistocene, loam, sandy loam and silty sand, is distributed throughout the study area. Although the phreatic groundwater quality is complicated, freshwater mostly occupies the area. From the west to the east, the hydrochemical types of phreatic groundwater vary from the HCO3—Ca·Mg type to the Cl·HCO3—Na type.
Confined aquifer I, which is composed of Upper Pleistocene loam, sandy loam, silty sand and medium-fine sand, is characterized by a multi-layered structure with mostly HCO3-Na·Ca-type groundwater.
As the main groundwater exploitation layer in the study area, confined aquifer II is composed of 1–3 layers of Middle Pleistocene loam, sandy loam, fine sand, medium coarse sand, pebbly coarse sand and gravel. Due to the stability (mostly HCO3—Na·Ca type) and excellence (mineralization 0.60–0.90 g/L) of the groundwater quality, confined aquifer II is suitable as a direct drinking water source.
Confined aquifer III consists of clay, sandy loam, sand and gravel. The quality of the groundwater in this aquifer is considered to be good and is accompanied by HCO3—Ca·Na and HCO3·Cl—Na·Ca hydrochemical types and a mineralization of 0.75–0.90 g/L.

2.3. Sampling and Analytical Methods

A total of 231 shallow groundwater samples (10~20 m in depth) were collected throughout the study area as part of a groundwater monitoring program based on existing wells, springs, newly built monitoring wells and boreholes from December 2007 to January 2008. The layout of the high-density sampling sites generally ensured uniformity and representativeness. The elevation and coordinates of the sampling sites were measured and identified using a portable handheld global positioning system (GPS).
Physicochemical parameters were measured at each sampling site and all samples were analyzed for major cations, anions and alkalinity. Water temperature, pH, turbidity, dissolved oxygen (DO) and electric conductivity (EC) were measured in the field at the time of collection using a digital handheld multiparameter sampling instrument (YSI ProDSS) [3]. The samples were pretreated during field collection using a degassing filtration system (GM-0.33A, JINTENG) powered by vehicular electricity supply, accompanied with a 0.45 μm water-soluble filter membrane and acidified to pH ≤ 2 using ultra-pure HNO3 for the cation analysis [39,40]. Without the determination of NOM (Natural Organic Matter) or TOC (Total Organic Carbon), such on-site pretreatment can effectively filter the particle impurities, suspended solids and complexes, and stabilize the cations in the water sample, avoiding subsequent disturbance so as to make the measured results of cations and anions more accurate and the instruments more reliable. After sample collection, each sample was stored in polyethylene bottles that were sealed with parafilm sealing film before further chemical analysis at the State Key Laboratory of Biogeology and Environmental Geology, China University of Geosciences (Wuhan, China).
Major cations (Na+, Mg2+ and Ca2+) were determined by inductively coupled plasma optical emission spectrometry (ICP-OES) (iCAP 6300, Thermo Fisher Scientific) on the filtered and acidified samples. The average analytical error of the major and trace chemical constituents using ICP-OES is less than ±5%. The major anions (Cl, NO3‑ and SO42−) were detected by ion chromatography (IC) (ICS 1100, DIONEX) with a detection limit of 0.01 mg/L. Alkalinity was measured by in situ titration with HCl (0.1 N), using methyl orange as an indicator within 6 h of sampling. Total phosphorus (TP) was determined by the colorimetric method after previous digestion [3] and the absorbance readings together with the ammonia were performed in a spectrophotometer (1600 PC, Shimadzu).
The ionic balance error was within ±5%, as the percentage relative total of the cation–anion difference was calculated on the sums from each groundwater sample. All analyses yielded analytical errors <5% and external precision of known–unknown analytical standards. All procedures of sampling, preservation and transportation to the laboratory were conducted according to standard methods [41].

2.4. Data Treatment and Analytical Methods

Multivariate statistical methods, including factor analysis (FA), cluster analysis (CA) and principal component analysis (PCA) were used to analyze the variation in water quality and its relationship with anthropogenic descriptors [21]. PCA is a widely used technique to reduce the dimensions of multivariate data and explain the correlations among large numbers of observed variables by extracting a smaller number of latent factors (i.e., principal components or PCs) [35,42,43,44]. Eigenvalues represent the amount of variance explained by the data matrix. Loadings represent the relative importance of a given variable in a given component. A positive or negative loading means that the variable is positively or negatively correlated to the component [21]. To improve the interpretability of the results, a PCA with varimax normalized rotation was applied; this can maximize the variances in the loading factor across the variables of each factor [45]. In this study, three principal factors extracted from the variables were retained with eigenvalues greater than 1.0, as determined by the Kaiser criterion [46]. Descriptive statistics, correlation coefficients and PCA were all performed using SPSS Version 19.0.

3. Results and Discussion

3.1. Physicochemical Parameters, Hydrochemical Characteristics and Groundwater Quality

A statistical summary of the physicochemical parameters of the shallow groundwater in the Su-Xi-Chang region is given in Table 1. To assess the suitability of the shallow groundwater over the study area for domestic purposes, the groundwater samples were compared with quality standards for groundwater (GB/T 14848-93 [47]), standards for drinking water quality (GB 5749-2006 [48]) and drinking water quality guidelines [49]. For effective disinfection with chlorine, the pH should preferably be less than 8; however, lower-pH water (approximately pH 7 or less) is more likely to be corrosive [49]. In this study, the pH in the shallow groundwater was observed within the range from 5.59 to 7.82 with a mean value of 7.0, which indicated that the groundwater was faintly acidic to mildly alkaline and well within the permissible limit of 6.5–8.5 [48,49]. Total dissolved solids (TDS) is an important indicator of drinking water quality. According to the World Health Organization (WHO) and the Ministry of Health (MH) of China, the palatability of water with a TDS level of less than approximately 600 mg/L is generally considered to be good; drinking water becomes significantly and increasingly unpalatable as the TDS levels reach greater than approximately 1000 mg/L [48,49]. In the present study, the TDS levels of the groundwater ranged from 224.89 to 1086.70 mg/L, with an average value of 616.69 mg/L. However, the average TDS level was still higher than the quality standard limits for class II (≤500 mg/L) groundwater established by the State Bureau of Technical Supervision (GB/T 14848-93 [47]). Within this class II limit, the groundwater is recommended to be used for a variety of purposes. Approximately 74% of the samples in the study area were at TDS levels greater than 500 mg/L.
Both turbidity and dissolved oxygen (DO) are important parameters that reflect the quality of groundwater. The turbidity was measured in the range from 0.1 to 18.60 NTU, with a mean value of 3.85 in all samples. According to the quality standards for class II groundwater, the turbidity should be less than 3 NTU (GB/T 14848-93 [47]), although this limit is even stricter for drinking water usage [48,49]. Only 30% of the groundwater samples qualified for drinking condition in terms of turbidity (≤1 NTU), while 40% of the samples failed to reach the class II groundwater conditions. Despite the fact that DO is not specified in either groundwater standards or drinking water standards, it is critical to the survival of aquatic organisms. The mean DO value was only 0.97 mg/L, which was considered low in the study area.
In water bodies, ammonia and total phosphorus (TP) are important parameters indicative of inorganic pollution that mainly result from anthropogenic impacts. They were used as the primary restrictive descriptors of water pollution control goals in the 12th Five-Year Plan of China (2011–2015) [21]. The reference ammonia concentration value established by the China State Bureau of Technical Supervision (CSBTS) for class II groundwater is 0.02 mg/L. However, the average ammonia value reached 0.72 mg/L in this study and the maximum value was 32.90 mg/L. Some sampling sites are located in urban areas and are presumably influenced by industrial effluent or domestic sewage discharge, which may contribute to the increased ammonia levels at these points. Although TP is not specified in groundwater or drinking water standards, the maximum and mean values are 2.02 and 0.15 mg/L, respectively, which are high compared with the environmental quality standards for surface water (GB 3838-2002 [50]). The increase in ammonia and phosphorus levels at most sampling sites in strictly rural areas may be attributed to excreta from poultry and livestock and agricultural fertilizers used in the cultivation of farm crops, e.g., soybeans and corn, which are common in the study area.
As shown in Table 2, the major cations and anions in the groundwater show significant spatial variation in the study area. The concentrations of Ca2+, Mg2+ and Na+ in the groundwater over the study area were in the ranges of 26.20–162.00, 6.07–64.00 and 8.32–159.00 mg/L, respectively. The concentrations of HCO3, Cl and SO42− in the groundwater were observed in the ranges of 113.00–706.00, 7.96–191.00 and 2.45–187.00 mg/L, respectively. More than 98% of all samples in the study area were within the permissible limits of major cations and anions for drinking water due to the TDS values ≤1000 mg/L (Table 1), excluding only 4 samples with their average TDS value of 1040.30 mg/L. According to the mean values, the major cations and anions in the groundwater in the study area were found in the order of Ca2+ > Na+ > Mg2+ and HCO3 > SO42− > Cl, respectively.
Groundwater nitrate contamination is currently very common and has become a growing problem in many regions of the world. Many researchers have reported serious groundwater nitrate pollution in China [51,52,53,54,55]. In the shallow groundwater in the Su-Xi-Chang region, NO3 showed a wide concentration variation from 0.01 to 154.00 mg/L, with an average of 22.07 mg/L. Approximately 14% of the shallow groundwater samples have NO3 concentrations greater than 50 mg/L, which is the WHO recommended maximum acceptable guideline value for drinking water [49]. These high concentrations can be attributed to the leaching of NO3 from frequent anthropogenic activities such as fertilization and irrigation of agricultural land and wastewater leakage.

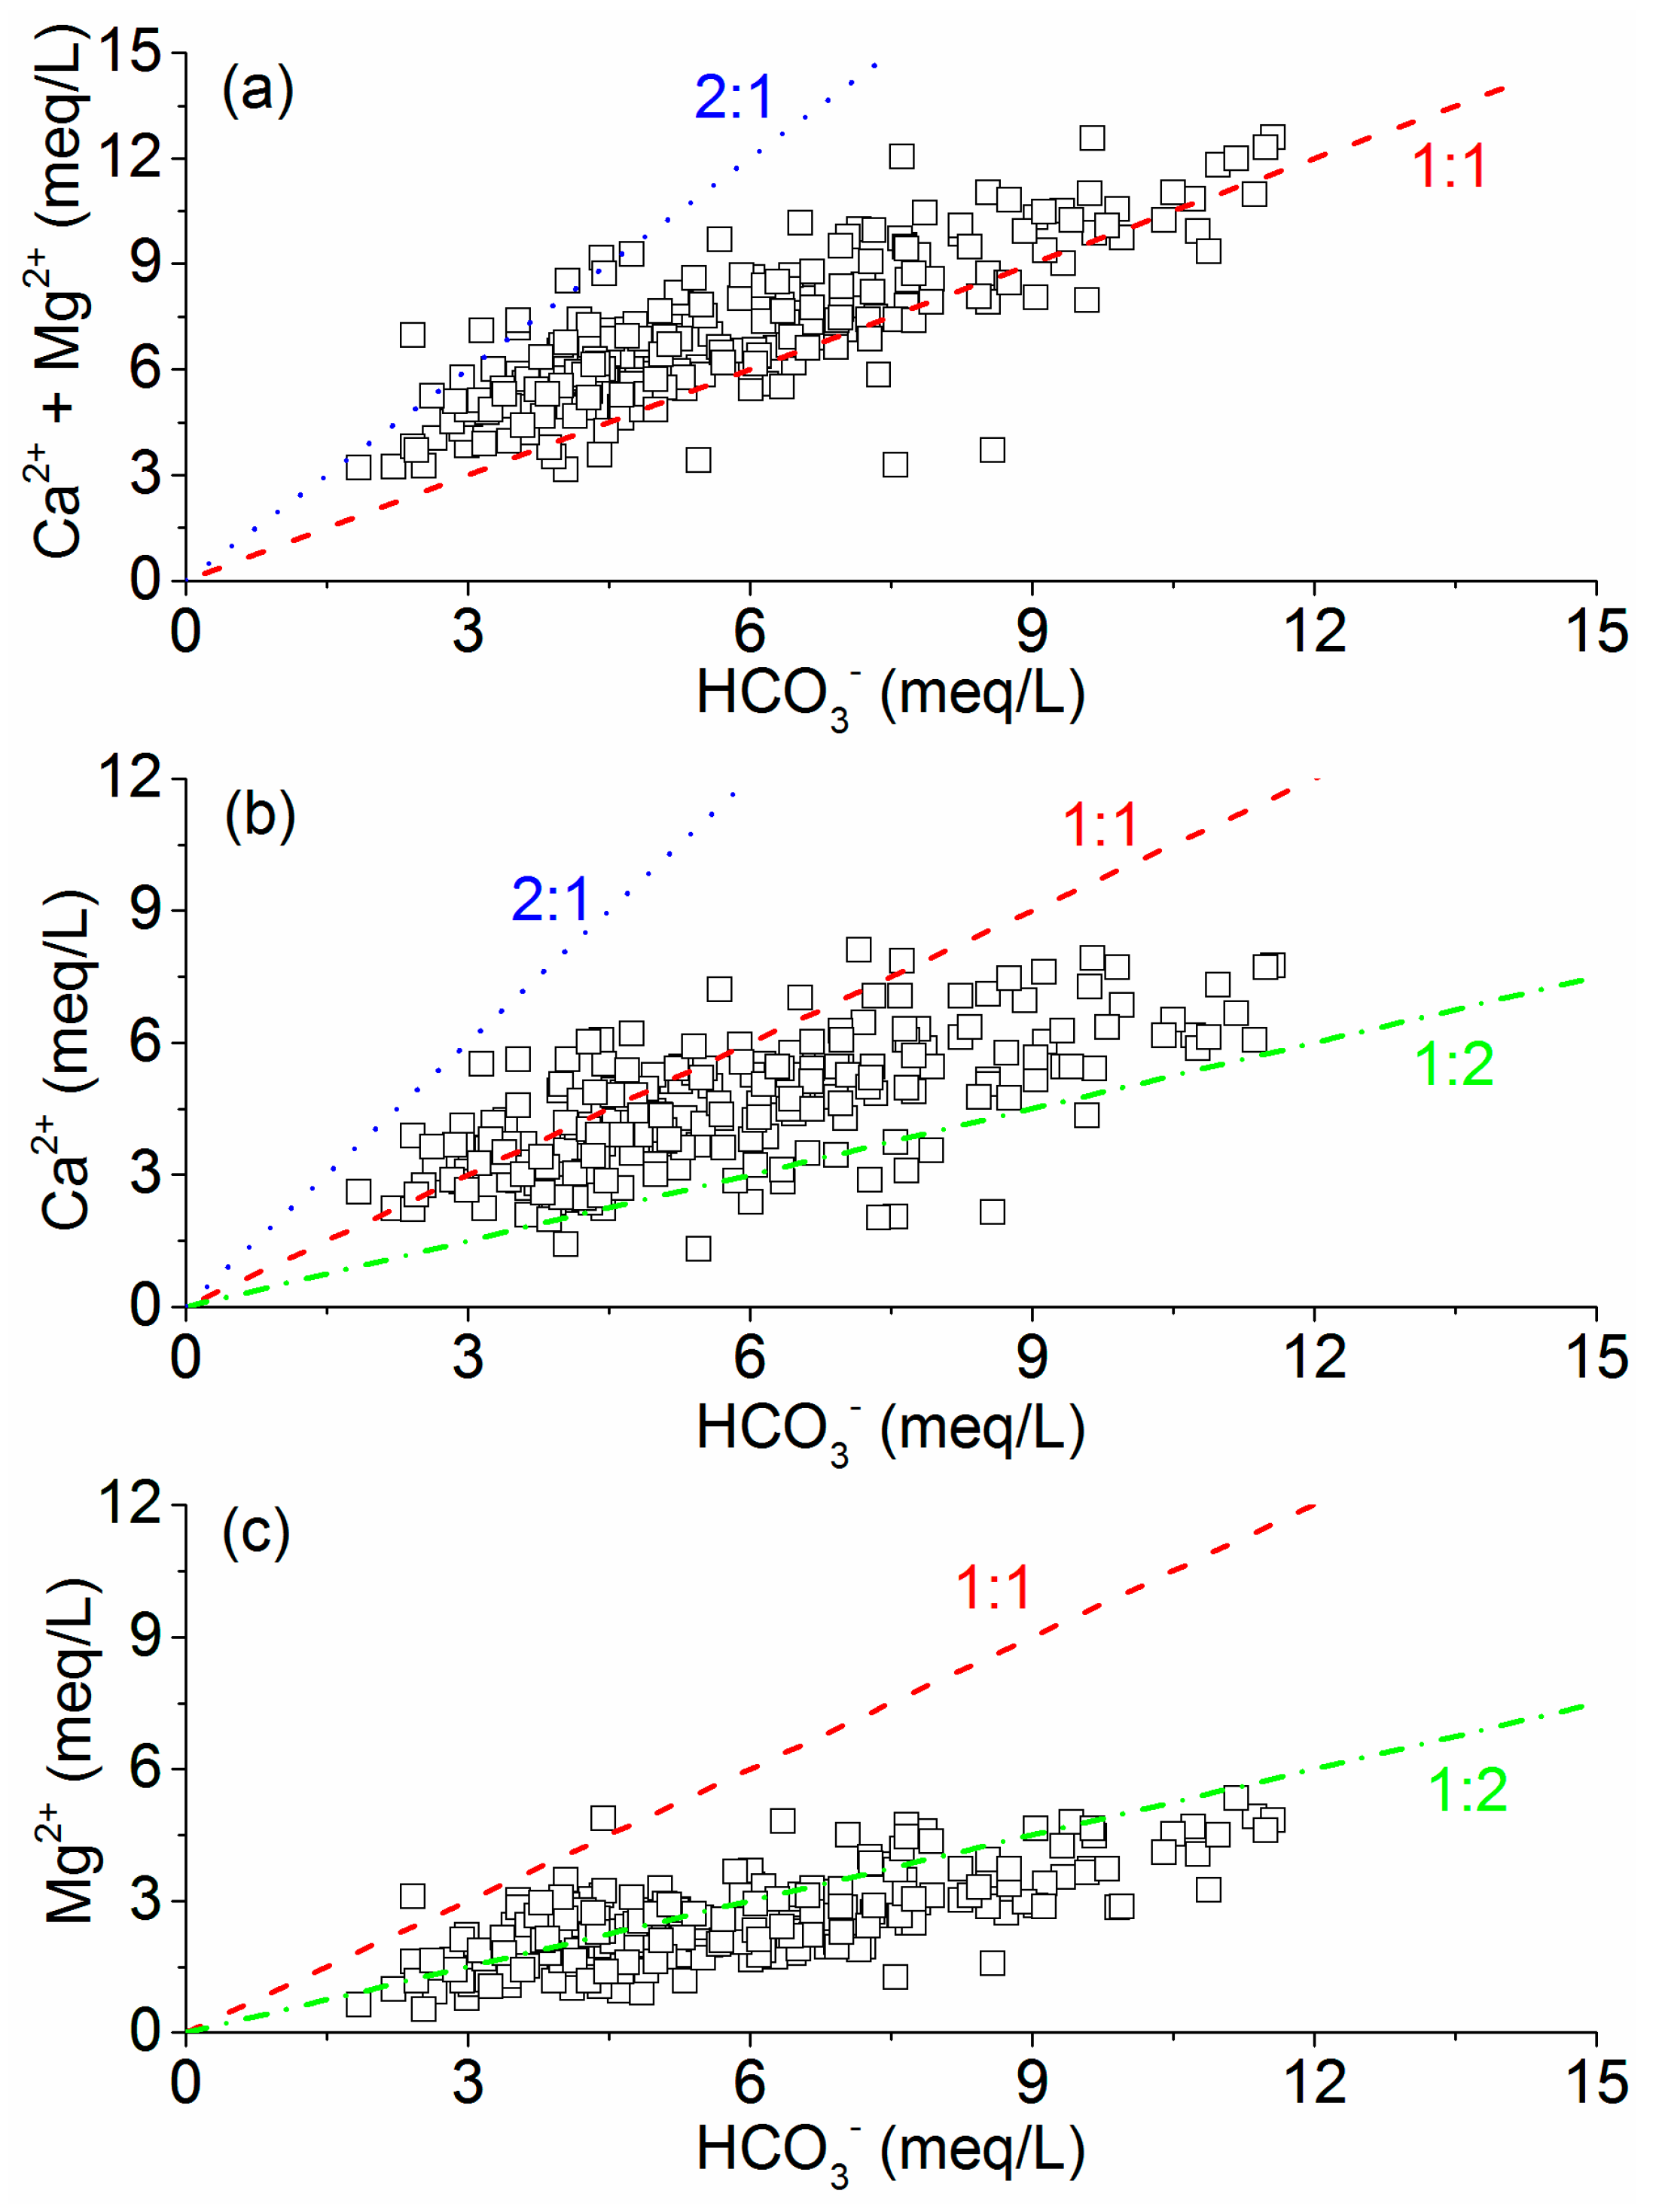
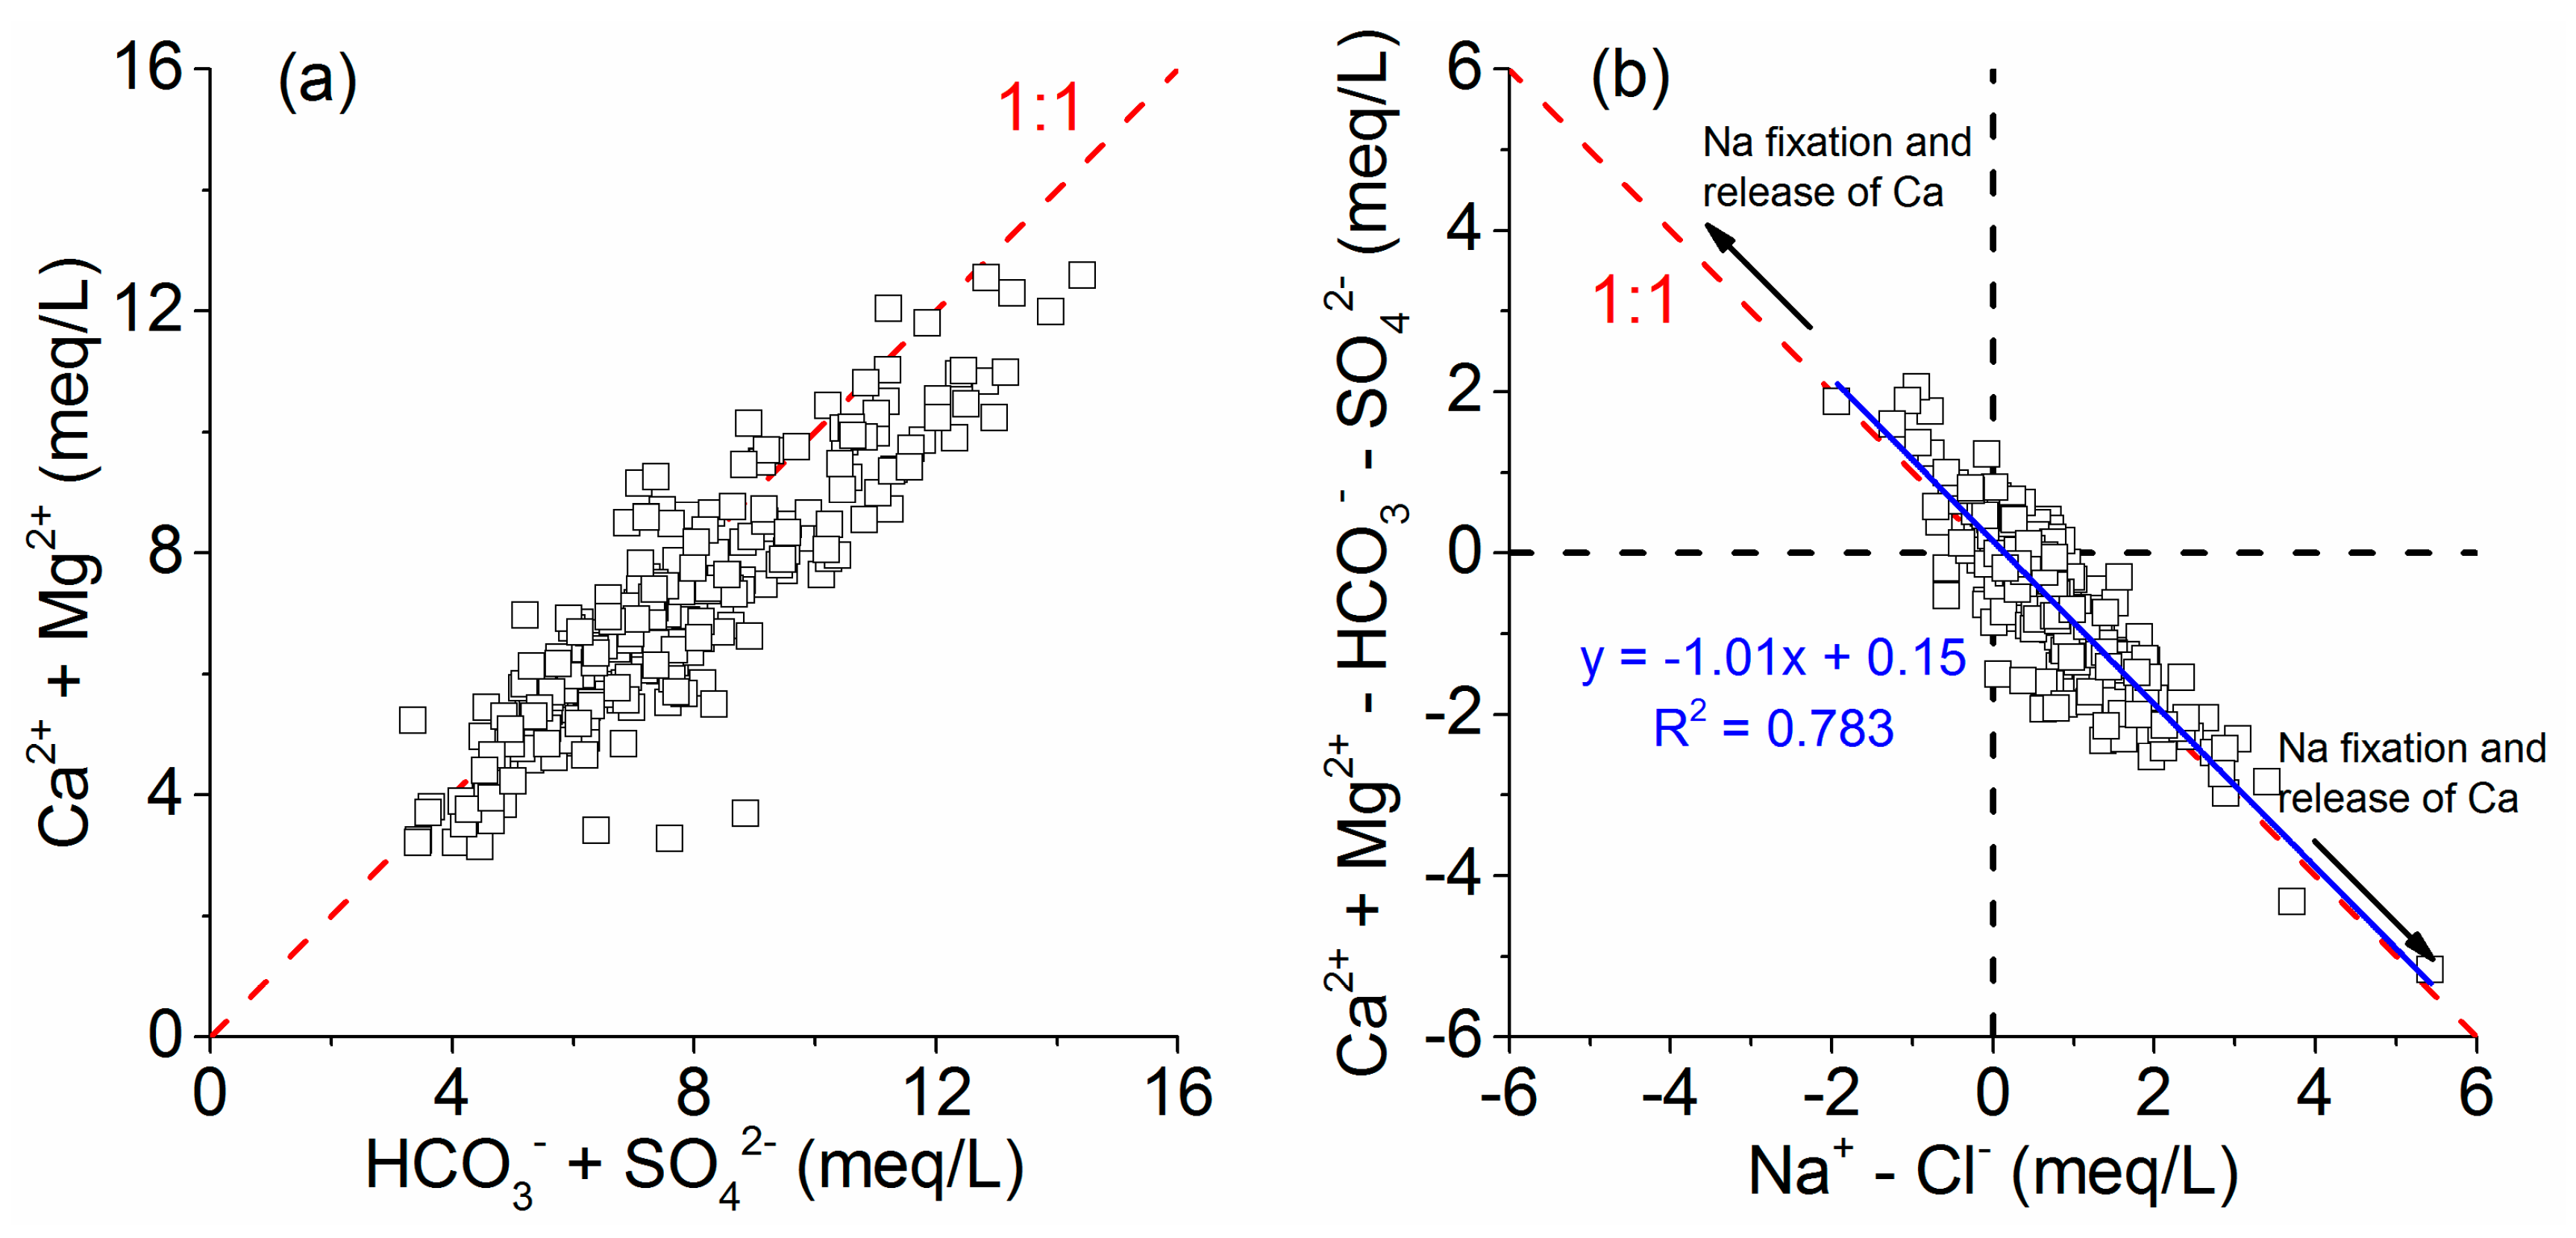
3.2. Hydrochemical Origin and Correlation Analysis

Gibbs diagrams have been proposed to investigate the mechanisms controlling the surface water chemistry throughout the world. Gibbs diagrams are constructed by plotting the ratios of Na/(Na+Ca) and Cl/(Cl + HCO3) weights versus TDS separately on a logarithmic axis. Based on extensive water chemistry data from numerous rain, river, lake and ocean samples, Gibbs diagrams have been classified into three dominance domains corresponding to precipitation dominance, rock dominance and evaporation dominance. In recent years, Gibbs diagrams have also been used to evaluate groundwater chemistry. Therefore, in this study, the samples were plotted on Gibbs diagrams to investigate the factors governing the chemistry of the shallow groundwater in the Su-Xi-Chang region.
As shown in Figure 3, all samples were distributed in the middle part (mid-range TDS levels) of the boomerang on the Gibbs diagrams, while Na/(Na+Ca) values spanned the entire range (0.1–0.8), which reflected the characteristics of fresh groundwater, unlike most surface water [56]. Almost every sample dropped in the shape of boomerang except for only a few dots with higher Na/(Na+Ca) values than 0.7. It can be inferred that carbonate minerals dominate the groundwater chemistry, accompanying the availability and solubility of silicates minerals [57]. Depending on soil and aquifer properties, all samples fell toward the rock dominance domain, suggesting that rock–water interactions are the major source of dissolved ions in the groundwater in this study.
To further understand the hydrogeochemical processes regulating the groundwater quality, a correlation analysis was performed and a bivariate diagram was constructed [58]. Pearson correlation (r) was used to examine the correlation between all possible variable pairs. Samples showing r > 0.7 are considered to be strong, whereas 0.7 > r > 0.5 represents moderate correlation at a significance level (p) of <0.05 (Table 3) [59,60].
As shown in Table 3, TDS was strongly correlated with Ca2+, Na+ and HCO3 (r > 0.7) and moderately correlated with Mg2+, Cl and SO42−, which indicates that the groundwater salinities were mainly controlled by these ions due to the dissolution of minerals or concentration by evaporation [61,62].
HCO3 was related to Ca2+ and Mg2+ with high correlation coefficients (Table 3), which suggests the possibility of carbonate weathering and dissolution [63,64]. Generally, weathering and dissolution of carbonates such as calcite and dolomite during irrigation, rainfall infiltration and groundwater movement are the major sources of Ca2+, Mg2+ and HCO3 as follows:
CaCO3 + H2O + CO2 → Ca2+ + 2HCO3
CaMg(CO3)2 + 2H2O + 2CO2→ Ca2+ + Mg2+ + 4HCO3
CaCO3 + H+ → Ca2+ + HCO3
CaMg(CO3)2 + 2H+ → Ca2+ + Mg2+ + 2HCO3
Accordingly, the equivalent (Ca2+ + Mg2+)/HCO3 ratio (expressed in meq/L) would be 1:1 to 2:1 if Ca2+, Mg2+ and HCO3 in the groundwater originated solely from carbonate weathering [65]. Figure 4a indicates that carbonate weathering is a dominant hydrogeochemical process that controls the evolution of Ca2+, Mg2+ and HCO3 in shallow groundwater. Some samples falling below the 1:1 line (Figure 4a) showed a depletion of Ca2++Mg2+ relative to HCO3 that suggested other hydrogeochemical processes, such as silicate weathering and/or cation-exchange processes, in the study area. Theoretically, if Ca2+ and HCO3 in the groundwater originated solely from calcite weathering, the equivalent Ca2+/HCO3 ratio would be 1:1 to 2:1 depending on the relative contribution of carbonic acid and strong acid (sulfuric acid, nitric acid), whereas this ratio is 1:2 to 1:1 for dolomite weathering. Similarly, the equivalent Mg2+/HCO3 ratio is 1:2 to 1:1 for dolomite weathering depending on the relative contributions of carbonic acid and strong acid, whereas for calcite weathering, this ratio is 0 to 1:2. In the plot of Ca2+ versus HCO3 (Figure 4b), a majority of the samples follow the 1:1 and 1:2 lines, indicating the contribution of both calcite and dolomite weathering to the groundwater chemistry in the study area, which is further supported by Figure 4c.
Na+ usually comes from halite (NaCl) dissolution and silicate comes from albite weathering. Furthermore, cation exchange may also be responsible for the increase in Na+ concentration in groundwater. The influence of the controlled dissolution of halite on the concentrations of Na+ and Cl was suggested by a strongly correlated relationship (r = 0.706) between Na+ versus Cl concentrations (Table 3). The dissolution of halite will release equal amounts of Na+ and Cl into the groundwater. In other words, the equivalent Na+/Cl ratio would be 1:1 if halite dissolution is the sole source of Na+ and Cl. However, higher Na+ concentrations with respect to Cl than expected from the theoretical 1:1 halite dissolution line were found in most of the groundwater samples (Figure 5a). The equivalent Na+/Cl ratio greater than 1 suggests that the groundwater underwent other processes such as silicate weathering (e.g., albite) as well as cation exchange rather than only the halite dissolution process, specifically in those samples with low Cl concentrations.
Similarly, the dissolution of gypsum and anhydrite will release equal amounts of Ca2+ and SO42− into the groundwater, which means that the equivalent Ca2+/SO42− ratio would be 1:1 if the dissolution of gypsum and anhydrite is the sole source of Ca2+ and SO42−. In the study area, the dominant source of Ca2+ provided by gypsum and anhydrite dissolution and that of Na+ provided by the dissolution of the Na2SO4 minerals mirabilite and the nardite can be deduced from the highly significant correlations between Ca2+ versus SO42− and Na+ versus SO42− (Table 3). The equivalent Ca2+/SO42− ratio of the groundwater samples usually falls on or above the theoretical 1:1 line of gypsum and anhydrite dissolution and progressively reaches the gypsum and anhydrite dissolution line as the SO42− concentrations increase (Figure 5b). This result demonstrated that gypsum dissolution might be a contributing factor to Ca2+ and SO42− in the groundwater, especially in the groundwater with high SO42− concentrations. The excess of Ca2+ over SO42− resulted from the dissolution of carbonates such as calcite and dolomite, which will release Ca2+ into the groundwater but will not release SO42−. In addition, reverse cation exchange may also increase the concentration of Ca2+ in the groundwater, in which Ca2+ adsorbed in the sediments is exchanged with Na+ in the solution.
The relationship between Ca2++Mg2+ and HCO3+SO42− indicates the contribution of the dissolution of carbonates (such as calcite and dolomite) and sulfate minerals (such as anhydrite and gypsum) to the groundwater chemistry [66]. If the dissolution of carbonates and sulfate minerals is the dominant hydrogeochemical process in the groundwater, the (Ca2++Mg2+) to (HCO3+SO42−) stoichiometric ratios in meq/L of the samples should fall along the 1:1 line. However, most groundwater samples in this study showed a deficiency of (Ca2++Mg2+) relative to (HCO3+SO42−) (Figure 6a). This result indicates that these ions were also regulated by other processes rather than only the dissolution of carbonates and sulfate minerals. The excess negative charge of (HCO3+SO42−) must be balanced by additional Na+ derived from the normal cation exchange process in the clay/weathered layer as well as silicate weathering. Although the excess (Ca2++Mg2+) over (HCO3−+SO42−) in a few samples indicates reverse cation exchange, the extent is much less. Furthermore, when cation exchange is a significant geochemical process for controlling the composition of groundwater, the relationship between (Ca2++Mg2+-HCO3-SO42−) and (Na+-Cl) should be linear with a slope of approximately −1 [67,68]. All the groundwater samples from the study area define a straight line (R2 = 0.78) with a slope of −1.01 (Figure 6b), which indicates that the cations including Na+, Ca2+ and Mg2+ participate in the ion exchange in the study area. It is also noteworthy that most samples in the study area plot within the fourth quadrant (negative ordinate and positive abscissa). This implies that there is abnormal cation exchange between Ca2+ or Mg2+ in the groundwater and Na+ and K+ in the aquifer material. In other words, a normal cation exchange reaction may be considered the dominant process that would explain an increase in Na+ related to a decrease in (Ca2+ + Mg2+). Furthermore, some samples also plot within the second quadrant (positive ordinate and negative abscissa), indicating reverse cation exchange.
In addition, the weathering of silicate minerals may be another dominant process in the study area, as shown by the dissolved silica data in Table 2. The weathering of albite and/or K-feldspar (Equations (5) and (6)) may also be responsible for the contribution of Na+ and/or K+ into the groundwater with the equivalent HCO3.
2NaAlSi3O8+2CO2+11H2O → 2Na++ 2HCO3+4H4SiO4+ Al2Si2O5(OH)4
2KAlSi3O8 + 2CO2+ 11H2O → 2K++ 2HCO3+4H4SiO4+ Al2Si2O5(OH)4
Thus, the samples plotting within the fourth quadrant (negative ordinate and positive abscissa) in the bivariate diagram of (Ca2++Mg2+-HCO3-SO42−) and (Na-Cl) may also result from the weathering of soda feldspar (albite) and/or potash feldspars (Figure 6b). The dissolved silica data and the data related to K+ and Na+ apparently support the explanation that silicate weathering influences the water chemistry in the study area (Table 2 and Table 3) [67,68].

3.3. Principal Component Analysis

The hydrogeochemical datasets of the 231 groundwater samples were subject to multivariate analysis using principal component analysis (PCA). Table 4 displays the PCA results and the factor loadings of the shallow groundwater in the Su-Xi-Chang region with varimax rotation. Three PCs (FA1, FA2 and FA3) with eigenvalues greater than one [46] were extracted and represented 73.11% of the total variance in the hydrochemistry.
FA1 was responsible for 42.18% of the total variance and had highly positive loadings of 0.880, 0.823, 0.740, 0.682, 0.879 and 0.676 in TDS, major cations (Mg2+, Na+, Ca2+) and anions (HCO3, Cl), respectively. TDS, Ca2+, Mg2+ and HCO3 are strongly associated, which represents carbonate weathering and ion exchange, as suggested by the correlation analysis. The high affiliation among TDS, Na+ and Cl may be attributed to halite dissolution. This factor is taken as a natural factor of hydrogeochemical processes and origins.
FA2 accounts for 18.85% of the total variance and is positively correlated with SO42− and NO3, displaying high loadings of 0.756 and 0.820, respectively. This factor may be attributed to acid rain and human activities (irrigation, fertilizer and manure, domestic sewage, etc.). This result is supported by the fact that significant domestic and agricultural activities, as well as acid deposition due to rapid industrialization, occur in this region [69]. This is a conspicuous factor of anthropogenic impacts that can be confirmed by the aforementioned analysis.
FA3 is dominated by H2SiO3 with a high loading of 0.948 and accounts for 12.08% of the total variance. The highly positive correlation between FA3 and H2SiO3 can be explained by the process of silicate mineral weathering, which may also be responsible for the cations and anions, as supported by the correlation analysis shown in Table 3. FA3 can be treated as a special factor of hydrogeochemical process and behavior.
The sum of the squared factor loadings for all factors for a given hydrogeochemical parameter (row) is the variance in the variable that is accounted for by all factors and this is called the communality [70]. The communality measures the percent of the variance in a given hydrogeochemical parameter jointly explained by all factors and may be interpreted as the reliability of the indicator. To obtain the variance percentage in a given hydrogeochemical parameter that is accounted for by each factor, the squared factor loadings of the given hydrogeochemical parameter for that factor were divided by the corresponding communality. As shown in Table 5, the variability in TDS may be due to the effects of minerals weathering, dissolution and ion exchange, which can explain 80% of the three factors. For Ca2+, Mg2+, HCO3, Na+ and Cl, the contribution from carbonate weathering, halite dissolution and ion exchange can represent 78% to 94% of the three factors. The effects of acid rain and/or human activities (FA2) that were attributed to SO42− and NO3 were greater than 80% relative to the other processes included in FA1 and FA3. The processes of silicate mineral weathering, dissolution, reaction, transportation and transformation in the groundwater can be divided from the main major hydrogeochemical processes given that H2SiO3 in FA3 dominated 99% of the three factors.

3.4. Anthropogenic Activities and Impacts

3.4.1. The Status of Groundwater Exploitation and Utilization

The exploitation and utilization of porous groundwater in the Su-Xi-Chang region have long histories. As early as the Warring States period more than 2000 years ago, the residents began to excavate the indigenous shaft for daily life usage with a depth of approximately 5 m. According to the survey, there are 4237 deep wells in the study area, with an annual exploitation quantity of 3.37 × 10⁸ m3, which equals 9.25 × 10⁵ m3 average daily extraction of groundwater. The exploitation of groundwater has already caused more than 10,000 km2 of regional groundwater drawdown cone and the groundwater in the center of the funnel has been drained (Figure 7).
From the view of exploited horizons, confined aquifer II is the main source of groundwater in the study area. In this aquifer, 2978 exploited wells were counted, accounting for 70.29% of the total number of wells, and the annual exploitation quantity is as high as 2.20 × 10⁸ m3, accounting for 65.43% of the total amount of exploitation in the area. Confined aquifer Ⅰ is the next most utilized source and has 973 wells, accounting for 22.96% of the total number of wells, and the annual exploitation quantity is 9.41 × 10⁷ m3, accounting for 27.93% of the total amount of exploitation. There are 286 wells and the exploitation quantity is 2.24 × 10⁷ m3 in confined aquifer III, accounting for 6.75% and 6.64% of the total number of wells and the annual total exploitation quantity, respectively.
From the perspective of utilization, the exploited deep groundwater is mainly used for industrial production, followed by domestic usage, and these factors account for 59% and 41% of the total, respectively.

3.4.2. Geological Environmental Problem: Land Subsidence

Groundwater exploitation often leads to a variety of geological and environmental problems and land subsidence is the main one in the plain region. The occurrence and development of land subsidence in the Su-Xi-Chang region are closely related to groundwater exploitation and these factors are temporally and spatially consistent (Figure 8). Before the 1980s, groundwater exploitation was mainly concentrated in the three cities of Suzhou, Wuxi and Changzhou, and so land subsidence occurred in the central city areas. After the 1990s, large-scale exploitation of groundwater occurred and ground subsidence quickly spread across the entire study area. As the scale and intensity of the exploitation increased, the groundwater table continued to decline and the rate of land subsidence also increased correspondingly.
The area of cumulative settlement that is greater than 200 mm covers more than 5770 km2, accounting for approximately 40% of the total Su-Xi-Chang region. Moreover, the 600 mm contour has been conjoined in three central cities, occupying an area of more than 1500 km2 (Figure 9).

4. Conclusions

Higher values of TDS (224.89–1086.70 mg/L), turbidity (0.1–18.60 NTU) and nitrate (0.01–154.00 mg/L) were observed in some samples according to the China groundwater quality standards and WHO drinking water standards. Furthermore, extremely high ammonia concentrations were detected and the concentration of ammonia (0.01–32.90 mg/L) had a mean value of 0.72 mg/L, which exceeded the class II groundwater quality standards in China by 36 times. Weathering, dissolution of carbonate, halite and silicate, as well as cation exchange, were suggested as the main mechanisms controlling the hydrogeochemical signatures and processes in this region. Anthropogenic activities, such as agricultural practices, waste discharge, acid rain, land use and reclamation, accompanied by rock–water interactions, were mainly responsible for the increased concentrations of ammonia, total phosphorus, sulfates and nitrates. Constant assessment and continuous monitoring of groundwater are urgently needed to safeguard the health of the communities and to ensure sustainable development in the Su-Xi-Chang region.

Author Contributions

Conceptualization, Z.S., R.M. and Y.L.; software, Z.P. and W.W.; validation, Y.L.; formal analysis, J.B., Z.S. and Y.L.; investigation, Y.L., Z.P. and W.W.; resources, Z.S. and X.G.; data curation, J.B.; writing—original draft preparation, J.B.; writing—review and editing, Z.S. and R.M.; visualization, Z.P. and W.W.; supervision, R.M.; project administration, Y.L. and X.G.; funding acquisition, J.B. All authors have read and agreed to the published version of the manuscript.

Funding

National Natural Science Foundations of China: 41722208, 41907177; Natural Science Foundation of Hubei Province: 2019CFA013.

Acknowledgments

This research was supported by the Fundamental Research Funds for the Central Universities (CUGL180817) and the Key Laboratory of Earth Fissures Geological Disaster, Ministry of Natural Resources of the People’s Republic of China.

Conflicts of Interest

The authors declare no conflict of interest.

References

  1. Harguinteguy, C.A.; Cofré, M.N.; Fernández-Cirelli, A.; Pignata, M.L. The macrophytes Potamogeton pusillus L. and Myriophyllum aquaticum (Vell.) Verdc. as potential bioindicators of a river contaminated by heavy metals. Microchem. J. 2015, 124, 228–234. [Google Scholar] [CrossRef]
  2. Hillel, N.; Geyer, S.; Licha, T.; Khayat, S.; Laronne, J.B.; Siebert, C. Water quality and discharge of the Lower Jordan River. J. Hydrol. 2015, 527, 1096–1105. [Google Scholar] [CrossRef]
  3. Palácio, S.M.; Pauli, A.R.D.; Piana, P.A.; Queiroz, C.B.; Fabris, S.C.; Fagundes-Klen, M.R.; Veit, M.T. Assessment of anthropogenic impacts on the water quality of Marreco River, Brazil, based on principal component analysis and toxicological assays. Water Air Soil Pollut. 2016, 227, 307. [Google Scholar] [CrossRef]
  4. Hanrahan, M.; Jnr, B.D. The rocky path to source water protection: A cross-case analysis of drinking water crises in small communities in Canada. Water 2017, 9, 388. [Google Scholar] [CrossRef] [Green Version]
  5. Kiedrzyńska, E.; Kiedrzyński, M.; Urbaniak, M.; Magnuszewski, A.; Skłodowski, M.; Wyrwicka, A.; Zalewski, M. Point sources of nutrient pollution in the lowland river catchment in the context of the Baltic Sea eutrophication. Ecol. Eng. 2014, 70, 337–348. [Google Scholar] [CrossRef]
  6. Qiang, F.; Tian, X.L.; Dong, L.; He, D. Simulation study of the sustainable utilization of urban water resources based on system dynamics: A case study of Jiamusi. Water Sci. Technol. Water Supply 2016, 16, 980–991. [Google Scholar] [CrossRef]
  7. Li, P.; Tian, R.; Xue, C.; Wu, J. Progress, opportunities, and key fields for groundwater quality research under the impacts of human activities in China with a special focus on western China. Environ. Sci. Pollut. Res. Int. 2017, 24, 13224. [Google Scholar] [CrossRef] [PubMed]
  8. Liao, H.; Sarver, E.; Krometis, L.H. Interactive effects of water quality, physical habitat, and watershed anthropogenic activities on stream ecosystem health. Water Res. 2017, 130, 69. [Google Scholar] [CrossRef]
  9. Hoang, H.; Duong, T.T.; Nguyen, K.T.; Le, Q.; Luu, M.; Trinh, D.A.; Le, A.H.; Ho, C.T.; Dang, K.D.; Némery, J. Impact of anthropogenic activities on water quality and plankton communities in the Day River (Red River Delta, Vietnam). Environ. Monit. Assess. 2018, 190, 67. [Google Scholar] [CrossRef]
  10. Carpenter, S.R.; Caraco, N.F.; Correll, D.L.; Howarth, R.W.; Sharpley, A.N.; Smith, V.H. Non-point pollution of surface waters eith phosphorus and nitrogen. Ecol. Appl. 1998, 8, 559–568. [Google Scholar] [CrossRef]
  11. Huang, J.; Du, P. Assessment of temporal and spatial variation of coastal water quality and source identification along Macau peninsula. Stoch. Environ. Res. Risk Assess. 2011, 25, 353–361. [Google Scholar] [CrossRef]
  12. Mouri, G.; Takizawa, S.; Oki, T. Spatial and temporal variation in nutrient parameters in stream water in a rural-urban catchment, Shikoku, Japan: Effects of land cover and human impact. J. Environ. Manag. 2011, 92, 1837. [Google Scholar] [CrossRef] [PubMed]
  13. Rahman, A. A GIS based DRASTIC model for assessing groundwater vulnerability in shallow aquifer in Aligarh, India. Appl. Geogr. 2008, 28, 32–53. [Google Scholar] [CrossRef]
  14. Gao, X.; Bai, Y.; Huo, Z.; Xu, X.; Huang, G.; Xia, Y.; Steenhuis, T.S. Deficit irrigation enhances contribution of shallow groundwater to crop water consumption in arid area. Agric. Water Manag. 2017, 185, 116–125. [Google Scholar] [CrossRef]
  15. Leite, N.K.; Stolberg, J.; Cruz, S.P.D.; Tavela, A.D.O.; Safanelli, J.L.; Marchini, H.R.; Exterkoetter, R.; Leite, G.M.C.; Krusche, A.V.; Johnson, M.S. Hydrochemistry of shallow groundwater and springs used for potable supply in Southern Brazil. Environ. Earth Sci. 2018, 77, 80. [Google Scholar] [CrossRef]
  16. Chen, A.; Lei, B.; Hu, W.; Wang, H.; Zhai, L.; Mao, Y.; Fu, B.; Zhang, D. Temporal-spatial variations and influencing factors of nitrogen in the shallow groundwater of the nearshore vegetable field of Erhai Lake, China. Environ. Sci. Pollut. Res. 2018, 25, 4858–4870. [Google Scholar] [CrossRef]
  17. Wang, Z.R.; Tian, X.; Wu, X. Hydrochemical characteristics and quality assessment of shallow groundwater and CBM co-produced water in the Shizhuangnan block, Qinshui Basin, China. Environ. Earth Sci. 2018, 77, 57. [Google Scholar] [CrossRef]
  18. Wu, J.; Sun, Z. Evaluation of shallow groundwater contamination and associated human health risk in an alluvial plain impacted by agricultural and industrial activities, Mid-west China. Expo. Health 2016, 8, 311–329. [Google Scholar] [CrossRef]
  19. Baker, A. Land use and water quality. Hydrol. Process. 2003, 17, 2499–2501. [Google Scholar] [CrossRef]
  20. He, C.; Malcolm, S.B.; Dahlberg, K.A.; Fu, B. A conceptual framework for integrating hydrological and biological indicators into watershed management. Landsc. Urban Plan. 2000, 49, 25–34. [Google Scholar] [CrossRef]
  21. Sun, R.H.; Wang, Z.M.; Chen, L.D. Assessment of surface water quality at large watershed scale: Land-use, anthropogenic, and administrative impacts. J. Am. Water Resour. Assoc. 2013, 49, 741–752. [Google Scholar] [CrossRef]
  22. Shi, X.Q.; Xue, Y.Q.; Ye, S.J.; Wu, J.C.; Zhang, Y.; Yu, J. Characterization of land subsidence induced by groundwater withdrawals in Su-Xi-Chang area, China. Environ. Geol. 2007, 52, 27–40. [Google Scholar] [CrossRef]
  23. Shi, X.; Wu, J.; Ye, S.; Zhang, Y.; Xue, Y.; Wei, Z.; Li, Q.; Yu, J. Regional land subsidence simulation in Su-Xi-Chang area and Shanghai City, China. Eng. Geol. 2008, 100, 27–42. [Google Scholar] [CrossRef]
  24. Wu, J.C.; Shi, X.Q.; Ye, S.J.; Xue, Y.Q.; Zhang, Y.; Yu, J. Numerical simulation of land subsidence induced by groundwater overexploitation in Su-Xi-Chang area, China. Environ. Geol. 2009, 57, 1409–1421. [Google Scholar] [CrossRef]
  25. Yun, Z.; Xue, Y.Q.; Wu, J.C.; Shi, X.Q.; Yu, J. Excessive groundwater withdrawal and resultant land subsidence in the Su-Xi-Chang area, China. Environ. Earth Sci. 2010, 61, 1135–1143. [Google Scholar]
  26. Fohrer, N. Assessment of anthropogenic impacts on water quality. Phys. Chem. Earth 2005, 30, 471. [Google Scholar] [CrossRef]
  27. Simeonov, V.; Stratis, J.A.; Samara, C.; Zachariadis, G.; Voutsa, D.; Anthemidis, A.; Sofoniou, M.; Kouimtzis, T. Assessment of the surface water quality in Northern Greece. Water Res. 2003, 37, 4119. [Google Scholar] [CrossRef]
  28. Singh, K.P.; Malik, A.; Mohan, D.; Sinha, S. Multivariate statistical techniques for the evaluation of spatial and temporal variations in water quality of Gomti River (India)—A case study. Water Res. 2004, 38, 3980. [Google Scholar] [CrossRef]
  29. Vega, M.; Pardo, R.; Barrado, E.; Debán, L. Assessment of seasonal and polluting effects on the quality of river water by exploratory data analysis. Water Res. 1998, 32, 3581–3592. [Google Scholar] [CrossRef]
  30. Tong, S.T.; Chen, W. Modeling the relationship between land use and surface water quality. J. Environ. Manag. 2002, 66, 377. [Google Scholar] [CrossRef]
  31. Preston, S.D.; Alexander, R.B.; Schwarz, G.E.; Crawford, C.G. Factors affecting stream nutrient loads: A synthesis of regional SPARROW model results for the continental United States. J. Am. Water Resour. Assoc. 2011, 47, 891. [Google Scholar] [CrossRef] [PubMed] [Green Version]
  32. Smith, R.A.; Schwarz, G.E.; Alexander, R.B. Regional interpretation of water-quality monitoring data. Water Resour. Res. 1997, 33, 2781–2798. [Google Scholar] [CrossRef] [Green Version]
  33. Gémesi, Z.; Downing, J.A.; Cruse, R.M.; Anderson, P.F. Effects of watershed configuration and composition on downstream lake water quality. J. Environ. Qual. 2011, 40, 517–527. [Google Scholar] [CrossRef] [PubMed]
  34. Lu, P.; Mei, K.; Zhang, Y.; Liao, L.; Long, B.; Dahlgren, R.A.; Zhang, M. Spatial and temporal variations of nitrogen pollution in Wen-Rui Tang River watershed, Zhejiang, China. Environ. Monit. Assess. 2011, 180, 501–520. [Google Scholar] [CrossRef] [Green Version]
  35. Shrestha, S.; Kazama, F. Assessment of surface water quality using multivariate statistical techniques: A case study of the Fuji river basin, Japan. Environ. Model. Softw. 2007, 22, 464–475. [Google Scholar] [CrossRef]
  36. Wise, D.R.; Johnson, H.M. Surface-water nutrient conditions and sources in the United States Pacific Northwest. J. Am. Water Resour. Assoc. 2011, 47, 1110. [Google Scholar] [CrossRef]
  37. Long, H.; Liu, Y.; Wu, X.; Dong, G. Spatio-temporal dynamic patterns of farmland and rural settlements in Su–Xi–Chang region: Implications for building a new countryside in coastal China. Land Use Policy 2009, 26, 322–333. [Google Scholar] [CrossRef]
  38. Zhang, Y.; Wang, Z.; Xue, Y.; Wu, J.; Yu, J. Mechanisms for earth fissure formation due to groundwater extraction in the Su-Xi-Chang area, China. Bull. Eng. Geol. Environ. 2016, 75, 745–760. [Google Scholar] [CrossRef]
  39. Cuoco, E.; Darrah, T.H.; Buono, G.; Eymold, W.K.; Tedesco, D. Differentiating natural and anthropogenic impacts on water quality in a hydrothermal coastal aquifer (Mondragone Plain, Southern Italy). Environ. Earth Sci. 2015, 73, 7115–7134. [Google Scholar] [CrossRef]
  40. Mapoma, H.W.T.; Xie, X.; Liu, Y.; Zhu, Y.; Kawaye, F.P.; Kayira, T.M. Hydrochemistry and quality of groundwater in alluvial aquifer of Karonga, Malawi. Environ. Earth Sci. 2017, 76, 335. [Google Scholar] [CrossRef]
  41. APHA/AWWA/WEF. Standard Methods for the Examination of Water and Wastewater, 21st ed.; American Public Health Association: Washington, DC, USA, 2005. [Google Scholar]
  42. Bu, J.W.; Sun, Z.Y.; Zhou, A.G.; Xu, Y.N.; Ma, R.; Wei, W.H.; Liu, M. Heavy metals in surface soils in the upper reaches of the Heihe River, northeastern Tibetan Plateau, China. Int. J. Environ. Res. Public Health 2016, 13, 247. [Google Scholar] [CrossRef] [Green Version]
  43. Loska, K.; Wiechuła, D. Application of principal component analysis for the estimation of source of heavy metal contamination in surface sediments from the Rybnik Reservoir. Chemosphere 2003, 51, 723–733. [Google Scholar] [CrossRef]
  44. Ma, H.; Liu, L.; Chen, T. Water security assessment in Haihe River Basin using principal component analysis based on Kendall tau. Environ. Monit. Assess. 2010, 163, 539. [Google Scholar] [CrossRef]
  45. Han, Y.M.; Du, P.X.; Cao, J.J.; Posmentier, E.S. Multivariate analysis of heavy metal contamination in urban dusts of Xi’an, Central China. Sci. Total Environ. 2006, 355, 176–186. [Google Scholar]
  46. Kaiser, H.F. The application of electronic computers to factor analysis. Educ. Psychol. Meas. 1960, 20, 141–151. [Google Scholar] [CrossRef]
  47. CSBTS (China State Bureau of Technical Supervision). Quality standard for ground water (GB/T 14848-93). 1993. Available online: https://www.chinesestandard.net/PDF/English.aspx/GBT14848-1993 (accessed on 17 December 2019).
  48. MH (Ministry of Health of China). Standards for Drinking Water Qual. (GB 5749-2006). 2006. Available online: http://tradechina.dairyaustralia.com.au/wp-content/uploads/2018/08/GB-5749-2006-Standards-for-Drinking-Water-Quality.pdf (accessed on 17 December 2019).
  49. WHO (World Health Organization). Guidelines for Drinking-Water Quality, 4rd ed.; World Health Organization: Geneva, Switzerland, 2011. [Google Scholar]
  50. SEPA (State Environmental Protection Administration of China). Environmental Quality Standards for Surface Water (GB 3838-2002). 2002. Available online: https://www.codeofchina.com/standard/GB3838-2002.html (accessed on 17 December 2019).
  51. Dong, Z.H.; Ji, L.I.; Sun, L.M. Nitrate contamination in the groundwater of intensive vegetable cultivation areas in Shouguang City, Shandong Province, China. J. Agro-Environ. Sci. 2005, 24, 1139–1144. [Google Scholar]
  52. Jin, Z.; Pan, Z.; Jin, M.; Li, F.; Wan, Y.; Gu, B. Determination of nitrate contamination sources using isotopic and chemical indicators in an agricultural region in China. Agric. Ecosyst. Environ. 2012, 155, 78–86. [Google Scholar] [CrossRef]
  53. Ju, X.T.; Kou, C.L.; Zhang, F.S.; Christie, P. Nitrogen balance and groundwater nitrate contamination: Comparison among three intensive cropping systems on the North China Plain. Environ. Pollut. 2006, 143, 117–125. [Google Scholar] [CrossRef] [Green Version]
  54. Su, X.S.; Wang, H.; Zhang, Y.L. Health risk assessment of nitrate contamination in groundwater: A case study of an agricultural area in Northeast China. Water Resour. Manag. 2013, 27, 3025–3034. [Google Scholar] [CrossRef]
  55. Yang, R.; Liu, W.J. Nitrate contamination of groundwater in an agroecosystem in Zhangye Oasis, Northwest China. Environ. Earth Sci. 2010, 61, 123–129. [Google Scholar] [CrossRef]
  56. Marandi, A.; Shand, P. Groundwater chemistry and the Gibbs Diagram. Appl. Geochem. 2018, 97, 209–212. [Google Scholar] [CrossRef]
  57. Banks, D.; Frengstad, B. Evolution of groundwater chemical composition by plagioclase hydrolysis in Norwegian anorthosites. Geochim. Cosmochim. Acta 2006, 70, 1337–1355. [Google Scholar] [CrossRef]
  58. Pablo, H.T.F.; Chacón–Moscoso, S.; Barbero–García, I.; Vila–Abad, E. Polychoric versus Pearson correlations in exploratory and confirmatory factor analysis of ordinal variables. Qual. Quant. 2010, 44, 153–166. [Google Scholar]
  59. Adams, S.; Titus, R.; Pietersen, K.; Tredoux, G.; Harris, C. Hydrochemical characteristics of aquifers near Sutherland in the Western Karoo, South Africa. J. Hydrol. 2001, 241, 91–103. [Google Scholar] [CrossRef] [Green Version]
  60. Ly, A.; Marsman, M.; Wagenmakers, E.J. Analytic posteriors for Pearson’s correlation coefficient. Stat. Neerl. 2018, 72, 4–13. [Google Scholar] [CrossRef]
  61. An, Y.; Lu, W. Hydrogeochemical processes identification and groundwater pollution causes analysis in the northern Ordos Cretaceous Basin, China. Environ. Geochem. Health 2017, 40, 1209–1219. [Google Scholar] [CrossRef]
  62. Li, Z.; Wang, G.; Wang, X.; Wan, L.; Shi, Z.; Wanke, H.; Uugulu, S.; Uahengo, C.-I. Groundwater quality and associated hydrogeochemical processes in Northwest Namibia. J. Geochem. Explor. 2018, 186, 202–214. [Google Scholar] [CrossRef]
  63. Wang, W.; Song, X.; Ma, Y. Characterization of controlling hydrogeochemical processes using factor analysis in Puyang Yellow River irrigation district (China). Hydrol. Res. 2017, 48, 1438–1454. [Google Scholar] [CrossRef]
  64. Keita, S.; Tang, Z. The assessment of processes controlling the spatial distribution of hydrogeochemical groundwater types in Mali using multivariate statistics. J. Afr. Earth Sci. 2017, 134, 573–589. [Google Scholar] [CrossRef]
  65. El Alfy, M.; Lashin, A.; Abdalla, F.; Al-Bassam, A. Assessing the hydrogeochemical processes affecting groundwater pollution in arid areas using an integration of geochemical equilibrium and multivariate statistical techniques. Environ. Poll. 2017, 229, 760–770. [Google Scholar] [CrossRef]
  66. Sánchez, E.R.S.; Hoyos, S.E.G.; Esteller, M.V.; Morales, M.M.; Astudillo, A.O. Hydrogeochemistry and water-rock interactions in the urban area of Puebla Valley aquifer (Mexico). J. Geochem. Explor. 2017, 181, 219–235. [Google Scholar] [CrossRef]
  67. Subramani, T.; Rajmohan, N.; Elango, L. Groundwater geochemistry and identification of hydrogeochemical processes in a hard rock region, Southern India. Environ. Monit. Assess. 2010, 162, 123. [Google Scholar] [CrossRef]
  68. Ahmed, M.A.; Samie, S.G.A.; Badawy, H.A. Factors controlling mechanisms of groundwater salinization and hydrogeochemical processes in the Quaternary aquifer of the Eastern Nile Delta, Egypt. Environ. Earth Sci. 2013, 68, 369–394. [Google Scholar] [CrossRef]
  69. Larssen, T.; Lydersen, E.; Tang, D.; He, Y.; Gao, J.; Liu, H.; Duan, L.; Seip, H.M.; Vogt, R.D.; Mulder, J. Acid rain in China. Environ. Sci. Technol. 2006, 40, 418. [Google Scholar] [CrossRef] [PubMed] [Green Version]
  70. Kenny, D.A. Statistics for the Social and Behavioral Sciences; Little, Brown and Company: Boston, MA, USA, 1986. [Google Scholar]
Figure 1. The geographic location of the Su-Xi-Chang region with the sampling sites.
Ijerph 17 01267 g001
Figure 2. Hydrogeological profile of the Quaternary phreatic and confined aquifers.
Ijerph 17 01267 g002
Figure 3. Gibbs diagrams for the shallow groundwater in the Su-Xi-Chang region.
Ijerph 17 01267 g003
Figure 4. Bivariate diagrams of carbonate weathering and dissolution (a), calcite and dolomite weathering and dissolution (b,c).
Ijerph 17 01267 g004
Figure 5. Bivariate diagrams of halite (a) and gypsum/anhydrite (b) weathering and dissolution.
Ijerph 17 01267 g005
Figure 6. Multivariate diagrams of carbonate and sulfate weathering and dissolution (a), cation exchange (b).
Ijerph 17 01267 g006
Figure 7. Contour plot of the groundwater table in the Su-Xi-Chang region (2015).
Ijerph 17 01267 g007
Figure 8. Relationship among groundwater exploitation amount, groundwater depth and settlement amount of land subsidence in the Su-Xi-Chang region.
Ijerph 17 01267 g008
Figure 9. Land subsidence contour plot of cumulative settlement amount in the Su-Xi-Chang region (2015).
Ijerph 17 01267 g009
Table 1. Statistical summary of the physicochemical parameters of shallow groundwater in the Su-Xi-Chang region.
ParameterMin.Max.MeanQSGW aEQSSW bSDWQ cGDWQ d
Temperature (°C)11.0022.5016.89n.s.n.s.n.s.n.s.
EC (μS cm−1)120.002850.001031.26n.s.n.s.n.s.n.s.
pH5.597.827.006.5–8.56–96.5–8.56.5–8.5
TDS (mg L−1)224.891086.70616.69≤500n.s.≤1000≤1000
Turbidity (NTU)0.118.603.85≤3n.s.≤1≤1
DO (mg O2 L−1)0.035.510.97n.s.≥6n.s.n.s.
Ammonia (mg N L−1)0.0132.900.72≤0.02≤0.5≤0.5n.s.
TP (mg P L−1)0.012.020.15n.s.≤0.1n.s.n.s.
n.s. not specified; a Quality standard for groundwater, class II (GB/T 14848-93 [47]); b Environmental quality standards for surface water, class II (GB 3838-2002 [50]); c Standards for drinking water quality (GB 5749-2006 [48]); d Guidelines for drinking-water quality [49].
Table 2. Statistical summary of the hydrogeochemical parameters of the shallow groundwater in the Su-Xi-Chang region.
ParameterMin.Max.MeanSDSkewnessKurtosis
Ca2+26.20162.0090.0928.930.26−0.50
Mg2+6.0764.0030.2311.860.58−0.07
Na+8.32159.0072.6329.230.630.05
Cl7.96191.0084.3936.180.790.28
SO42−2.45187.0089.4039.040.34−0.17
HCO3113.00706.00353.70132.670.64−0.25
NO30.01154.0022.0726.852.044.73
H2SiO311.1055.4025.146.871.313.01
Units for all chemical indices are mg/L except pH, SD (standard derivation).
Table 3. Pearson correlation (r) for the hydrogeochemical parameters of the shallow groundwater in the Su-Xi-Chang region.
ParameterpHTDSCa2+Mg2+Na+ClSO42−HCO3NO3SiO2
pH10.136 *0.0210.1290.170 **0.211 **0.1080.0480.0440.080
TDS0.136 *10.745 **0.651 **0.705 **0.695 **0.538 **0.701 **0.311 **0.163 *
Ca2+0.0210.745 **10.424 **0.262 **0.395 **0.421 **0.666 **0.247 **0.064
Mg2+0.1290.651 **0.424 **10.442 **0.466 **0.246 **0.710 **−0.019−0.037
Na+0.170 **0.705 **0.262 **0.442 **10.706 **0.329 **0.526 **0.0100.112
Cl0.211 **0.695 **0.395 **0.466 **0.706 **10.345 **0.311 **0.1090.109
SO42−0.1080.538 **0.421 **0.246 **0.329 **0.345 **10.0080.343 **−0.141 *
HCO30.0480.701 **0.666 **0.710 **0.526 **0.311 **0.0081−0.0930.121
NO30.0440.311 **0.247 **−0.0190.0100.1090.343 **−0.09310.005
H2SiO30.0800.163 *0.064−0.0370.1120.109−0.141 *0.1210.0051
**: Correlation is significant at the 0.01 level (two-tailed); *: Correlation is significant at the 0.05 level (two-tailed).
Table 4. Rotated component matrix for hydrogeochemical parameters.
ParameterFactorsCommunality
FA1FA2FA3
TDS0.8800.4090.1200.956
Ca2+0.6820.340−0.0410.582
Mg2+0.823−0.076−0.1970.722
Na+0.7400.1300.1900.600
Cl0.6760.2970.1980.584
SO42−0.3050.756−0.2260.717
HCO30.879−0.2340.0080.828
NO3−0.0520.8200.0890.683
H2SiO30.083−0.0570.9480.908
Eigenvalues3.7961.6971.087-
% of Variance42.17518.85312.078-
Cumulative %42.17561.02873.106-
Extraction method: Principal component analysis. Rotation method: Varimax with Kaiser normalization.
Table 5. The percent of variance in a given hydrogeochemical parameter accounted for by each factor.
FactorsTDSCa2+Mg2+Na+ClSO42−HCO3NO3H2SiO3
FA10.810.800.940.910.780.130.930.000.01
FA20.180.200.010.030.150.800.070.980.00
FA30.020.000.050.060.070.070.000.010.99

