Identification of Priority Areas for Soil and Water Conservation Planning Based on Multi-Criteria Decision Analysis Using Choquet Integral

 ,
,
Abstract
:1. Introduction
2. Materials and Methods
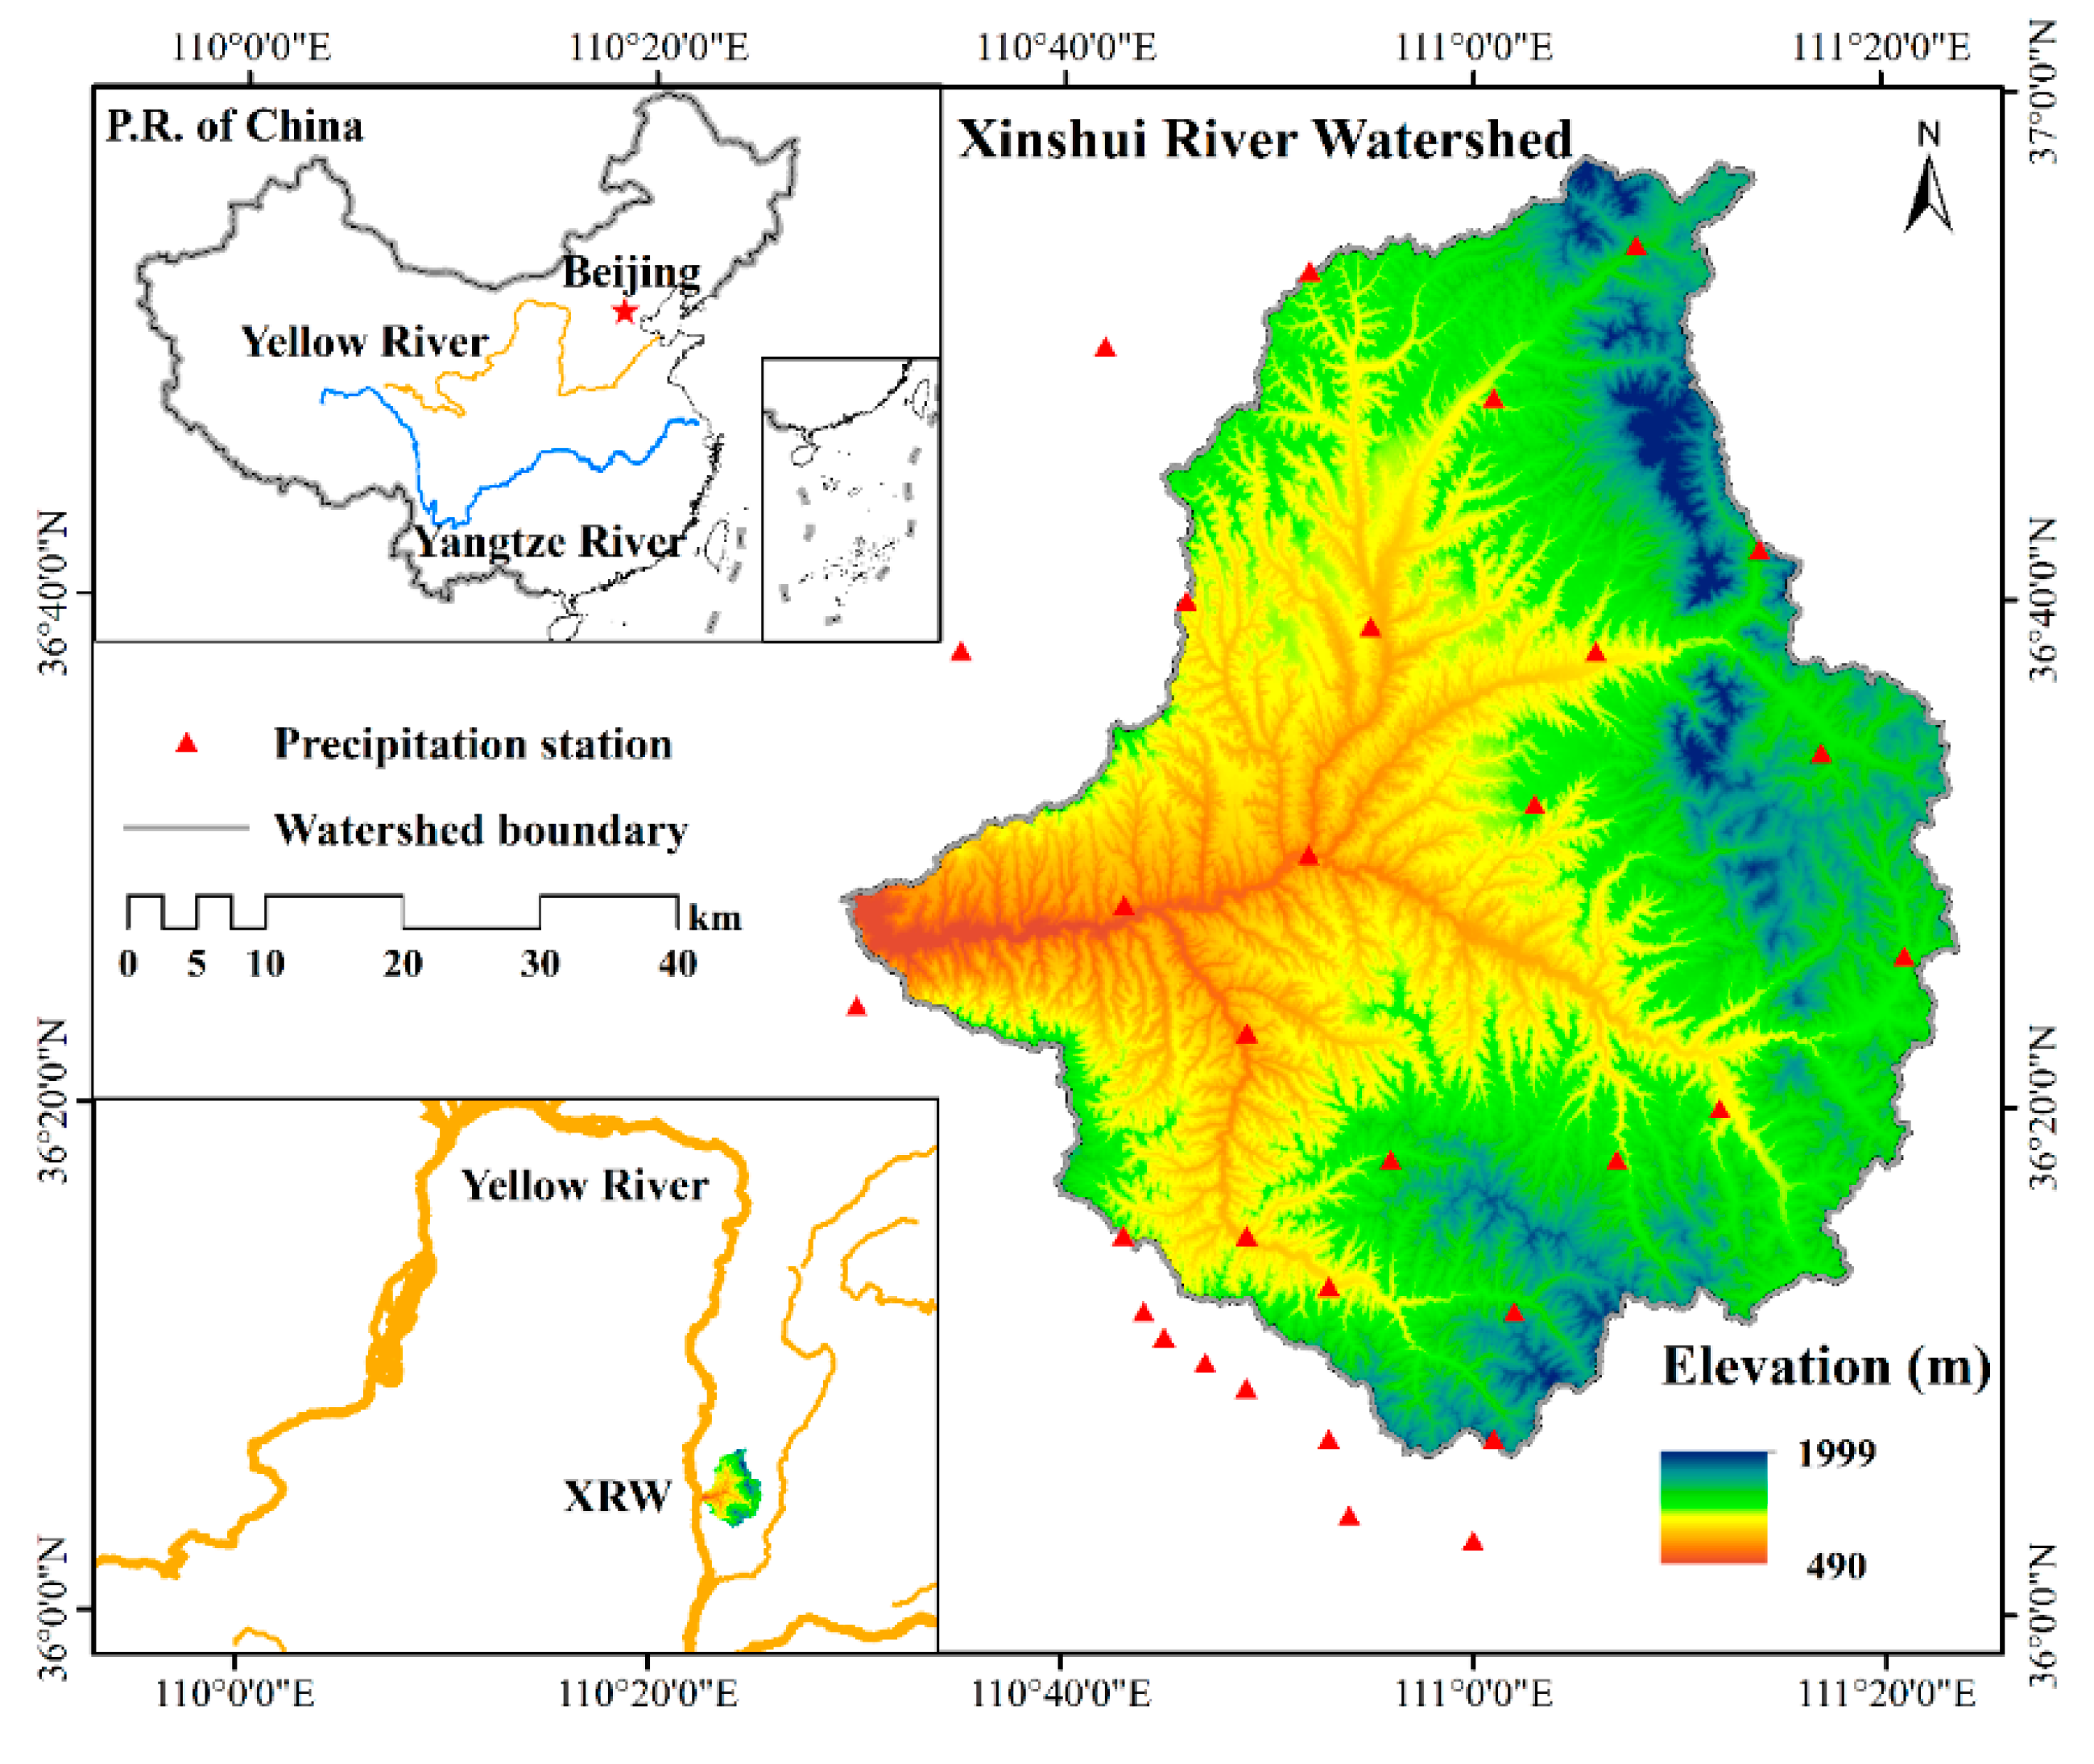
2.1. Study Area
2.2. Data Sources
2.3. Field Investigations
2.4. Soil and Water Conservation Patch (SWCP)
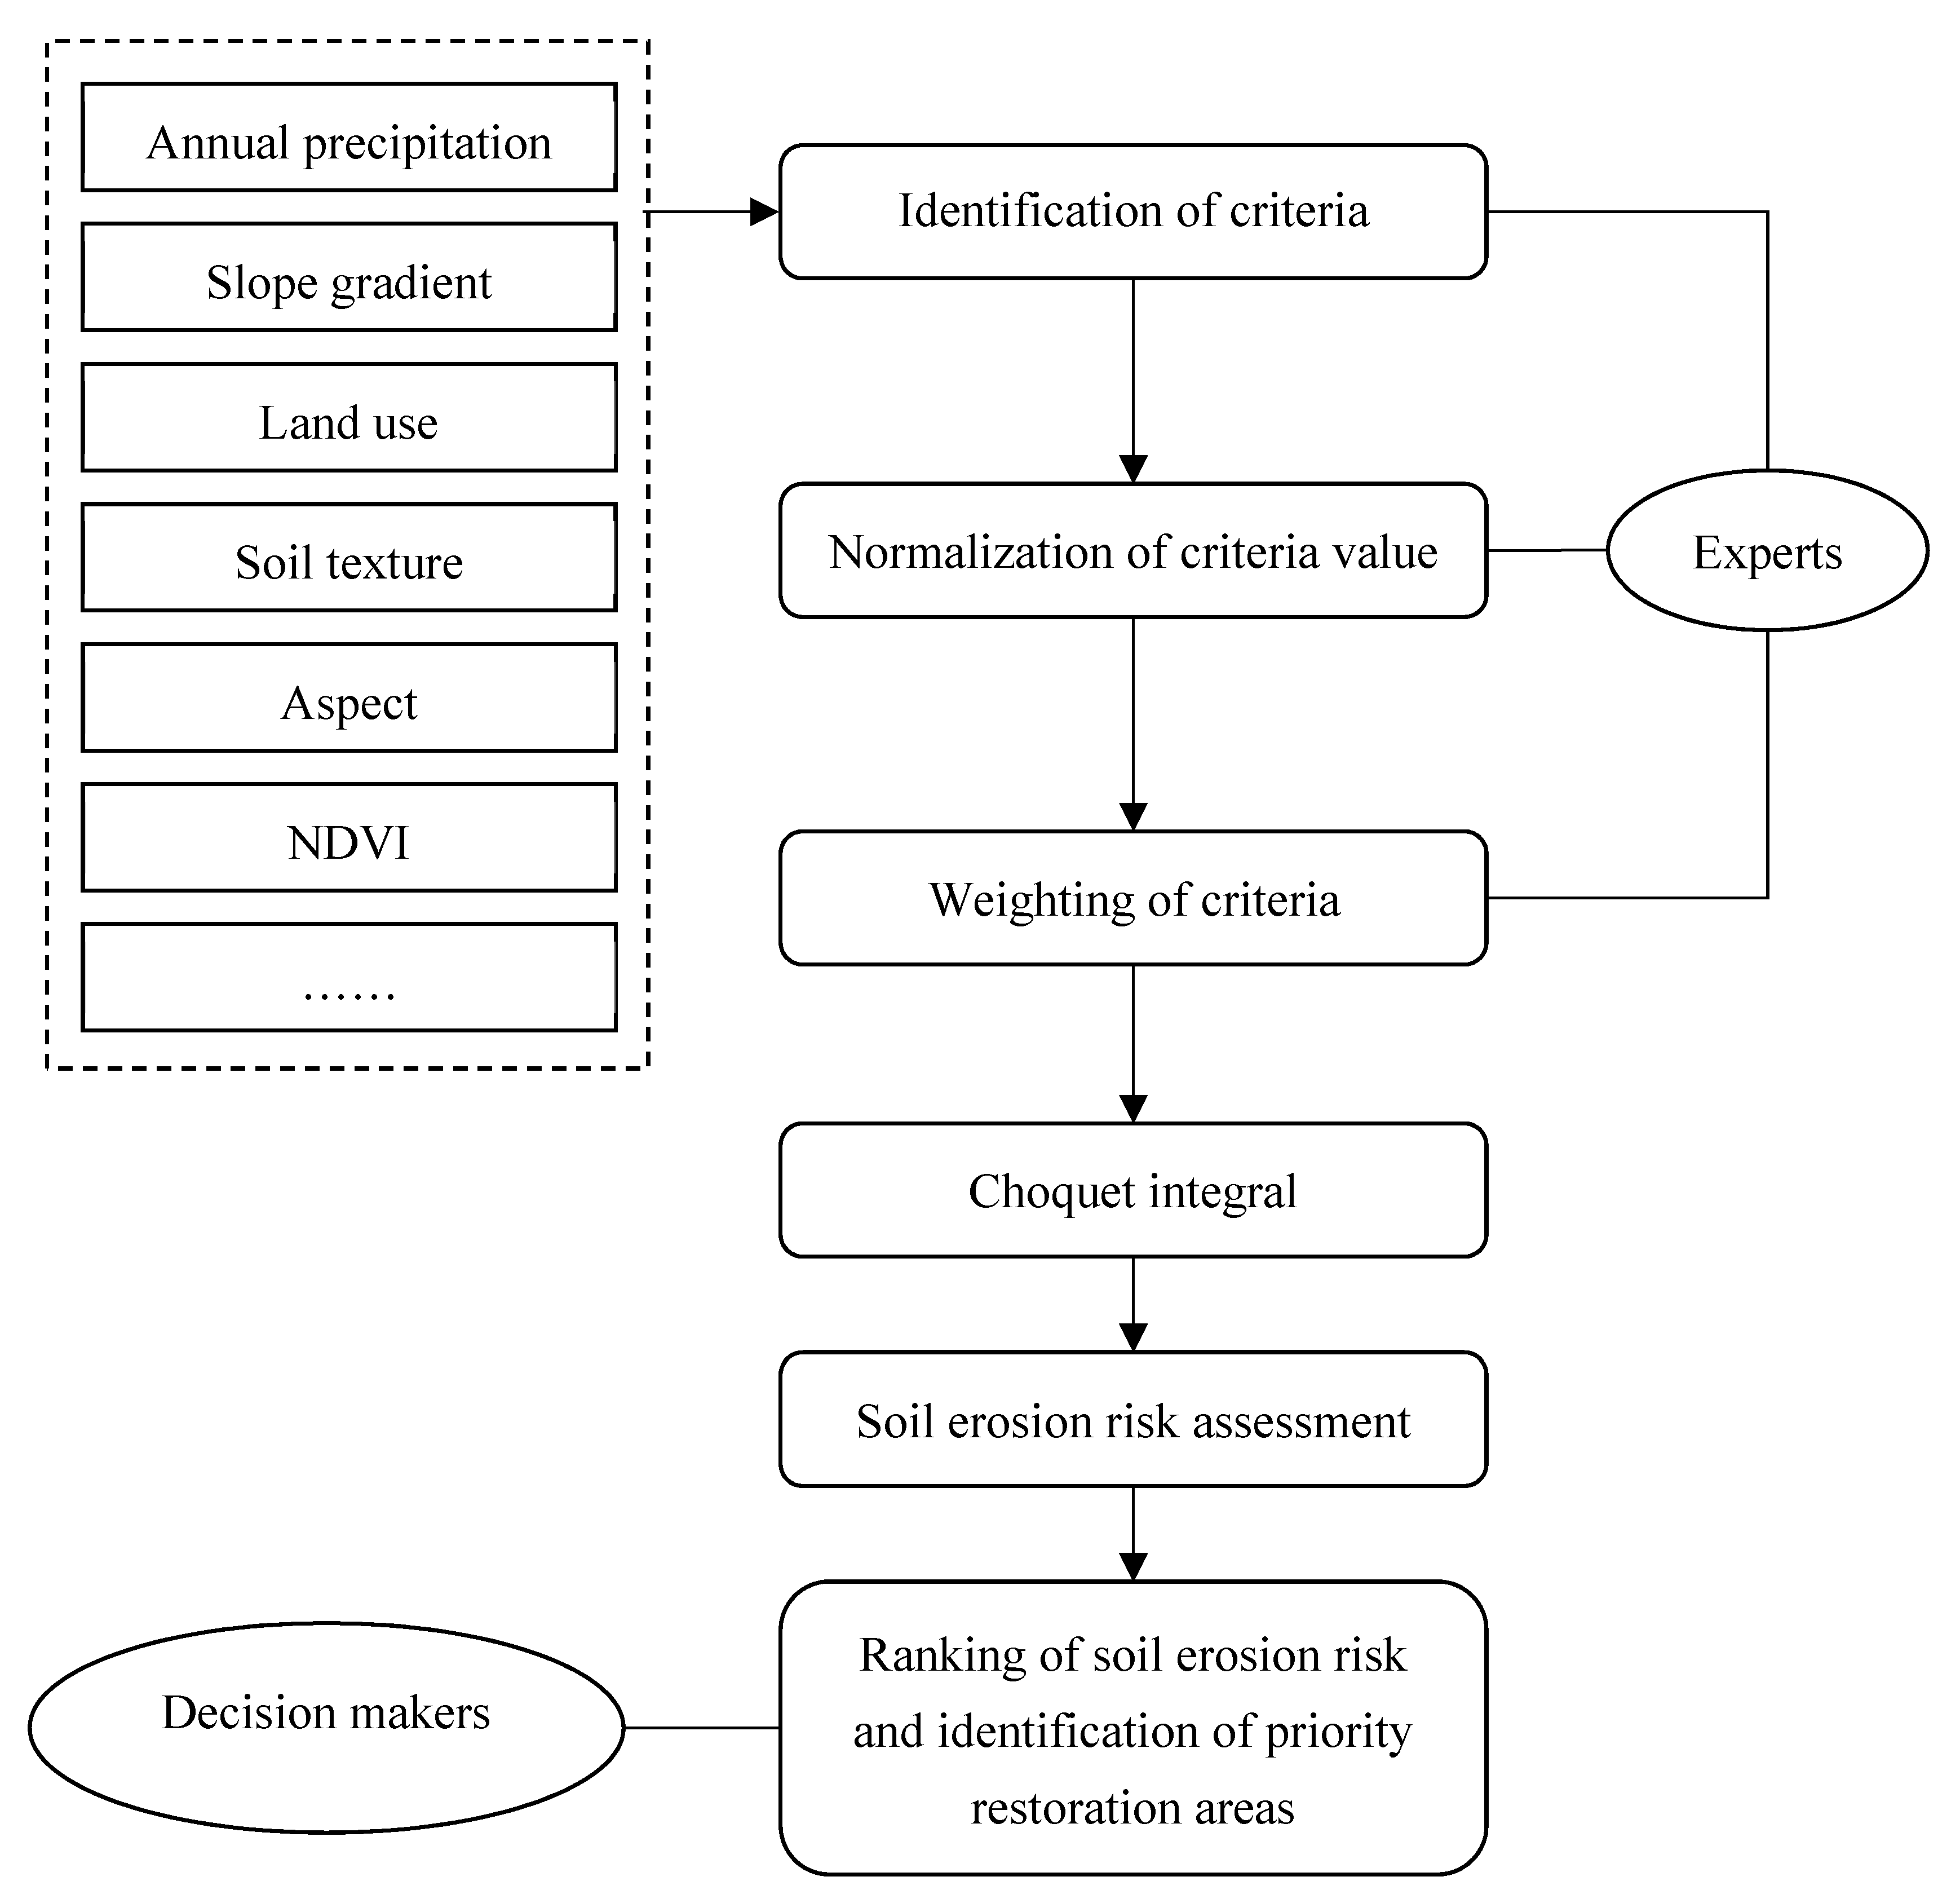
2.5. MCDA Method
2.5.1. Identification of Criteria
2.5.2. Normalization of Criteria Value
2.5.3. Aggregation of Attribute Values
Sub-additive if: m(S ∪ T) < m(S) + m(T), redundant effect,
Super-additive if: m(S ∪ T) > m(S) + m(T), synergic effect,
3. Results and Discussion
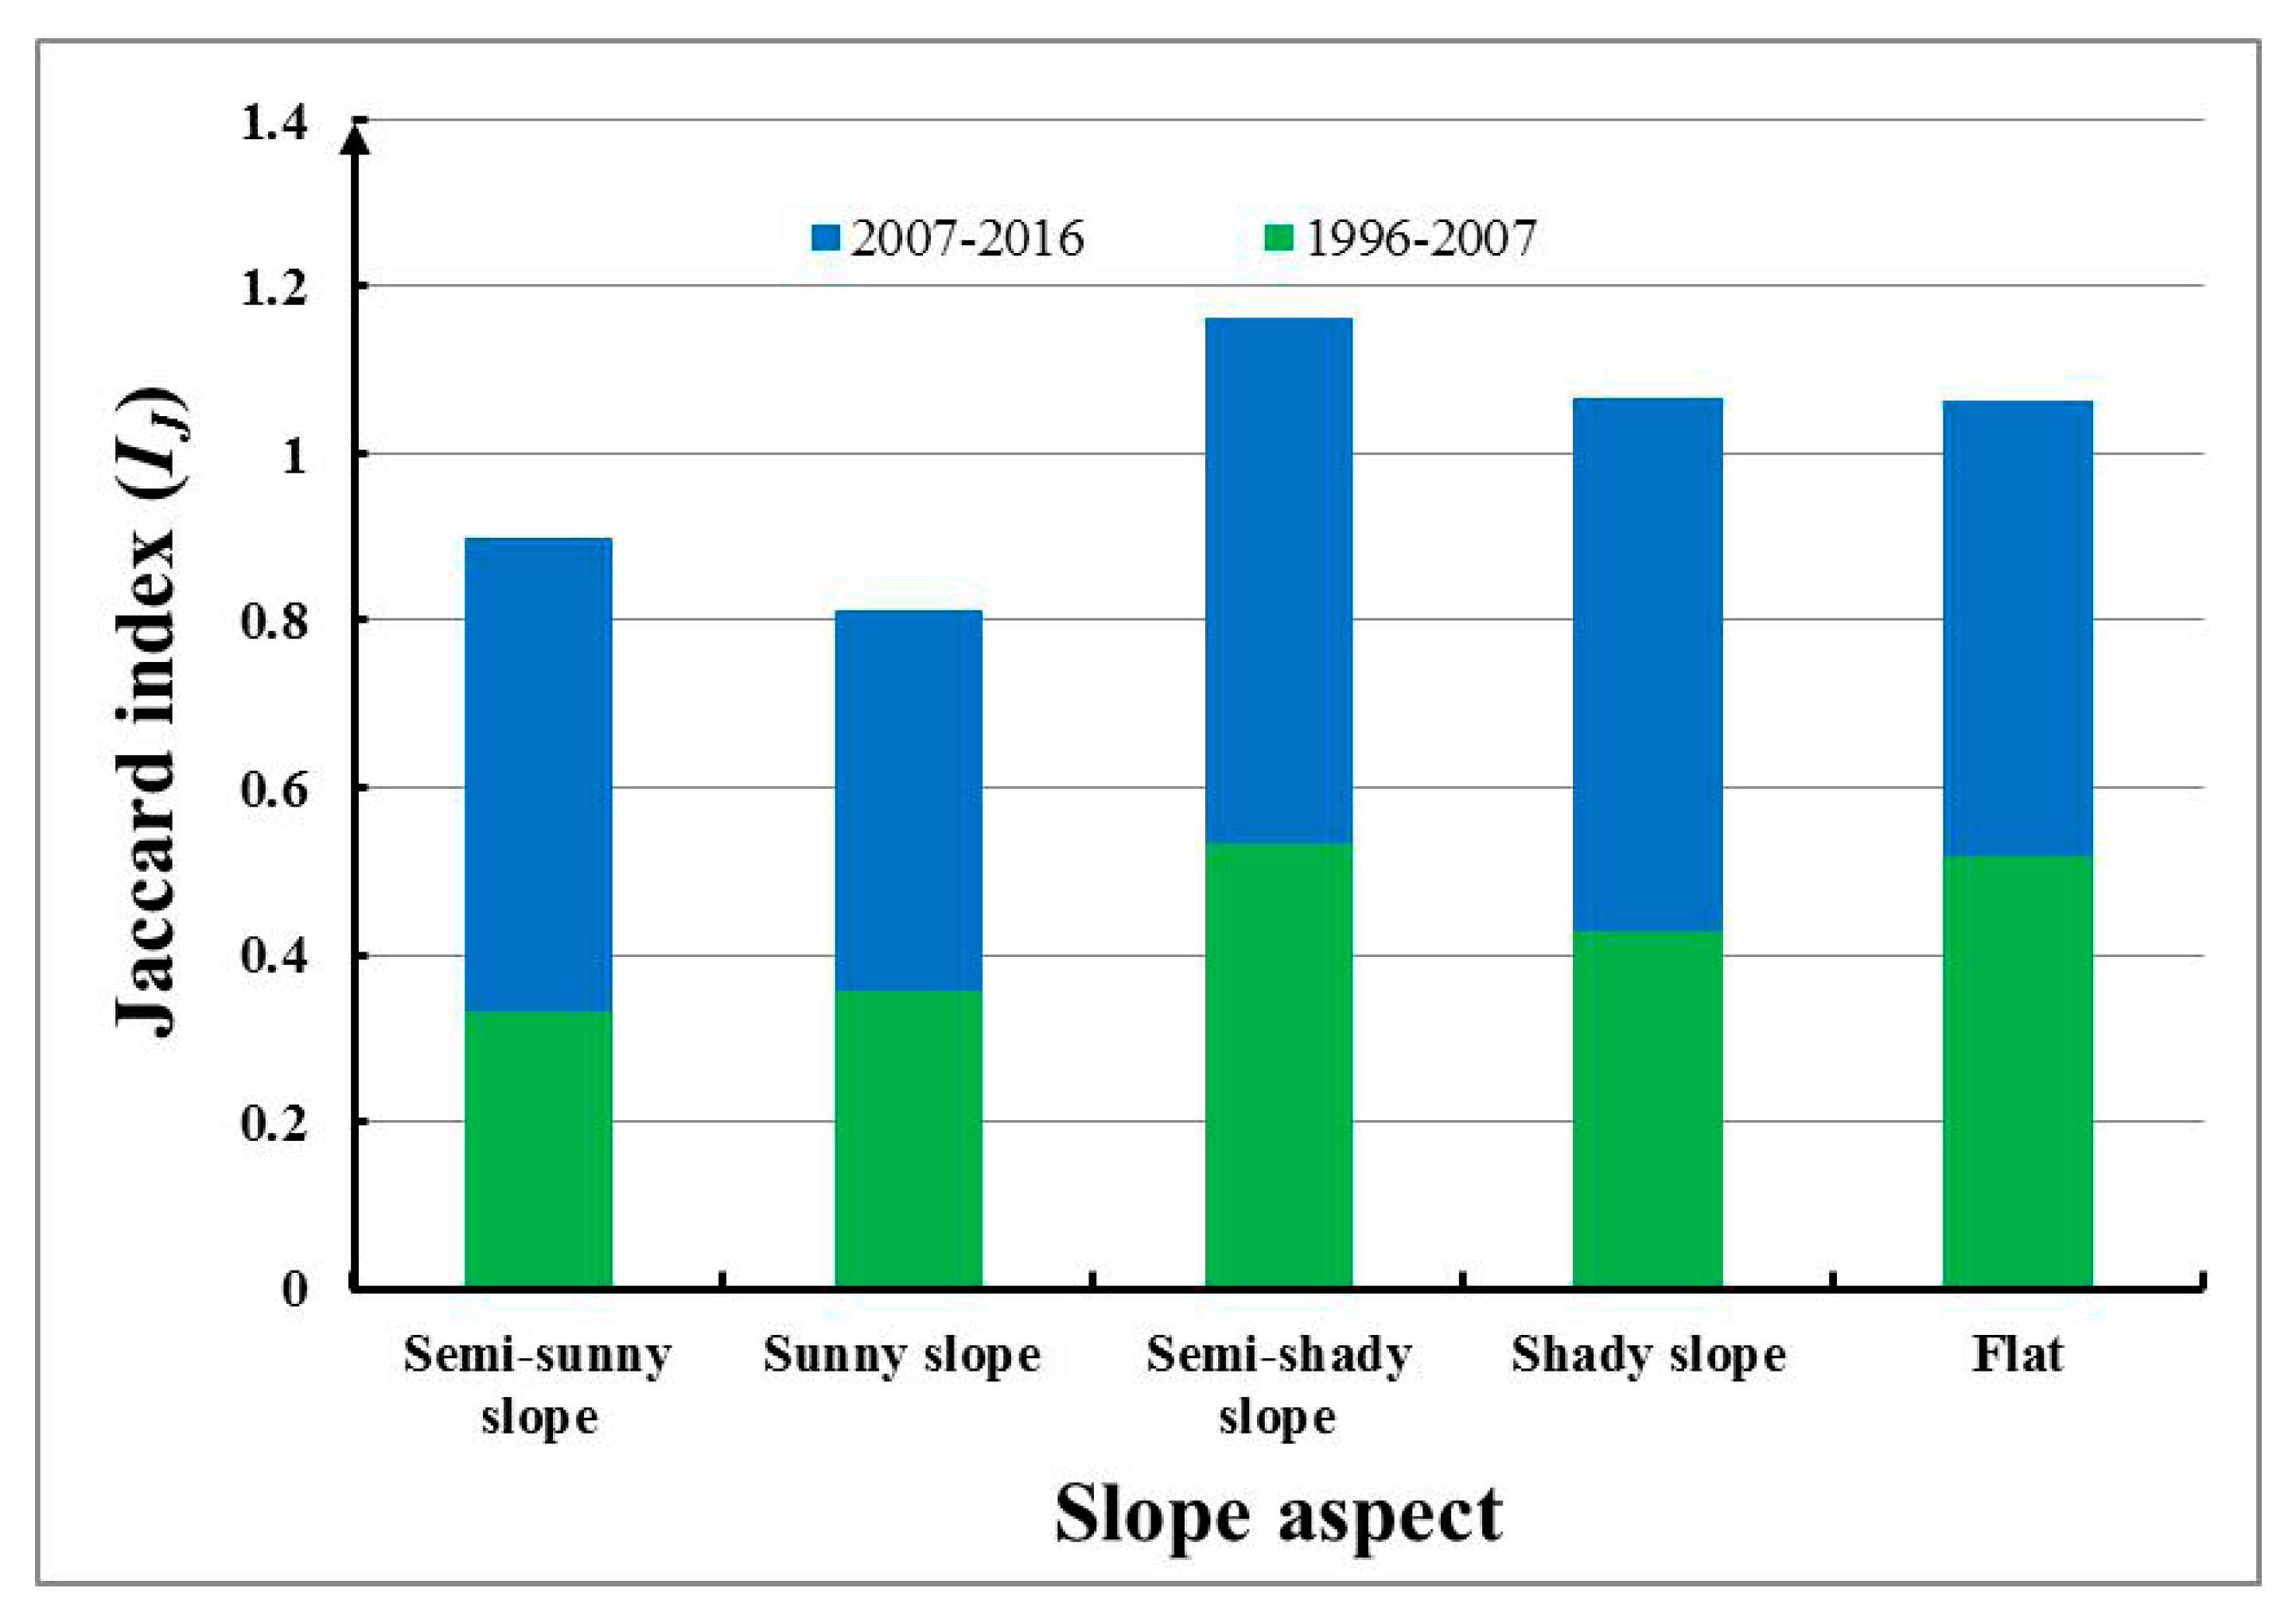
3.1. Relationship between the Slope Aspect and Community Characteristics
3.2. Soil Erosion Risk Attributes
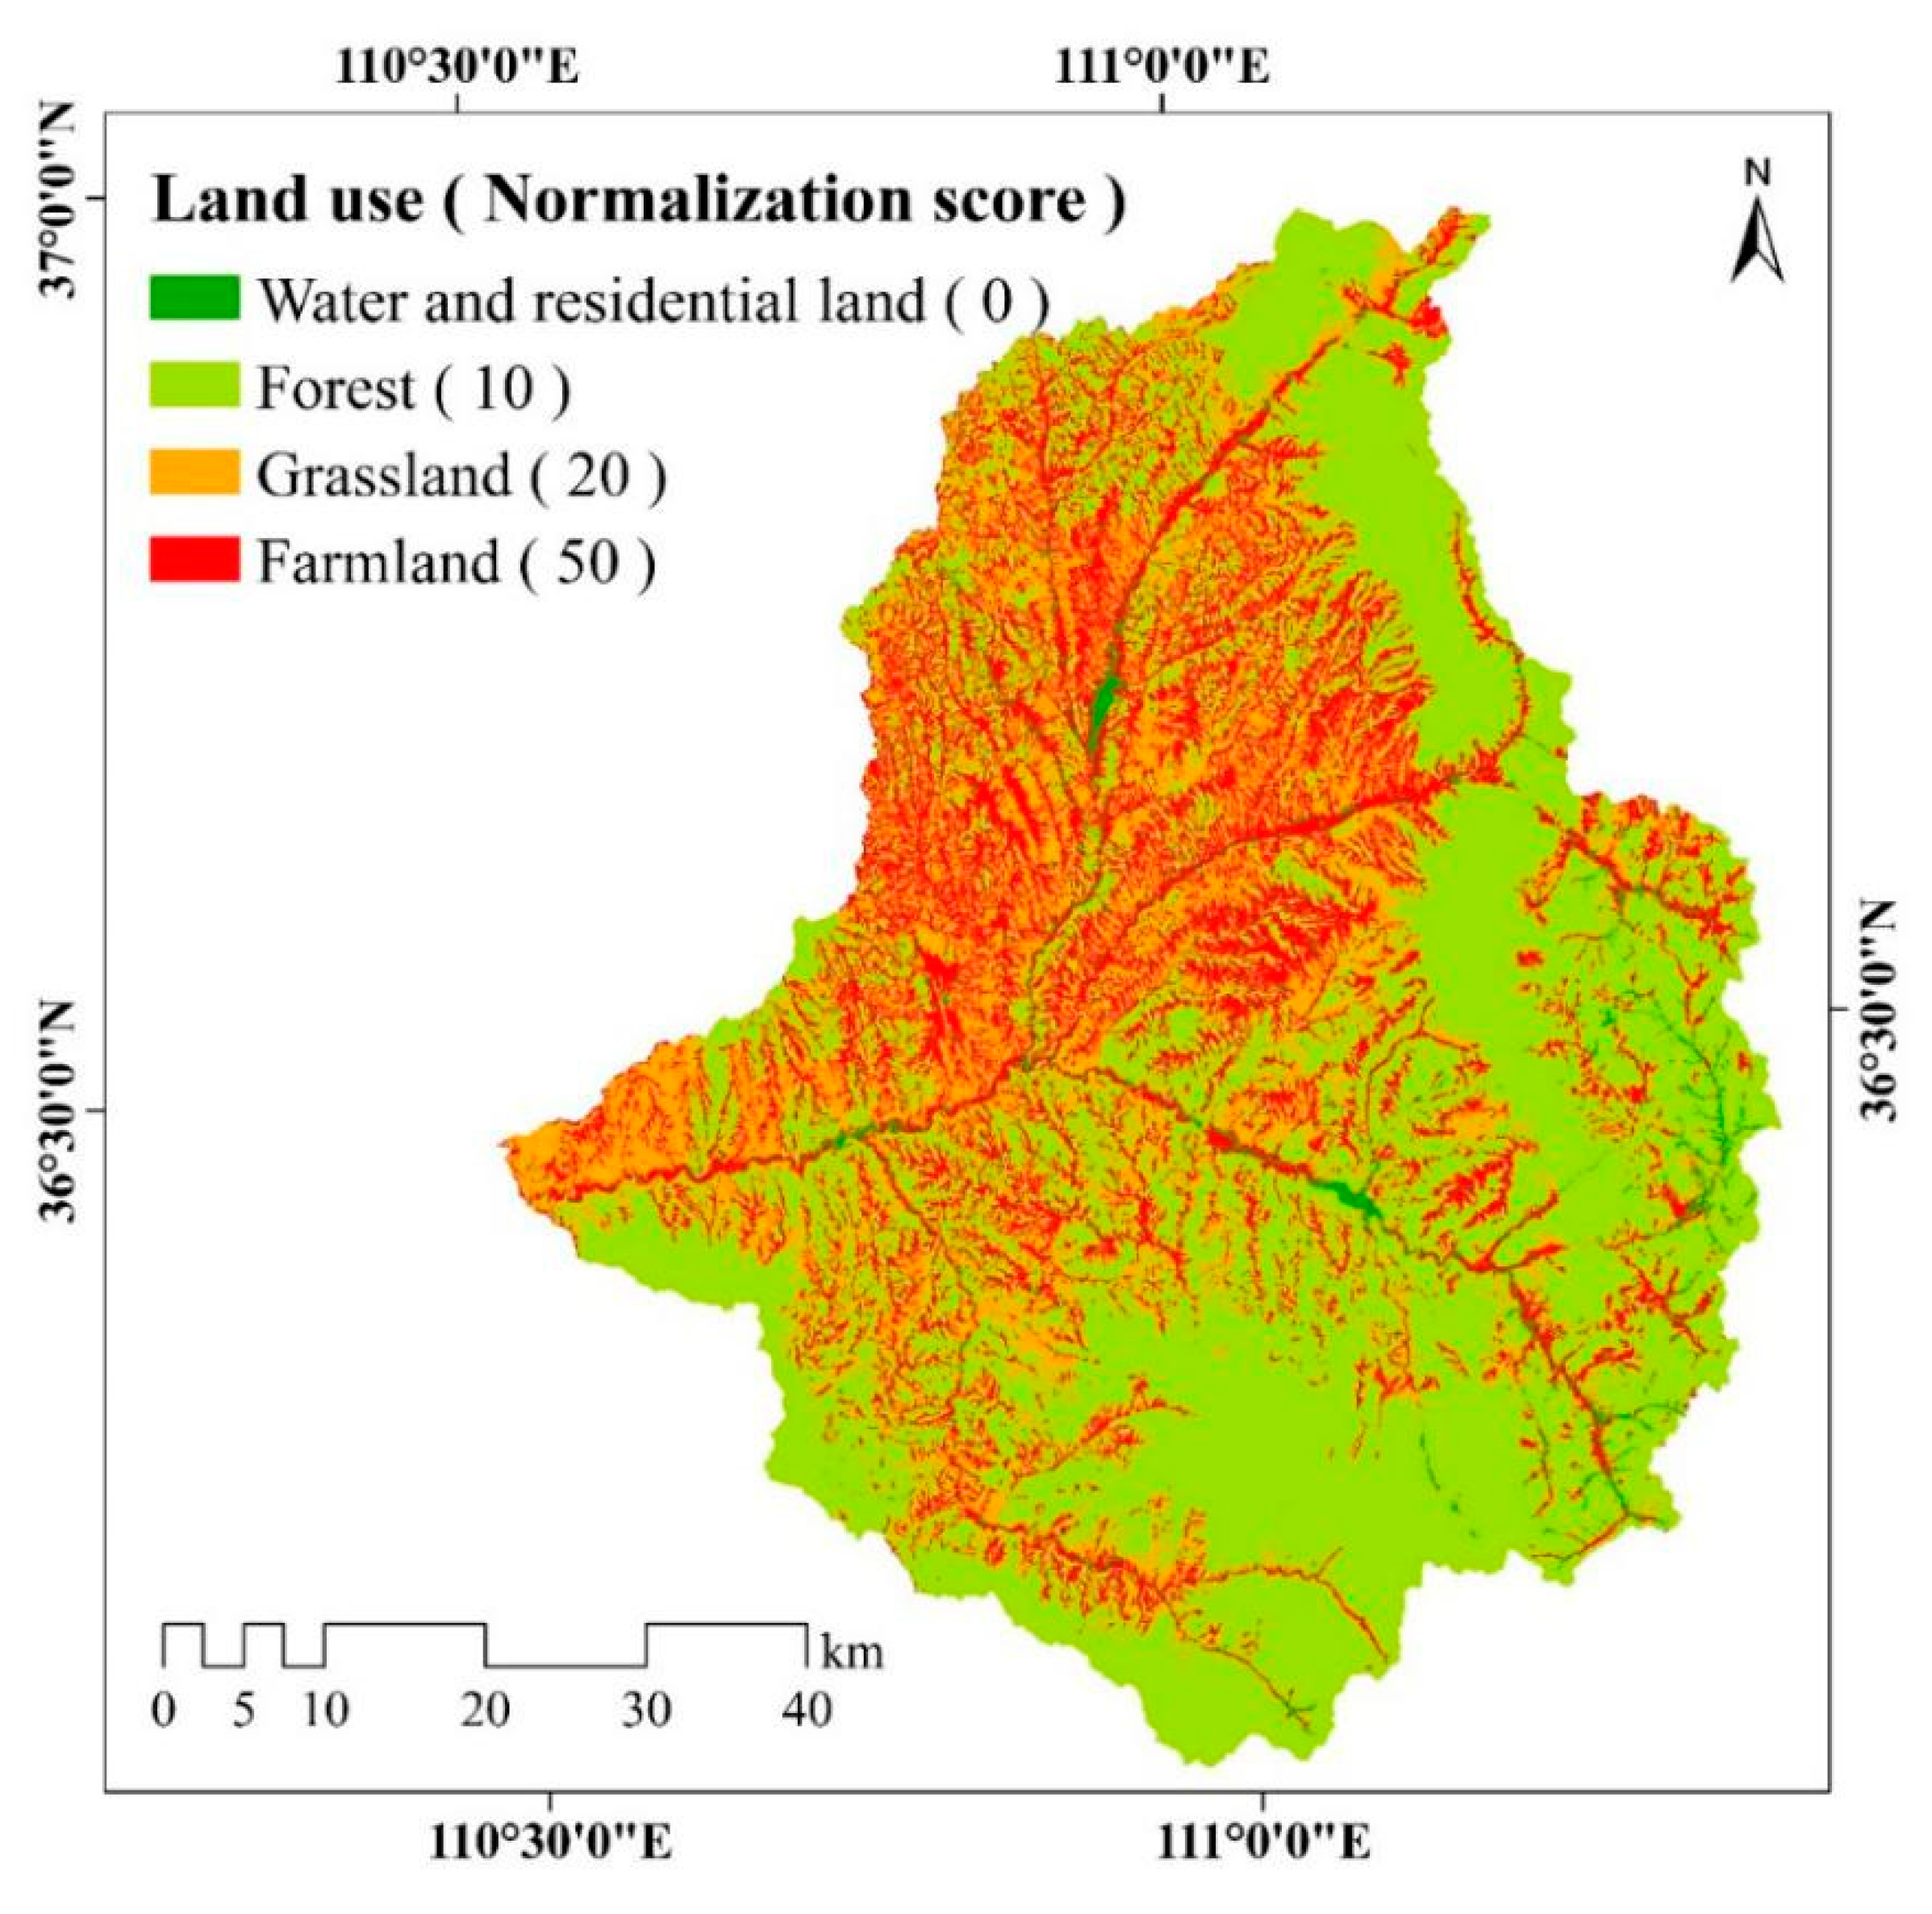
3.2.1. Land Use
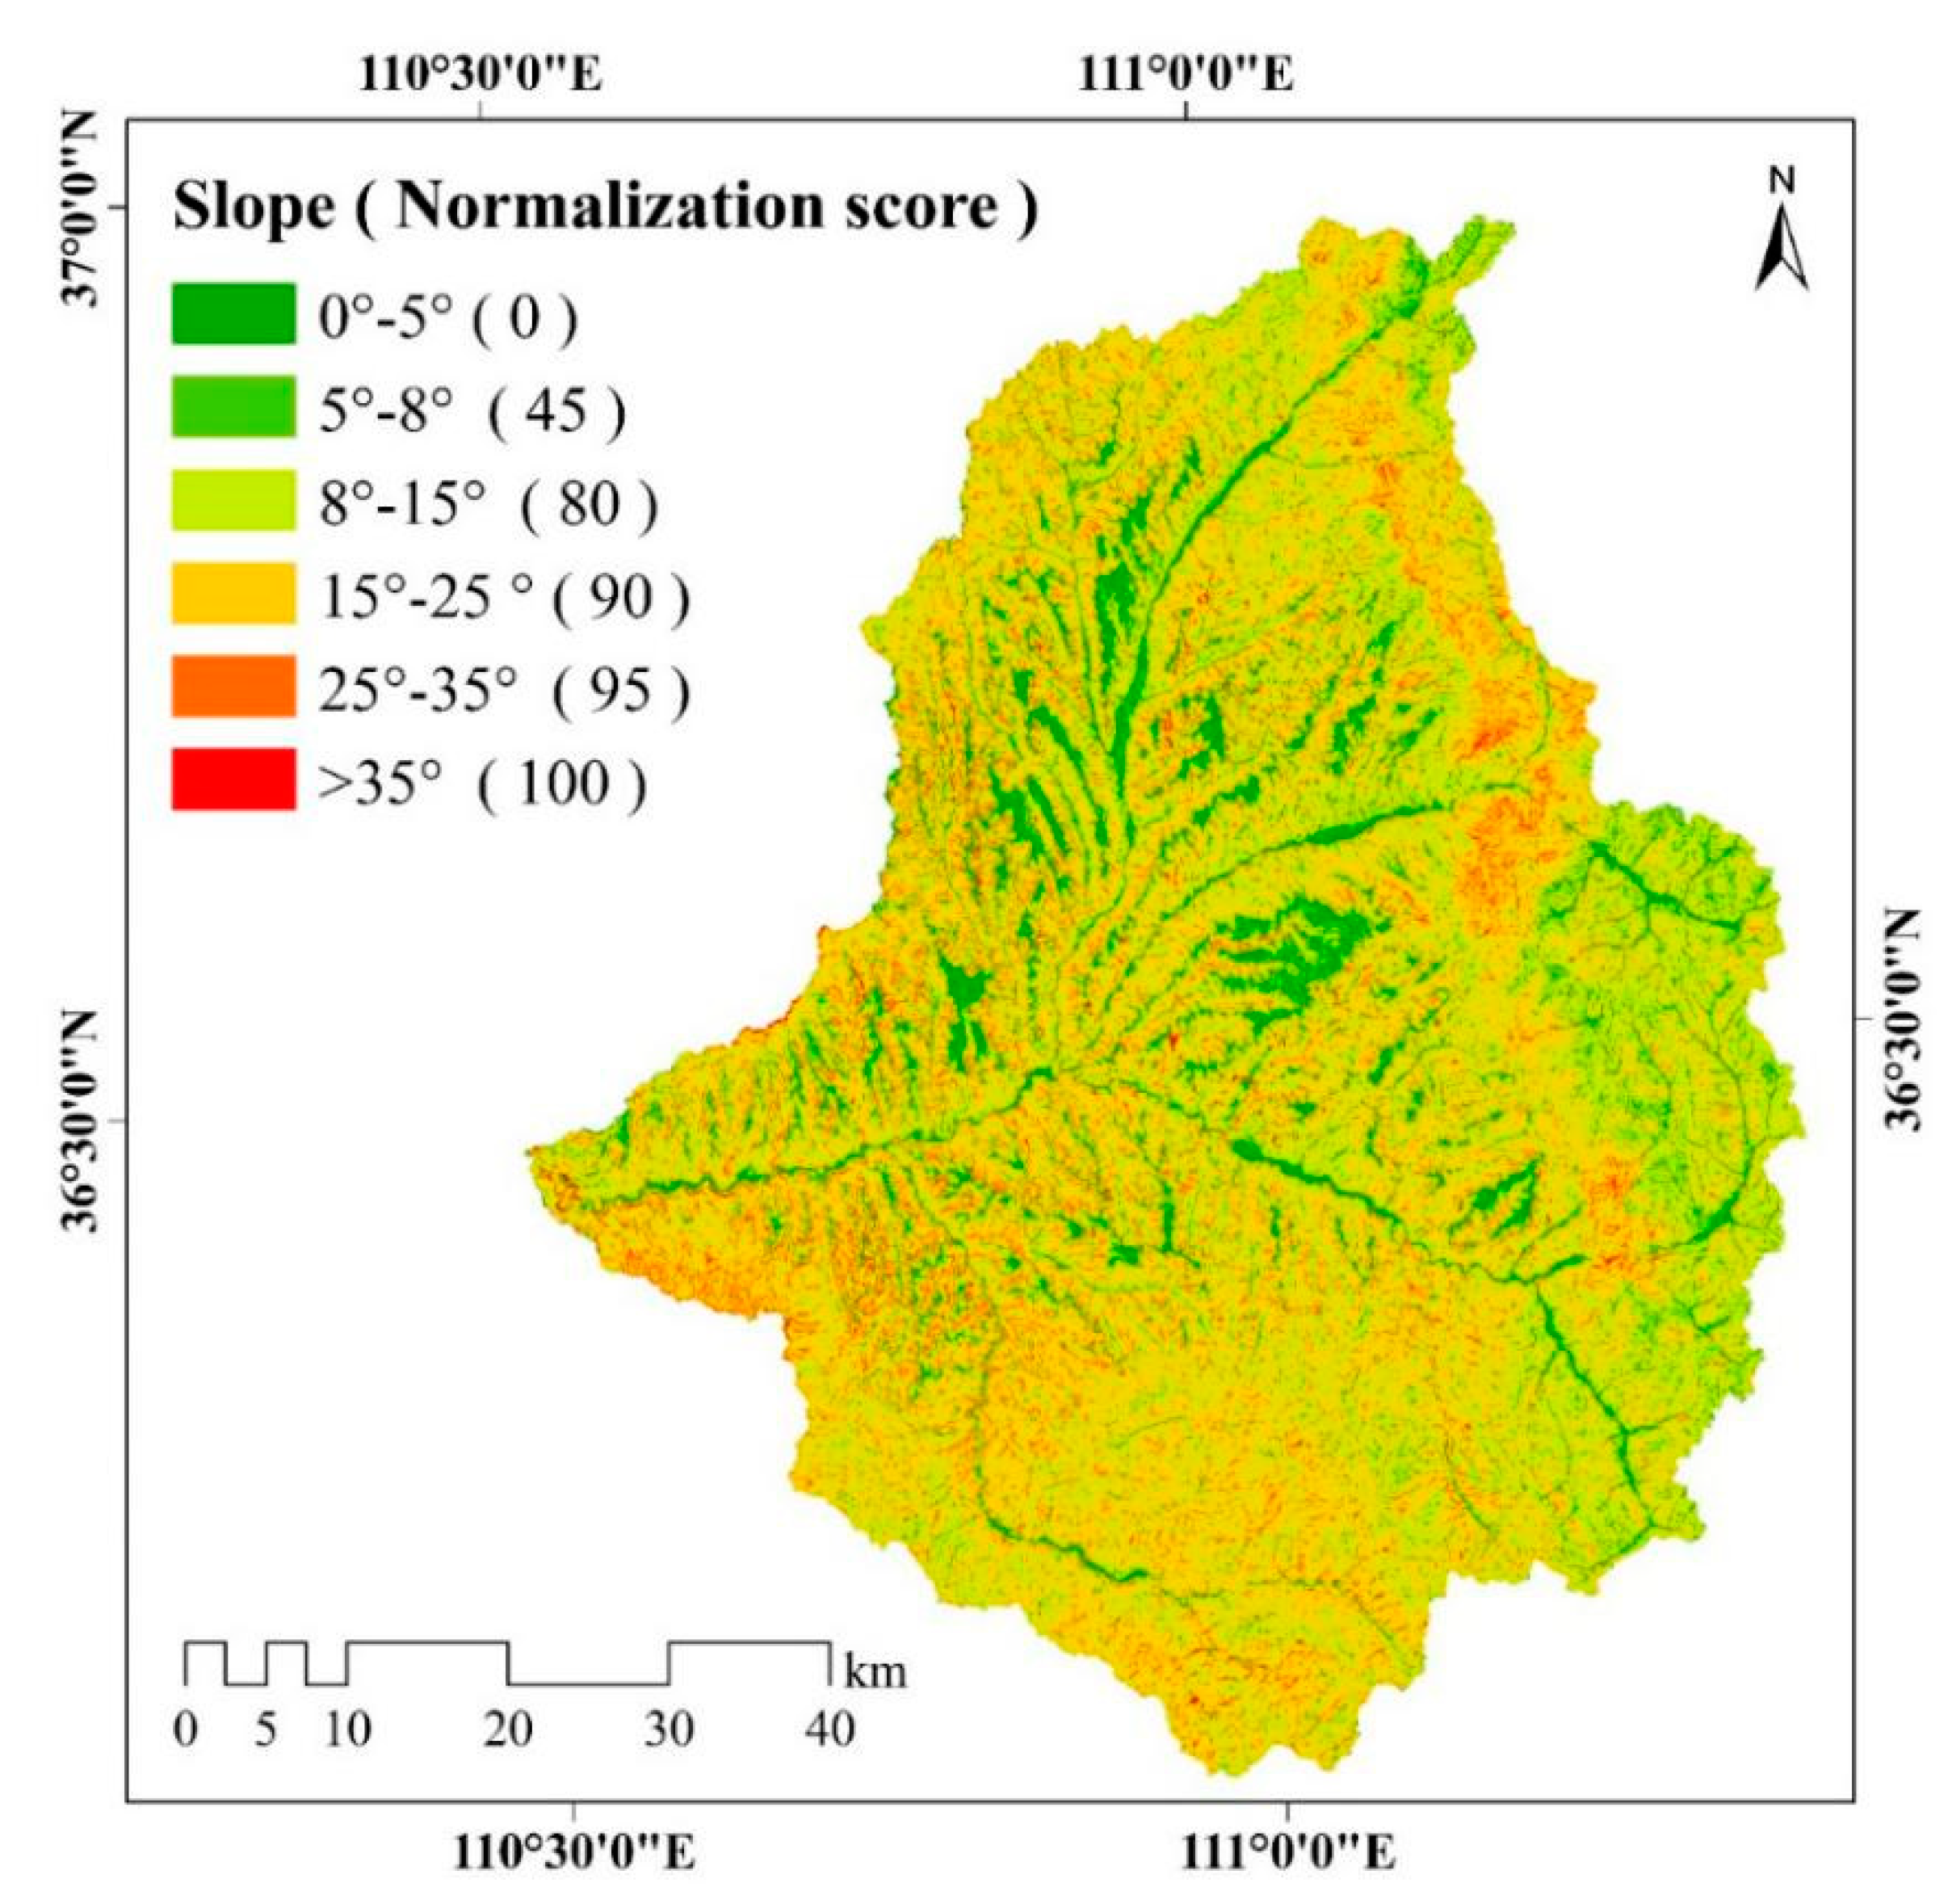
3.2.2. Slope
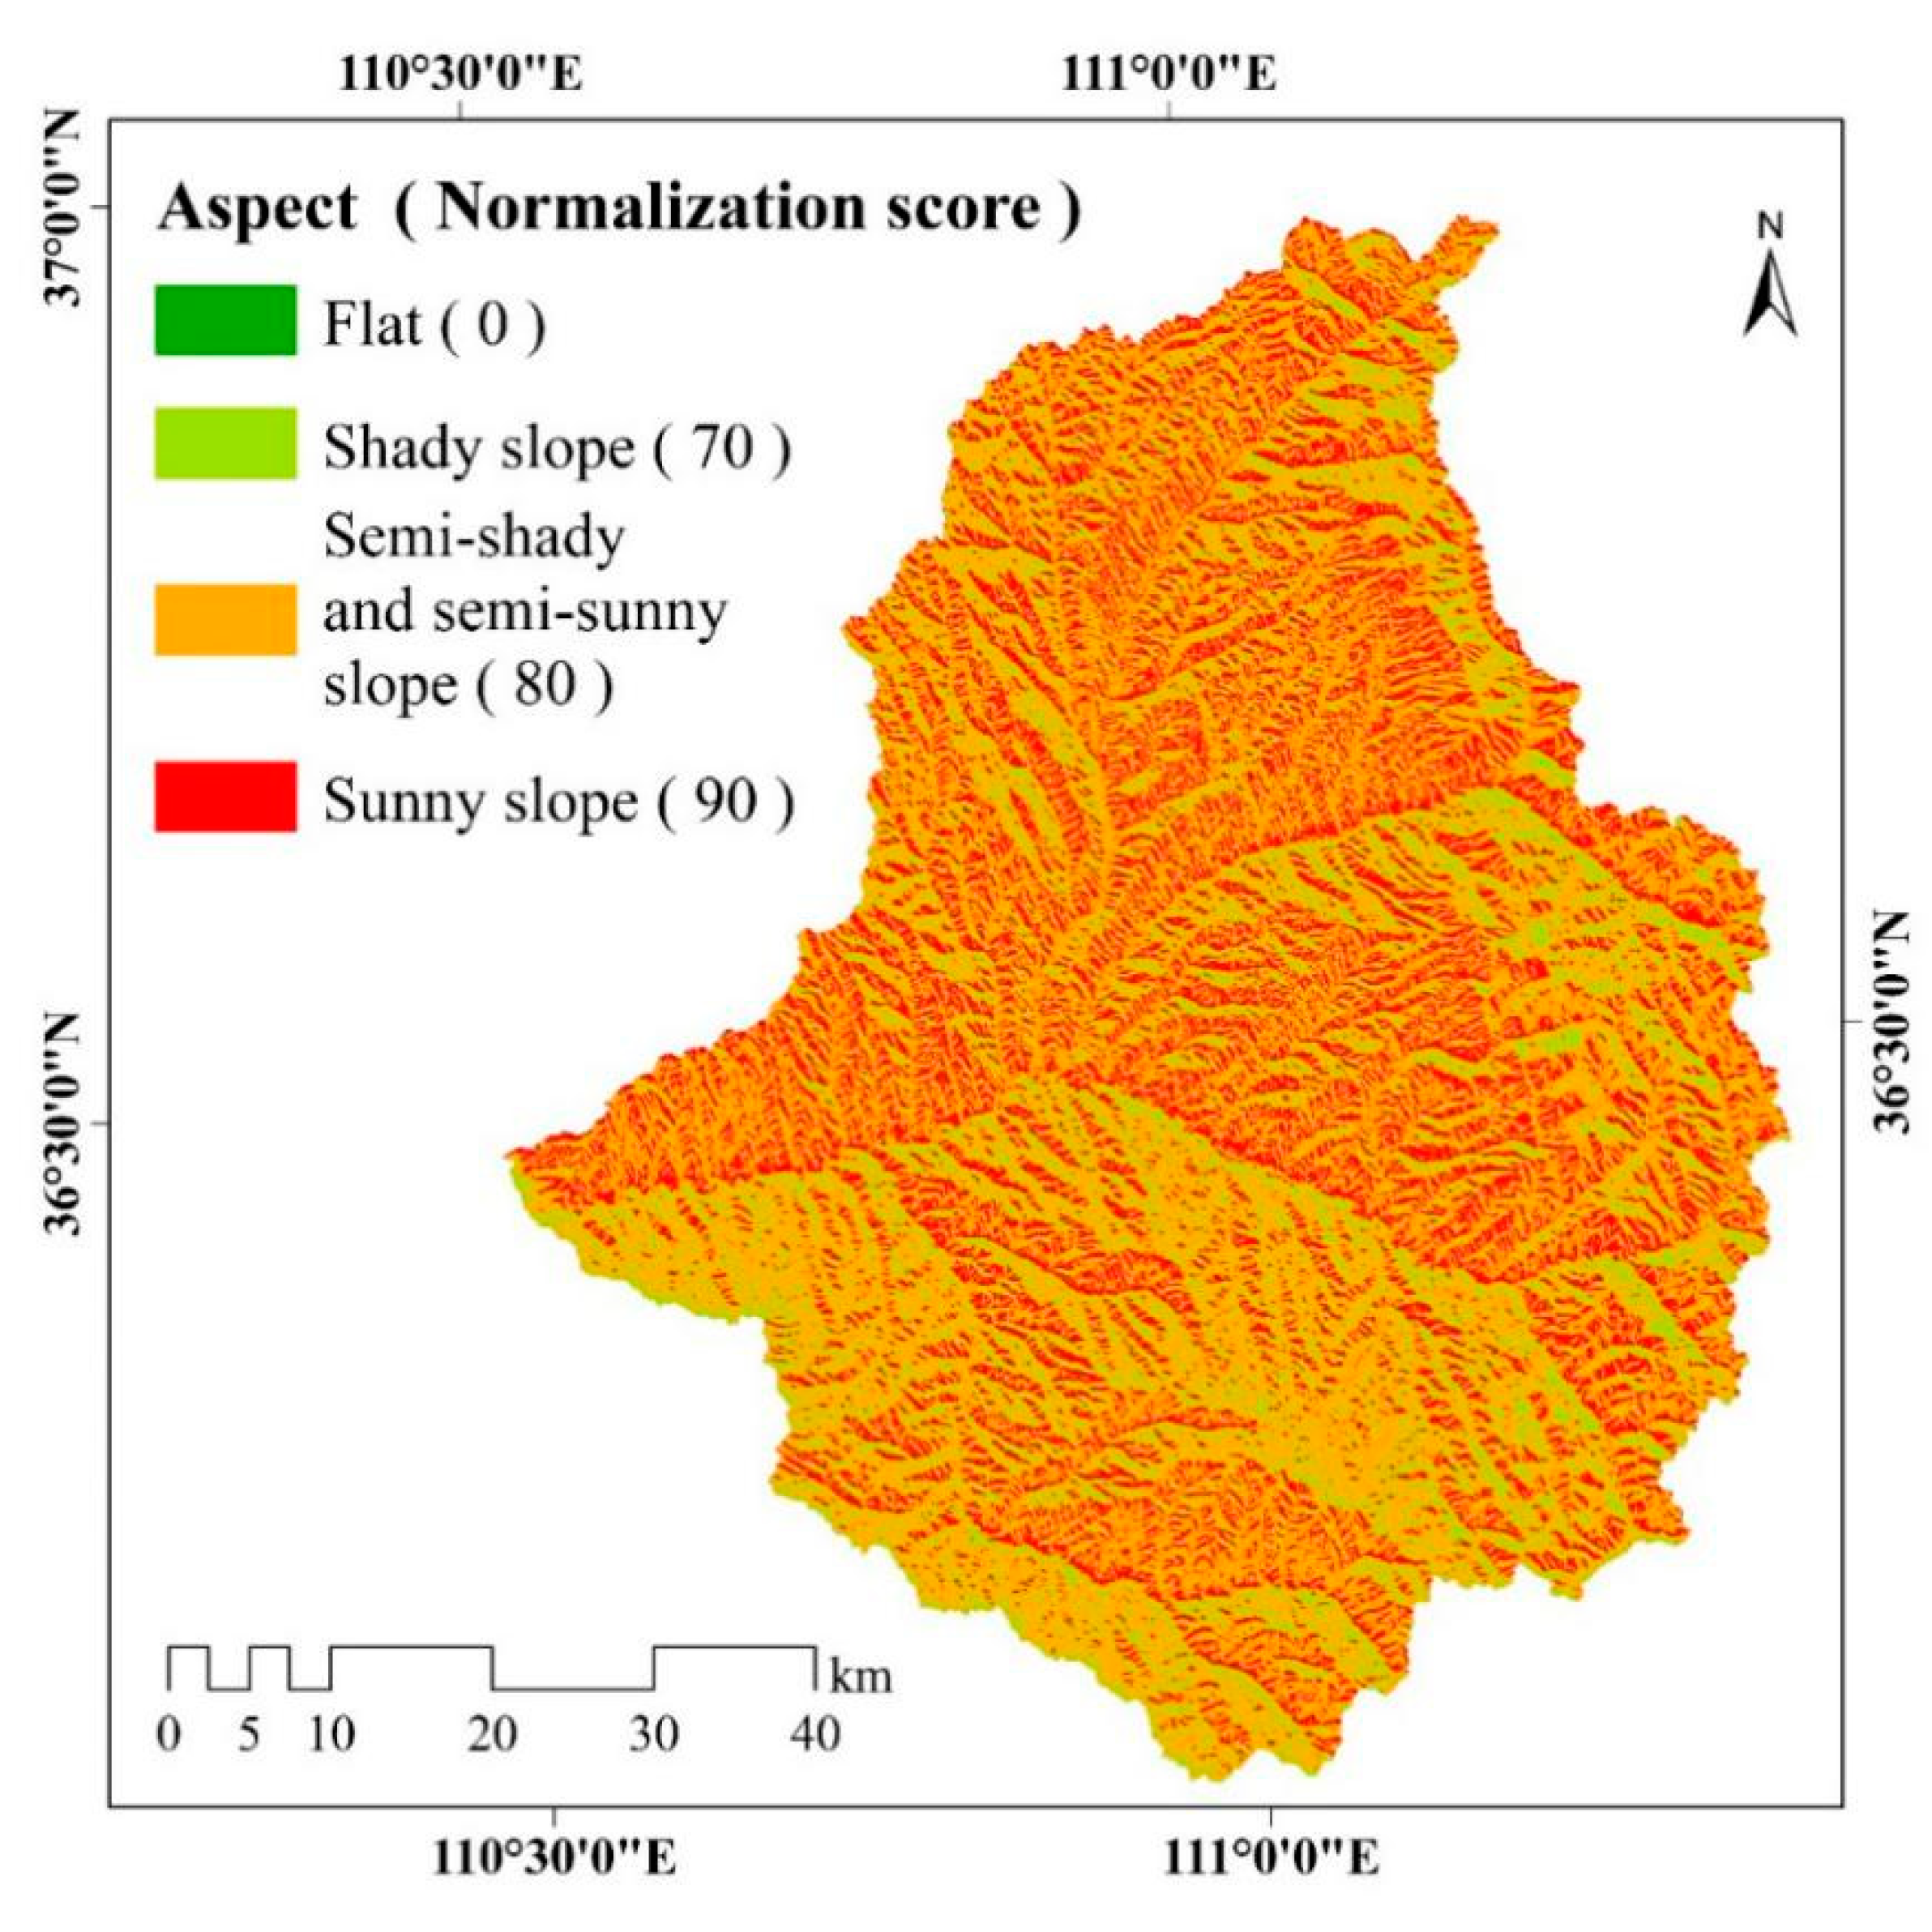
3.2.3. Slope Aspect
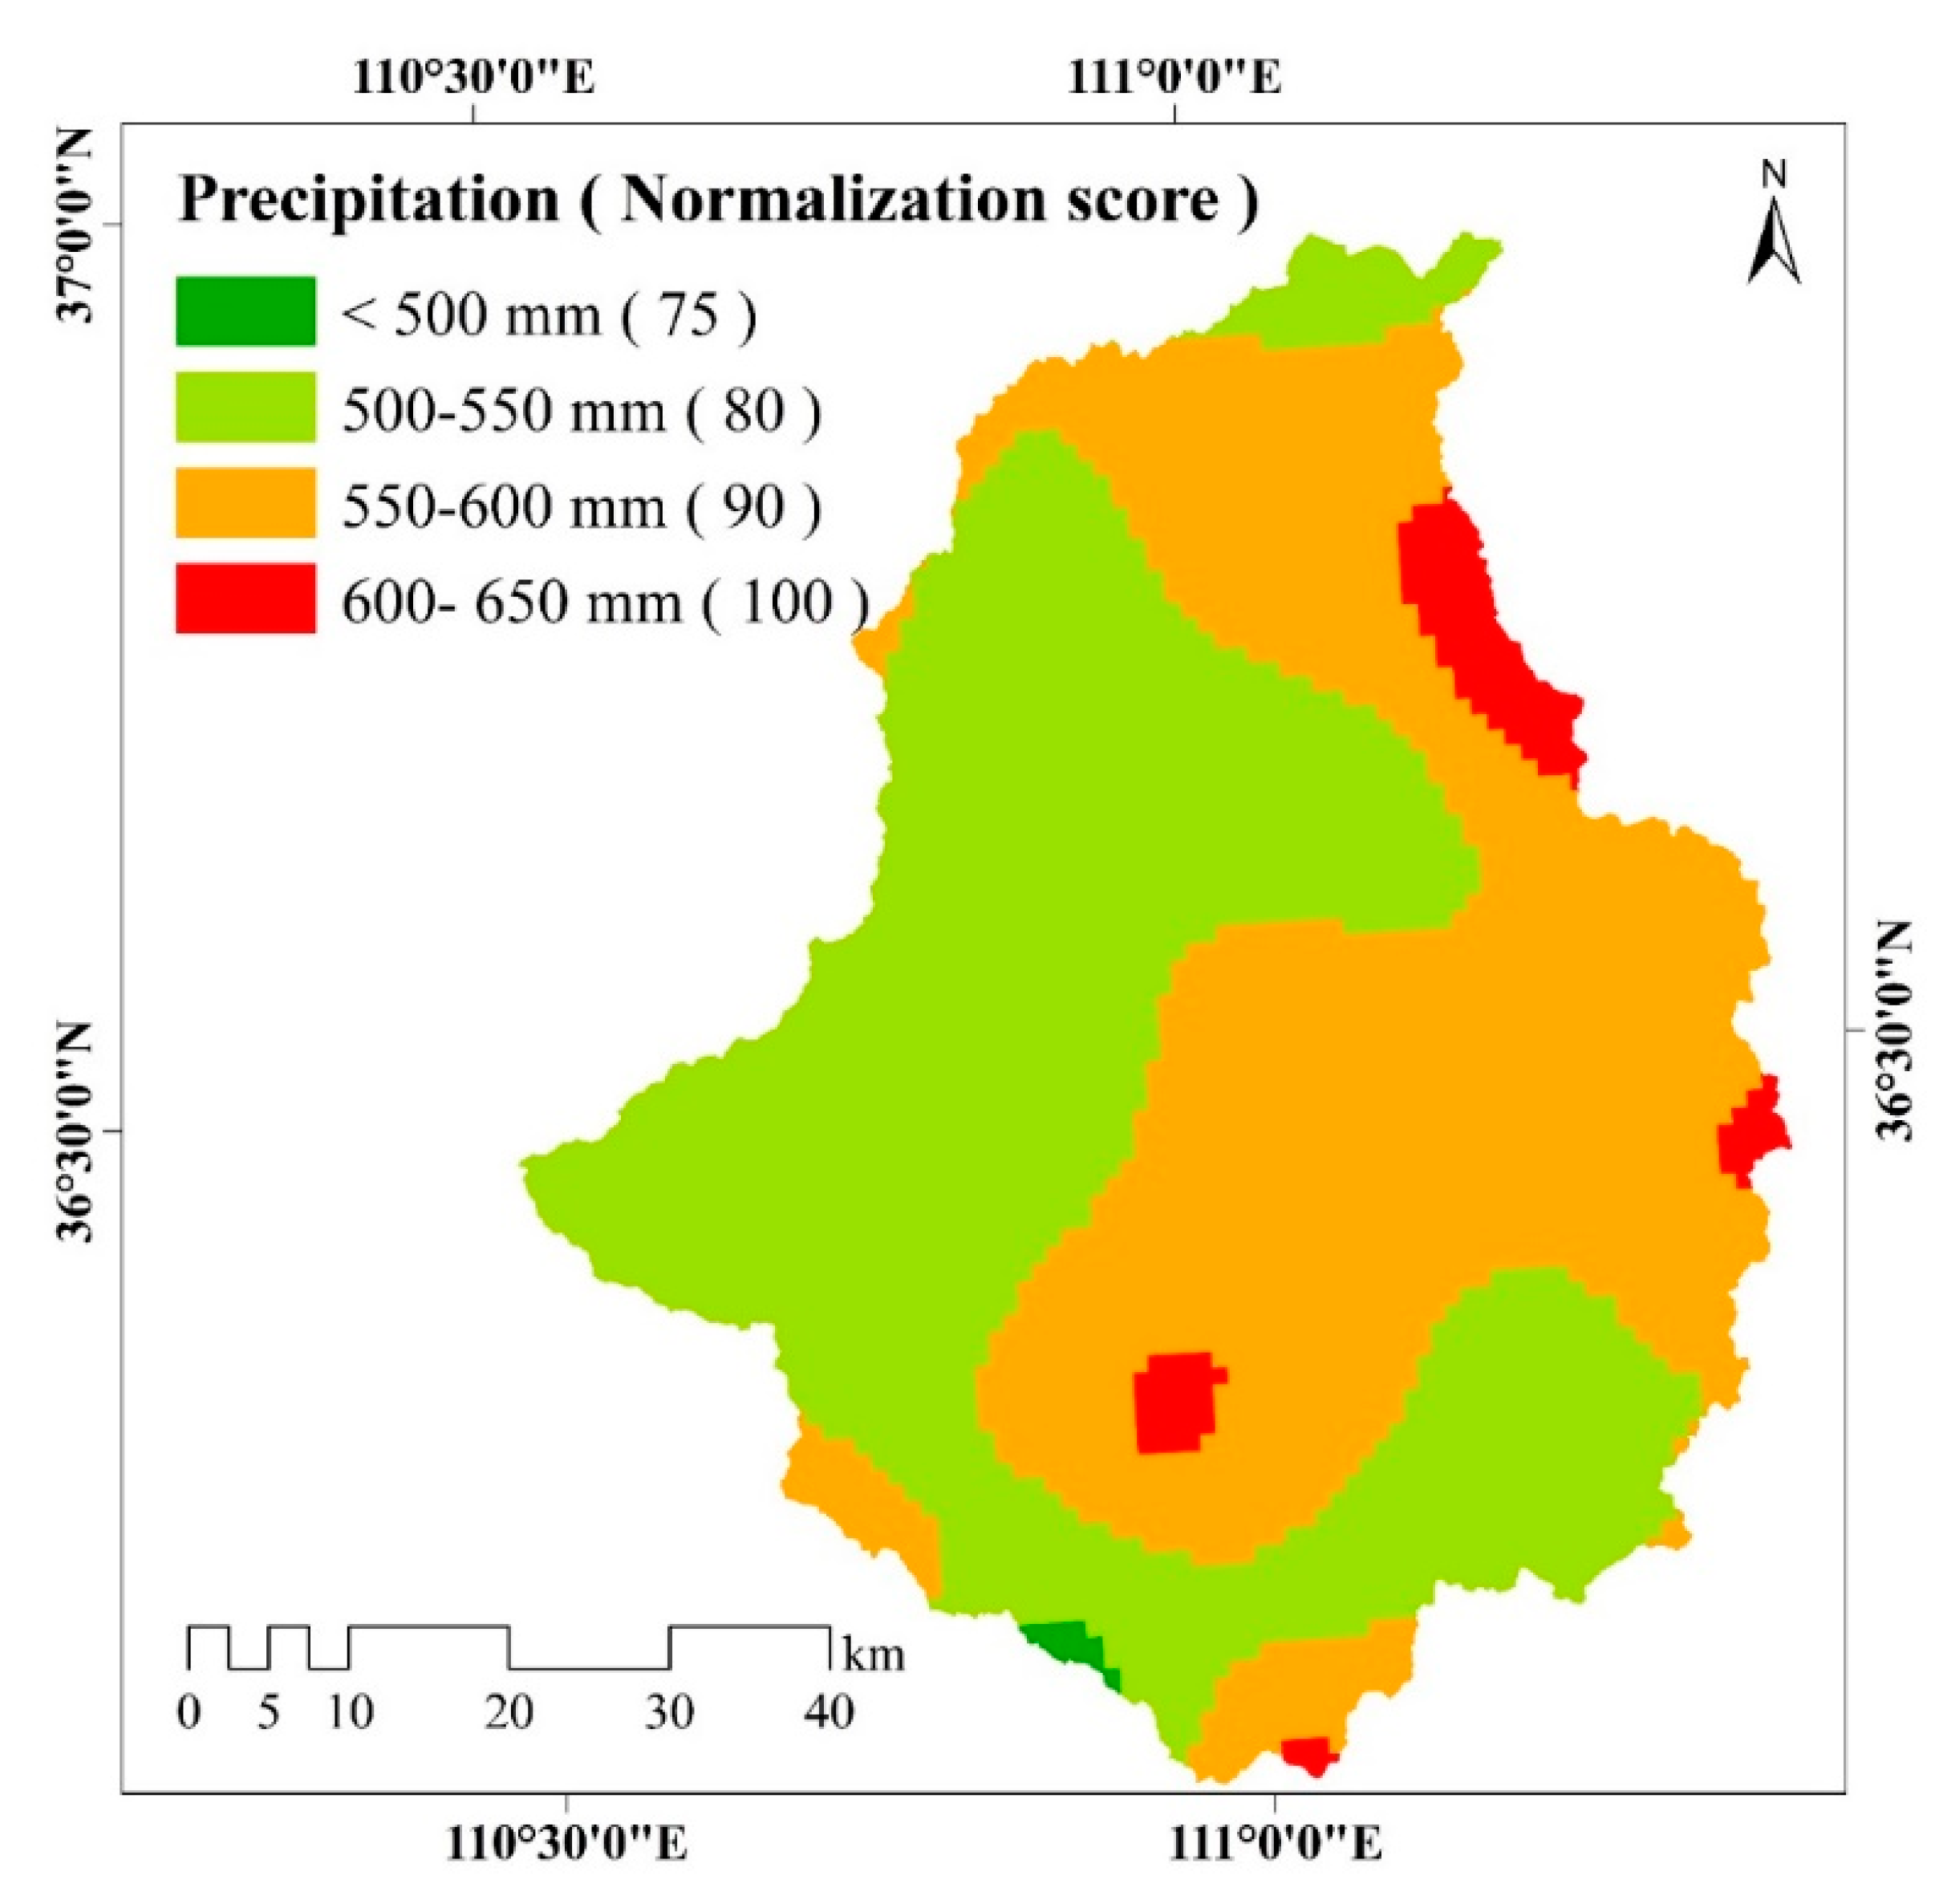
3.2.4. Precipitation
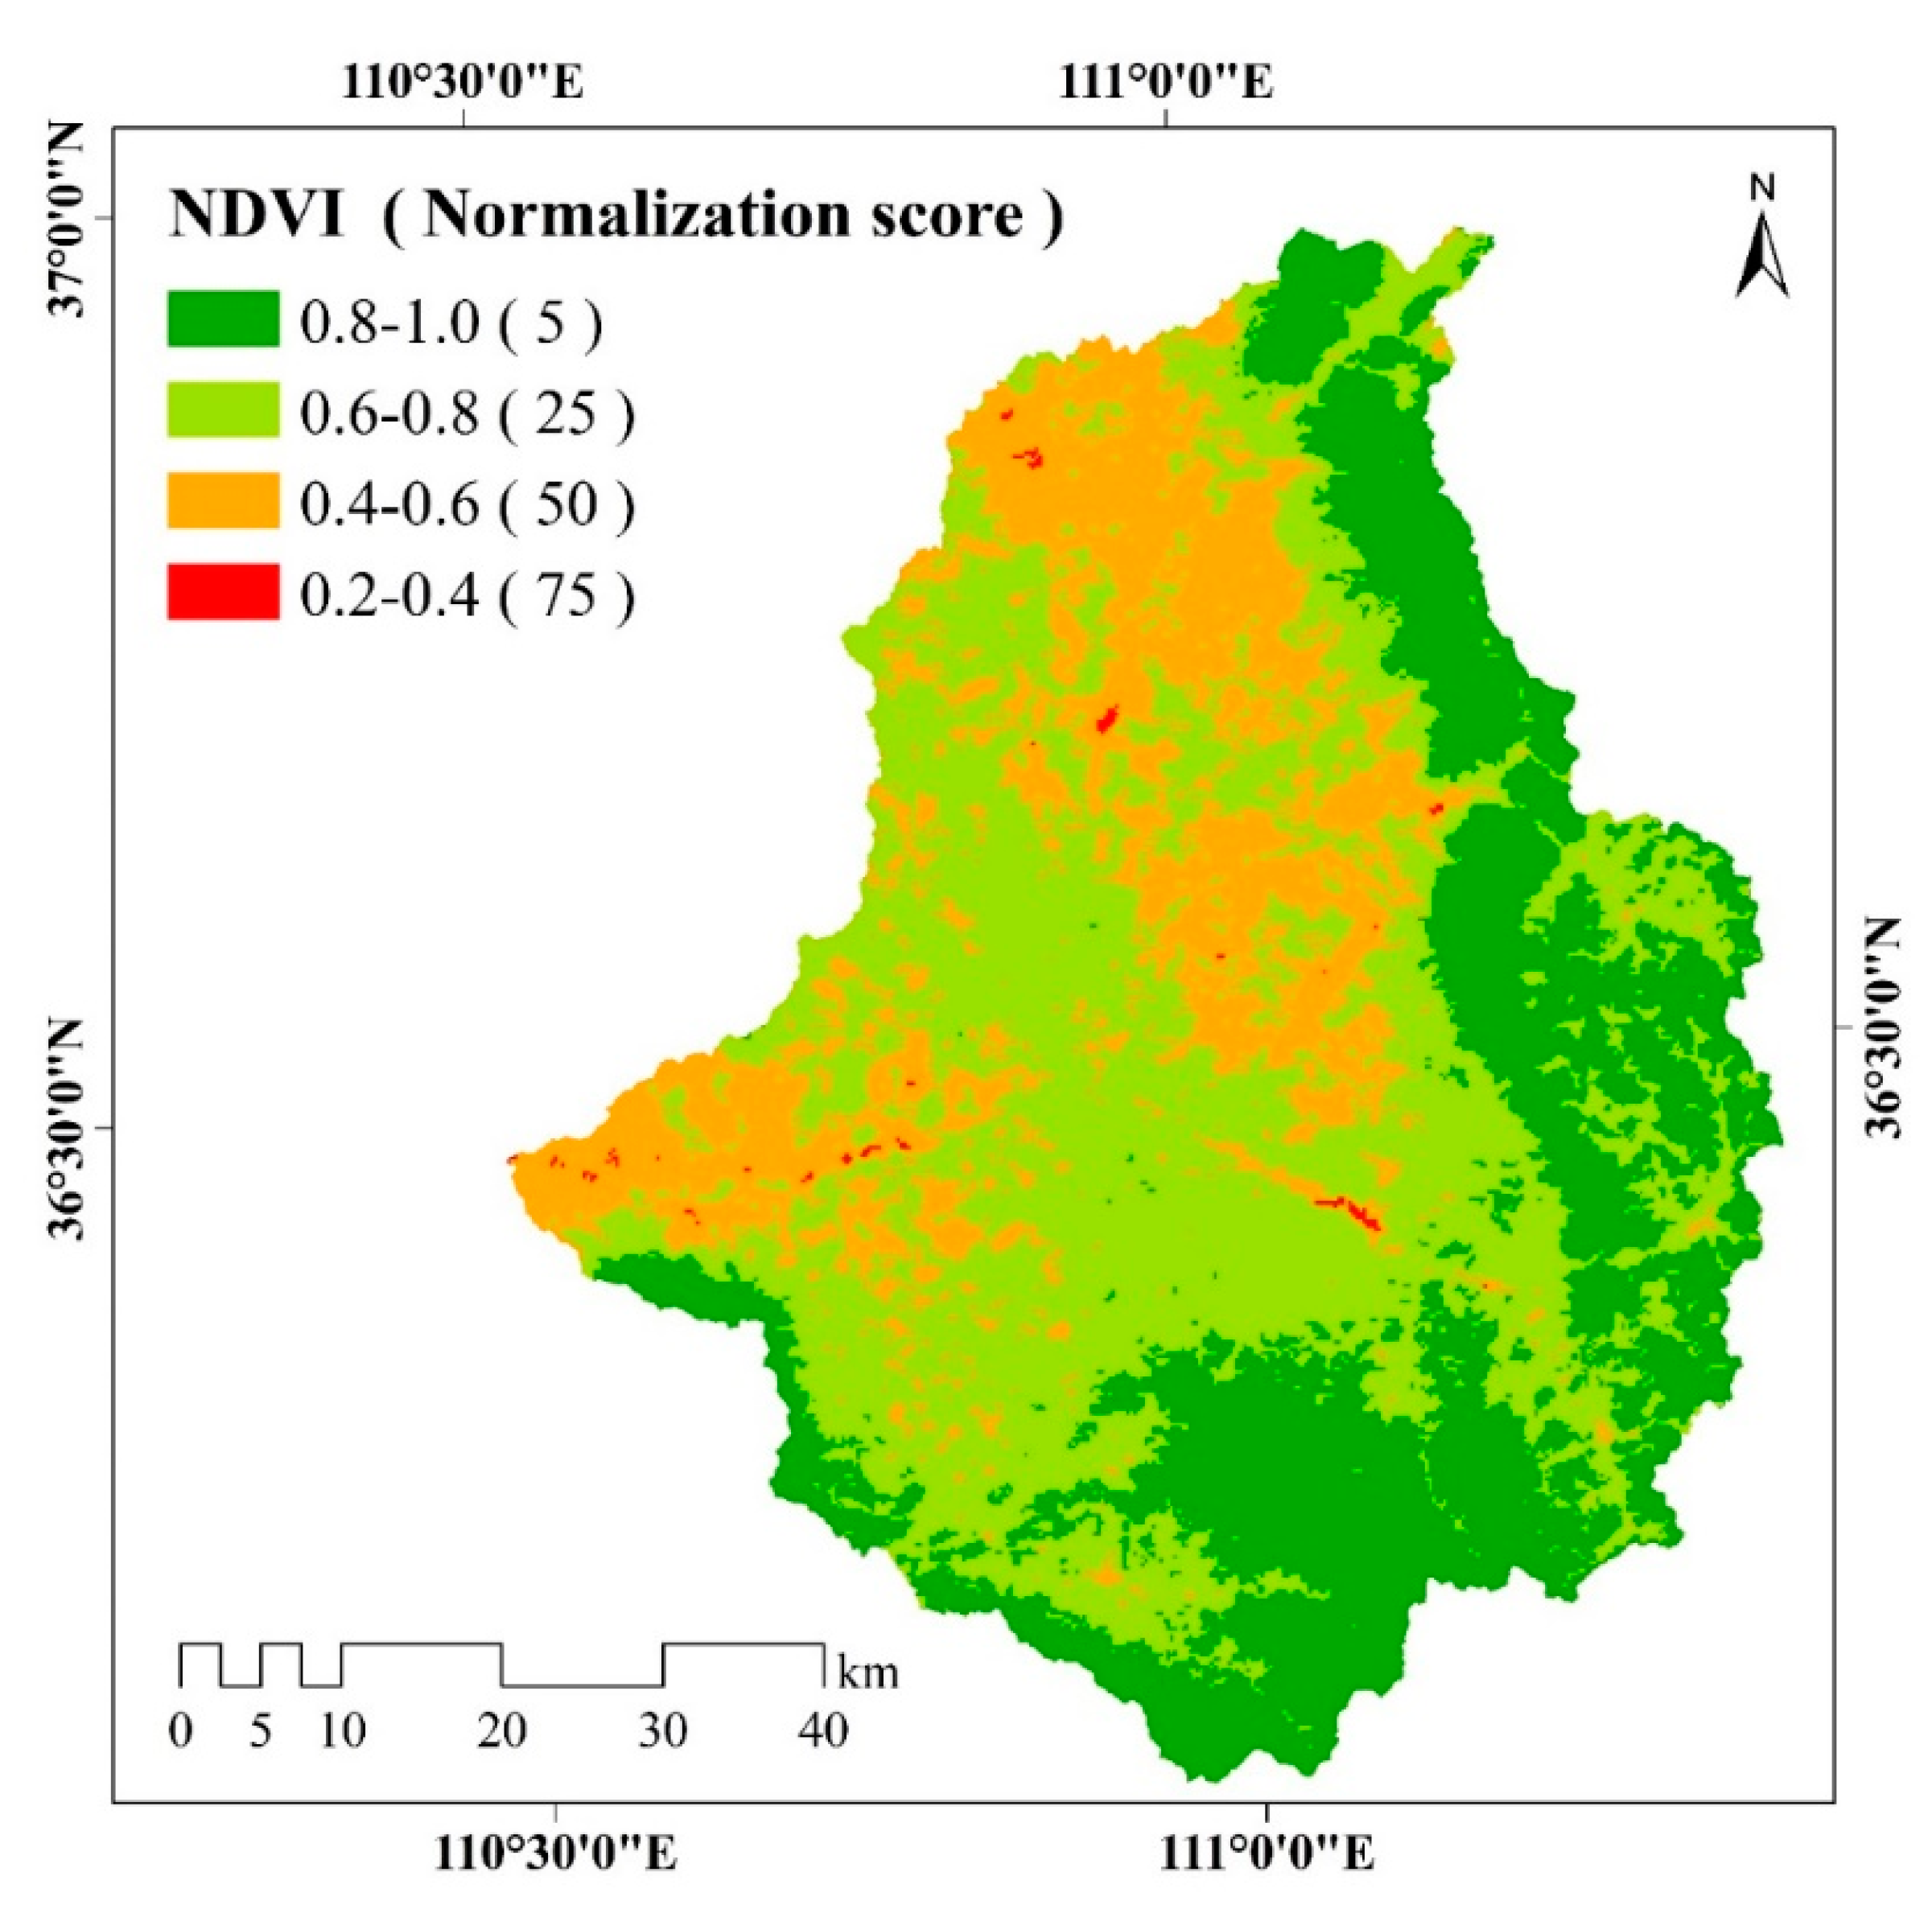
3.2.5. Vegetation
3.2.6. Soil Characteristics
3.3. Distribution of Soil Erosion Risk
3.4. Priority Areas for Soil and Water Conservation Planning
3.5. Advantages and Limitations of the Proposed Methodology
4. Conclusions
Author Contributions
Funding
Conflicts of Interest
References
- Wilkinson, B.H.; McElroy, B.J. The impact of humans on continental erosion and sedimentation. Geol. Soc. Am. Bull. 2007, 119, 140–156. [Google Scholar] [CrossRef]
- Yu, X.X.; Qi, S.Z.; Xu, Y.T. Soil erosion hazard in the Yimeng mountainous region, North China. Nat. Hazards 2012, 64, 1963–1967. [Google Scholar] [CrossRef]
- Wang, Z.Q.; Liu, B.Y.; Wang, X.Y.; Gao, X.F.; Liu, G. Erosion effect on the productivity of black soil in Northeast China. Sci. China Earth Sci. 2009, 52, 1005–1021. [Google Scholar] [CrossRef]
- Tsunekawa, A.; Liu, G.; Yamanaka, N.; Du, S. Restoration and Development of the Degraded Loess Plateau, China; Springer: Tokyo, Japan, 2014; p. 80. [Google Scholar]
- Nekhay, O.; Arriaza, M.; Boerboom, L. Evaluation of soil erosion risk using Analytic Network Process and GIS: A case study from Spanish mountain olive plantations. J. Environ. Manag. 2009, 90, 3091–3104. [Google Scholar] [CrossRef] [PubMed]
- Jiu, J.Z.; Wu, H.J.; Li, S. The Implication of Land-Use/Land-Cover Change for the Declining Soil Erosion Risk in the Three Gorges Reservoir Region, China. Int. J. Environ. Res. Public Health 2019, 16, 1856. [Google Scholar] [CrossRef] [PubMed] [Green Version]
- Arabameri, A.; Pradhan, B.; Pourghasemi, H.R.; Rezaei, K. Identification of erosion-prone areas using different multi-criteria decision-making techniques and gis. Geomat. Nat. Hazards Risk 2018, 9, 1129–1155. [Google Scholar] [CrossRef] [Green Version]
- Mandal, D.; Sharda, V.N. Appraisal of soil erosion risk in the eastern himalayan region of India for soil conservation planning. Land Degrad. Dev. 2013, 24, 430–437. [Google Scholar] [CrossRef]
- Wang, J.L.; Xie, D.T.; Ni, J.P.; Shao, J.A. Identification of soil erosion risk patterns in a watershed based on source-sink landscape units. Acta Ecol. Sin. 2017, 37, 1–11. (In Chinese) [Google Scholar]
- Ochoa-Cueva, P.; Fries, A.; Montesinos, P.; Rodríguez-Díaz, J.A.; Boll, J. Spatial Estimation of Soil Erosion Risk by Land-cover Change in the Andes of Southern Ecuador. Land Degrad. Dev. 2015, 26, 565–573. [Google Scholar] [CrossRef]
- Didoné, E.J.; Minella, J.P.G.; Evrard, O. Measuring and modelling soil erosion and sediment yields in a large cultivated catchment under no-till of Southern Brazil. Soil Tillage Res. 2017, 174, 24–33. [Google Scholar] [CrossRef]
- Haregeweyn, N.; Tsunekawa, A.; Poesen, J.; Tsubo, M.; Meshesha, D.T.; Fenta, A.A.; Nyssen, J.; Adgo, E. Comprehensive assessment of soil erosion risk for better land use planning in river basins: Case study of the Upper Blue Nile River. Sci. Total Environ. 2017, 574, 95–108. [Google Scholar] [CrossRef] [PubMed] [Green Version]
- Pi, H.; Sharratt, B. Evaluation of the RWEQ and SWEEP in simulating soil and PM10 loss from a portable wind tunnel. Soil Tillage Res. 2017, 170, 94–103. [Google Scholar] [CrossRef]
- Du, H.; Xue, X.; Wang, T.; Deng, X.H. Assessment of wind and water erosion risk in the watershed of the Ningxia-Inner Mongolia Reach of the Yellow River, China. Ecol. Indic. 2016, 67, 117–131. [Google Scholar] [CrossRef]
- Zhao, H.G.; Tang, Y.Y.; Yang, S.T. Dynamic identification of soil erosion risk in the middle reaches of the Yellow River Basin in China from 1978 to 2010. J. Geogr. Sci. 2018, 28, 175–192. [Google Scholar] [CrossRef] [Green Version]
- Huang, W.; Ho, H.C.; Peng, Y.Y.; Li, L. Qualitative risk assessment of soil erosion for karst landforms in Chahe town, Southwest China: A hazard index approach. Catena 2016, 144, 184–193. [Google Scholar] [CrossRef]
- Prasuhn, V.; Liniger, H.; Gisler, S.; Herweg, K.; Candinas, A.; Clément, J. A high-resolution soil erosion risk map of Switzerland as strategic policy support system. Land Use Policy 2013, 32, 281–291. [Google Scholar] [CrossRef]
- Vrieling, A.; Sterk, G.; Vigiak, O. Spatial evaluation of soil erosion risk in the West Usambara Mountains, Tanzania. Land Degrad. Dev. 2006, 17, 301–319. [Google Scholar] [CrossRef]
- Van Rompaey, A.J.J.; Govers, G. Data quality and model complexity for regional scale soil erosion prediction. Geomorphology 2002, 16, 663–680. [Google Scholar] [CrossRef]
- Nigel, R.; Rughooputh, S.D. Soil erosion risk mapping with new datasets: An improved identification and prioritisation of high erosion risk areas. Catena 2010, 82, 191–205. [Google Scholar] [CrossRef]
- Wang, Y.J.; Tao, J.P.; Zhong, Z.C. Factors influencing the distribution and growth of dwarf bamboo, Fargesia nitida, in a subalpine forest in Wolong Nature Reserve, southwest China. Ecol. Res. 2009, 24, 1013–1021. [Google Scholar] [CrossRef]
- Khan, M.A.; Gupta, V.P.; Moharana, P.C. Watershed prioritization using remote sensing and geographical information system: A case study from Guhiya, India. J. Arid Environ. 2001, 49, 465–475. [Google Scholar] [CrossRef]
- Kheir, R.B.; Abdallah, C.; Khawlie, M. Assessing soil erosion in Mediterranean karst landscapes of Lebanon using remote sensing and GIS. Eng. Geol. 2008, 99, 239–254. [Google Scholar] [CrossRef]
- Rahman, M.R.; Shi, Z.H.; Chongfa, C. Soil erosion hazard evaluation—An integrated use of remote sensing, GIS and statistical approaches with biophysical parameters to- wards management strategies. Ecol. Model. 2009, 220, 1724–1734. [Google Scholar] [CrossRef]
- Liu, G.B.; Shangguan, Z.P.; Yao, W.Y.; Yang, Q.K.; Zhao, M.J.; Dang, X.H.; Guo, M.H.; Wang, G.L.; Wang, B. Ecological Effects of Soil Conservation in Loess Plateau. Bull. Chin. Acad. Sci. 2017, 32, 11–19. [Google Scholar]
- Wang, G.Q.; Zhang, J.Y.; Yang, Q.L. Attribution of Runoff Change for the Xinshui River Catchment on the Loess Plateau of China in a Changing Environment. Water 2016, 8, 267. [Google Scholar] [CrossRef] [Green Version]
- NASA EOSDIS Land Processes Distributed Active Archive Center (LP DAAC). The Terra Moderate Resolution Imaging Spectroradiometer (MODIS) Vegetation Indices (MOD13Q1) Data. Available online: https://lpdaac.usgs.gov/ (accessed on 8 July 2018).
- China Meteorological Data Service Center. Daily Meteorological Data in China. Available online: http://data.cma.cn/ (accessed on 11 December 2019).
- Geospatial Data Cloud Site, Computer Network Information Center, Chinese Academy of Sciences. GDEMDEM 30M DEM Data. Available online: http://www.gscloud.cn/ (accessed on 2 April 2017).
- Data Center for Resources and Environmental Sciences, Chinese Academy of Sciences (RESDC). Distribution of Soil Texture in China. Available online: http://www.resdc.cn/ (accessed on 18 March 2018).
- Shanxi Province Bureau of Statistics. Shanxi Statistical Year Book. Available online: http://www.stats-sx.gov.cn/tjsj/tjnj/nj2016/indexch.htm (accessed on 20 May 2018).
- Luo, Z.D. Conservation patch: The minimum basic management unit of soil and water conservation in China. Sci. Soil Water Conserv. 2015, 13, 127–131. (In Chinese) [Google Scholar]
- Rosén, L.; Back, P.; Söderqvist, T.; Norrman, J.; Brinkhoff, P.; Norberg, T.; Volchko, Y.; Norin, M.; Bergknut, M.; Döberl, G. SCORE: A novel multi-criteria decision analysis approach to assessing the sustainability of contaminated land remediation. Sci. Total Environ. 2015, 511, 621–638. [Google Scholar] [CrossRef] [PubMed]
- Li, D.Q.; Zhang, C.; Pizzol, L.; Critto, A.; Zhang, H.B.; Lv, S.H.; Marcomini, A. Regional risk assessment approaches to land planning for industrial polluted areas in China: The Hulunbeier region case study. Environ. Int. 2014, 65, 16–32. [Google Scholar] [CrossRef]
- Torresan, S.; Critto, A.; Rizzi, J.; Zabeo, A.; Furlan, E.; Marcomini, A. DESYCO: A decision support system for the regional risk assessment of climate change impacts in coastal zones. Ocean Coast. Manag. 2016, 120, 49–63. [Google Scholar] [CrossRef]
- Guarini, M.R.; Battisti, F.; Chiovitti, A. A methodology for the selection of multi-criteria decision analysis methods in real estate and land management processes. Sustainability 2018, 10, 507. [Google Scholar] [CrossRef] [Green Version]
- Ducci, D.; Albanese, S.; Boccia, L.; Celentano, E.; Cervelli, E.; Corniello, A.; Crispo, A.; De Vivo, B.; Iodice, P.; Langella, C.; et al. An Integrated Approach for the Environmental Characterization of a Wide Potentially Contaminated Area in Southern Italy. Int. J. Environ. Res. Public Health 2017, 14, 693. [Google Scholar] [CrossRef] [PubMed] [Green Version]
- Uribe, D.; Geneletti, D.; del Castillo, R.F.; Orsi, F. Integrating stakeholder preferences and GIS-based multicriteria analysis to identify forest landscape restoration priorities. Sustainability 2014, 6, 935–951. [Google Scholar] [CrossRef] [Green Version]
- Zabeo, A.; Pizzol, L.; Agostini, P.; Critto, A.; Giove, S.; Marcomini, A. Regional risk assessment for contaminated sites Part 1: Vulnerability assessment by multicriteria decision analysis. Environ. Int. 2011, 37, 1295–1306. [Google Scholar] [CrossRef]
- Morgan, R.P.C. Soil Erosion and Conservation, 3rd ed.; Blankwell Publishing: Oxford, UK, 2005; pp. 45–65. [Google Scholar]
- Turner, B.J.; Fuhrer, J.; Wuellner, M.; Menendez, H.M.; Dunn, B.H.; Gates, R. Scientific case studies in land-use driven soil erosion in the central United States: Why soil potential and risk concepts should be included in the principles of soil health. Int. Soil Water Conserv. Res. 2018, 6, 63–78. [Google Scholar] [CrossRef]
- Olness, A.; Archer, D.W. Effect of organic carbon on available water in soil. Soil Sci. 2005, 170, 90–101. [Google Scholar] [CrossRef]
- Johnson, J.M.F.; Novak, J.M.; Varvel, G.E.; Stott, D.E.; Osborne, S.L.; Karlen, D.L.; Lamb, J.A.; Baker, J.; Adler, P.R. Crop residue mass needed to maintain soil organic carbon levels: Can it be determined? Bioenergy Res. 2014, 7, 481–490. [Google Scholar] [CrossRef]
- Zhu, J.C.; Gantzer, C.J.; Anderson, S.H.; Alberts, E.E.; Buselinck, R.R. Runoff, soil and dissolved nutrient losses from no-tillage soybean and winter cover crops. Soil Sci. Soc. Am. J. 1989, 53, 1210–1214. [Google Scholar] [CrossRef]
- Tonitto, C.; David, M.B.; Drinkwater, L.E. Replacing bare fallows with cover crops in fertilizer-intensive cropping systems: A meta-analysis of crop yield and N dynamics. Agric. Ecosyst. Environ. 2006, 112, 58–72. [Google Scholar] [CrossRef]
- MWR (The Ministry of Water Resources of the People’s Republic of China). Standards for Classification and Gradation of Soil Erosion (SL19–007); China Water & Power Press: Beijing, China, 2008. (In Chinese)
- Huang, C.Y. Soil Science; China Agriculture Press: Beijing, China, 2000; p. 75. (In Chinese) [Google Scholar]
- Torra, V.; Narukawa, Y. Numerical integration for the Choquet integral. Inf. Fusion 2016, 31, 137–145. [Google Scholar] [CrossRef]
- Sugeno, M.; Murofushi, T. Pseudo-additive measures and integrals. J. Math. Anal. Appl. 1987, 122, 197–222. [Google Scholar] [CrossRef] [Green Version]
- Choquet, G. Theory of capacities. Annales de L’institut Fourier 1953, 5, 131–295. [Google Scholar] [CrossRef] [Green Version]
- Demirel, T.; Öner, S.C.; Tüzün, S.; Deveci, M.; Öner, M.; Demirel, N.Ç. Choquet integral-based hesitant fuzzy decision-making to prevent soil erosion. Geoderma 2018, 313, 276–289. [Google Scholar] [CrossRef]
- Marichal, J.L.; Roubens, M. Dependence between Criteria and Multiple Criteria Decision Aid. In Proceedings of the 2nd International Workshop on Preferences and Decisions (TRENTO’98), Trento, Italy, 1–3 July 1998; Available online: http://hdl.handle.net/10993/7706 (accessed on 16 February 2020).
- Marcomini, A.; Suter, G.W., II; Critto, A. Decision Support. Systems for Risk-Based Management of Contaminated Sites; Springer: New York, NY, USA, 2009; pp. 168–190. [Google Scholar]
- Wang, W.Z.; Jiao, J. Rainfall and Erosion Sediment Yield in the Loess Plateau and Sediment Transportation in the Yellow River Basin; Science Press: Beijing, China, 1996. (In Chinese) [Google Scholar]
- Wen, X.; Zhen, L. Soil erosion control practices in the Chinese Loess Plateau: A systematic review. Environ. Dev. 2019. [Google Scholar] [CrossRef]
- Wu, Q.J.; Wang, L.H.; Wu, F.Q. Tillage-impact on infiltration of the Loess Plateau of China. Acta Agric. Scand. Sect. B Soil Plant Sci. 2014, 64, 341–349. [Google Scholar] [CrossRef]
- Shi, P.; Zhang, Y.; Ren, Z.; Yu, Y.; Li, P.; Gong, J. Land-use changes and check dams reducing runoff and sediment yield on the Loess Plateau of China. Sci. Total Environ. 2019, 664, 984–994. [Google Scholar] [CrossRef]
- Han, Q.F.; Siddique, K.H.M.; Li, F.M. Adoption of Conservation Tillage on the Semi-Arid Loess Plateau of Northwest China. Sustainability 2018, 10, 2621. [Google Scholar] [CrossRef] [Green Version]
- Feng, X.M.; Fu, B.J.; Piao, S.L.; Wang, S.; Ciais, P.; Zeng, Z.; Lü, Y.; Zeng, Y.; Li, Y.; Jiang, X.; et al. Revegetation in China’s Loess Plateau is approaching sustainable water resource limits. Nat. Clim. Chang. 2016, 6, 1019–1022. [Google Scholar] [CrossRef]
- Li, S.; Liang, W.; Fu, B.J.; Lü, Y.; Fu, S.; Wang, S.; Su, H. Vegetation changes in recent large-scale ecological restoration projects and subsequent impact on water resources in China’s Loess Plateau. Sci. Total Environ. 2016, 569–570, 1032–1039. [Google Scholar] [CrossRef]
- Yan, R.; Zhang, X.P.; Yan, S.J.; Chen, H. Estimating soil erosion response to land use/cover change in a catchment of the Loess Plateau, China. Int. Soil Water Conserv. Res. 2018, 6, 13–22. [Google Scholar] [CrossRef]
- Cheng, J.M.; Jing, Z.B.; Jin, J.W.; Gao, Y. Restoration and utilization mechanism ofde- graded grassland in the semi-arid region of Loess Plateau. Sci. Sin. Vitae 2014, 44, 267–269. (In Chinese) [Google Scholar] [CrossRef]
- Wischmeier, W.H.; Smith, D.D. Predicting Soil Erosion Losses: A Guide to Conservation Planning; USDA Agricultural Handbook No. 537; USDA: Washington, DC, USA, 1978.
- Renard, K.G.; Foster, G.R.; Weesies, G.A.; McCool, D.K.; Yoder, D.C. (Eds.) Predicting Soil Erosion by Water: A Guide to Conservation Planning with the Revised Universal Soil Loss Equation (RUSLE); Agricultural Handbook No. 703; US Department of Agriculture, Agricultural Research Service: Washington, DC, USA, 1997.
- Yuan, X.F.; Han, J.C.; Shao, Y.J.; Li, Y.H.; Wang, Y.S. Geodetection analysis of the driving forces and mechanisms of erosion in the hilly-gully region of northern Shaanxi Province. J. Geogr. Sci. 2019, 29, 779–790. [Google Scholar] [CrossRef] [Green Version]
- Schoorl, J.M.; Sonneveld, M.P.W.; Veldkamp, A. Three-dimensional landscape process modelling: The effect of DEM resolution. Earth Surf. Process. Landf. 2000, 25, 1025–1034. [Google Scholar] [CrossRef]
- Yair, A.; Raz-Yassif, N. Hydrological processes in a small arid catchment: Scale effects of rainfall and slope length. Geomorphology 2004, 61, 155–169. [Google Scholar] [CrossRef]
- ICONA. Guidelines for Mapping and Measurement of Rainfall-induced Erosion Processes in the Mediterranean Coastal Areas; Priority Action Programme Regional Activity Centre: Split, Croatia, 1997. [Google Scholar]


| Data Types | Time | Spatial Resolution | Format | Data Sources |
|---|---|---|---|---|
| Precipitation | year | 1000 m | Raster | China Meteorological Data Service Center and Hydrological Data of Yellow River Basin of Annual Hydrological Report P. R. China [28] |
| DEM | 2003 | 30 m | Raster | Geospatial Data Cloud Site, Computer Network Information Center, Chinese Academy of Sciences [29] |
| Land use | 2015 | - | Polygon | - |
| Soil texture | 1990s | 1000 m | Raster | Data Center for Resources and Environmental Sciences, Chinese Academy of Sciences (RESDC) [30] |
| NDVI (MOD13Q1) | 2015 | 250 m | Raster | Land Processes Distributed Active Archive Center [27] |
| Socio-economic data | 2015 | - | Text | Shanxi statistical year book [31] |
| No. | Parameters | Classification | Normalization Score |
|---|---|---|---|
| 1 | Land use | Farmland | 50 |
| Forest | 10 | ||
| Grassland | 20 | ||
| Water | 0 | ||
| Residential land | 0 | ||
| 2 | Slope gradient (angle gradient) | 0–5 | 0 |
| 5–8 | 45 | ||
| 8–15 | 80 | ||
| 15–25 | 90 | ||
| 25–35 | 95 | ||
| >35 | 100 | ||
| 3 | Aspect | Flat | 0 |
| Sunny slope | 90 | ||
| Semi-shady and semi-sunny slope | 80 | ||
| Shady slope | 70 | ||
| 4 | Precipitation (mm) | <500 | 75 |
| 500–550 | 80 | ||
| 550–600 | 90 | ||
| 600–650 | 100 | ||
| 5 | NDVI | −1–0 | 0 |
| 0–0.2 | 100 | ||
| 0.2–0.4 | 75 | ||
| 0.4–0.6 | 50 | ||
| 0.6–0.8 | 25 | ||
| 0.8–1 | 5 | ||
| 6 | Soil texture | loam | 80 |
| clay loam | 70 |
| Land Use | Description |
|---|---|
| Farmland | Dry land for planting corn and other crops with tillage |
| Forest | Secondary forest (Quercus wutaishanica), artificial forests (Pinus tabulaeformis, Platycladus orientalis, and Robinia pseudoacacia), Orchards and shrub |
| Grassland | Natural cover grassland without management |
| Water | Lakes, rivers and reservoirs |
| Residential land | Rural/urban residential sites, roads, and built-up land for industrial and mining enterprises |
| Unutilized land | Unutilized tillage and abandoned fields |
| Slope Gradient | Precipitation | NDVI | Land Use | Soil Texture | Aspect | Score |
|---|---|---|---|---|---|---|
| 0 | 0 | 0 | 0 | 0 | 0 | 0 |
| 1 | 0 | 0 | 0 | 0 | 0 | 40 |
| 0 | 1 | 0 | 0 | 0 | 0 | 30 |
| 0 | 0 | 1 | 0 | 0 | 0 | 25 |
| 0 | 0 | 0 | 1 | 0 | 0 | 35 |
| 0 | 0 | 0 | 0 | 1 | 0 | 20 |
| 0 | 0 | 0 | 0 | 0 | 1 | 10 |
| 1 | 1 | 0 | 0 | 0 | 0 | 75 |
| 1 | 0 | 1 | 0 | 0 | 0 | 70 |
| 1 | 0 | 0 | 1 | 0 | 0 | 80 |
| 1 | 0 | 0 | 0 | 1 | 0 | 65 |
| 1 | 0 | 0 | 0 | 0 | 1 | 60 |
| 0 | 1 | 1 | 0 | 0 | 0 | 60 |
| 0 | 1 | 0 | 1 | 0 | 0 | 70 |
| 0 | 1 | 0 | 0 | 1 | 0 | 55 |
| 0 | 1 | 0 | 0 | 0 | 1 | 45 |
| 0 | 0 | 1 | 1 | 0 | 0 | 55 |
| 0 | 0 | 1 | 0 | 1 | 0 | 50 |
| 0 | 0 | 1 | 0 | 0 | 1 | 40 |
| 0 | 0 | 0 | 1 | 1 | 0 | 60 |
| 0 | 0 | 0 | 1 | 0 | 1 | 50 |
| 0 | 0 | 0 | 0 | 1 | 1 | 35 |
| 1 | 1 | 1 | 0 | 0 | 0 | 75 |
| 1 | 1 | 0 | 1 | 0 | 0 | 85 |
| 1 | 1 | 0 | 0 | 1 | 0 | 75 |
| 1 | 1 | 0 | 0 | 0 | 1 | 75 |
| 1 | 0 | 1 | 1 | 0 | 0 | 80 |
| 1 | 0 | 1 | 0 | 1 | 0 | 75 |
| 1 | 0 | 1 | 0 | 0 | 1 | 75 |
| 1 | 0 | 0 | 1 | 1 | 0 | 80 |
| 1 | 0 | 0 | 1 | 0 | 1 | 80 |
| 1 | 0 | 0 | 0 | 1 | 1 | 75 |
| 0 | 1 | 1 | 1 | 0 | 0 | 70 |
| 0 | 1 | 1 | 0 | 1 | 0 | 65 |
| 0 | 1 | 1 | 0 | 0 | 1 | 65 |
| 0 | 1 | 0 | 1 | 1 | 0 | 70 |
| 0 | 1 | 0 | 1 | 0 | 1 | 70 |
| 0 | 1 | 0 | 0 | 1 | 1 | 65 |
| 0 | 0 | 1 | 1 | 1 | 0 | 70 |
| 0 | 0 | 1 | 1 | 0 | 1 | 70 |
| 0 | 0 | 1 | 0 | 1 | 1 | 60 |
| 0 | 0 | 0 | 1 | 1 | 1 | 70 |
| 1 | 1 | 1 | 1 | 0 | 0 | 90 |
| 1 | 1 | 1 | 0 | 1 | 0 | 80 |
| 1 | 1 | 1 | 0 | 0 | 1 | 80 |
| 1 | 1 | 0 | 1 | 1 | 0 | 90 |
| 1 | 1 | 0 | 1 | 0 | 1 | 90 |
| 1 | 1 | 0 | 0 | 1 | 1 | 80 |
| 1 | 0 | 1 | 1 | 1 | 0 | 85 |
| 1 | 0 | 1 | 1 | 0 | 1 | 85 |
| 1 | 0 | 1 | 0 | 1 | 1 | 75 |
| 1 | 0 | 0 | 1 | 1 | 1 | 85 |
| 0 | 1 | 1 | 1 | 1 | 0 | 70 |
| 0 | 1 | 1 | 1 | 0 | 1 | 70 |
| 0 | 1 | 1 | 0 | 1 | 1 | 65 |
| 0 | 1 | 0 | 1 | 1 | 1 | 70 |
| 0 | 0 | 1 | 1 | 1 | 1 | 65 |
| 1 | 1 | 1 | 1 | 1 | 0 | 95 |
| 1 | 1 | 1 | 1 | 0 | 1 | 90 |
| 1 | 1 | 1 | 0 | 1 | 1 | 75 |
| 1 | 1 | 0 | 1 | 1 | 1 | 85 |
| 1 | 0 | 1 | 1 | 1 | 1 | 80 |
| 0 | 1 | 1 | 1 | 1 | 1 | 70 |
| 1 | 1 | 1 | 1 | 1 | 1 | 100 |
| Items | MCDA Methodology | USLE Model [63,64] |
|---|---|---|
| Input | Rainfall, slope, aspect, land use, soil texture and NDVI | Rainfall-runoff erosivity factor, soil erodibility factor, slope length and the slope steepness factor, land cover and management factor and the support and conservation practices factor |
| Output | Soil erosion risk score and class | Average annual soil loss |
| Erosion types | Multiple erosion types | Water erosion |
| Assessment scale | Multiple scale | Large scale |
| The synergistic and inhibitory effects and different importance among erosion factors | Considered by expert judgement | Not considered |
| Advantages and disadvantages | Commend in Section 3.5 | Widely applied No consideration of the synergistic and inhibitory effects and different importance among erosion factors |
© 2020 by the authors. Licensee MDPI, Basel, Switzerland. This article is an open access article distributed under the terms and conditions of the Creative Commons Attribution (CC BY) license (http://creativecommons.org/licenses/by/4.0/).
Share and Cite
Zhang, H.; Zhang, J.; Zhang, S.; Yu, C.; Sun, R.; Wang, D.; Zhu, C.; Zhang, J. Identification of Priority Areas for Soil and Water Conservation Planning Based on Multi-Criteria Decision Analysis Using Choquet Integral. Int. J. Environ. Res. Public Health 2020, 17, 1331. https://doi.org/10.3390/ijerph17041331
Zhang H, Zhang J, Zhang S, Yu C, Sun R, Wang D, Zhu C, Zhang J. Identification of Priority Areas for Soil and Water Conservation Planning Based on Multi-Criteria Decision Analysis Using Choquet Integral. International Journal of Environmental Research and Public Health. 2020; 17(4):1331. https://doi.org/10.3390/ijerph17041331
Chicago/Turabian StyleZhang, Haibo, Jianjun Zhang, Shouhong Zhang, Chunxue Yu, Ruoxiu Sun, Dandan Wang, Chunzhu Zhu, and Jianan Zhang. 2020. "Identification of Priority Areas for Soil and Water Conservation Planning Based on Multi-Criteria Decision Analysis Using Choquet Integral" International Journal of Environmental Research and Public Health 17, no. 4: 1331. https://doi.org/10.3390/ijerph17041331