Activity Demands and Speed Profile of Young Female Basketball Players Using Ultra-Wide Band Technology


Abstract
:1. Introduction
2. Materials and Methods
2.1. Participants
2.2. Variables
- Real time (RT): Time in minutes that each match lasted. Rest periods between quarters and timeouts were excluded from the study.
- Playing time (PT): Time collected in the stats when the ball was alive for each player.
- Distance (D): Number of metres covered by the players while on the field.
- Speed Zones (SZ): The total distance covered was classified into the following speed zones of five intensity levels (Table 1): Standing, Walking, Jogging, Running and Sprinting, analysing the metres covered in each group and the percentage based on the total metres.
- Explosive distance (ED): Distance covered at over >10.2 km/h.
- Distance covered sprinting (HID): High intensity distance covered at over 14.4 km/h.
- Number of sprints: Number of times the player exceeded a speed of 14.4 km/h.
- Sprint duration: Time in seconds spent in each sprint repetition.
- Maximum speed: Maximum speed reached by a player during the match (km/h).
- Average speed: Average speed of a player’s locomotion during the match (km/h).
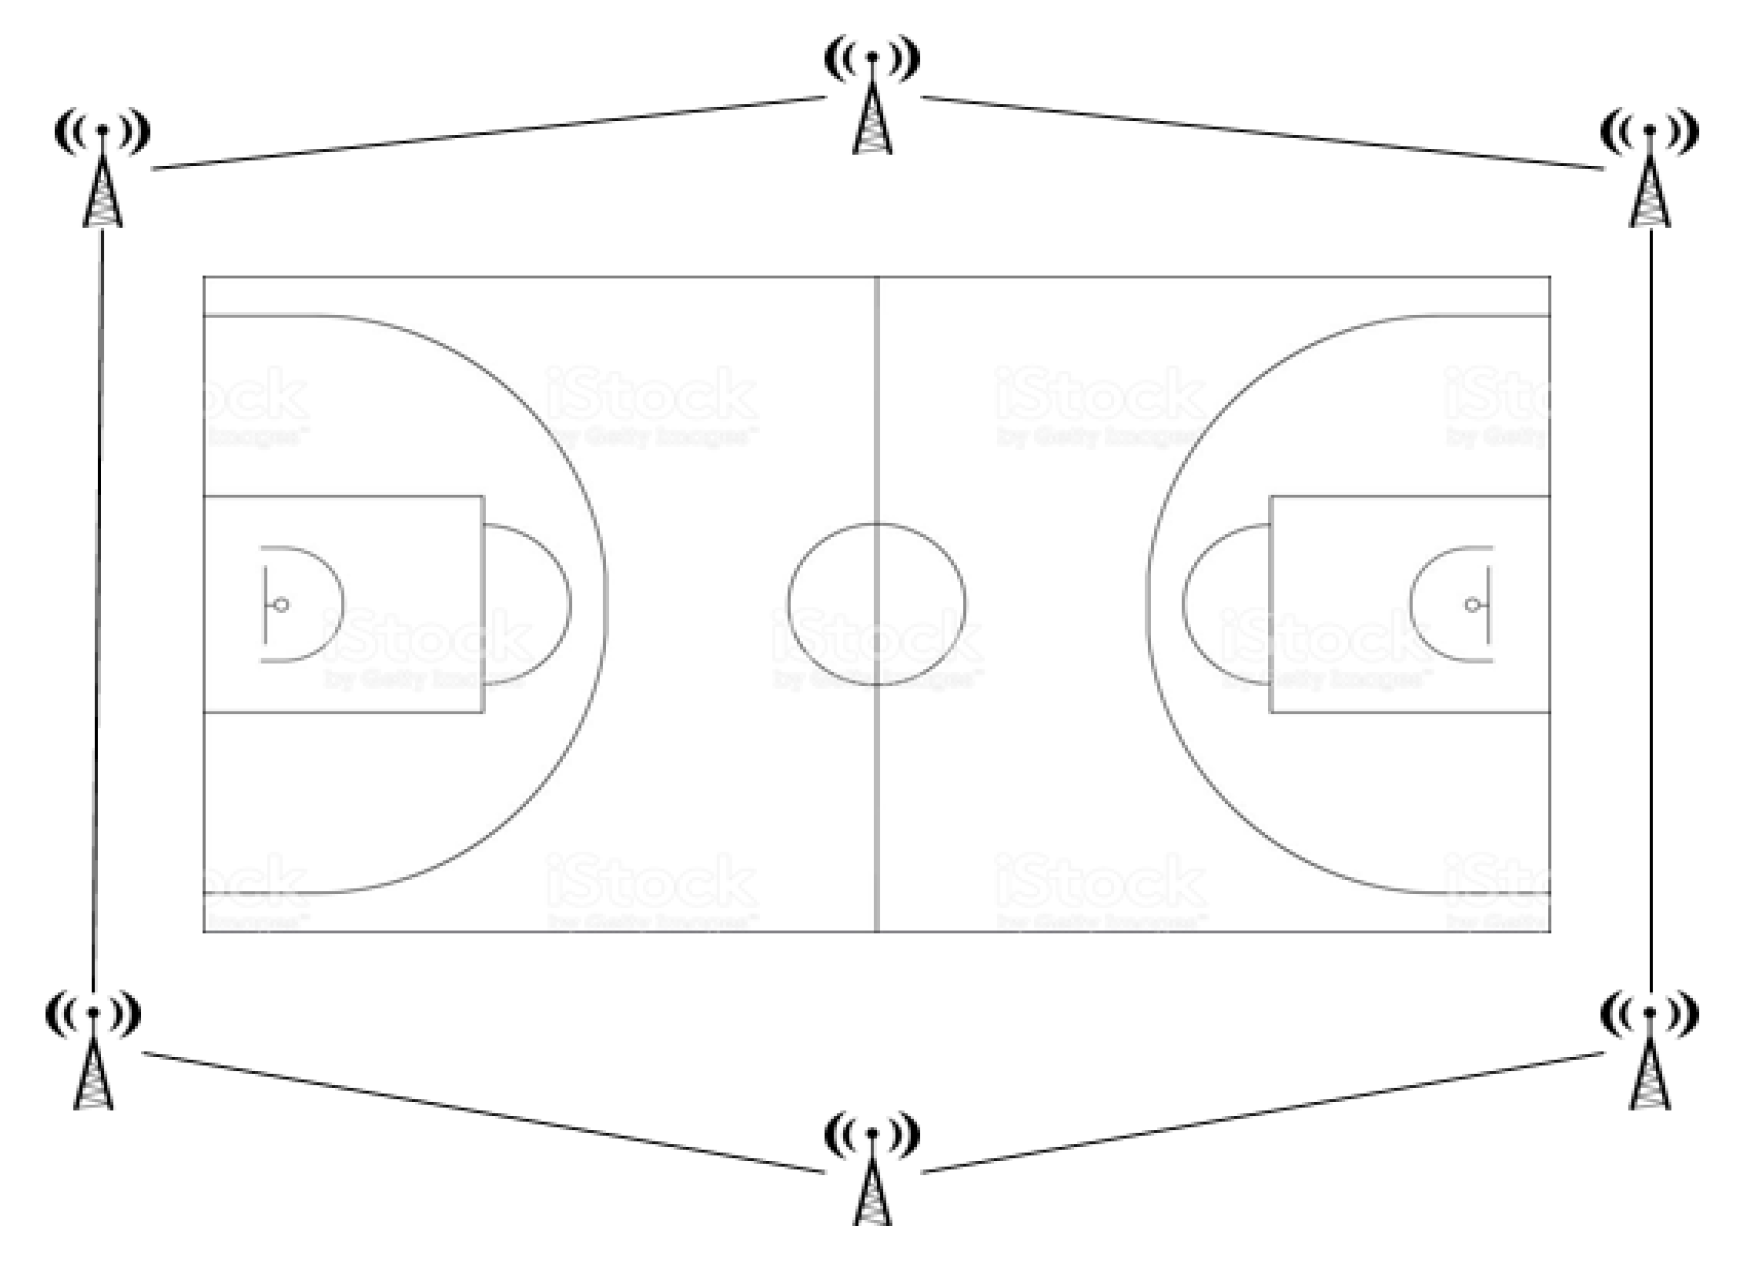
2.3. Match Analysis
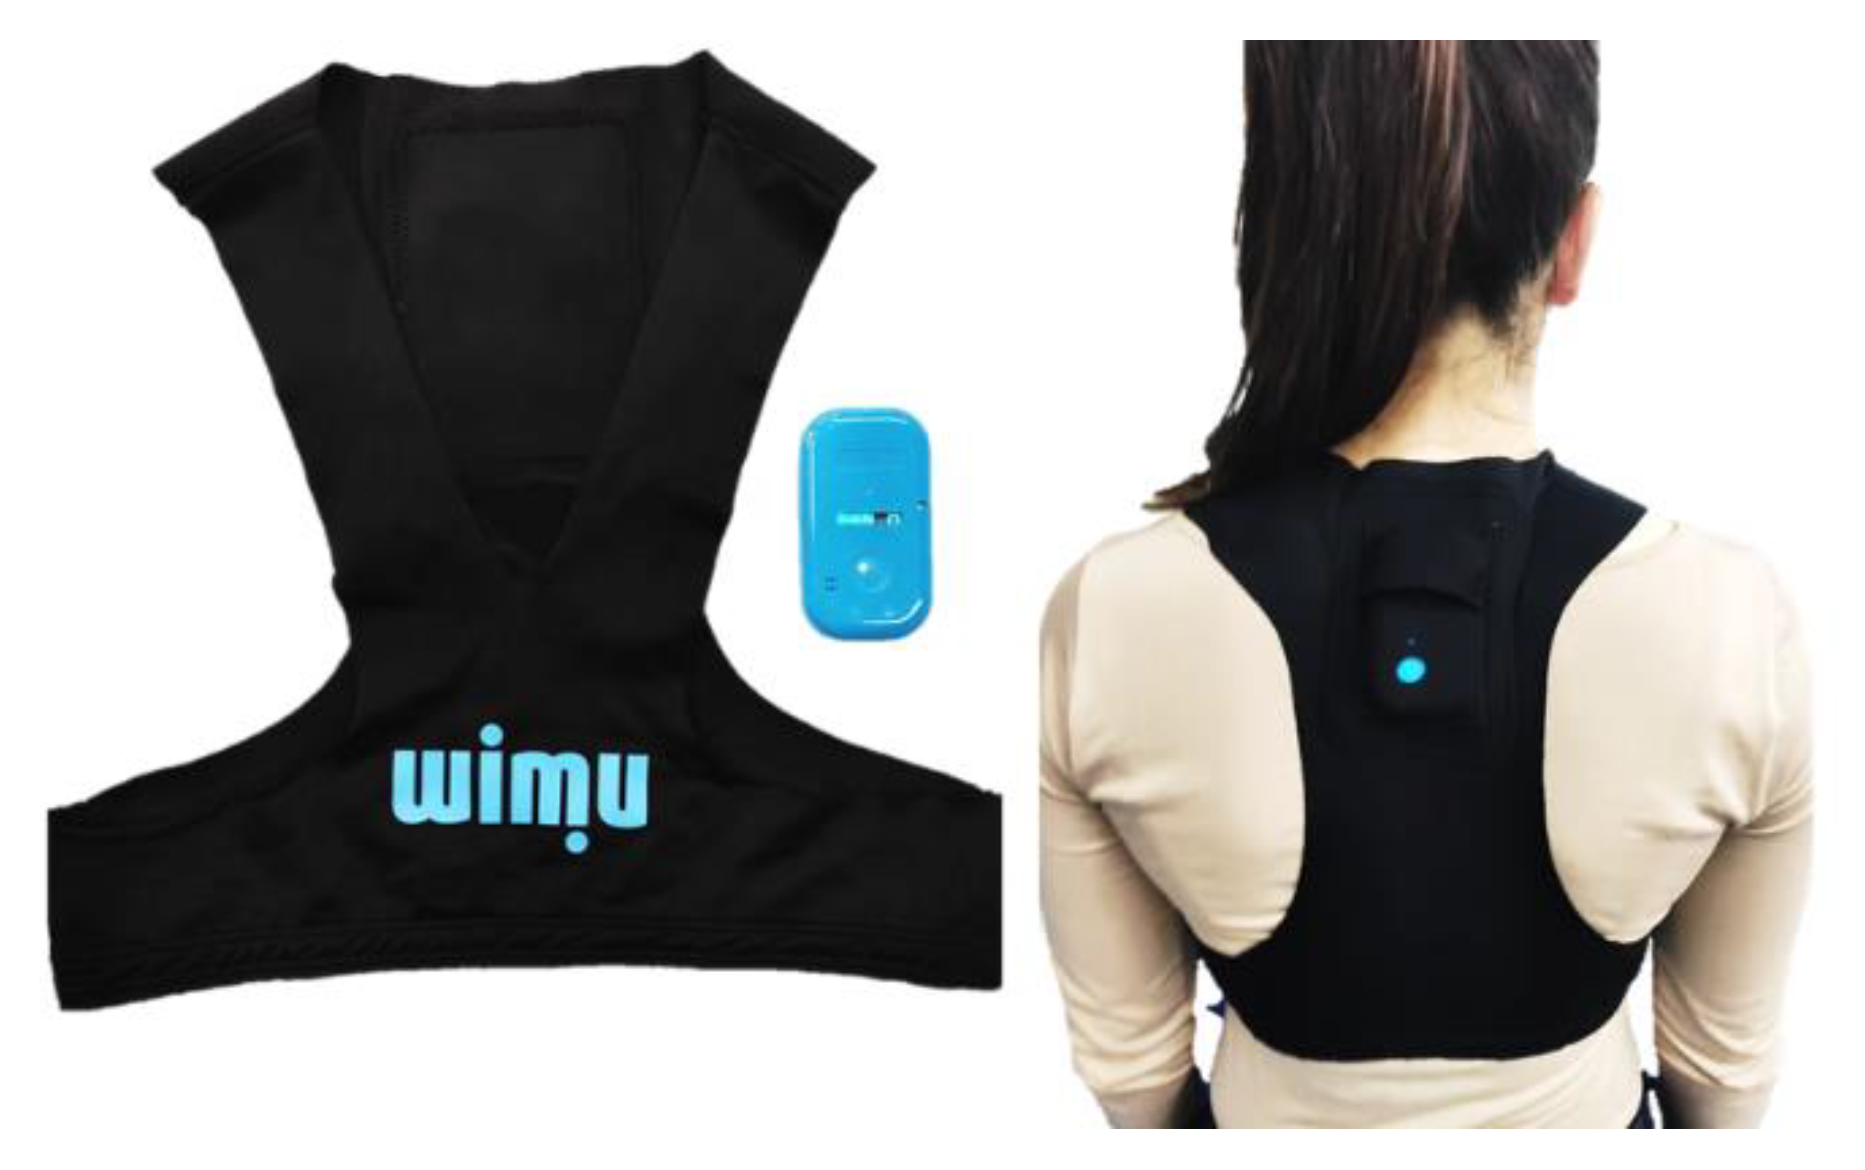
2.4. Equipment
2.5. Statistical Analysis
3. Results
Descriptive results
4. Discussion
5. Conclusions
Limitations and Practical Applications
Author Contributions
Funding
Conflicts of Interest
References
- Delextrat, A.; Cohen, D. Physiological Testing of Basketball Players: Toward a Standard Evaluation of Anaerobic Fitness. J. Strength Cond. Res. 2008, 22, 1066–1072. [Google Scholar] [CrossRef] [PubMed]
- Drinkwater, E.; Pyne, D.B.; McKenna, M.J.; Drinkwater, E. Design and Interpretation of Anthropometric and Fitness Testing of Basketball Players. Sports Med. 2008, 38, 565–578. [Google Scholar] [CrossRef]
- Fort, A.; Montalvo, A.; Latinjak, A.T.; Unnithan, V. Physical characteristics of elite adolescent female basketball players and their relationship to match performance. J. Hum. Kinet. 2016, 53, 167–178. [Google Scholar] [CrossRef] [PubMed] [Green Version]
- McGarry, T. Routledge Handbook of Sports Performance Analysis; Informa UK Limited: London, UK, 2012. [Google Scholar]
- Ostojic, S.M.; Mazic, S.; Dikic, N. Profiling in Basketball: Physical and Physiological Characteristics of Elite Players. J. Strength Cond. Res. 2006, 20, 740. [Google Scholar] [CrossRef] [PubMed]
- Buchheit, M.; Simpson, B.M. Player-Tracking Technology: Half-Full or Half-Empty Glass? Int. J. Sports Physiol. Perform. 2017, 12, S2–S35. [Google Scholar] [CrossRef] [Green Version]
- Reina, M.; García-Rubio, J.; Pino-Ortega, J.; Ibáñez, S. The Acceleration and Deceleration Profiles of U-18 Women’s Basketball Players during Competitive Matches. Sports 2019, 7, 165. [Google Scholar] [CrossRef] [Green Version]
- Scanlan, A.T.; Dascombe, B.J.; Reaburn, P.R.J.; Dalbo, V. The physiological and activity demands experienced by Australian female basketball players during competition. J. Sci. Med. Sport 2012, 15, 341–347. [Google Scholar] [CrossRef]
- Ben Abdelkrim, N.; Castagna, C.; Jabri, I.; Battikh, T.; El Fazaa, S.; El Ati, J. Activity Profile and Physiological Requirements of Junior Elite Basketball Players in Relation to Aerobic-Anaerobic Fitness. J. Strength Cond. Res. 2010, 24, 2330–2342. [Google Scholar] [CrossRef]
- Scanlan, A.T.; Tucker, P.; Dascombe, B.J.; Berkelmans, D.M.; Hiskens, M.I.; Dalbo, V. Fluctuations in Activity Demands Across Game Quarters in Professional and Semiprofessional Male Basketball. J. Strength Cond. Res. 2015, 29, 3006–3015. [Google Scholar] [CrossRef]
- Delextrat, A.; Badiella, A.; Saavedra, V.; Matthew, D.; Schelling, X.; Torres-Ronda, L. Match activity demands of elite Spanish female basketball players by playing position. Int. J. Perform. Anal. Sport 2015, 15, 687–703. [Google Scholar] [CrossRef]
- Scanlan, A.T.; Dascombe, B.; Reaburn, P.R.J. A comparison of the activity demands of elite and sub-elite Australian men’s basketball competition. J. Sports Sci. 2011, 29, 1153–1160. [Google Scholar] [CrossRef] [PubMed]
- Matthew, D.; Delextrat, A. Heart rate, blood lactate concentration, and time–motion analysis of female basketball players during competition. J. Sports Sci. 2009, 27, 813–821. [Google Scholar] [CrossRef] [PubMed]
- Stojanović, E.; Stojiljković, N.; Scanlan, A.T.; Dalbo, V.; Berkelmans, D.M.; Milanović, Z. The Activity Demands and Physiological Responses Encountered During Basketball Match-Play: A Systematic Review. Sports Med. 2017, 48, 111–135. [Google Scholar] [CrossRef] [PubMed]
- Bastida-Castillo, A.; Gómez-Carmona, C.D.; De La Cruz-Sánchez, E.; Reche, X.; Ibañez, S.J.; Pino-Ortega, J. Accuracy and Inter-Unit Reliability of Ultra-Wide-Band Tracking System in Indoor Exercise. Appl. Sci. 2019, 9, 939. [Google Scholar] [CrossRef] [Green Version]
- Field, A. Discovering Statistics Using SPSS; Sage Publications: London, UK, 2009. [Google Scholar]
- Thalheimer, W.; Cook, S. How to calculate effect sizes from published research: A simplified methodology. Work-Learn. Res. 2002, 1–9. [Google Scholar]
- Ziv, G.; Lidor, R. Physical attributes, physiological characteristics, on-court performances and nutritional strategies of female and male basketball players. Sports Med. 2009, 39, 547–568. [Google Scholar] [CrossRef]
- Ibáñez, S.J.; García, J.; Feu, S.; Lorenzo, A.; Sampaio, J. Effects of Consecutive Basketball Games on the Game-Related Statistics that Discriminate Winner and Losing Teams. J. Sports Sci. Med. 2009, 8, 458–462. [Google Scholar]
- Pino-Ortega, J.; Rojas-Valverde, D.; Gómez-Carmona, C.D.; Bastida-Castillo, A.; Hernández-Belmonte, A.; García-Rubio, J.; Nakamura, F.Y.; Ibáñez, S.J. Impact of Contextual Factors on External Load During a Congested-Fixture Tournament in Elite U’18 Basketball Players. Front. Psychol. 2019, 10, 1100. [Google Scholar] [CrossRef] [Green Version]
- Ben Abdelkrim, N.; El Fazaa, S.; El Ati, J. Time–motion analysis and physiological data of elite under-19-year-old basketball players during competition. Br. J. Sports Med. 2006, 41, 69–75. [Google Scholar] [CrossRef]
- Oba, W.; Okuda, T. A Cross-sectional Comparative Study of Movement Distances and Speed of the Players and a Ball in Basketball Game. Int. J. Sport Health Sci. 2008, 6, 203–212. [Google Scholar] [CrossRef] [Green Version]
- Hulka, K.; Cuberek, R.; Belka, J.; Bìlka, J. Heart rate and time-motion analyses in top junior players during basketball matches. Acta Gymnica 2013, 43, 27–35. [Google Scholar] [CrossRef] [Green Version]
- Conte, D.; Favero, T.G.; Lupo, C.; Francioni, F.M.; Capranica, L.; Tessitore, A. Time-motion analysis of Italian elite women’s basketball games: Individual and team analyses. J. Strength Cond. Res. 2015, 29, 144–150. [Google Scholar] [CrossRef] [PubMed]
- Cui, Y.; Gómez, M.A.; Gonçalves, B.; Sampaio, J. Performance profiles of professional female tennis players in grand slams. PLoS ONE 2018, 13, e0200591. [Google Scholar] [CrossRef] [PubMed]

| Intensity Levels | Speed |
|---|---|
| Standing | <3.6 km/h (<1 m·s−1) |
| Walking | 3.6–6.5 km/h (1–1.81 m·s−1) |
| Jogging | 6.5–10.2 km/h (1.81–2.83 m·s−1) |
| Running | 10.2–14.4 km/h (2.83–4 m·s−1) |
| Sprinting | >14.4 km/h (>4 m·s−1) |
| Variables | DAY 1 | DAY 2 | DAY 3 | d | |||
|---|---|---|---|---|---|---|---|
| Mean | Maximum | Mean | Maximum | Mean | Maximum | ||
| Real time (minutes) | 33.00 | 66.20 | 28.52 | 60.55 | 34.38 | 65.53 | |
| Playing time (minutes) | 18.25 | 37.02 | 18.69 | 38.10 | 19.57 | 35.22 | |
| Distance (metres) | 1995.27 | 4077.04 | 2118.36 | 4825.17 | 2388.61 | 4287.87 | b |
| Distance/minute | 112.67 | 310.73 | 113.74 | 170.73 | 123.96 | 304.25 | a, b |
| Explosive Distance (metres) | 235.71 | 547.83 | 270.12 | 586.04 | 292.72 | 534.79 | |
| Explosive Distance/minute | 14.00 | 42.66 | 15.14 | 34.56 | 15.48 | 34.04 | a, b |
| Standing (metres) | 389.90 | 893.35 | 355.85 | 823.89 | 417.03 | 885.92 | |
| Standing (%) | 20.15 | 37.87 | 17.22 | 32.74 | 17.13 | 24.30 | |
| Walking (metres) | 567.23 | 1228.98 | 562.72 | 1417.76 | 655.68 | 1266.07 | |
| Walking (%) | 27.52 | 36.00 | 26.65 | 50.61 | 26.79 | 35.02 | |
| Jogging (metres) | 439.14 | 904.53 | 495.34 | 1163.97 | 539.28 | 981.98 | |
| Jogging (%) | 21.51 | 27.46 | 22.86 | 28.59 | 22.73 | 29.13 | |
| Running (metres) | 403.22 | 909.28 | 487.77 | 1178.10 | 541.28 | 1115.27 | b |
| Running (%) | 20.18 | 35.52 | 22.25 | 30.41 | 22.72 | 31.81 | |
| Sprinting (metres) | 195.77 | 477.48 | 216.69 | 542.57 | 235.34 | 526.94 | |
| Sprinting (%) | 10.65 | 30.08 | 11.03 | 24.47 | 10.63 | 18.83 | |
| N°. Sprints (n) | 21.86 | 67.00 | 26.18 | 80.00 | 27.69 | 74.00 | |
| Sprint/minute | 1.56 | 11.10 | 1.49 | 3.70 | 1.51 | 2.98 | |
| Sprint Distance (metres) | 244.91 | 618.59 | 274.56 | 678.88 | 300.67 | 670.90 | |
| Sprint Duration (seconds) | 2.68 | 3.92 | 2.63 | 7.84 | 2.97 | 8.91 | |
| Max Speed (km/h) | 19.05 | 27.22 | 19.95 | 27.70 | 18.67 | 21.77 | |
| Avg Speed (km/h) | 5.05 | 6.78 | 5.42 | 6.81 | 5.41 | 6.28 | a, b |
| Variables | GUARD | FORWARD | CENTRE | d | |||
|---|---|---|---|---|---|---|---|
| Mean | Maximum | Mean | Maximum | Mean | Maximum | ||
| Real time (minutes) | 27.00 | 58.53 | 41.07 | 66.20 | 31.14 | 65.53 | d |
| Playing time (minutes) | 16.11 | 35.22 | 23.56 | 38.10 | 18.67 | 32.72 | d, f |
| Distance (metres) | 1816.37 | 4077.04 | 2820.64 | 4825.17 | 2076.29 | 4347.47 | d, f |
| Distance/minute | 114.91 | 310.73 | 122.75 | 304.25 | 112.78 | 147.22 | |
| Explosive Distance (metres) | 233.16 | 471.99 | 351.61 | 586.04 | 231.20 | 509.36 | d, f |
| Explosive Distance/minute | 15.12 | 42.66 | 15.89 | 34.56 | 13.25 | 25.79 | |
| Standing (metres) | 326.05 | 830.03 | 497.09 | 893.35 | 380.10 | 885.92 | d, f |
| Standing (%) | 18.73 | 37.87 | 17.39 | 23.44 | 18.21 | 23.44 | |
| Walking (metres) | 495.42 | 1211.27 | 772.45 | 1417.76 | 579.68 | 1249.05 | d, f |
| Walking (%) | 26.81 | 50.61 | 26.96 | 32.59 | 27.38 | 35.02 | |
| Jogging (metres) | 425.04 | 1003.89 | 623.33 | 1163.97 | 462.84 | 1027.61 | d, f |
| Jogging (%) | 22.58 | 28.46 | 21.77 | 24.74 | 22.50 | 29.13 | |
| Running (metres) | 395.24 | 873.65 | 634.23 | 1115.27 | 448.34 | 1178.10 | d, f |
| Running (%) | 21.51 | 35.52 | 22.38 | 26.96 | 21.16 | 30.41 | |
| Sprinting (metres) | 174.61 | 477.48 | 293.53 | 542.57 | 205.33 | 457.08 | d, f |
| Sprinting (%) | 10.37 | 25.55 | 11.49 | 30.08 | 10.74 | 18.83 | |
| N°. Sprints (n) | 21.12 | 74.00 | 32.62 | 60.00 | 25.39 | 80.00 | d |
| Sprint/minute | 1.40 | 3.33 | 1.58 | 3.70 | 1.66 | 11.10 | |
| Sprint Distance (metres) | 217.76 | 618.59 | 375.35 | 678.88 | 261.45 | 579.31 | d, f |
| Sprint Duration (seconds) | 2.77 | 8.91 | 2.74 | 3.22 | 2.75 | 3.29 | |
| Max Speed (km/h) | 19.16 | 27.70 | 19.64 | 27.22 | 18.98 | 22.71 | |
| Avg Speed (km/h) | 5.25 | 6.27 | 5.39 | 6.81 | 5.25 | 6.28 | |
© 2020 by the authors. Licensee MDPI, Basel, Switzerland. This article is an open access article distributed under the terms and conditions of the Creative Commons Attribution (CC BY) license (http://creativecommons.org/licenses/by/4.0/).
Share and Cite
Reina, M.; García-Rubio, J.; Ibáñez, S.J. Activity Demands and Speed Profile of Young Female Basketball Players Using Ultra-Wide Band Technology. Int. J. Environ. Res. Public Health 2020, 17, 1477. https://doi.org/10.3390/ijerph17051477
Reina M, García-Rubio J, Ibáñez SJ. Activity Demands and Speed Profile of Young Female Basketball Players Using Ultra-Wide Band Technology. International Journal of Environmental Research and Public Health. 2020; 17(5):1477. https://doi.org/10.3390/ijerph17051477
Chicago/Turabian StyleReina, María, Javier García-Rubio, and Sergio J. Ibáñez. 2020. "Activity Demands and Speed Profile of Young Female Basketball Players Using Ultra-Wide Band Technology" International Journal of Environmental Research and Public Health 17, no. 5: 1477. https://doi.org/10.3390/ijerph17051477
APA StyleReina, M., García-Rubio, J., & Ibáñez, S. J. (2020). Activity Demands and Speed Profile of Young Female Basketball Players Using Ultra-Wide Band Technology. International Journal of Environmental Research and Public Health, 17(5), 1477. https://doi.org/10.3390/ijerph17051477