Trajectories of Depressive Symptoms and Neighborhood Changes from Adolescence to Adulthood: Latent Class Growth Analysis and Multilevel Growth Curve Models


Abstract
:1. Introduction
1.1. Changes in Neighborhood Socioeconomic Status and Depression across Race/Ethnicity
1.2. Changes in Neighborhood Racial/Ethnic Composition and Depression across Race/Ethnicity
1.3. The Current Study
2. Methods and Measures
2.1. Statistical Analyses
2.1.1. Step 1. Latent Class Growth Analysis
2.1.2. Step 2. Multilevel Growth Curve Model
3. Results
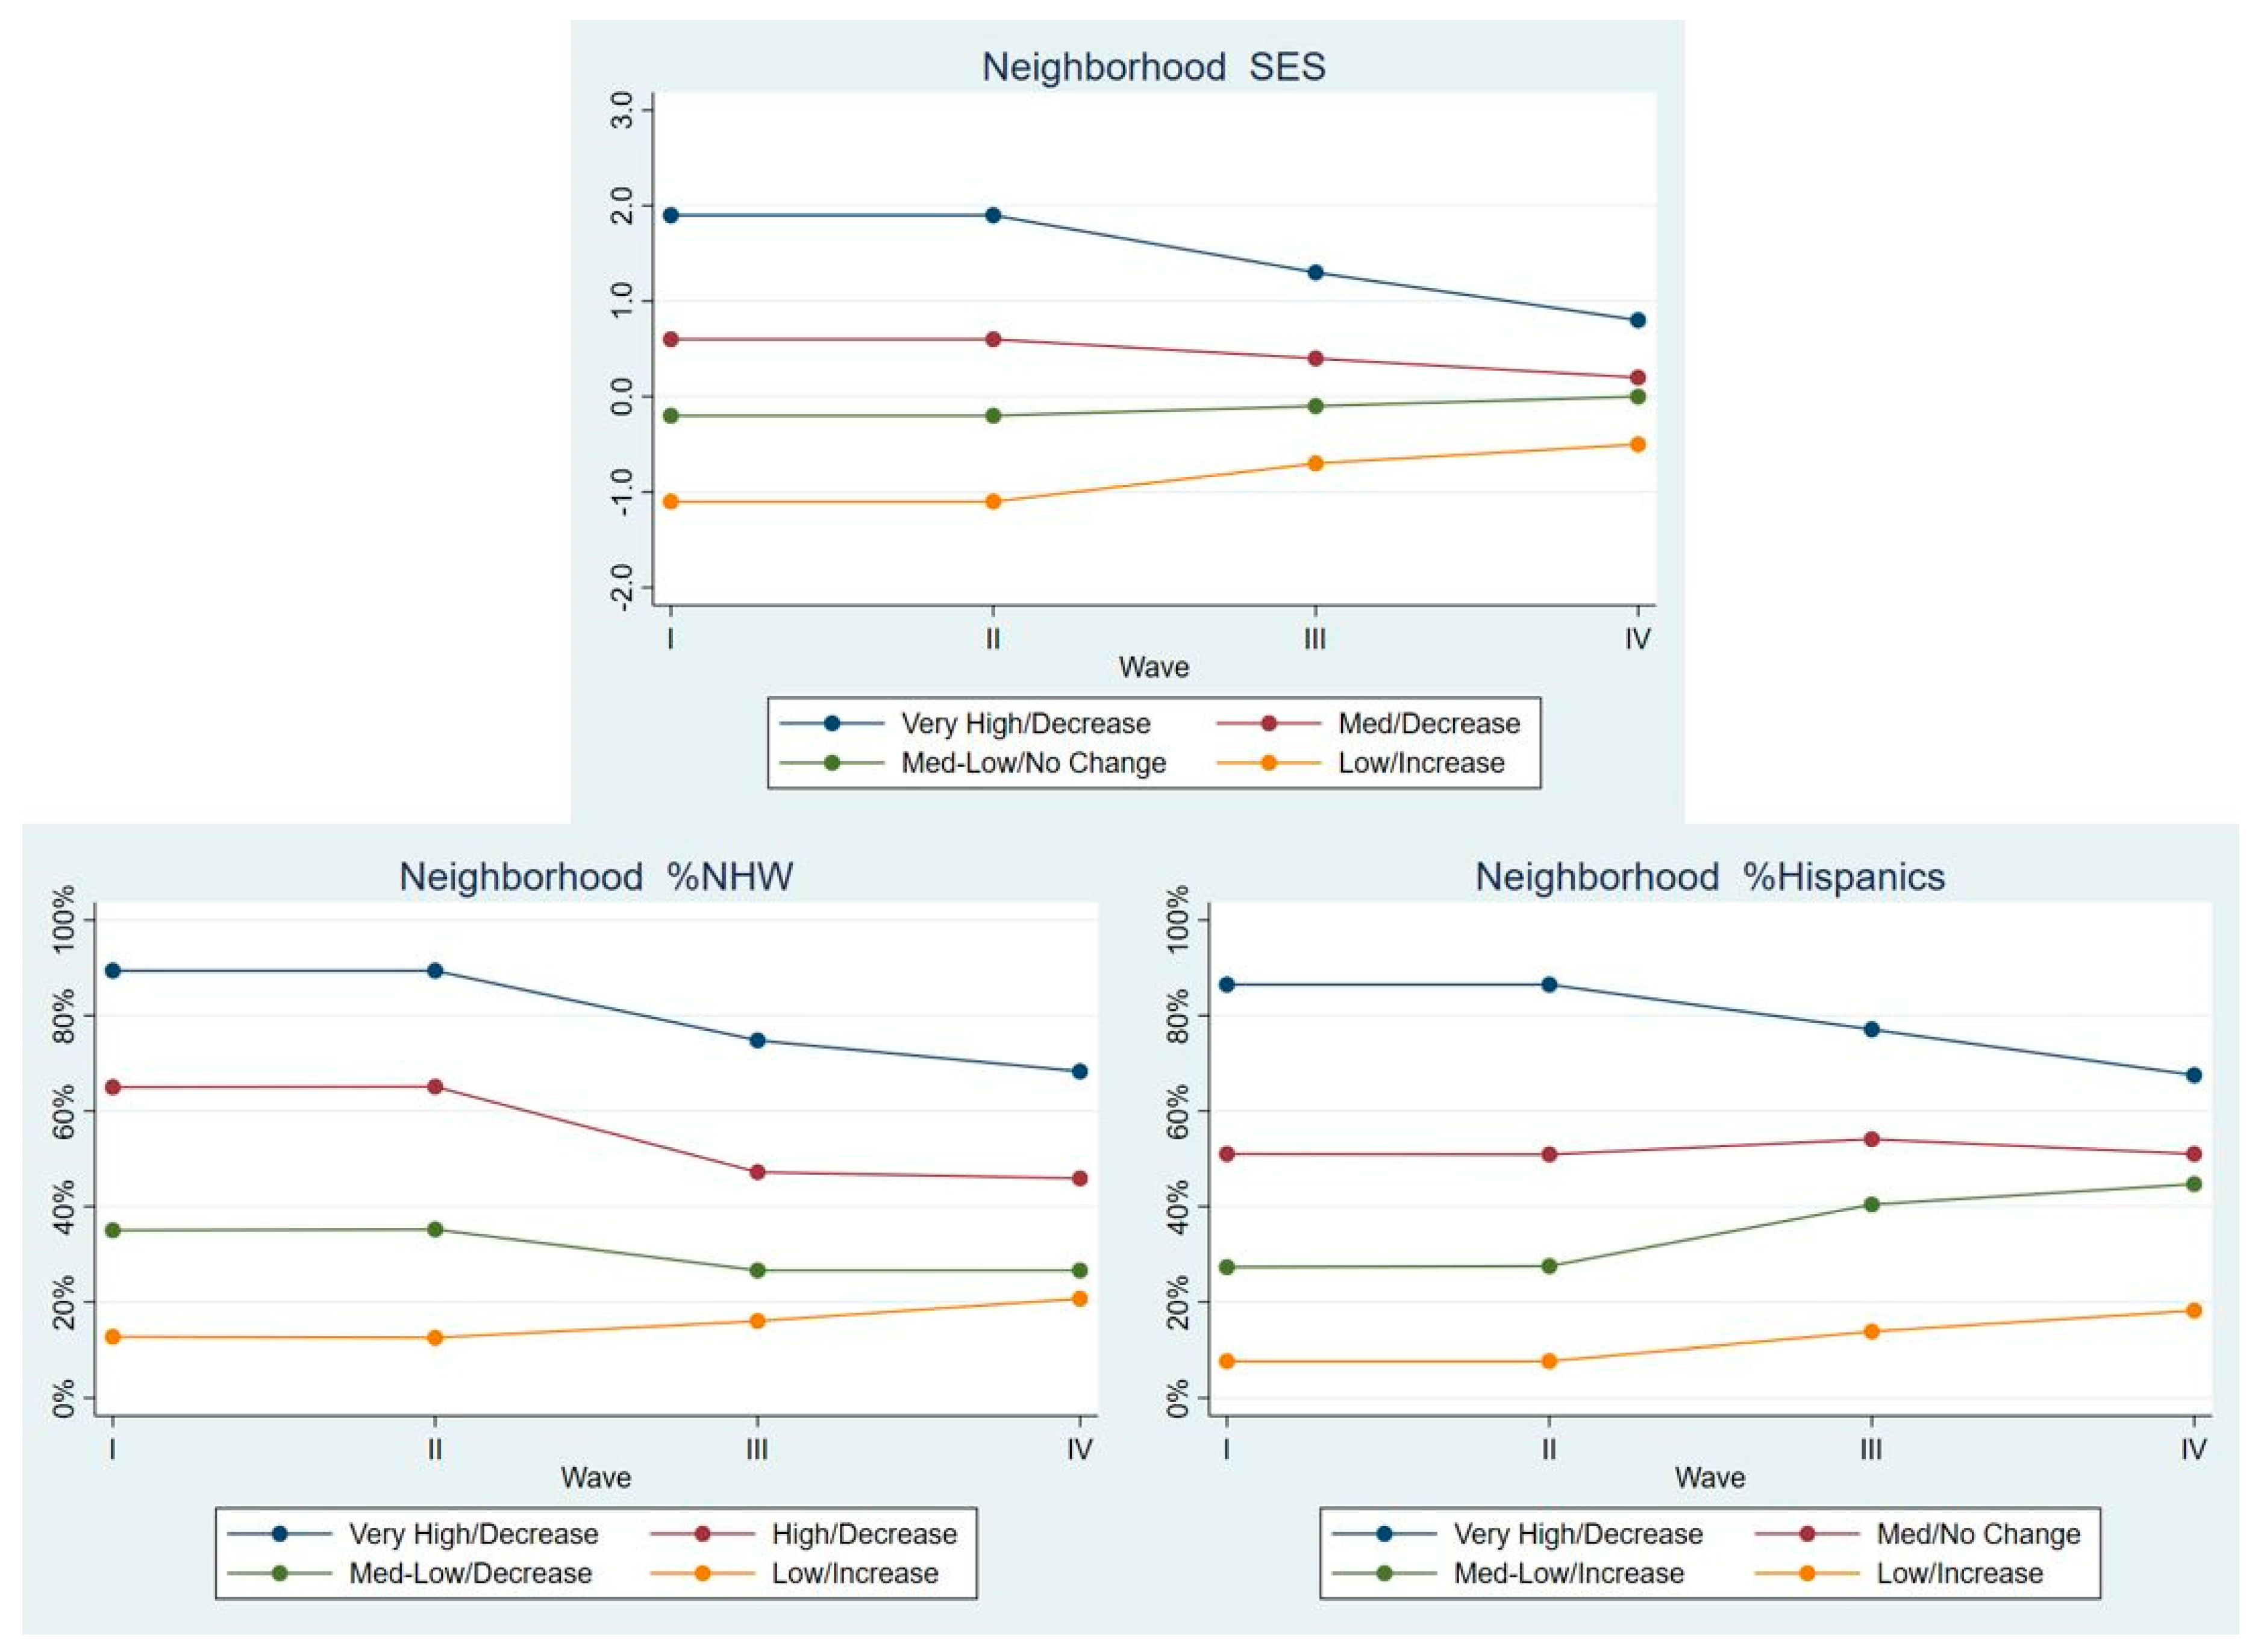
3.1. Latent Class Growth Analysis
3.2. Multi-Level Growth Curve Model
Results from the MGCM are presented in Table 2
4. Discussion
4.1. Changes in Neighborhood Socio-Economic Environments and Depression Trajectories
4.2. Changes in Neighborhood Racial/Ethnic Composition and Depression Trajectories
5. Conclusions
Author Contributions
Funding
Acknowledgments
Conflicts of Interest
References
- Mair, C.; Roux, A.V.D.; Galea, S. Are Neighbourhood Characteristics Associated with Depressive Symptoms? A Review of Evidence. J. Epidemiol. Community Health 2008, 62, 940–946. [Google Scholar] [PubMed]
- Blair, A.; Ross, N.A.; Gariepy, G.; Schmitz, N. How Do Neighborhoods Affect Depression Outcomes? A Realist Review and a Call for the Examination of Causal Pathways. Soc. Psychiatry Psychiatr. Epidemiol. 2014, 49, 873–887. [Google Scholar] [CrossRef] [PubMed]
- Richardson, R.; Westley, T.; Gariepy, G.; Austin, N.; Nandi, A. Neighborhood Socioeconomic Conditions and Depression: A Systematic Review and Meta-Analysis. Soc. Psychiatry Psychiatr. Epidemiol. 2015, 50, 1641–1656. [Google Scholar] [CrossRef]
- Estrada-Martínez, L.M.; Lee, H.; Shapiro, E. Trajectories of Depressive Symptoms from Adolescence to Adulthood among Multiple Latino Subgroups. J. Latinx Psychol. 2019, 7, 322–338. [Google Scholar] [CrossRef]
- Goldstein, R.B.; Lee, A.K.; Haynie, D.L.; Luk, J.W.; Fairman, B.J.; Liu, D.; Jeffers, J.S.; Simons-Morton, B.G.; Gilman, S.E. Neighbourhood Disadvantage and Depressive Symptoms among Adolescents Followed into Emerging Adulthood. J. Epidemiol. Community Health 2019, 73, 590–597. [Google Scholar] [CrossRef] [PubMed] [Green Version]
- Fong, P.; Cruwys, T.; Haslam, C.; Haslam, S.A. Neighbourhood Identification Buffers the Effects of (de-) Gentrification and Personal Socioeconomic Position on Mental Health. Health Place 2019, 57, 247–256. [Google Scholar] [CrossRef] [PubMed]
- Brazil, N.; Clark, W.A.V. Individual Mental Health, Life Course Events and Dynamic Neighbourhood Change during the Transition to Adulthood. Health Place 2017, 45, 99–109. [Google Scholar] [CrossRef]
- Ostir, G.V.; Eschbach, K.; Markides, K.S.; Goodwin, J.S. Neighbourhood Composition and Depressive Symptoms among Older Mexican Americans. J. Epidemiol. Community Health 2003, 57, 987–992. [Google Scholar] [CrossRef] [Green Version]
- Simons, R.L.; Murry, V.; McLoyd, V.; Lin, K.-H.; Cutrona, C.; Conger, R.D. Discrimination, Crime, Ethnic Identity, and Parenting as Correlates of Depressive Symptoms among African American Children: A Multilevel Analysis. Dev. Psychopathol. 2002, 14, 371–393. [Google Scholar] [CrossRef] [Green Version]
- Allen, J.; Balfour, R.; Bell, R.; Marmot, M. Social Determinants of Mental Health. Int. Rev. Psychiatry 2014, 26, 392–407. [Google Scholar] [CrossRef]
- McBride Murry, V.; Berkel, C.; Gaylord-Harden, N.K.; Copeland-Linder, N.; Nation, M. Neighborhood Poverty and Adolescent Development. J. Res. Adolesc. 2011, 21, 114–128. [Google Scholar] [CrossRef]
- Kann, L.; McManus, T.; Harris, W.A.; Shanklin, S.L.; Flint, K.H.; Queen, B.; Lowry, R.; Chyen, D.; Whittle, L.; Thornton, J.; et al. Youth Risk Behavior Surveillance—United States, 2017. Morb. Mortal. Wkly. Rep. Surveill. Summ. 2018, 67, 1. [Google Scholar] [CrossRef] [PubMed]
- Substance Abuse and Mental Health Services Administration. Key Substance Use and Mental Health Indicators in the United States: Results from the 2018 National Survey on Drug Use and Health (HHS Publication No. PEP19-5068, NSDUH Series H-54); Center for Behavioral Health Statistics and Quality, Substance Abuse and Mental Health Services Administration: Rockville, MD, USA, 2019. [Google Scholar]
- National Institute of Mental Health (NIMH). Major Depression. Available online: https://www.nimh.nih.gov/health/statistics/major-depression.shtml (accessed on 17 January 2020).
- Gee, G.C.; Walsemann, K.M.; Brondolo, E. A Life Course Perspective on How Racism May Be Related to Health Inequities. Am. J. Public Health 2012, 102, 967–974. [Google Scholar] [CrossRef]
- Williams, D.R.; Lawrence, J.A.; Davis, B.A. Racism and Health: Evidence and Needed Research. Annu. Rev. Public Health 2019. [Google Scholar] [CrossRef] [Green Version]
- Williams, D.R.; Collins, C. Racial Residential Segregation: A Fundamental Cause of Racial Disparities in Health. Public Health Rep. 2001, 116, 404–416. [Google Scholar] [CrossRef]
- Cutrona, C.E.; Wallace, G.; Wesner, K.A. Neighborhood Characteristics and Depression: An Examination of Stress Processes. Curr. Dir. Psychol. Sci. 2006, 15, 188–192. [Google Scholar] [CrossRef] [Green Version]
- Graif, C.; Arcaya, M.C.; Roux, A.V.D. Moving to Opportunity and Mental Health: Exploring the Spatial Context of Neighborhood Effects. Soc. Sci. Med. 2016, 162, 50–58. [Google Scholar] [CrossRef] [PubMed] [Green Version]
- Williams, D.; Jackson, P.B. Social Sources of Racial Disparities in Health. Health Aff. 2005, 24, 325–334. [Google Scholar] [CrossRef] [PubMed] [Green Version]
- Williams, D.R.; Mohammed, S.A.; Leavell, J.; Collins, C. Race, Socioeconomic Status and Health: Complexities, Ongoing Challenges and Research Opportunities. Ann. N. Y. Acad. Sci. 2010, 1186, 69. [Google Scholar] [CrossRef]
- Alegría, M.; Green, J.G.; McLaughlin, K.A.; Loder, S. Disparities in Child and Adolescent Mental Health and Mental Health Services in the US; William, T., Ed.; Grant Foundation: New York, NY, USA, 2015. [Google Scholar]
- Mair, C.; Roux, A.V.D.; Osypuk, T.L.; Rapp, S.R.; Seeman, T.; Watson, K.E. Is Neighborhood Racial/Ethnic Composition Associated with Depressive Symptoms? The Multi-Ethnic Study of Atherosclerosis. Soc. Sci. Med. 2010, 71, 541–550. [Google Scholar] [CrossRef] [Green Version]
- Williams, D.R.; Collins, C. US Socioeconomic and Racial Differences in Health: Patterns and Explanations. Annu. Rev. Sociol. 1995, 21, 349–386. [Google Scholar] [CrossRef]
- Wight, R.G.; Aneshensel, C.S.; Botticello, A.L.; Sepúlveda, J.E. A Multilevel Analysis of Ethnic Variation in Depressive Symptoms among Adolescents in the United States. Soc. Sci. Med. 2005, 60, 2073–2084. [Google Scholar] [CrossRef] [PubMed]
- Gary, T.L.; Stark, S.A.; LaVeist, T.A. Neighborhood Characteristics and Mental Health among African Americans and Whites Living in a Racially Integrated Urban Community. Health Place 2007, 13, 569–575. [Google Scholar] [CrossRef] [PubMed]
- Henderson, C.; Roux, A.V.D.; Jacobs, D.R.; Kiefe, C.I.; West, D.; Williams, D.R. Neighbourhood Characteristics, Individual Level Socioeconomic Factors, and Depressive Symptoms in Young Adults: The CARDIA Study. J. Epidemiol. Community Health 2005, 59, 322–328. [Google Scholar] [CrossRef] [Green Version]
- English, D.; Lambert, S.F.; Evans, M.K.; Zonderman, A.B. Neighborhood Racial Composition, Racial Discrimination, and Depressive Symptoms in African Americans. Am. J. Community Psychol. 2014, 54, 219–228. [Google Scholar] [CrossRef]
- Halpern, D.; Nazroo, J. The Ethnic Density Effect: Results from a National Community Survey of England and Wales. Int. J. Soc. Psychiatry 2000, 46, 34–46. [Google Scholar] [CrossRef]
- Massey, D.S. Categorically Unequal: The American Stratification System; Russell Sage Foundation: New York, NY, USA, 2007. [Google Scholar]
- Massey, D.S. Residential Segregation and Neighborhood Conditions in US Metropolitan Areas. In America Becoming: Racial Trends and Their Consequences; The National Academies Press: Washongton, DC, USA, 2001; Volume 1, pp. 391–434. [Google Scholar]
- Portes, A.; Zhou, M. The New Second Generation: Segmented Assimilation and Its Variants. Ann. Am. Acad. Pol. Soc. Sci. 1993. [Google Scholar] [CrossRef]
- Portes, A.; Fernandez-Kelly, P.; Haller, W. Segmented Assimilation on the Ground: The New Second Generation in Early Adulthood. Ethn. Racial Stud. 2005, 28, 1000–1040. [Google Scholar] [CrossRef]
- Zhou, M. Segmented Assimilation: Issues, Controversies, and Recent Research on the New Second Generation. Int. Migr. Rev. 1997. [Google Scholar] [CrossRef] [Green Version]
- Shell, A.M.; Peek, M.K.; Eschbach, K. Neighborhood Hispanic Composition and Depressive Symptoms among Mexican-Descent Residents of Texas City, Texas. Soc. Sci. Med. 2013, 99, 56–63. [Google Scholar] [CrossRef] [Green Version]
- Fauth, R.C.; Roth, J.L.; Brooks-Gunn, J. Does the Neighborhood Context Alter the Link between Youth’s after-School Time Activities and Developmental Outcomes? A Multilevel Analysis. Dev. Psychol. 2007. [Google Scholar] [CrossRef] [PubMed]
- Sharkey, P.; Faber, J.W. Where, When, Why, and for Whom Do Residential Contexts Matter? Moving Away from the Dichotomous Understanding of Neighborhood Effects. Annu. Rev. Sociol. 2014, 40, 559–579. [Google Scholar] [CrossRef] [Green Version]
- Mobley, L.R.; Scott, L.; Rutherford, Y.; Kuo, T.-M. Using Residential Segregation to Predict Colorectal Cancer Stage at Diagnosis: Two Different Approaches. Ann. Epidemiol. 2017, 27, 10–19. [Google Scholar] [CrossRef] [PubMed]
- Harris, K.M. The Add Health Study: Design and Accomplishments; Carolina Population Center, University of North Carolina at Chapel Hill: Chapel Hill, NC, USA, 2013. [Google Scholar]
- Radloff, L.S. The CES-D Scale: A Self-Report Depression Scale for Research in the General Population. Appl. Psychol. Meas. 1977, 1, 385–401. [Google Scholar] [CrossRef]
- Santor, D.A.; Coyne, J.C. Shortening the CES–D to Improve Its Ability to Detect Cases of Depression. Psychol. Assess. 1997, 9, 233. [Google Scholar] [CrossRef]
- Cubbin, C.; Santelli, J.; Brindis, C.D.; Braveman, P. Neighborhood Context and Sexual Behaviors among Adolescents: Findings from the National Longitudinal Study of Adolescent Health. Perspect. Sex. Reprod. Health 2005, 37, 125–134. [Google Scholar] [CrossRef] [PubMed]
- Shavers, V.L. Measurement of Socioeconomic Status in Health Disparities Research. J. Natl. Med. Assoc. 2007, 99, 1013. [Google Scholar]
- Sampson, R.J.; Raudenbush, S.W.; Earls, F. Neighborhoods and Violent Crime: A Multilevel Study of Collective Efficacy. Science 1997, 277, 918–924. [Google Scholar] [CrossRef]
- Walsemann, K.M.; Bell, B.A.; Goosby, B.J. Effect of School Racial Composition on Trajectories of Depressive Symptoms from Adolescence through Early Adulthood. Race Soc. Probl. 2011, 3, 131. [Google Scholar] [CrossRef] [Green Version]
- Jung, T.; Wickrama, K.A.S. An Introduction to Latent Class Growth Analysis and Growth Mixture Modeling. Soc. Personal. Psychol. Compass 2008, 2, 302–317. [Google Scholar] [CrossRef]
- Muthén, L.K.; Muthen, B. Mplus User’s Guide: Statistical Analysis with Latent Variables, User’s Guide; Muthén & Muthén: Los Angeles, CA, USA, 2017. [Google Scholar]
- Muthen, L.K.; Muthen, B.O. Mplus [Computer Software]; Muthén Muthén: Los Angeles, CA, USA, 1998. [Google Scholar]
- Raudenbush, S.W.; Bryk, A.S. Hierarchical Linear Models: Applications and Data Analysis Methods; Sage: Thousand Oaks, CA, USA, 2002; Volume 1. [Google Scholar]
- StataCorp. Stata Statistical Software: Release 15; StataCorp LLC: College Station, TX, USA, 2017. [Google Scholar]
- Chen, P.; Chantala, K. Guidelines for Analyzing Add Health Data; Carolina Population Center, University of North Carolina at Chapel Hill: Chapel Hill, NC, USA, 2014; pp. 1–53. [Google Scholar]
- Chantala, K.; Blanchette, D.; Suchindran, C.M. Software to Compute Sampling Weights for Multilevel Analysis; Carolina Population Center, University of North Carolina at Chapel Hill: Chapel Hill, NC, USA, 2011. [Google Scholar]
- Lloyd, J.E.V.; Obradović, J.; Carpiano, R.M.; Motti-Stefanidi, F. JMASM 32: Multiple Imputation of Missing Multilevel, Longitudinal Data: A Case When Practical Considerations Trump Best Practices? J. Mod. Appl. Stat. Methods 2013, 12, 29. [Google Scholar] [CrossRef]
- Rubin, D.B. Multiple Imputation for Nonresponse in Surveys; John Wiley & Sons: Hoboken, NJ, USA, 2004; Volume 81. [Google Scholar]
- Barr, P.B. Early Neighborhood Conditions and Trajectories of Depressive Symptoms across Adolescence and into Adulthood. Adv. Life Course Res. 2018, 35, 57–68. [Google Scholar] [CrossRef]
- Wickrama, K.A.S.; Noh, S.; Bryant, C.M. Racial Differences in Adolescent Distress: Differential Effects of the Family and Community for Blacks and Whites. J. Community Psychol. 2005, 33, 261–282. [Google Scholar] [CrossRef]
- Welch, S.; Sigelman, L.; Bledsoe, T.; Combs, M. Race and Place: Race Relations in an American City; Cambridge University Press: Cambridge, UK, 2001. [Google Scholar]


| Variable (Mean/%, SE) | NHW | NHB | Hispanics | NHO | Test |
|---|---|---|---|---|---|
| Sample size (%) | 5316 (56.43) | 1967 (20.88) | 1445 (15.34) | 693 (7.36) | |
| Depressive symptoms | |||||
| Wave I | 5.40 (0.11) | 6.48 (0.18) | 6.39 (0.20) | 6.61 (0.33) | R2 = 0.01, F (3, 126) = 14.27 *** |
| Wave II | 5.33 (0.09) | 6.35 (0.16) | 6.75 (0.21) | 6.41 (0.29) | R2 = 0.02, F (3, 126) = 22.18 *** |
| Wave III | 4.28 (0.07) | 5.10 (0.18) | 5.17 (0.17) | 5.24 (0.27) | R2 = 0.01, F (3, 126) = 14.36 *** |
| Wave IV | 4.93 (0.07) | 6.05 (0.2) | 5.58 (0.17) | 5.46 (0.25) | R2 = 0.01, F (3, 126) = 13.43 *** |
| Age | |||||
| Wave I | 15.46 (0.13) | 15.70 (0.19) | 15.60 (0.22) | 15.65 (0.23) | |
| Wave II | 16.38 (0.13) | 16.66 (0.19) | 16.54 (0.21) | 16.60 (0.24) | |
| Wave III | 21.81 (0.13) | 22.07 (0.19) | 22.06 (0.21) | 22.03 (0.24) | |
| Wave IV | 28.31 (0.13) | 28.60 (0.19) | 28.55 (0.21) | 28.6 (0.23) | |
| Male (%) | 49.80 (0.01) | 48.75 (0.02) | 50.96 (0.02) | 54.95 (0.03) | χ2 (3) = 5.82 |
| Income (in thousands) | 49.89 (1.86) | 29.13 (1.72) | 34.29 (2.07) | 43.98 (3.20) | R2 = 0.05, F (3, 126) = 28.25 *** |
| Adult SES | 0.02 (0.02) | 0.11 (0.04) | 0.03 (0.04) | -0.02 (0.06) | R2 = 0.001, F (3, 126) = 1.95 |
| Household composition (%) | |||||
| 2 parents | 70.61 (0.01) | 33.47 (0.02) | 54.75 (0.02) | 56.30 (0.04) | χ2 (12) = 1131.61 *** |
| 2 parents & adult kin | 9.39 (0.01) | 10.45 (0.01) | 18.63 (0.02) | 23.02 (0.04) | |
| 1 parent | 14.73 (0.01) | 30.61 (0.02) | 14.64 (0.02) | 9.27 (0.02) | |
| 1 parent & adult kin | 3.34 (0.00) | 16.55 (0.01) | 9.49 (0.01) | 5.94 (0.02) | |
| Adult kin, no parents | 1.93 (0.00) | 8.93 (0.01) | 2.50 (0.01) | 5.47 (0.01) | |
| Neighborhood SES at WI | 0.14 (0.08) | -0.55 (0.08) | -0.18 (0.09) | 0.15 (0.1) | R2 = 0.09, F (3, 126) = 28.64 *** |
| %NHW at WI | 89.10 (0.01) | 41.23 (0.03) | 52.07 (0.04) | 60.29 (0.05) | R2 = 0.47, F (3, 126) = 81.53 *** |
| %NHB at WI | 5.54 (0.01) | 53.35 (0.03) | 8.69 (0.01) | 9.3 (0.02) | R2 = 0.51, F (3, 126) = 64.64 *** |
| %Hispanics at WI | 3.31 (0.00) | 3.56 (0.01) | 32.72 (0.05) | 12.84 (0.02) | R2 = 0.38, F (3, 126) = 18.36 *** |
| %NHO at WI | 2.02 (0.00) | 1.68 (0.00) | 6.55 (0.01) | 17.63 (0.05) | R2 = 0.21, F (3, 126) = 5.80 ** |
| Variable | NHW | NHB | Hispanics | NHO |
|---|---|---|---|---|
| Intercept | 12.6 (9.09, 16.11) | 11.17 (6.26, 16.08) | 2.78 (−3.16, 8.73) | 1.35 (−6.80, 9.49) |
| Age | −0.34 (−0.48, −0.19) | −0.06 (−0.09, −0.02) | −0.10 (−0.13, −0.07) | −0.10 (−0.13, −0.07) |
| Age2 | 0.01 (0.00, 0.01) | |||
| Male | −1.21 (−1.41, −1.01) | −0.94 (−1.42, −0.46) | −1.01 (−1.40, −0.63) | −0.40 (−1.16, 0.36) |
| Income | −0.43 (−0.64, −0.21) | −0.39 (−0.65, −0.14) | −0.18 (−0.71, 0.35) | −0.17 (−0.75, 0.42) |
| Adult SES | 0.14 (0.00, 0.29) | 0.14 (−0.12, 0.40) | −0.04 (−0.33, 0.25) | 0.17 (−0.26, 0.60) |
| Household Composition | ||||
| 2 parents | Ref. | Ref. | Ref. | Ref. |
| 2 parents & adult kin | 0.58 (0.14, 1.01) | 0.32 (−0.29, 0.93) | 0.22 (−0.42, 0.86) | 0.46 (−0.28, 1.21) |
| 1 parent | 0.19 (−0.29, 0.66) | 0.60 (0.04, 1.15) | 0.76 (−0.93, 2.46) | 0.52 (−0.33, 1.37) |
| 1 parent & adult kin | 0.66 (−0.05, 1.38) | 0.67 (0.07, 1.28) | 0.49 (−0.81, 1.79) | 1.75 (0.31, 3.18) |
| Adult kin, no parents | 0.91 (−0.14, 1.96) | 0.87 (0.07, 1.67) | 0.76 (−1.09, 2.61) | 2.07 (0.58, 3.57) |
| SES at Wave I | 0.21 (−0.16, 0.58) | 0.37 (−0.37, 1.10) | 0.33 (−0.36, 1.02) | 0.51 (−0.15, 1.18) |
| SES latent classes | ||||
| Very High/Decrease | Ref. | Ref. | Ref. | Ref. |
| Med/Decrease | 0.03 (−0.48, 0.54) | 0.87 (−1.19, 2.93) | 0.04 (−1.47, 1.55) | 0.02 (−0.92, 0.95) |
| Med-Low/No change | 0.24 (−0.44, 0.93) | 1.34 (−1.32, 4.00) | 0.04 (−1.68, 1.75) | −0.24 (−1.71, 1.23) |
| Med-Low/Increase | ||||
| Low/Increase | 0.87 (−0.15, 1.90) | 2.17 (−0.92, 5.26) | 0.95 (−1.32, 3.22) | |
| Very Low/Increase | 0.22 (−1.00, 1.43) | |||
| NHW at Wave I | −3.26 (−6.21, −0.32) | −2.02 (−5.94, 1.90) | 5.65 (1.92, 9.39) | 0.99 (−4.04, 6.02) |
| NHW latent classes | ||||
| Very High/No Change | Ref. | |||
| Very High/Decrease | −0.21 (−0.66, 0.25) | Ref. | Ref. | Ref. |
| High/No Change | −0.37 (−1.23, 0.49) | |||
| High/Decrease | −1.20 (−2.24, −0.16) | 1.22 (−0.23, 2.67) | 1.98 (−0.35, 4.30) | |
| Med/No Change | −0.99 (−2.67, 0.68) | |||
| Med-Low/Decrease | 2.26 (0.21, 4.30) | |||
| Med-Low/Increase | −1.00 (−2.67, 0.67) | |||
| Med-Low/No change | −2.53 (−4.90, −0.15) | 3.20 (−0.45, 6.84) | ||
| Low/Increase | −2.47 (−5.48, 0.54) | 3.14 (0.41, 5.87) | ||
| NHB at Wave I | −2.75 (−5.25, −0.25) | −1.57 (−4.74, 1.61) | ||
| NHB latent classes | ||||
| Very High/Decrease | Ref. | |||
| High/Decrease | −0.07 (−0.91, 0.78) | |||
| Med/Decrease | Ref. | |||
| Med/No Change | −1.27 (−2.67, 0.13) | |||
| Med-Low/Increase | −1.53 (−4.25, 1.19) | |||
| Low/No Change | 0.26 (−0.42, 0.95) | |||
| Low/Increase | −0.98 (−3.1, 1.13) | |||
| Very Low/Increase | 0.39 (−0.32, 1.10) | |||
| HSP at Wave I | −2.38 (−7.09, 2.33) | 2.44 (−2.13, 7.00) | ||
| HSP latent classes | ||||
| Very High/Decrease | Ref. | |||
| Med/Decrease | Ref. | |||
| Med/No Change | 0.68 (−1.04, 2.41) | |||
| Med-Low/Increase | 0.59 (−1.77, 2.95) | |||
| Low/Increase | 1.02 (−0.21, 2.26) | 0.63 (−2.09, 3.35) | ||
| Very Low/No Change | 1.05 (−0.53, 2.63) | |||
| NHO at Wave I | 7.22 (2.72, 11.72) | |||
| NHO latent classes | ||||
| Med/Decrease | Ref. | |||
| Med-Low/Decrease | 2.50 (0.31, 4.69) | |||
| Low/Increase | 2.99 (−0.33, 6.30) | |||
| Very Low/Increase | 4.77 (1.58, 7.97) |
© 2020 by the authors. Licensee MDPI, Basel, Switzerland. This article is an open access article distributed under the terms and conditions of the Creative Commons Attribution (CC BY) license (http://creativecommons.org/licenses/by/4.0/).
Share and Cite
Lee, H.; Estrada-Martínez, L.M. Trajectories of Depressive Symptoms and Neighborhood Changes from Adolescence to Adulthood: Latent Class Growth Analysis and Multilevel Growth Curve Models. Int. J. Environ. Res. Public Health 2020, 17, 1829. https://doi.org/10.3390/ijerph17061829
Lee H, Estrada-Martínez LM. Trajectories of Depressive Symptoms and Neighborhood Changes from Adolescence to Adulthood: Latent Class Growth Analysis and Multilevel Growth Curve Models. International Journal of Environmental Research and Public Health. 2020; 17(6):1829. https://doi.org/10.3390/ijerph17061829
Chicago/Turabian StyleLee, Hyunjung, and Lorena M. Estrada-Martínez. 2020. "Trajectories of Depressive Symptoms and Neighborhood Changes from Adolescence to Adulthood: Latent Class Growth Analysis and Multilevel Growth Curve Models" International Journal of Environmental Research and Public Health 17, no. 6: 1829. https://doi.org/10.3390/ijerph17061829