Event-Based Heat-Related Risk Assessment Model for South Korea Using Maximum Perceived Temperature, Wet-Bulb Globe Temperature, and Air Temperature Data


Abstract
:1. Introduction
2. Materials
2.1. Temperature Indicators
2.1.1. Perceived Temperature
2.1.2. Wet-Bulb Globe Temperature
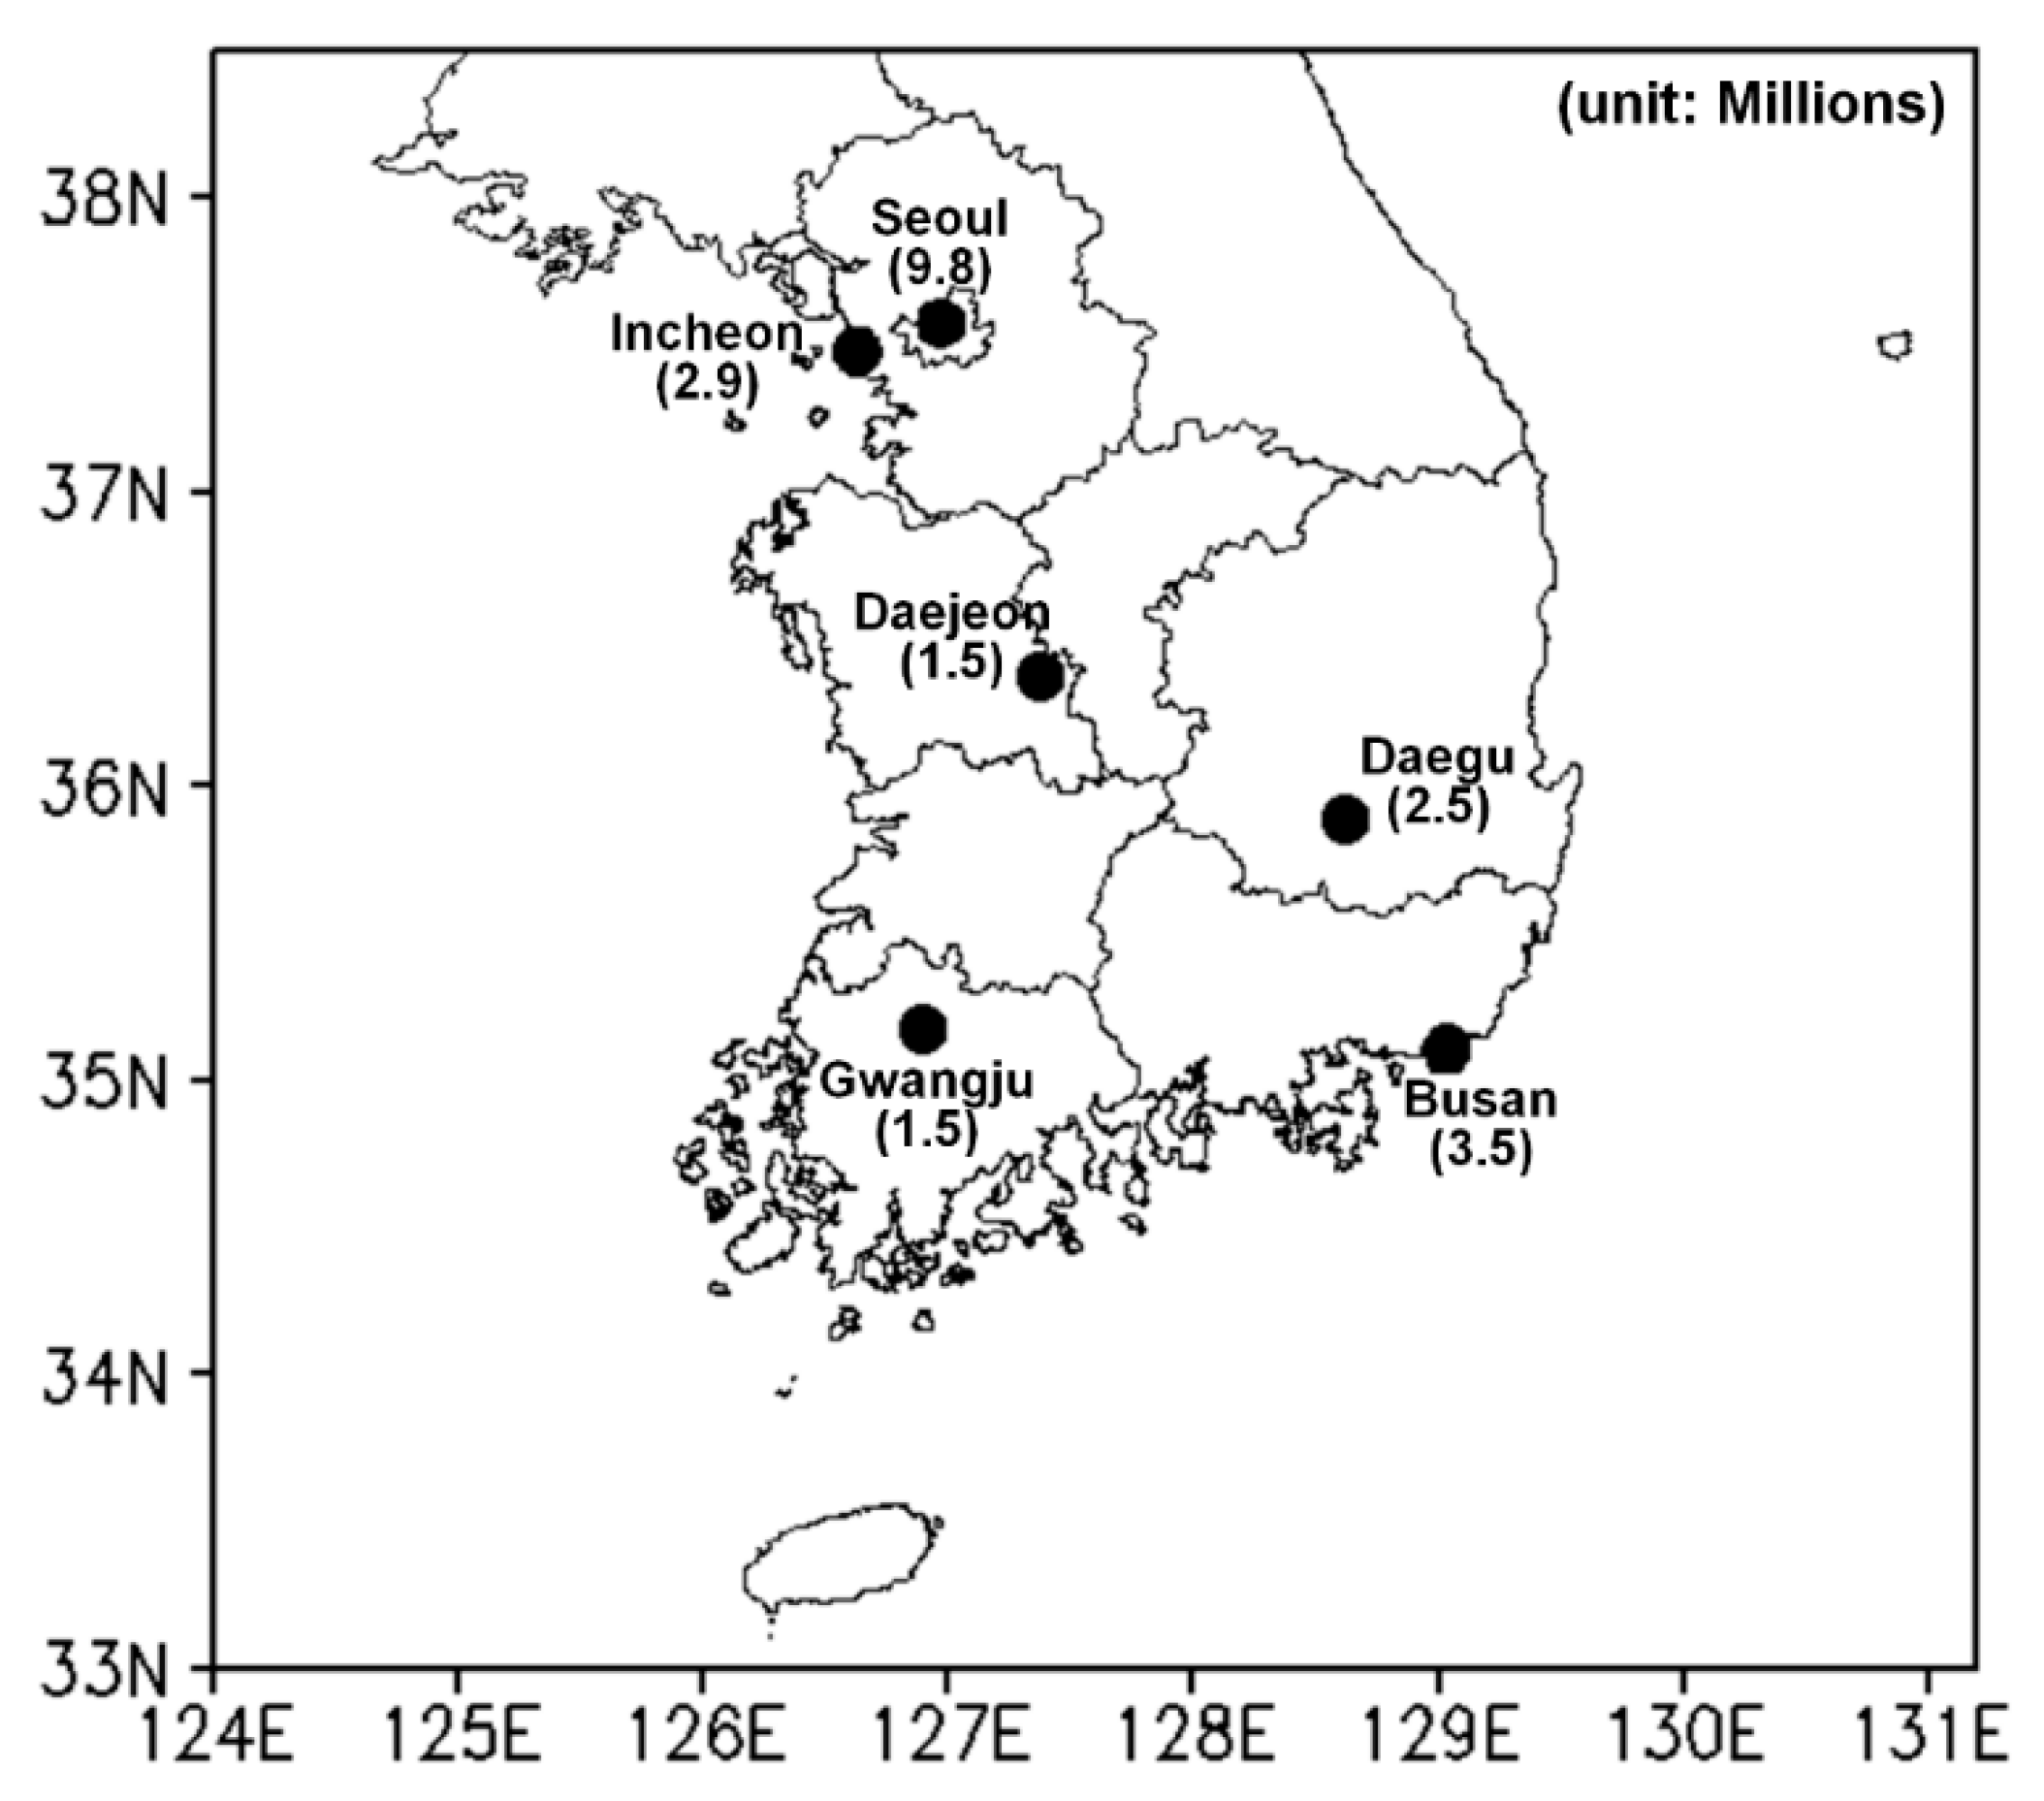
2.2. Study Area and Data
2.3. Event-Based Heat-Related Risk Assessment Model
3. Results
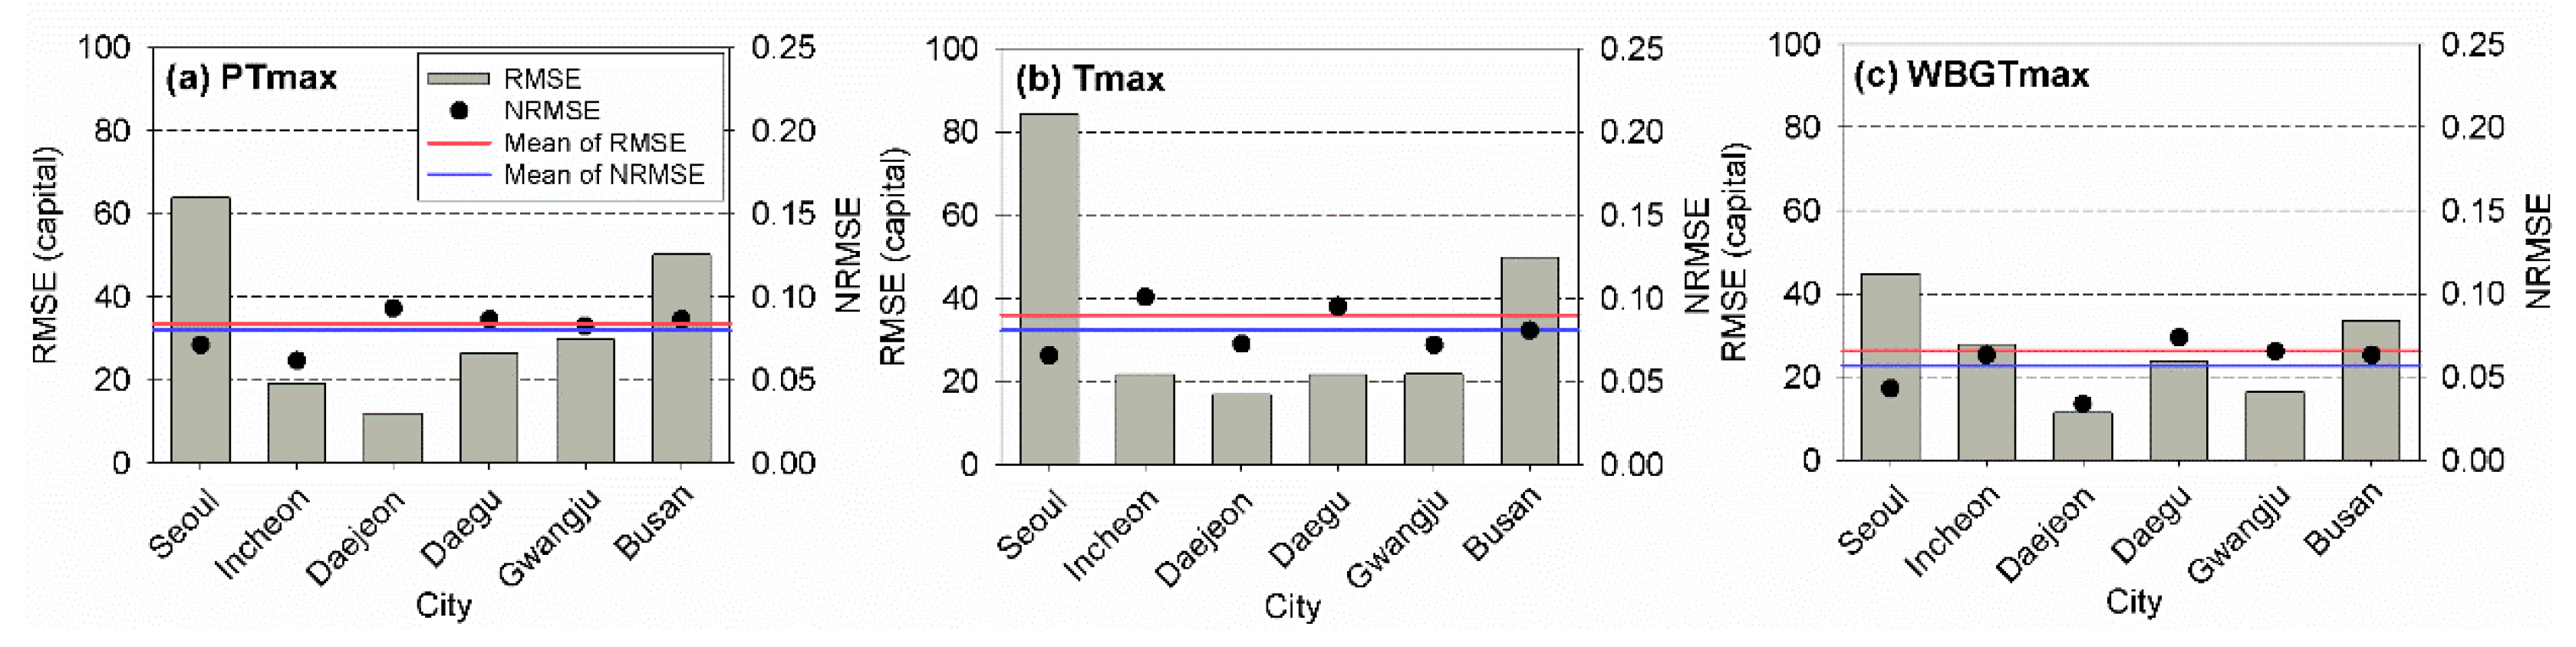
3.1. Consideration of Regions in Risk Assessment Models
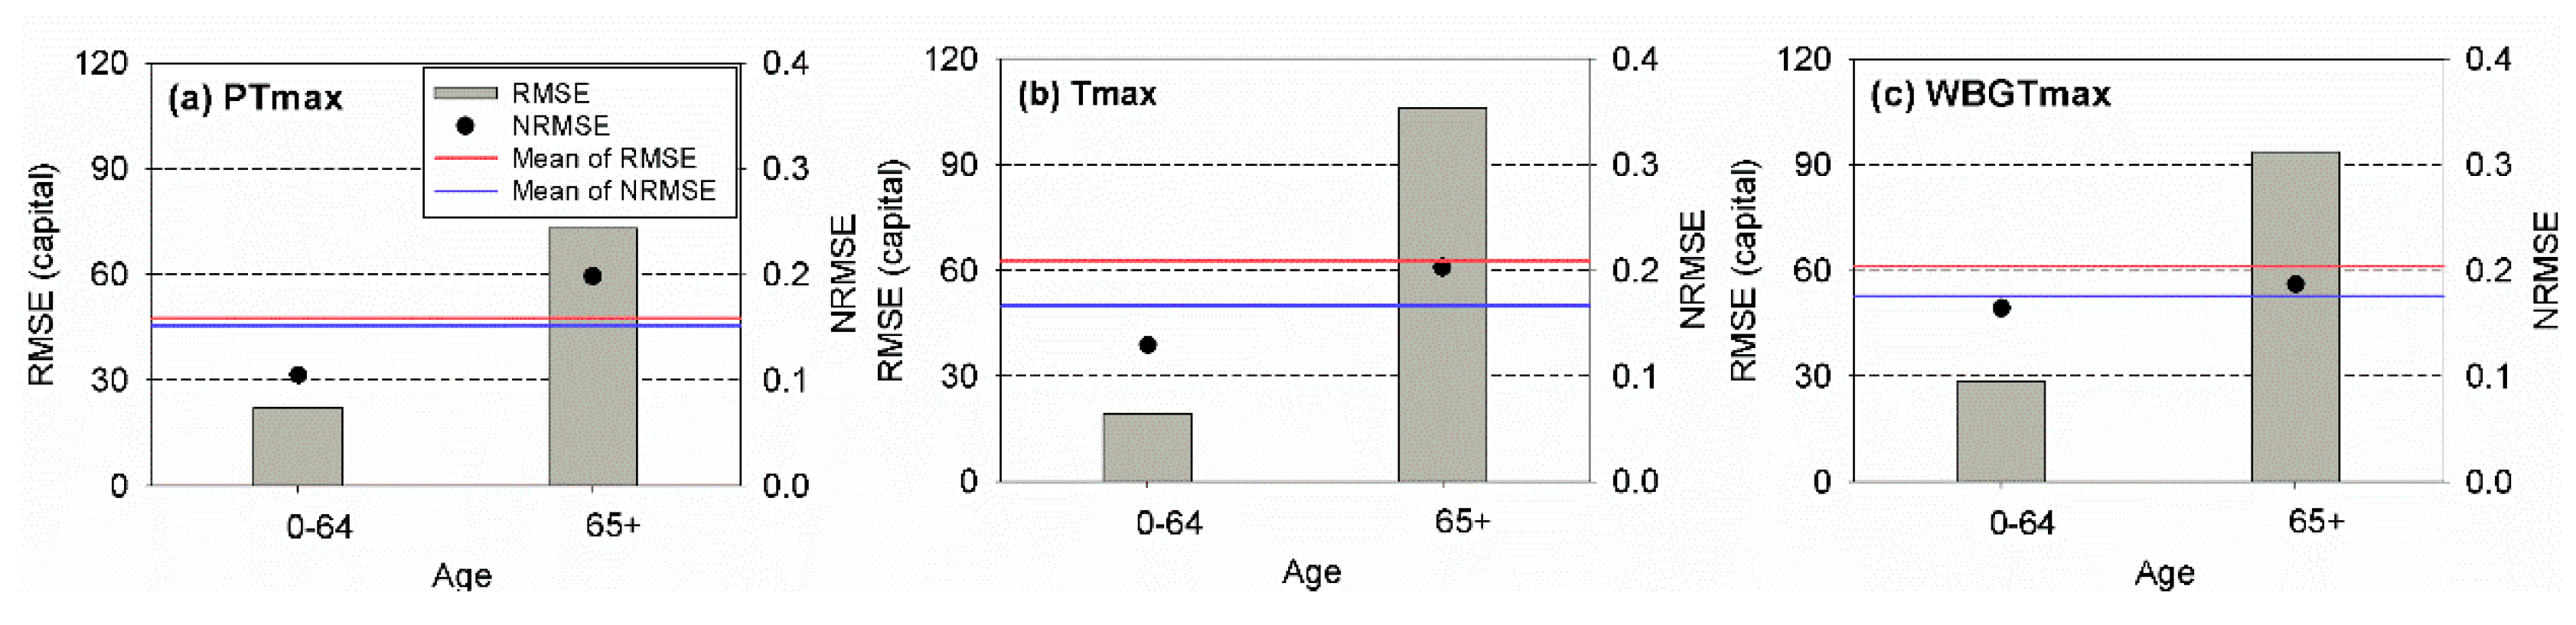
3.2. Consideration of the Age in Risk Assessment Models
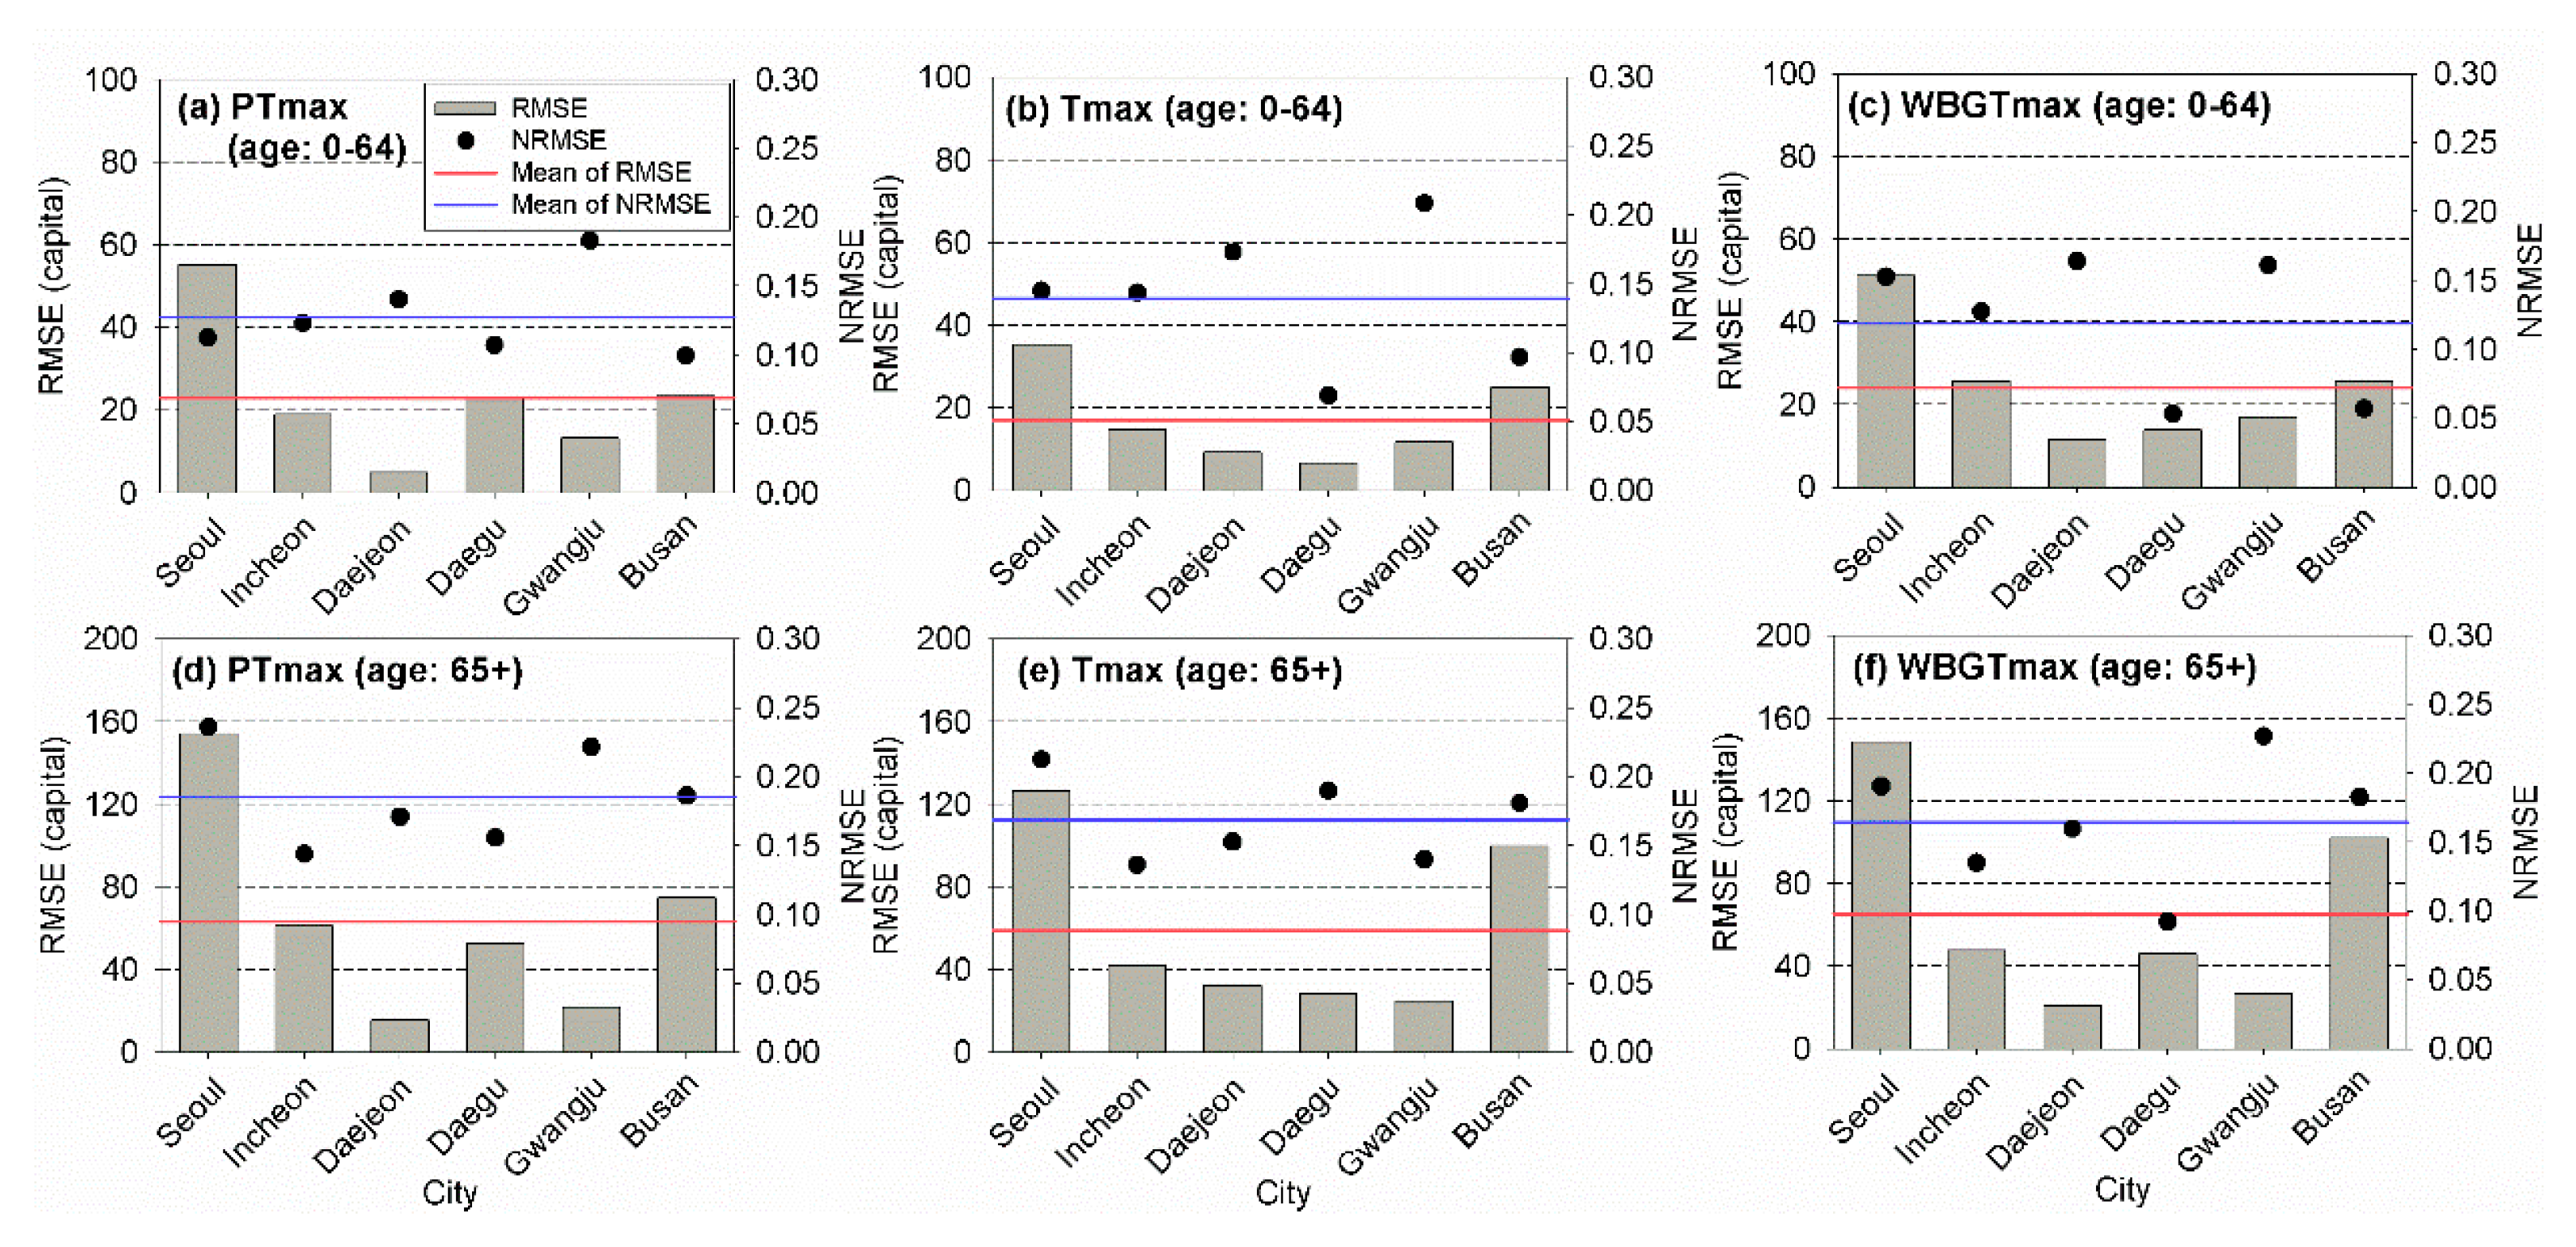
3.3. Consideration of the Region and Age in Risk Assessment Models
4. Discussion
5. Conclusions
Author Contributions
Funding
Acknowledgments
Conflicts of Interest
References
- Le Tertre, A.; Lefranc, A.; Eilstein, D.; Declercq, C.; Medina, S.; Blanchard, M.; Chardon, B.; Fabre, P.; Filleul, L.; Jusot, J.; et al. Impact of the 2003 heatwave on all-cause mortality in 9 French cities. Epidemiology 2006, 17, 75–79. [Google Scholar] [CrossRef] [PubMed]
- Anderson, G.B.; Bell, M.L. Heat waves in the United States: Mortality risk during heat waves and effect modification by heat wave characteristics in 43 U.S. communities. Environ. Health Perspect. 2011, 119, 210–218. [Google Scholar] [CrossRef] [PubMed] [Green Version]
- Petkova, E.P.; Horton, R.M.; Bader, D.A.; Kinney, P.L. Projected heat-related mortality in the U.S. urban northeast. Int. J. Environ. Res. Public Health 2013, 10, 6734–6747. [Google Scholar] [CrossRef] [PubMed]
- Harduar Morano, L.; Watkins, S.; Kintziger, K. A comprehensive evaluation of the burden of heat-related illness and death within the Florida population. Int. J. Environ. Res. Public Health 2016, 13, 551. [Google Scholar] [CrossRef]
- Ruuhela, R.; Hyvärinen, O.; Jylhä, K. Regional assessment of temperature-related mortality in Finland. Int. J. Environ. Res. Public Health 2018, 15, 406. [Google Scholar] [CrossRef] [Green Version]
- Koppe, C.; Sari Kovats, R.; Menne, B.; Jendritzky, G.; World Health Organization, Regional Office for Europe; London School of Hygiene and Tropical Medicine; European Commission, Energy, Environment and Sustainable Development; Deutscher Wetterdienst. Heat-Waves: Risks and Responses; WHO Regional Office for Europe: Copenhagen, Denmark, 2004. [Google Scholar]
- Keatinge, W.R. Death in heat waves. BMJ 2003, 327, 512–513. [Google Scholar] [CrossRef]
- Gosling, S.N.; Bryce, E.K.; Dixon, P.G.; Gabriel, K.M.A.; Gosling, E.Y.; Hanes, J.M.; Hondula, D.M.; Liang, L.; Bustos Mac Lean, P.A.; Muthers, S.; et al. A glossary for biometeorology. Int. J. Biometeorol. 2014, 58, 277–308. [Google Scholar] [CrossRef]
- Höppe, P. The physiological equivalent temperature—A universal index for the biometeorological assessment of the thermal environment. Int. J. Biometeorol. 1999, 43, 71–75. [Google Scholar] [CrossRef]
- Matzarakis, A.; Mayer, H.; Iziomon, M.G. Applications of a universal thermal index: Physiological equivalent temperature. Int. J. Biometeorol. 1999, 43, 76–84. [Google Scholar] [CrossRef]
- Jendritzky, G.; De Dear, R.; Havenith, G. UTCI—Why another thermal index? Int. J. Biometeorol. 2012, 56, 421–428. [Google Scholar] [CrossRef] [Green Version]
- Staiger, H.; Laschewski, G.; Grätz, A. The perceived temperature—A versatile index for the assessment of the human thermal environment. Part A: Scientific basics. Int. J. Biometeorol. 2012, 56, 165–176. [Google Scholar] [CrossRef] [PubMed]
- Nastos, P.T.; Matzarakis, A. The effect of air temperature and human thermal indices on mortality in Athens, Greece. Theor. Appl. Climatol. 2012, 108, 591–599. [Google Scholar] [CrossRef]
- Basarin, B.; Lukić, T.; Matzarakis, A. Quantification and assessment of heat and cold waves in Novi Sad, Northern Serbia. Int. J. Biometeorol. 2016, 60, 139–150. [Google Scholar] [CrossRef] [PubMed]
- Di Napoli, C.; Pappenberger, F.; Cloke, H.L. Assessing heat-related health risk in Europe via the Universal Thermal Climate Index (UTCI). Int. J. Biometeorol. 2018, 62, 1155–1165. [Google Scholar] [CrossRef] [Green Version]
- Sharafkhani, R.; Khanjani, N.; Bakhtiari, B.; Jahani, Y.; Sadegh Tabrizi, J. Physiological Equivalent Temperature Index and mortality in Tabriz (The northwest of Iran). J. Therm. Biol. 2018, 71, 195–201. [Google Scholar] [CrossRef]
- Urban, A.; Kyselý, J. Comparison of UTCI with other thermal indices in the assessment of heat and cold effects on cardiovascular mortality in the Czech Republic. Int. J. Environ. Res. Public Health 2014, 11, 952–967. [Google Scholar] [CrossRef] [Green Version]
- Błażejczyk, A.; Błażejczyk, K.; Baranowski, J.; Kuchcik, M. Heat stress mortality and desired adaptation responses of healthcare system in Poland. Int. J. Biometeorol. 2018, 62, 307–318. [Google Scholar] [CrossRef]
- Skutecki, R.; Jalali, R.; Dragańska, E.; Cymes, I.; Romaszko, J.; Glińska-Lewczuk, K. UTCI as a bio-meteorological tool in the assessment of cold-induced stress as a risk factor for hypertension. Sci. Total Environ. 2019, 688, 970–975. [Google Scholar] [CrossRef]
- Son, J.-Y.; Lee, J.-T.; Anderson, G.B.; Bell, M.L. The impact of heat waves on mortality in seven major cities in Korea. Environ. Health Perspect. 2012, 120, 566–571. [Google Scholar] [CrossRef] [Green Version]
- Son, J.-Y.; Bell, M.L.; Lee, J.-T. The impact of heat, cold, and heat waves on hospital admissions in eight cities in Korea. Int. J. Biometeorol. 2014, 58, 1893–1903. [Google Scholar] [CrossRef]
- Lim, Y.-H.; Lee, K.-S.; Bae, H.-J.; Kim, D.; Yoo, H.; Park, S.; Hong, Y.-C. Estimation of heat-related deaths during heat wave episodes in South Korea (2006–2017). Int. J. Biometeorol. 2019, 63, 1621–1629. [Google Scholar] [CrossRef] [PubMed]
- Heo, S.; Bell, M.L.; Lee, J.-T. Comparison of health risks by heat wave definition: Applicability of wet-bulb globe temperature for heat wave criteria. Environ. Res. 2019, 168, 158–170. [Google Scholar] [CrossRef] [PubMed]
- Trenberth, K.E.; Josey, S.A. Observations: Surface and atmospheric climate change. In Climate Change 2007: The Physical Science Basis: Contribution of Working Group I to the Fourth Assessment Report of the Intergovernmental Panel on Climate Change; Solomon, S., Qin, D., Manning, M., Chen, Z., Marquis, M., Averyt, K.B., Tignor, M., Miller, H.L., Eds.; Cambridge University Press: Cambridge, UK, 2007; pp. 235–336. [Google Scholar]
- Khaliq, M.N.; St-Hilaire, A.; Ouarda, T.B.M.J.; Bobée, B. Frequency analysis and temporal pattern of occurrences of southern Quebec heatwaves. Int. J. Climatol. 2005, 25, 485–504. [Google Scholar] [CrossRef]
- Meehl, G.A.; Tebaldi, C. More intense, more frequent, and longer lasting heat waves in the 21st century. Science 2004, 305, 994–997. [Google Scholar] [CrossRef] [PubMed] [Green Version]
- Dieter, S.; Ute, F.; Tobia, L.; Steffen, L.; Fred, M.; Christian, S. Quantification of heat-stress related mortality hazard, vulnerability and risk in Berlin, Germany. DIE ERDE 2014, 144. [Google Scholar] [CrossRef]
- Urban, A.; Hondula, D.M.; Hanzlíková, H.; Kyselý, J. The predictability of heat-related mortality in Prague, Czech Republic, during summer 2015—A comparison of selected thermal indices. Int. J. Biometeorol. 2019, 63, 535–548. [Google Scholar] [CrossRef]
- Epstein, Y.; Moran, D.S. Thermal comfort and the heat stress indices. Ind. Health 2006, 44, 388–398. [Google Scholar] [CrossRef] [Green Version]
- Liljegren, J.C.; Carhart, R.A.; Lawday, P.; Tschopp, S.; Sharp, R. Modeling the wet bulb globe temperature using standard meteorological measurements. J. Occup. Environ. Hyg. 2008, 5, 645–655. [Google Scholar] [CrossRef]
- Lemke, B.; Kjellstrom, T. Calculating workplace WBGT from meteorological data: A tool for climate change assessment. Ind. Health 2012, 50, 267–278. [Google Scholar] [CrossRef] [Green Version]
- Gagge, A.P.; Fobelets, A.; Berglund, L. A standard predictive index of human response to the thermal environment. ASHRAE Trans. 1986, 92, 709–731. [Google Scholar]
- Jendritzky, G.; Staiger, H.; Bucher, K.; Grätz, A.; Laschewski, G. The perceived temperature: The method of the Deutscher Wetterdienst for the assessment of cold stress and heat load for the human body. In Proceedings of the Internet Workshop on Windchill Hosted by the Meteorological Service of Canada, Canada, 3–7 April 2000; Available online: http://ec.gc.ca/workshop/papers/pdf/session_1_paper_4_e.pdf (accessed on 17 March 2020).
- Yaglou, C.P.; Minard, D. Control of heat casualties at military training centers. AMA Arch. Ind. Health 1957, 16, 302–316. [Google Scholar] [PubMed]
- Lee, J.-S.; Kim, K.R.; Cho, C.; Kang, M.; Ha, J.-C.; Kim, D.S. Evaluating the accuracies of the WBGT estimation models and their onsite applicability in Korea. J. Korea Soc. Hazard Mitig. 2019, 19, 53–63. [Google Scholar] [CrossRef]
- Fanger, P.O. Thermal Comfort: Analysis and Applications in Environmental Engineering; Danish Technical Press: Copenhagen, Denmark, 1970. [Google Scholar]
- ASHRAE. ASHRAE Handbook: Fundamentals, 8; American Society of Heating, Refrigerating and Air-Conditioning Engineers Inc: Atlanta, GA, USA, 2001. [Google Scholar]
- Parsons, K. Human Thermal Environments, 3rd ed.; CRC Press: Boca Raton, FL, USA, 2002; p. 635. [Google Scholar] [CrossRef]
- Stull, R. Wet-bulb temperature from relative humidity and air temperature. J. Appl. Meteorol. Climatol. 2011, 50, 2267–2269. [Google Scholar] [CrossRef] [Green Version]
- Brämer, G.R. International Statistical Classification of Diseases and Related Health Problems. Tenth Revision; 0379-8070; WHO: Geneva, Switzerland, 1988; pp. 32–36. [Google Scholar]
- WHO. ICD-10: International Statistical Classification of Diseases and Related Health Problems: Tenth Revision; WHO: Geneva, Switzerland, 2016. [Google Scholar]
- Buchin, O.; Jänicke, B.; Meier, F.; Scherer, D.; Ziegler, F. The role of building models in the evaluation of heat-related risks. Nat. Hazards Earth Syst. Sci. 2016, 16, 963–976. [Google Scholar] [CrossRef] [Green Version]
- Jänicke, B.; Holtmann, A.; Kim, K.R.; Kang, M.; Fehrenbach, U.; Scherer, D. Quantification and evaluation of intra-urban heat-stress variability in Seoul, Korea. Int. J. Biometeorol. 2019, 63, 1–12. [Google Scholar] [CrossRef]
- Ebi, K.L.; Schmier, J.K. A stitch in time: Improving public health early warning systems for extreme weather events. Epidemiol. Rev. 2005, 27, 115–121. [Google Scholar] [CrossRef] [Green Version]
- Gascon, M.; Triguero-Mas, M.; Martínez, D.; Dadvand, P.; Rojas-Rueda, D.; Plasència, A.; Nieuwenhuijsen, M.J. Residential green spaces and mortality: A systematic review. Environ. Int. 2016, 86, 60–67. [Google Scholar] [CrossRef] [Green Version]
- Green, H.K.; Andrews, N.; Armstrong, B.; Bickler, G.; Pebody, R. Mortality during the 2013 heatwave in England—How did it compare to previous heatwaves? A retrospective observational study. Environ. Res. 2016, 147, 343–349. [Google Scholar] [CrossRef]
- Kim, E.J.; Kim, H. Effect modification of individual- and regional-scale characteristics on heat wave-related mortality rates between 2009 and 2012 in Seoul, South Korea. Sci. Total Environ. 2017, 595, 141–148. [Google Scholar] [CrossRef]
- Medina-Ramón, M.; Schwartz, J. Temperature, temperature extremes, and mortality: A study of acclimatisation and effect modification in 50 US cities. Occup. Environ. Med. 2007, 64, 827–833. [Google Scholar] [CrossRef] [Green Version]
- Lee, W.K.; Lee, H.A.; Lim, Y.H.; Park, H. Added effect of heat wave on mortality in Seoul, Korea. Int. J. Biometeorol. 2016, 60, 719–726. [Google Scholar] [CrossRef] [PubMed]
- Kim, H.; Bell, M.L.; Lee, J.-T. Does a lag-structure of temperature confound air pollution-lag-response relation? Simulation and application in 7 major cities, Korea (1998–2013). Environ. Res. 2017, 159, 531–538. [Google Scholar] [CrossRef] [PubMed]
- Chen, K.; Bi, J.; Chen, J.; Chen, X.; Huang, L.; Zhou, L. Influence of heat wave definitions to the added effect of heat waves on daily mortality in Nanjing, China. Sci. Total Environ. 2015, 506–507, 18–25. [Google Scholar] [CrossRef] [PubMed]
- He, B.-J.; Ding, L.; Prasad, D. Wind-sensitive urban planning and design: Precinct ventilation performance and its potential for local warming mitigation in an open midrise gridiron precinct. J. Build. Eng. 2020, 29, 101145. [Google Scholar] [CrossRef]
- Urban, A.; Burkart, K.; Kyselý, J.; Schuster, C.; Plavcová, E.; Hanzlíková, H.; Štěpánek, P.; Lakes, T. Spatial patterns of heat-related cardiovascular mortality in the Czech Republic. Int. J. Environ. Res. Public Health 2016, 13, 284. [Google Scholar] [CrossRef] [Green Version]
- O’Neill, M.S.; Zanobetti, A.; Schwartz, J. Disparities by race in heat-related mortality in four US cities: The role of air conditioning prevalence. J. Urban Health 2005, 82, 191–197. [Google Scholar] [CrossRef] [Green Version]
- Hong, J.-W.; Hong, J.; Kwon, E.E.; Yoon, D.K. Temporal dynamics of urban heat island correlated with the socio-economic development over the past half-century in Seoul, Korea. Environ. Pollut. 2019, 254, 112934. [Google Scholar] [CrossRef]
- Dufour, A.; Candas, V. Ageing and thermal responses during passive heat exposure: Sweating and sensory aspects. Eur. J. Appl. Physiol. 2007, 100, 19–26. [Google Scholar] [CrossRef]
- D’Souza, A.W.; Notley, S.R.; Meade, R.D.; Kenny, G.P. Intermittent sequential pneumatic compression does not enhance whole-body heat loss in elderly adults during extreme heat exposure. Appl. Physiol. Nutr. Metab. 2019, 44, 1383–1386. [Google Scholar] [CrossRef]
- Matzarakis, A.; Laschewski, G.; Muthers, S. The heat health warning system in Germany—Application and warnings for 2005 to 2019. Atmosphere 2020, 11, 170. [Google Scholar] [CrossRef] [Green Version]


| Index (Unit) | Perceived Temperature (°C) | Wet Bulb Globe Temperature (°C) | Air Temperature (°C) |
|---|---|---|---|
| Type | Rationale | Direct | Direct |
| Measured of derived | Derived | Derived | Measured |
| Thermophysiological model | Klima–Michel model (KMM), parameterizations derived from a two-node model [32] | NA | NA |
| The measure of assessment scale | Thermal perception; thermophysiological stress, directly linked to PMV-scale | NA | NA |
| Input variables | , RH, wind speed, mean radiant temperature, M | , RH | |
| Ease of interpretation | Complex | Moderate | Simple |
| Reference | Jendritzky et al. [33] Staiger, Laschewski, and Grätz [12] | Yaglou and Minard [34] Lee et al. [35] | NA |
| Indicator | City | (°C) | L (Day) | (10−6 ·Day−1 °C) | (10−6 ·Day−1) | Annual MEMR (10−6 ·Year−1) | The Number of Events | |
|---|---|---|---|---|---|---|---|---|
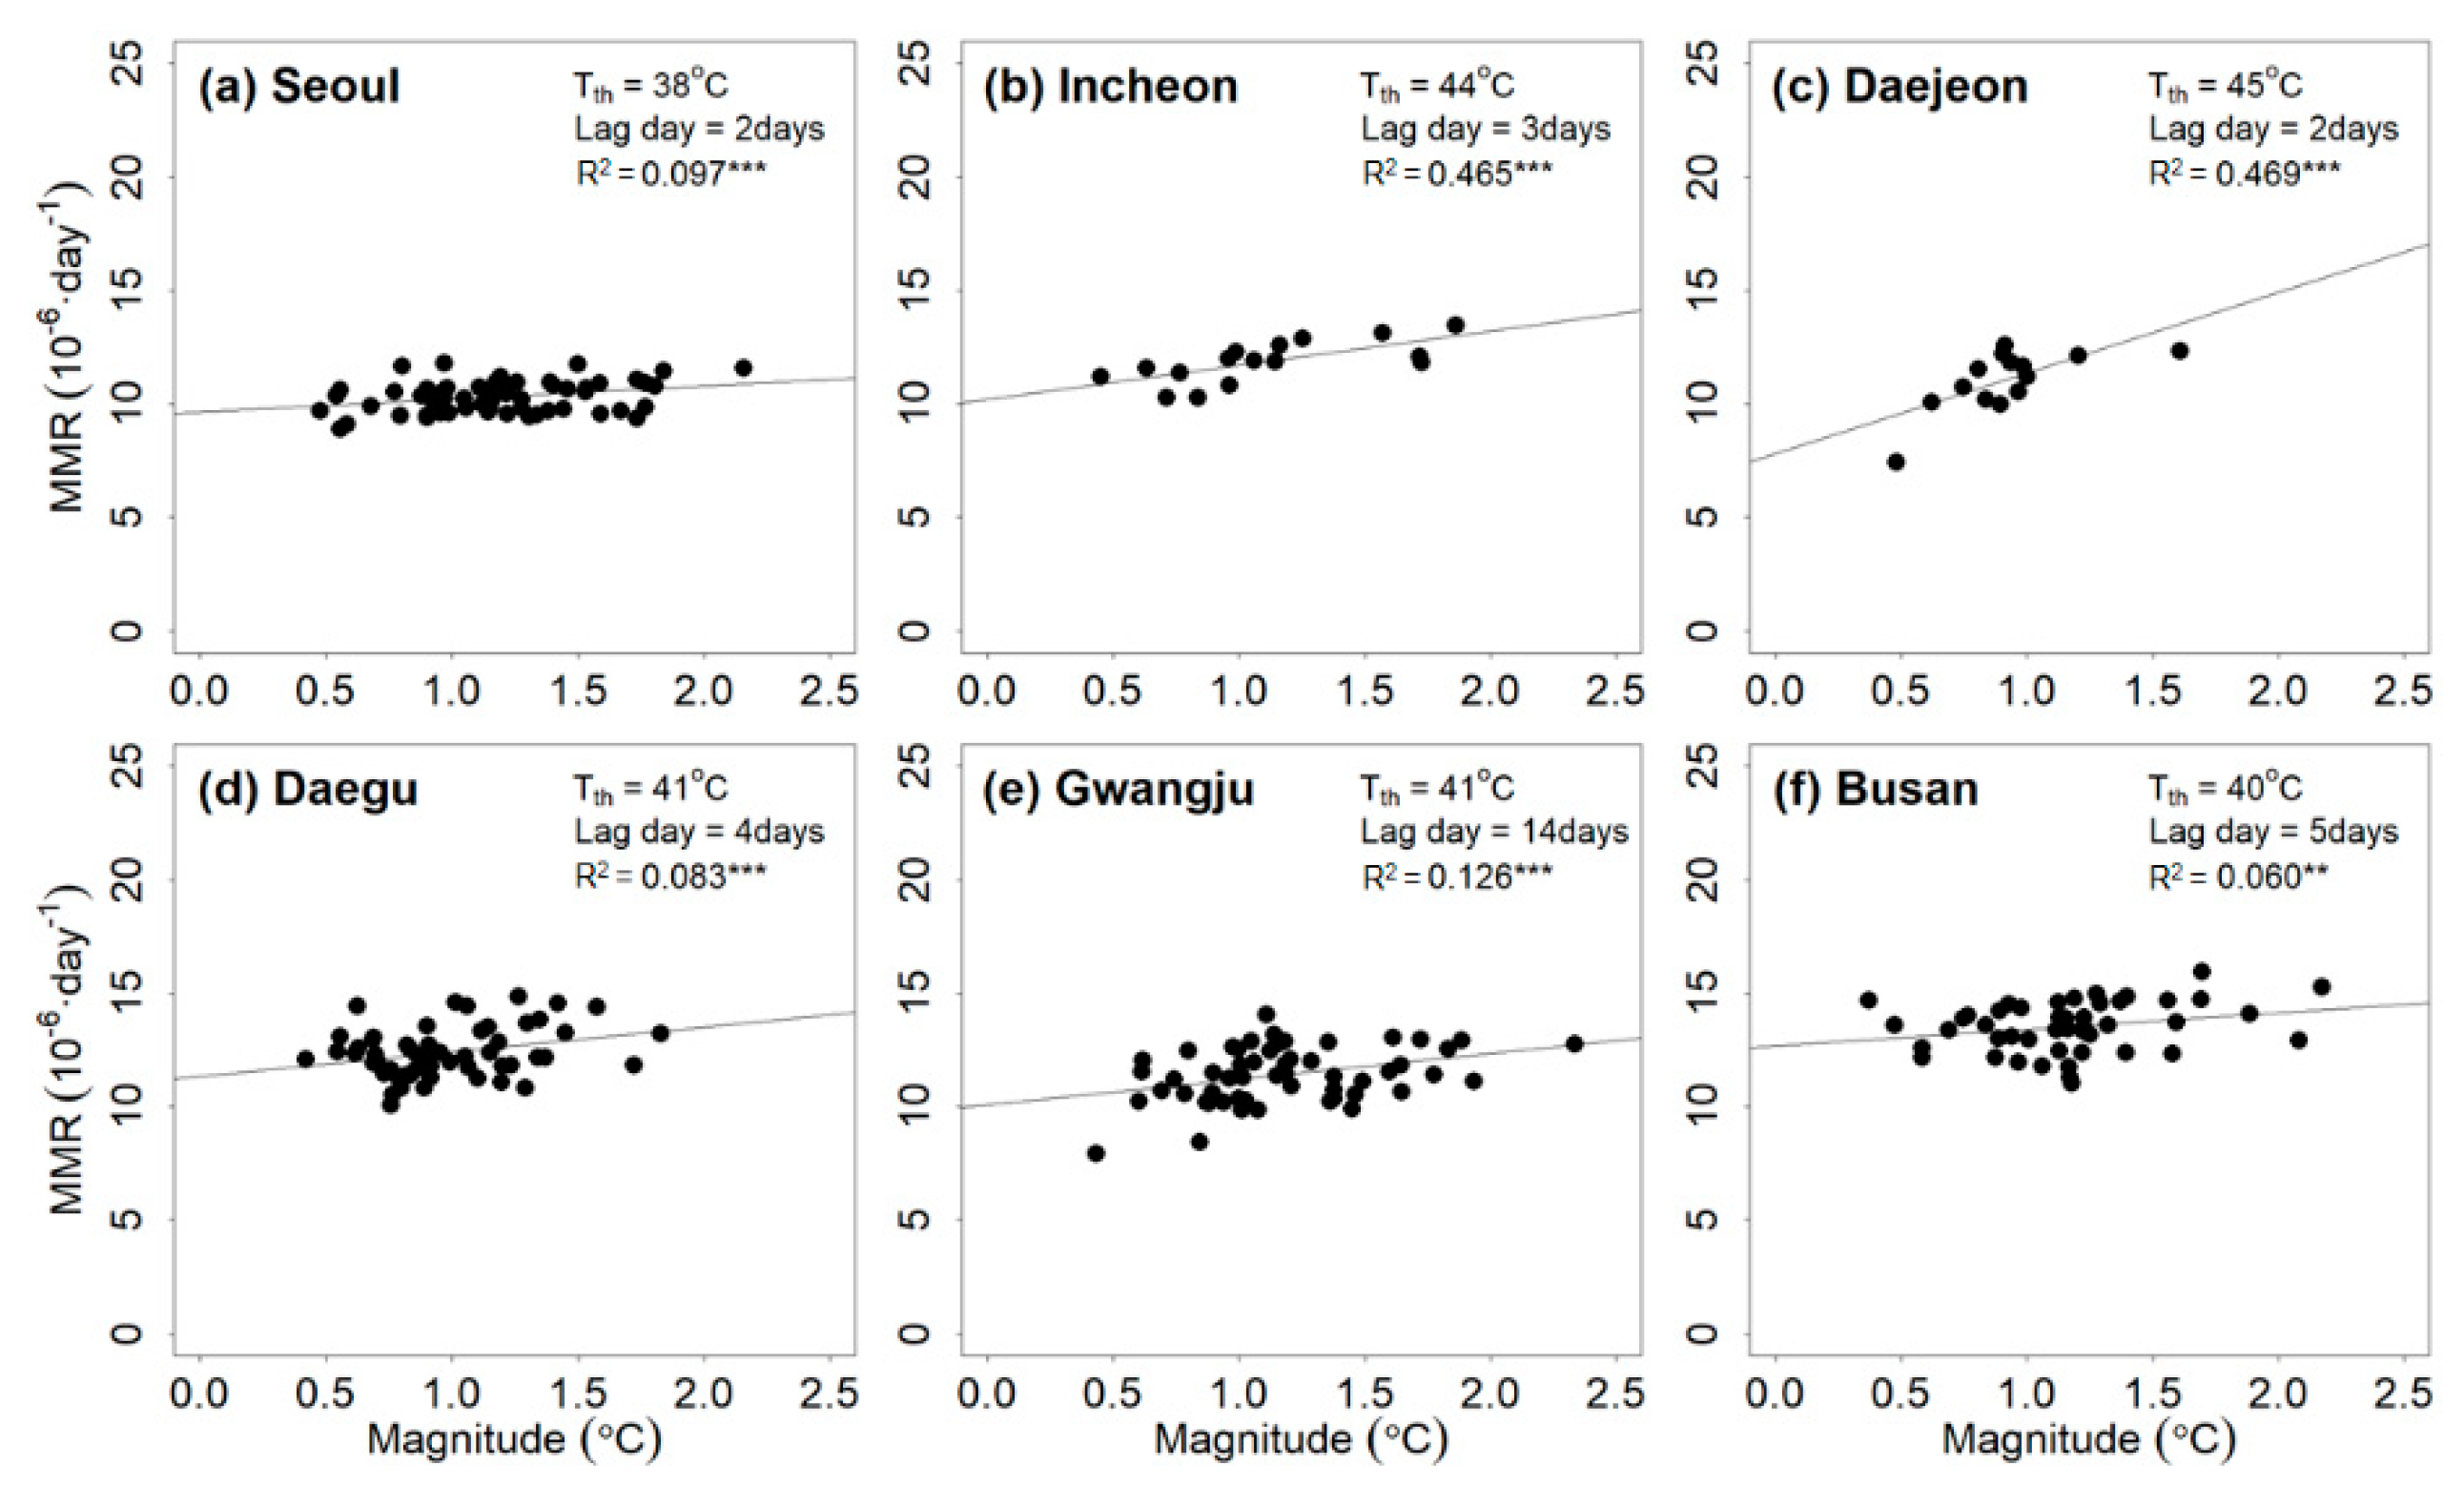
| PTmax | Seoul | 38 | 2 | 0.59 | 9.63 | 0.097 *** | 23.27 | 58 |
| Incheon | 44 | 3 | 1.51 | 10.18 | 0.465 *** | 16.41 | 16 | |
| Daejeon | 45 | 2 | 3.56 | 7.79 | 0.469 *** | 22.36 | 14 | |
| Daegu | 41 | 4 | 1.07 | 11.35 | 0.083 *** | 37.66 | 57 | |
| Gwangju | 41 | 14 | 1.13 | 10.08 | 0.126 *** | 101.08 | 54 | |
| Busan | 40 | 5 | 0.72 | 12.69 | 0.060 ** | 30.08 | 46 | |
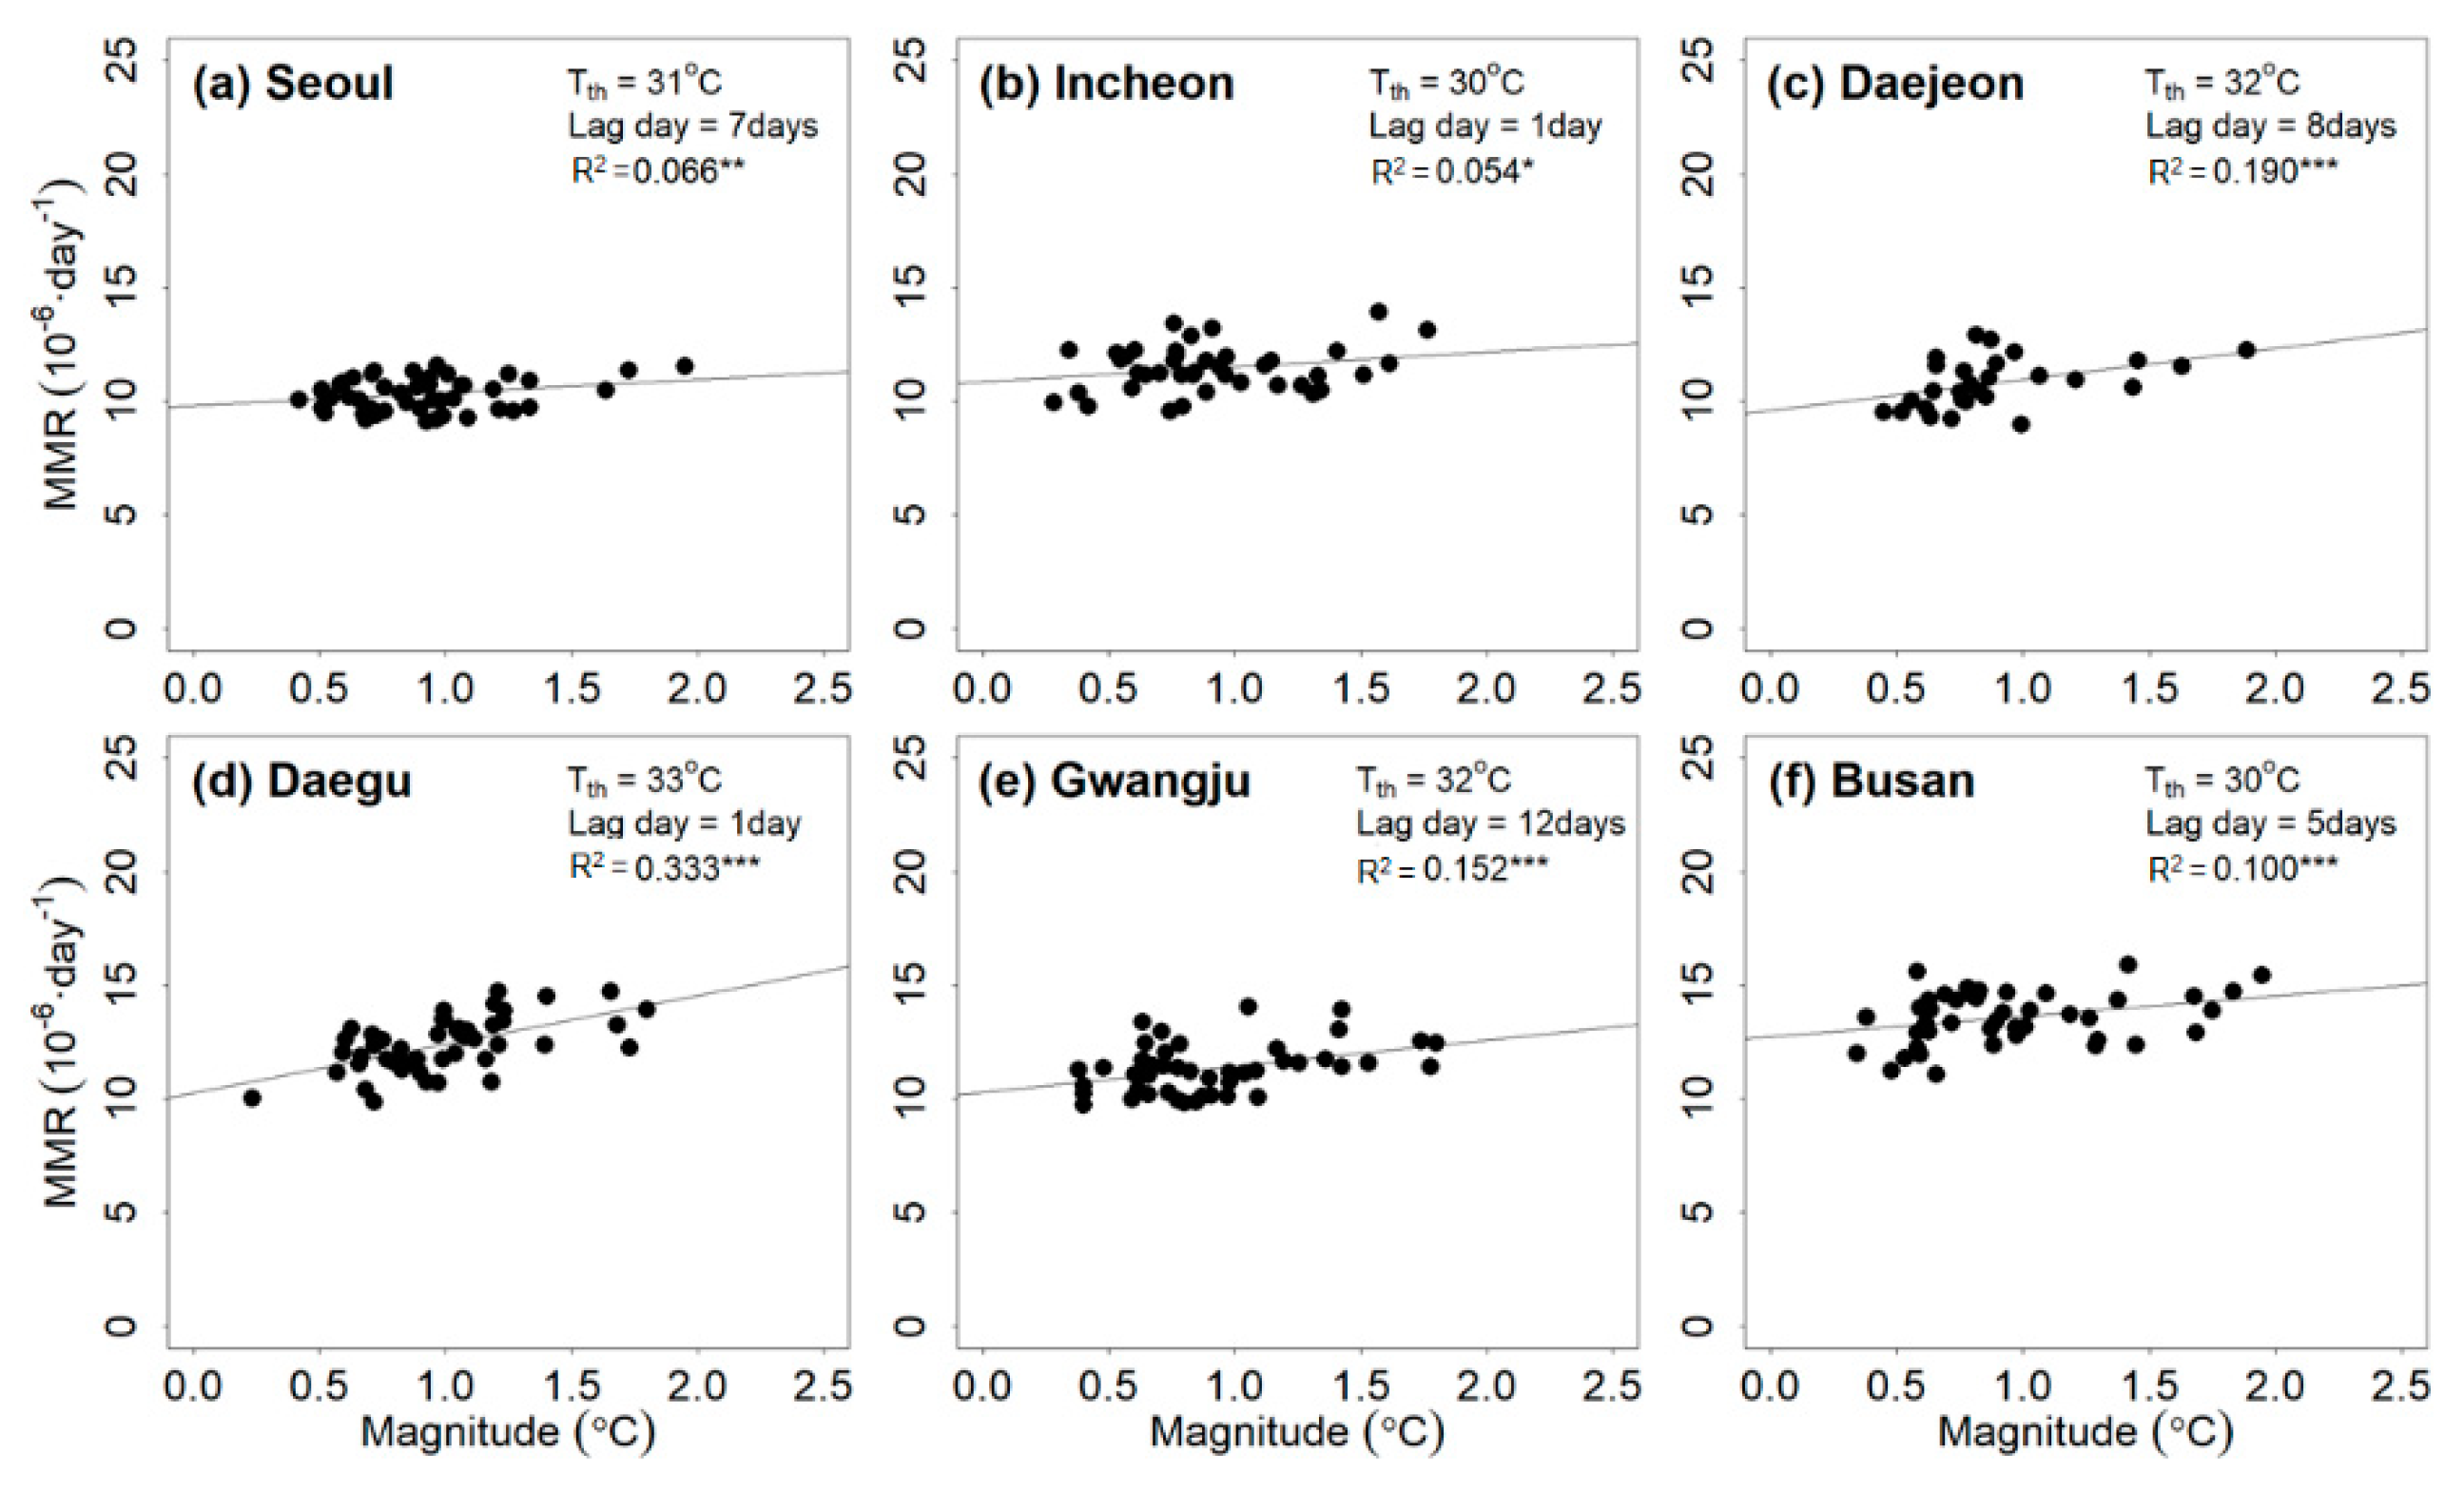
| Tmax | Seoul | 31 | 7 | 0.57 | 9.79 | 0.066 ** | 19.89 | 48 |
| Incheon | 30 | 1 | 0.65 | 10.88 | 0.054 * | 11.70 | 41 | |
| Daejeon | 32 | 8 | 1.38 | 9.58 | 0.190 *** | 32.91 | 28 | |
| Daegu | 33 | 1 | 2.14 | 10.27 | 0.333 *** | 51.30 | 49 | |
| Gwangju | 32 | 12 | 1.15 | 10.28 | 0.152 *** | 57.19 | 45 | |
| Busan | 30 | 5 | 0.90 | 12.75 | 0.100 *** | 33.10 | 44 | |
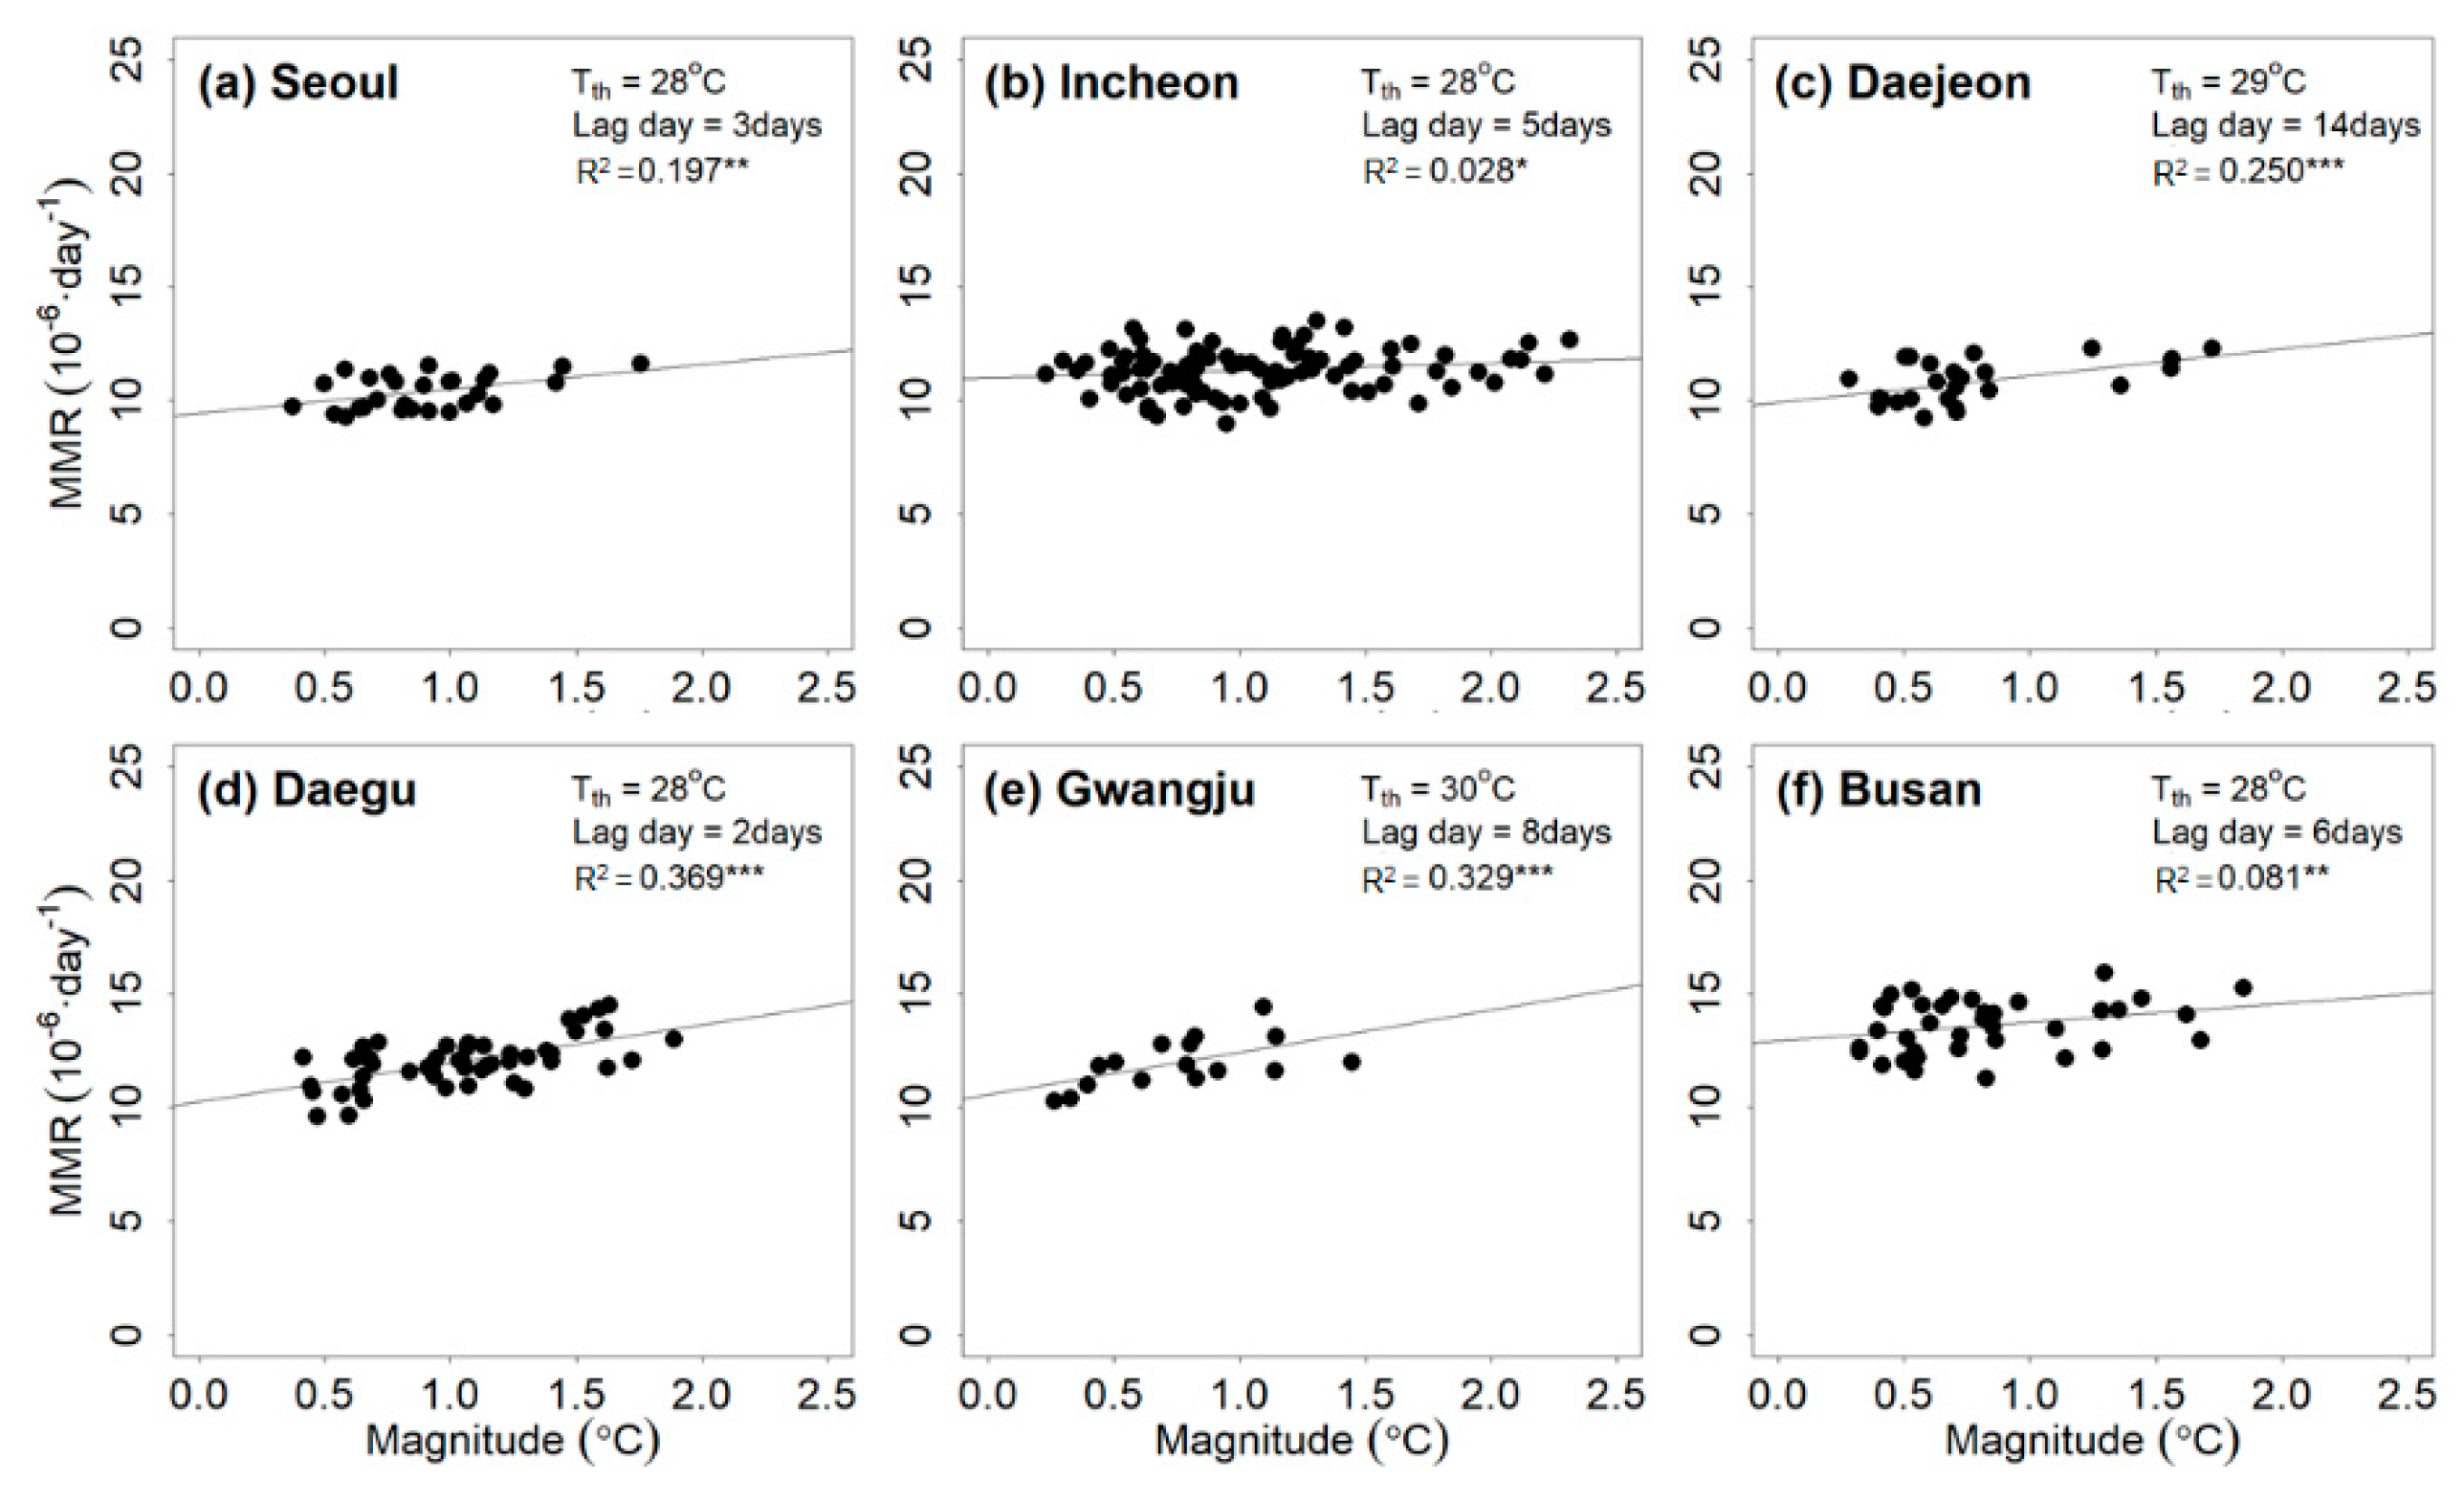
| WBGTmax | Seoul | 28 | 3 | 1.08 | 9.43 | 0.197 *** | 18.34 | 28 |
| Incheon | 25 | 5 | 0.33 | 11.00 | 0.028 * | 32.01 | 89 | |
| Daejeon | 29 | 14 | 1.18 | 9.93 | 0.250 *** | 31.48 | 25 | |
| Daegu | 28 | 2 | 1.69 | 10.26 | 0.369 *** | 65.33 | 50 | |
| Gwangju | 30 | 8 | 1.86 | 10.57 | 0.329 *** | 21.44 | 16 | |
| Busan | 28 | 3 | 0.81 | 12.95 | 0.081 ** | 20.10 | 37 |
| Indicator | Age | (°C) | L (Day) | (10−6·Day−1 °C) | (10−6·Day−1) | Annual MEMR (10−6 ·Year−1) | The Number of Events | |
|---|---|---|---|---|---|---|---|---|
| PTmax | 0–64 | 38 | 7 | 0.16 | 4.31 | 0.031 NS | 12.05 | 64 |
| 65+ | 38 | 6 | 2.56 | 84.25 | 0.010 NS | 184.5 | 64 | |
| Tmax | 0–64 | 29 | 2 | 0.20 | 4.33 | 0.053 *** | 13.41 | 83 |
| 65+ | 29 | 13 | 3.98 | 85.09 | 0.027 * | 479.22 | 83 | |
| WBGTmax | 0–64 | 25 | 0 | 0.16 | 4.33 | 0.045 ** | 14.58 | 80 |
| 65+ | 25 | 7 | 2.24 | 86.09 | 0.014 NS | 287.23 | 80 |
| Indicator | City | Age | (°C) | L (Day) | (10−6·Day−1·°C) | (10−6·Day−1) | Annual MEMR (10−6·Year−1) | The Number of Events | |
|---|---|---|---|---|---|---|---|---|---|
| PTmax | Seoul | 0–64 | 36 | 7 | 0.25 | 3.60 | 0.049 *** | 24.45 | 89 |
| Incheon | 36 | 7 | 0.11 | 4.43 | 0.006 NS | 39.42 | 89 | ||
| Daejeon | 45 | 1 | 1.65 | 2.20 | 0.413 *** | 45.08 | 14 | ||
| Daegu | 36 | 12 | 0.26 | 4.31 | 0.033 ** | 11.53 | 102 | ||
| Gwangju | 33 | 4 | 0.29 | 3.75 | 0.044 *** | 59.74 | 150 | ||
| Busan | 36 | 6 | 0.38 | 4.90 | 0.106 *** | 9.11 | 86 | ||
| Seoul | 65+ | 36 | 3 | 7.26 | 68.97 | 0.045 *** | 520.67 | 89 | |
| Incheon | 38 | 14 | 3.92 | 86.61 | 0.013 NS | 411.38 | 61 | ||
| Daejeon | 41 | 2 | 3.88 | 79.60 | 0.007 NS | 148.29 | 57 | ||
| Daegu | 33 | 8 | 3.06 | 83.72 | 0.014 NS | 628.42 | 121 | ||
| Gwangju | 35 | 1 | 4.63 | 84.86 | 0.022 ** | 572.93 | 132 | ||
| Busan | 32 | 4 | 4.01 | 83.23 | 0.025 ** | 600.03 | 114 | ||
| Tmax | Seoul | 0–64 | 30 | 1 | 0.25 | 3.74 | 0.037 ** | 8.71 | 78 |
| Incheon | 26 | 1 | 0.19 | 4.39 | 0.022 ** | 21.82 | 149 | ||
| Daejeon | 28 | 2 | 0.33 | 3.70 | 0.038 *** | 33.75 | 132 | ||
| Daegu | 35 | 3 | 0.54 | 4.29 | 0.155 * | 4.07 | 15 | ||
| Gwangju | 28 | 2 | 0.26 | 3.91 | 0.026 ** | 33.68 | 145 | ||
| Busan | 27 | 5 | 0.16 | 5.27 | 0.026 * | 17.80 | 90 | ||
| Seoul | 65+ | 30 | 3 | 5.29 | 74.40 | 0.018 NS | 230.24 | 78 | |
| Incheon | 31 | 10 | 14.03 | 85.09 | 0.095 NS | 269.04 | 22 | ||
| Daejeon | 29 | 14 | 6.31 | 80.63 | 0.030 ** | 972.44 | 110 | ||
| Daegu | 33 | 1 | 8.22 | 80.75 | 0.023 NS | 197.06 | 49 | ||
| Gwangju | 31 | 9 | 4.22 | 86.38 | 0.018 NS | 298.85 | 64 | ||
| Busan | 26 | 7 | 1.70 | 89.11 | 0.066 NS | 273.97 | 106 | ||
| WBGTmax | Seoul | 0–64 | 25 | 0 | 0.12 | 3.81 | 0.019 NS | 8.91 | 94 |
| Incheon | 23 | 3 | 0.06 | 4.50 | 0.068 *** | 10.23 | 94 | ||
| Daejeon | 26 | 3 | 0.46 | 3.51 | 0.096 *** | 35.35 | 73 | ||
| Daegu | 26 | 14 | 0.24 | 4.45 | 0.042 ** | 35.58 | 77 | ||
| Gwangju | 23 | 3 | 0.29 | 3.75 | 0.068 *** | 62.89 | 101 | ||
| Busan | 25 | 13 | 0.18 | 5.24 | 0.036 * | 25.62 | 66 | ||
| Seoul | 65+ | 26 | 3 | 0.57 | 79.90 | 0.016 NS | 32.94 | 94 | |
| Incheon | 24 | 7 | 1.45 | 91.31 | 0.005 NS | 222.42 | 100 | ||
| Daejeon | 26 | 3 | 2.32 | 83.88 | 0.005 NS | 179.98 | 73 | ||
| Daegu | 25 | 14 | 3.71 | 83.43 | 0.031 ** | 719.90 | 94 | ||
| Gwangju | 25 | 0 | 3.33 | 88.92 | 0.012 NS | 362.73 | 100 | ||
| Busan | 24 | 4 | 2.30 | 87.47 | 0.010 NS | 304.89 | 76 |
© 2020 by the authors. Licensee MDPI, Basel, Switzerland. This article is an open access article distributed under the terms and conditions of the Creative Commons Attribution (CC BY) license (http://creativecommons.org/licenses/by/4.0/).
Share and Cite
Kang, M.; Kim, K.R.; Shin, J.-Y. Event-Based Heat-Related Risk Assessment Model for South Korea Using Maximum Perceived Temperature, Wet-Bulb Globe Temperature, and Air Temperature Data. Int. J. Environ. Res. Public Health 2020, 17, 2631. https://doi.org/10.3390/ijerph17082631
Kang M, Kim KR, Shin J-Y. Event-Based Heat-Related Risk Assessment Model for South Korea Using Maximum Perceived Temperature, Wet-Bulb Globe Temperature, and Air Temperature Data. International Journal of Environmental Research and Public Health. 2020; 17(8):2631. https://doi.org/10.3390/ijerph17082631
Chicago/Turabian StyleKang, Misun, Kyu Rang Kim, and Ju-Young Shin. 2020. "Event-Based Heat-Related Risk Assessment Model for South Korea Using Maximum Perceived Temperature, Wet-Bulb Globe Temperature, and Air Temperature Data" International Journal of Environmental Research and Public Health 17, no. 8: 2631. https://doi.org/10.3390/ijerph17082631