Abstract
This study determines whether surrounding greenness is associated with the incidence of type 2 diabetes Mellitus (T2DM) in Taiwan. A retrospective cohort study determines the relationship between surrounding greenness and the incidence of T2DM during the study period of 2001–2012 using data from the National Health Insurance Research Database. The satellite-derived normalized difference vegetation index (NDVI) from the global MODIS database in the NASA Earth Observing System is used to assess greenness. Cox proportional hazard models are used to determine the relationship between exposure to surrounding greenness and the incidence of T2DM, with adjustment for potential confounders. A total of 429,504 subjects, including 40,479 subjects who developed T2DM, were identified during the study period. There is an inverse relationship between exposure to surrounding greenness and the incidence of T2DM after adjustment for individual-level covariates, comorbidities, and the region-level covariates (adjusted HR = 0.81, 95% CI: 0.79–0.82). For the general population of Taiwan, greater exposure to surrounding greenness is associated with a lower incidence of T2DM.
1. Introduction
Diabetes mellitus affected approximately 285 million adults around the world in 2010, of which 90% were type 2 diabetes mellitus (T2DM), with the greatest increases in developing countries [1,2,3]. In the past decades, an alarming rise in the incidence of T2DM has been observed in Asia [4,5]. T2DM and its associated complications, such as cardiovascular diseases, diabetic nephropathy, and diabetic retinopathy, result in a substantial medical and socioeconomic burden for patients, their families, and society [6,7].
A growing body of studies has documented the beneficial effects of surrounding greenness on human physical and mental health [8,9]. A previous study determined the effect of green space on survival after a stroke using a cohort of subjects with previous acute ischemic stroke, and showed a relationship between the proximity of the subject’s residence to green space and a greater survival rate after a stroke [10]. The World Health Organization conceptual framework of social determinants of health also indicates how economic, political, and social factors influence an individual’s socioeconomic status [11]. Green space may modify some social determinants which, in turn, play a role in determining health outcomes including T2DM [12]. Lifestyle intervention has also been demonstrated to reduce the risk of developing T2DM [13], but the effectiveness depends on the neighborhoods where people live [14]. On the other hand, Dudek and colleagues reported that exposure to natural communities, such as forests, may pose an increased risk of allergy [15]. To date, limited studies have been conducted to determine the relationship between surrounding greenness and the incidence of T2DM.
This retrospective cohort study uses nationwide, population-based medical claims data for Taiwan. The study determines whether there is a relationship between surrounding greenness and the incidence of T2DM. The joint modifiable effects of several T2DM-related factors on the effect of surrounding greenness on the incidence of T2DM are also evaluated.
2. Materials and Methods
2.1. Study Population and Data Sources
Taiwan has had a single-payer National Health Insurance (NHI) program since 1995. Approximately 99.9% of the total population of Taiwan was enrolled in the NHI program by the end of 2014. For research purposes, the Taiwanese National Health Insurance Research Database (NHIRD) uses the NHI program’s medical claims data, including comprehensive information about patients’ demographic characteristics, diagnoses, and prescription claims data, medical facilities, and medical services [16]. All data related to personal identification in NHIRD was scrambled before being released to researchers. This retrospective cohort study uses one of the NHIRD subsets, the Longitudinal Health Insurance Database 2000 (LHID2000), which contains all original claims data from 2000 to 2012. A total of 1,000,000 individuals were randomly sampled from the 2000 Registry for beneficiaries of the NHI program (roughly 5% of the total population of Taiwan). The study subjects resided in 350 townships on the island of Taiwan between 2001 and 2012. This study was approved by the Institutional Review Board of the National Health Research Institutes, Taiwan, and the National Cheng Kung University Governance Framework for Human Research Ethics (104-081). All methods were carried out in accordance with relevant guidelines and regulations.
2.2. Study Subjects
The study subjects came from the LHID2000. The selection criteria are as follows: (1) Subjects aged 20 years or older in 2001; (2) subjects free of T2DM (based on International Classification of Diseases, Ninth Revision, Clinical Modification (ICD-9-CM) code: 250) before 1 January 2001; (3) subjects residing on the island of Taiwan; and (4) subjects registered as NHI beneficiaries in 2001–2012. The exclusion criteria are as follows: (1) Subjects aged less than 20 years in 2001; (2) subjects with T2DM diagnosis before 2001; and (3) subjects residing in Penghu, Kinmen, and Matsu Islands. A total of 429,504 subjects are included for subsequent analysis in this study. The detailed flowchart for inclusion/exclusion criteria for the study subjects is shown in Figure 1.
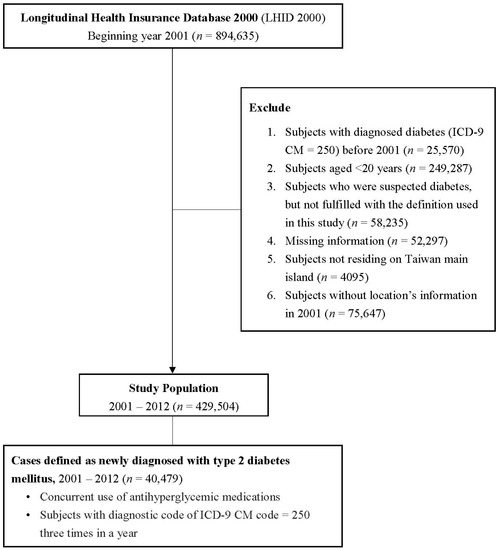
Figure 1.
Flow chart for inclusion/exclusion criteria for the study subjects in 2001–2012.
The study outcome is subjects who are diagnosed with T2DM. Subjects are determined to have T2DM if: (1) Subjects have three times or more ICD-9-CM code = 250 from inpatient or outpatient medical claims data within a year; and (2) subjects show concurrent use of anti-hyperglycemic medications [17,18].
2.3. Greenness Assessment
The surrounding greenness (the amount of trees and vegetation) for each subject is measured using a satellite-derived normalized difference vegetation index (NDVI). This is a spectrum-based greenness index that is defined as the ratio of absorbed visible light and reflected near-infrared to the total amount of visible and near infrared radiation striking a surface for measuring plant growth (vigor), vegetation cover, and biomass production from multispectral satellite data [19]. Global NDVI data come from the global Moderate Resolution Imaging Spectroradiometer (MODIS) database in the National Aeronautics and Space Administration (NASA) Earth Observing System [20,21]. Global MODIS NDVI Version 5 (NASA, Washington, D.C., USA) is updated every 16 days, at a spatial resolution of 250 m and the NDVI ranges from −1.0 to 1.0. A more positive NDVI value means a greater amount of healthy green vegetation [22]. In this study, all of the NDVI images from 2001 to 2012 are used for the subsequent analysis. Specifically, NDVI from 2001 to the event-month, death month, or end of follow-up was averaged to represent the long-term continuous time-varying exposure of greenness to subjects. In considering confidentiality issues, the residential address of subjects is not available in this study. The averaged exposure to greenness for each participant is determined using the location of the most frequently visited medical facilities each year as close proximity to greenness for study subjects. Circular buffers of 250 m, 500 m, and 1000 m, separately, were selected based on each medical facility to estimate subjects’ exposure to greenness within walking distance and a range of using common transportation [23].
2.4. Covariates
Potential confounding variables for this study include demographic information, such as age group (20–34, 35–44, 45–54, 55–64, and >65 years), gender (male or female), socioeconomic status (SES), such as insurance amount, occupational type (governmental employee and teachers, soldiers, service industries, agriculture workers, fishing and animal husbandry, non-governmental organizations, and others), and subjects’ comorbidities (hypertension [ICD-9-CM codes = 401–405] and hyperlipidemia [ICD-9-CM code = 272]). Contextual socioeconomic circumstances are controlled and adjusted, for example, by county-level income information (scaled from 0–625, 625–1250, 1250–1875 and >1875 in USD/year) from the Taiwanese National Statistics and township urbanization levels (scaled from level 1: Urban core area; level 2: Downtown; level 3: Emerging town; level 4: Traditional industry area; level 5: Low development town; level 6: Aging society town; level 7: Rural area).
2.5. Statistical Analysis
The distributions of baseline characteristics for the two NDVI exposure groups (using the four-quantile level of NDVI as the cut-off) are compared. An ANOVA-test are used for continuous variables, and a chi-square test is used for discreet variables. As the value of greenness was determined at the township level using the location of the most frequently visited medical facilities, Cox proportional hazard models were used with a generalized estimating equation to account for clustering for the same township, in order to determine the relationship between exposure to NDVI and the incidence of T2DM, with adjustment of any potential confounders [24]. The time at risk for T2DM is calculated for study subjects as the duration from 2001 (the enrollment year) to the date on which the patient is diagnosed with T2DM, death, or the last day of 2012 (the last observational year). The follow-up duration (using years as a unit) is the time variable in the models. The degree of exposure to greenness is calculated based on average greenness for each year until subjects develop the outcome, die, or follow-up ends.
Subgroup analyses are applied to determine the modifiable effects of various characteristics on the risk of developing T2DM risk, in terms of age group, sex, insurance amount, and comorbidity, including any diagnosis of hypertension or dyslipidemia. A sensitivity analysis is used to test robustness of the results. The analysis was then restricted to subjects who did not relocate during the study period, those who had a T2DM diagnosis every year, those who did not have relief aids or those who did not have coronary artery disease (CAD). Different buffer sizes (i.e., 250 m, 500 m, and 1000 m) were used to denote different degrees of exposure to greenness.
Statistical significance is determined using a 95% confidence interval (CI) or a p-value of less than 0.05. All of the analyses are performed using the statistical software, SAS 9.4 (SAS Institute, Cary, NC, USA) and R version 3.3.0 (The R project for statistical computing) (The R Foundation, Vienna, Austria).
3. Results
3.1. Baseline Characteristics for the Study Subjects
A total of 429,504 subjects were included in subsequent analyses. Of the eligible subjects, 40,479 developed T2DM during the study period (2001–2012). The mean follow-up time was 11.28 years, and the 12-year cumulative incidence is 9.4%. Table 1 shows the baseline characteristics for the study subjects, grouped in terms of high or low exposure to greenness, using a median level of NDVI (0.46) as the cut-off value. The distributions of age, sex, insurance amount, occupational types, township urbanization levels, county level income, and the incidence of T2DM were classified in terms of high or low exposure to greenness (Table 1).

Table 1.
Baseline characteristics for study subjects (n = 429,504), grouped in terms of the quantile for normalized difference vegetation index (NDVI) in 2001.
3.2. The Relationship between Greenness and the Incidence of T2DM
Table 2 presents three different models involved in the adjustment of various covariates provided as follows: (1) The individual-level covariates; (2) the individual-level covariates and comorbidities; and (3) the individual-level covariates, comorbidities, and the region-level covariates. The results showed a significant inverse relationship between greenness (in terms of the per IQR increase) and the incidence of T2DM. There was a similar inverse relationship when greenness was modeled in quartiles.
Table 2.
Association between long-term greenness exposure and incidence of type 2 diabetes mellitus.
3.3. Subgroup Analysis of Various Factors That Are Related to T2DM
Similar to the above Table 2, the results of the subgroup analyses in Table 3 showed that there was an inverse relationship between the surrounding greenness and the incidence of T2DM across all strata, for example, age, sex, insurance amount, hypertension, and hyperlipidemia, respectively.
Table 3.
Association between greenness exposure and incidence of type 2 diabetes mellitus, stratified by age, sex, insurance amount, hypertension, and hyperlipidemia, respectively.
3.4. Sensitivity Analysis
Sensitivity analyses using different criteria to determine the degree of exposure to greenness in subjects with different specific conditions indicated similar results (Table 4). First, for patients with no relocation, we intended to examine whether the results from main model were comparable to the subgroup exposed to stable degree of greenness, that is, no relocation. Second, for patients with diabetes diagnosis using anti-hyperglycemic medications every year, we intended to evaluate whether the results from main model were comparable to the subgroup with a relatively restricted diagnosis of T2DM. Third, for patients with no relief aids, we attempted to investigate whether the results from main model were comparable to the subgroup without considering low level of socio-economic status, specifically accounting for a crucial social determinant. Fourth, for patients with no coronary artery disease (CAD), we attempted to examine whether the results from main model were comparable to a relatively healthy subgroup. For subjects who experienced different conditions, an inverse relationship between exposure to greenness and the incidence of T2DM was found. The results in Table 4 also showed a similar inverse relationship with the incidence of T2DM for different sizes of buffer for surrounding greenness.
Table 4.
The relationship between long-term exposure to greenness and the incidence of type 2 diabetes mellitus.
4. Discussion
This study suggests that a greater degree of surrounding greenness is associated with a reduced risk of T2DM. The inverse relationship between surrounding greenness and the incidence of T2DM is significant after adjusting for various individual-level risk factors, comorbid conditions and regional-level variables. Consistent inverse relationship was found when applying different criteria to determine the degree of exposure to surrounding greenness, or subjects with different specific conditions. To the best of the authors’ knowledge, this study is one of the first to determine the potential beneficial effect of exposure to surrounding greenness on the incidence of T2DM in a general population, particularly in an Asian country.
Previous studies have demonstrated that forest bathing trips affected human immune function, leading to an increase in natural killer (NK) activity via increasing the levels of intracellular granulysin and performance in and the number of NK cells [25,26,27]. Thus, it was likely exposure to surrounding greenness might decrease the risk of developing T2DM through modulating immune function. In addition, Cho et al. have reported that the beneficial effects of forest bathing on human health might be through terpenes, the largest class of naturally occurring organic compounds, which have the effect of anti-inflammatory, anti-cancer, or neuroprotective activities [28]. Higher exposure to surrounding greenness reducing the risk of developing T2DM may be partly due to higher levels of terpenes. Over the past years, growing evidence has suggested greenness was associated with health outcomes, such as obesity, mental health, and coronary heart disease [29] For example, Fong et al. have reported there were consistent results supporting the protective effects of greenness on various health outcomes, such as birth outcomes and mental health [30]. Our findings were in line with previous reports. In a US sample of 249,405 Medicare subjects aged 65 years or more, greenness might reduce various chronic conditions, including diabetes, hypertension, and hyperlipidemia [31]. In a UK study of 6076 participants, greater levels of greenness decreased the risk of metabolic syndrome (e.g., reduced levels of fasting glucose and/or triglyceride) [32]. In a sample of Australians aged 45 years and older, proximity to green space was associated with reduced body weight [33]. In an observational study using a large population-based Canadian birth cohort, Perry and colleagues reported that increased levels of residential greenness were associated with positive birth outcomes [34]. In a Dutch population, Maas and colleagues demonstrated there was an inverse relationship between proximity to green space and the incidence of T2DM, similar to the findings reported by Astell-Burt and colleagues in a group of 267,072 Australians aged 45 years and older [35,36]. Similarly, our results for this study showed that higher exposure to greenness was associated with a reduced risk of T2DM.
The mechanisms dictating the association between surrounding greenness and the incidence of T2DM are largely unclear. Previous reports have suggested that surrounding greenness may be associated with less exposure to ambient air pollution [29,37]. Proximity to surrounding greenness has also been reported to be associated with an increase in physical activity, which is positively associated with a healthy lifestyle [38]. Roe et al. have noted that changes in salivary cortisol, which is a measure of stress, are related to exposure to greenness, and as a result, may affect susceptibility to T2DM [39].
To the best of the authors’ knowledge, this is the first 12-year nationwide, population-based study to demonstrate the beneficial effect of different sizes of buffer (i.e., 250 m, 500 m, 1000 m, and 2000 m) of surrounding greenness on the incidence of T2DM in a general Asian population in Taiwan. This inverse relationship between exposure to surrounding greenness and T2DM exists, regardless of whether the model is adjusted for individual-level covariates, such as age, sex, insurance amount, and occupation types, or for region-level covariates, such as county-level income information and township urbanization levels.
On the other hand, some limitations should be noted. First, information about potential confounding factors, such as diet, smoking, alcohol, and obesity, are not available in the NHIRD. However, we carried out sensitivity analyses. Similar results were observed when restricting subjects without CAD, which may be partially controlled for obesity and/or low physical activity [16,17]. Still, it was likely that there were residual confounding effects due to unmeasured confounders. Second, due to the lack of residential location information, the individuals’ exposure data could only be estimated based on the location of the most frequently visited medical centers. It might cause potential misclassification of exposure estimation and not be fully representative of the individuals’ exposure. Third, information of the types of green spaces, their sizes, and the distances are not available in this study. We are not able to examine their influence on the incidence of T2DM. Thus, the results should be interpreted with caution. The present study did not show the dose-response relationship between greenness and T2DM. However, we observed that the increasing greenness exposure reduced the risk of T2DM in the second, third, and fourth quartile for greenness. Further evaluation of potential dose-response relationship will be needed to clarify whether such relationship exits. The effect of surrounding greenness on the incidence of T2DM is determined for a Taiwanese cohort. The results for this study may or may not be generally applicable to other populations.
5. Conclusions
The results of this study show that there is an inverse relationship between surrounding greenness and the incidence of T2DM. The results remained consistent when different criteria were used to define the degree of exposure to surrounding greenness, or for subjects with different specific conditions. Further study is required to confirm the results of this study. It is of importance to determine the underlying mechanisms by which surrounding greenness affects the incidence of T2DM.
Author Contributions
Conceptualization, H.-J.T., W.-C.P., C.-D.W. and J.D.S.; methodology, H.-J.T., W.-C.P. and C.-D.W.; formal analysis, C.-Y.L. and Y.-R.C.; data curation, C.-D.W. and H.-J.S.; writing—original draft preparation, H.-J.T.; writing—review and editing, H.-J.T., W.-C.P., C.-D.W., T.-C.Y. and J.D.S.; funding acquisition, H.-J.T. and C.-D.W. All authors have read and agreed to the published version of the manuscript.
Funding
This study was funded by the National Health Research Institutes, Taiwan (NHRI-109A1-PHPP08-014) and Ministry of Science of Technology, R.O.C. (PI: Wu: MOST 104-2119-M-415-003-; Tsai: MOST 107-2314-B-400-031-MY3).
Institutional Review Board Statement
The study has been reviewed and approved by the National Cheng Kung University Human Research Ethics Committee (Reference 106–242).
Informed Consent Statement
Not applicable.
Data Availability Statement
No new data were created or analyzed in this study. Data sharing is not applicable to this article.
Acknowledgments
The authors are grateful to the National Aeronautics and Space Administration (NASA) and the U.S. Geological Survey (USGS) for data. This study uses data from the National Health Insurance Research Database, which is provided by the National Health Insurance Administration and the Ministry of Health and Welfare, and which is managed by the National Health Research Institutes. The interpretation and conclusions that are detailed in this study do not represent the views of the National Health Insurance Administration, the Ministry of Health and Welfare or the National Health Research Institutes.
Conflicts of Interest
The funders had no role in the design of the study; in the collection, analyses, or interpretation of data; in the writing of the manuscript, or in the decision to publish the results.
References
- NCD Risk Factor Collaboration. Worldwide trends in diabetes since 1980: A pooled analysis of 751 population-based studies with 4.4 million subjects. Lancet 2016, 387, 1513–1530. [Google Scholar] [CrossRef]
- Stumvoll, M.; Goldstein, B.J.; van Haeften, T.W. Type 2 diabetes: Principles of pathogenesis and therapy. Lancet 2005, 365, 1333–1346. [Google Scholar] [CrossRef]
- Zimmet, P.; Alberti, K.G.M.M.; Shaw, J. Global and societal implications of the diabetes epidemic. Nature 2001, 414, 782–787. [Google Scholar] [CrossRef] [PubMed]
- Nanditha, A.; Ma, R.C.W.; Ramachandran, A.; Snehalatha, C.; Chan, J.C.N.; Chia, K.S.; Shaw, J.E.; Zimmet, P.Z. Diabetes in Asia and the pacific: Implications for the global epidemic. Diabetes Care 2016, 39, 472–485. [Google Scholar] [CrossRef] [PubMed]
- Ramachandran, A.; Snehalatha, C.; Ma, R.C.W. Diabetes in South-East Asia: An update. Diabetes Res. Clin. Pract. 2014, 103, 231–237. [Google Scholar] [CrossRef] [PubMed]
- Chan, J.C.N.; Malik, V.; Jia, W.; Kadowaki, T.; Yajnik, C.S.; Yoon, K.-H.; Hu, F.B. Diabetes in Asia: Epidemiology, risk factors, and pathophysiology. JAMA 2009, 301, 2129–2140. [Google Scholar] [CrossRef] [PubMed]
- King, H.A.R.; Aubert, R.; Herman, W.H. Global burden of diabetes, 1995–2025: Prevalence, numerical estimates, and projections. Diabetes Care 1998, 21, 1414–1431. [Google Scholar] [CrossRef]
- Dadvand, P.; Bartoll, X.; Basagaña, X.; Dalmau-Bueno, A.; Martinez, D.; Ambros, A.; Cirach, M.; Triguero-Mas, M.; Gascon, M.; Borrell, C.; et al. Green spaces and General Health: Roles of mental health status, social support, and physical activity. Environ. Int. 2016, 91, 161–167. [Google Scholar] [CrossRef]
- Gascon, M.; Triguero-Mas, M.; Martínez, D.; Dadvand, P.; Rojas-Rueda, D.; Plasència, A.; Nieuwenhuijsen, M.J. Residential green spaces and mortality: A systematic review. Environ. Int. 2016, 86, 60–67. [Google Scholar] [CrossRef]
- Wilker, E.H.; Wu, C.-D.; McNeely, E.; Mostofsky, E.; Spengler, J.; Wellenius, G.A.; Mittleman, M.A. Green space and mortality following ischemic stroke. Environ. Res. 2014, 133, 42–48. [Google Scholar] [CrossRef]
- Committee on Educating Health Professionals to Address the Social Determinants of Health; Board on Global Health; Institute of Medicine; National Academies of Sciences, Engineering, and Medicine. A Framework for Educating Health Professionals to Address the Social Determinants of Health; The National Academies Press: Washington, DC, USA, 2016. [Google Scholar]
- Lee, H.Y.; Wu, Y.H.; Asri, A.K.; Chen, T.H.; Pan, W.C.; Yu, C.P.; Su, H.J.; Wu, C.D. Linkage between Residential Green Spaces and Allergic Rhinitis among Children in Asia using Spectrum-Based Vegetation Index (case study: Taiwan). Landsc. Urban Plan. 2020, 202, 103868. [Google Scholar] [CrossRef]
- Haghighi, M.M.; Mavros, Y.; Singh, M.A.F. The effects of structured exercise or lifestyle behavior interventions on long-term physical activity level and health outcomes in individuals with type 2 diabetes: A systematic review, Meta-analysis, and Meta-regression. J. Phys. Act. Health 2018, 15, 697–707. [Google Scholar] [CrossRef] [PubMed]
- Williams, E.D.; Magliano, D.J.; Zimmet, P.Z.; Kavanagh, A.M.; Stevenson, C.E.; Oldenburg, B.F.; Shaw, J.E. Area-level socioeconomic status and incidence of abnormal glucose metabolism. Diabetes Care 2012, 35, 1455–1461. [Google Scholar] [CrossRef] [PubMed]
- Dudek, T.; Kasprzyk, I.; Dulska-Jeż, A. Forest as a place for recreation but also the source of allergenic plant pollen: To come or avoid? Eur. J. For. Res. 2018, 137, 849–862. [Google Scholar] [CrossRef]
- Tsai, L.-T.; Lo, F.-E.; Yang, C.-C.; Lo, W.-M.; Keller, J.J.; Hwang, C.-W.; Lin, C.-F.; Lyu, S.-Y.; Morisky, D.E. Influence of socioeconomic factors, gender and indigenous status on smoking in Taiwan. Int. J. Environ. Res. Public Health 2016, 13, 1044. [Google Scholar] [CrossRef]
- Tsai, Y.-W.; Tsai, T.-I.; Yang, C.-L.; Kuo, K.N. Gender differences in smoking behaviors in an Asian population. J. Women’s Health 2008, 17, 971–978. [Google Scholar] [CrossRef]
- Huang, S.-K. 2014–2015 National Health Insurance Annual Report. (ISBN: 978-986-04-3867-3). Retrieved from National Health Insurance Administration, Ministry of Health, Executive Yuan. 2014. Available online: https://www.nhi.gov.tw/Resource/webdata/28140_1_National%20Health%20Insurance%20in%20Taiwan%202014-2015%20(bilingual).pdf (accessed on 5 July 2020).
- Chang, C.-H.; Jiang, Y.-D.; Chung, C.-H.; Ho, L.-T.; Chuang, L.-M. National trends in anti-diabetic treatment in Taiwan, 2000–2009. J. Formos. Med. Assoc. 2012, 111, 617–624. [Google Scholar] [CrossRef]
- Li, H.-Y.; Jiang, Y.-D.; Chang, C.-H.; Chung, C.-H.; Lin, B.J.; Chuang, L.-M. Mortality trends in patients with diabetes in Taiwan: A nationwide survey in 2000–2009. J. Formos. Med. Assoc. 2012, 111, 645–650. [Google Scholar] [CrossRef][Green Version]
- Wu, C.-D.; McNeely, E.; Cedeño-Laurent, J.G.; Pan, W.-C.; Adamkiewicz, G.; Dominici, F.; Lung, S.-C.C.; Su, H.-J.; Spengler, J.D. Linking student performance in Massachusetts Elementary Schools with the “Greenness” of school surroundings using remote sensing. PLoS ONE 2014, 9, e108548. [Google Scholar] [CrossRef]
- Ji, J.S.; Zhu, A.; Chen, B.; Wu, C.D.; Yan, L.; Zeng, Y.; James, P. Residential greenness and mortality in a cohort of oldest-old women and men in China. Lancet Planet. Health 2019, 3, e17–e25. [Google Scholar] [CrossRef]
- McMorris, O.; Villeneuve, J.P.; Su, J.; Jerrett, M. Urban greenness and physical activity in a national survey of Canadians. Environ. Res. 2015, 137, 94–100. [Google Scholar] [CrossRef] [PubMed]
- Rugel, E.J.; Henderson, S.B.; Carpiano, R.M.; Brauer, M. Beyond the Normalized Difference Vegetation Index (NDVI): Developing a natural space index for population-level health research. Environ. Res. 2017, 159, 474–483. [Google Scholar] [CrossRef] [PubMed]
- Li, Q.; Morimoto, K.; Kobayashi, M.; Inagaki, H.; Katsumata, M.; Hirata, Y.; Hirata, K.; Suzuki, H.; Li, Y.J.; Wakayama, Y.; et al. Visiting a forest, but not a city, increases human natural killer activity and expression of anti-cancer proteins. Int. J. Immunopathol. Pharmacol. 2008, 21, 117–127. [Google Scholar] [CrossRef] [PubMed]
- Li, Q. Effect of forest bathing trips on human immune function. Environ. Health Prev. Med. 2010, 15, 9–17. [Google Scholar] [CrossRef] [PubMed]
- Li, Q.; Kawada, T. Effect of forest environments on human natural killer (NK) activity. Int. J. Immunopathol. Pharmacol. 2011, 24, 39S–44S. [Google Scholar]
- Cho, K.S.; Lim, Y.-r.; Lee, K.; Lee, J.; Lee, J.H.; Lee, I.-S. Terpenes from forests and human health. Toxicol. Res. 2017, 33, 97–106. [Google Scholar] [CrossRef]
- James, P.; Banay, R.; Hart, J.; Laden, F. A review of the health benefits of greenness. Curr. Epidemiol. 2015, 2, 131–142. [Google Scholar] [CrossRef]
- Fong, K.C.; Hart, J.E.; James, P. A review of epidemiologic studies on greenness and health: Updated literature through 2017. Curr. Environ. Health 2018, 5, 77–87. [Google Scholar] [CrossRef]
- Brown, S.C.; Lombard, J.; Wang, K.; Byrne, M.M.; Toro, M.; Plater-Zyberk, E.; Feaster, D.J.; Kardys, J.; Nardi, M.I.; Perez-Gomez, G.; et al. Neighborhood greenness and chronic health conditions in medicare beneficiaries. Am. J. Prev. Med. 2016, 51, 78–89. [Google Scholar] [CrossRef]
- de Keijzer, C.; Basagaña, X.; Tonne, C.; Valentín, A.; Alonso, J.; Antó, J.M.; Nieuwenhuijsen, M.J.; Kivimäki, M.; Singh-Manoux, A.; Sunyer, J.; et al. Long-term exposure to greenspace and metabolic syndrome: A Whitehall II study. Environ Pollut. 2019, 255 Pt 2, 113231. [Google Scholar] [CrossRef]
- Astell-Burt, T.; Feng, X.; Kolt, G.S. Greener neighborhoods, slimmer people? Evidence from 246,920 Australians. Int. J. Obes. 2013, 38, 156. [Google Scholar] [CrossRef] [PubMed]
- Hystad, P.; Davies, H.W.; Frank, L.; Van Loon, J.; Gehring, U.; Tamburic, L.; Brauer, M. Residential greenness and birth outcomes: Evaluating the influence of spatially correlated built-environment factors. Environ. Health Perspect. 2014, 122, 1095–1102. [Google Scholar] [CrossRef] [PubMed]
- Astell-Burt, T.; Feng, X.; Kolt, G.S. Is neighborhood green space associated with a lower risk of type 2 diabetes? Evidence from 267,072 Australians. Diabetes Care 2014, 37, 197–201. [Google Scholar] [CrossRef] [PubMed]
- Maas, J.; Verheij, R.A.; de Vries, S.; Spreeuwenberg, P.; Schellevis, F.G.; Groenewegen, P.P. Morbidity is related to a green living environment. J. Epidemiol. Community Health 2009, 63, 967–973. [Google Scholar] [CrossRef] [PubMed]
- Dadvand, P.; Ostro, B.; Figueras, F.; Foraster, M.; Basagaña, X.; Valentín, A.; Martinez, D.; Beelen, R.; Cirach, M.; Hoek, G.; et al. Residential proximity to major roads and term low birth weight: The roles of air pollution, heat, noise, and road-adjacent trees. Epidemiology 2014, 25, 518–525. [Google Scholar] [CrossRef] [PubMed]
- Lee, A.; Maheswaran, R. The health benefits of urban green spaces: A review of the evidence. J. Public Health 2011, 33, 212–222. [Google Scholar] [CrossRef]
- Roe, J.J.; Thompson, C.W.; Aspinall, P.A.; Brewer, M.J.; Duff, E.I.; Miller, D.; Mitchell, R.; Clow, A. Green space and stress: Evidence from cortisol measures in deprived urban communities. Int. J. Environ. Res. Public Health 2013, 10, 4086–4103. [Google Scholar] [CrossRef]

Publisher’s Note: MDPI stays neutral with regard to jurisdictional claims in published maps and institutional affiliations. |
© 2020 by the authors. Licensee MDPI, Basel, Switzerland. This article is an open access article distributed under the terms and conditions of the Creative Commons Attribution (CC BY) license (http://creativecommons.org/licenses/by/4.0/).