
Classification and Prediction on the Effects of Nutritional Intake on Overweight/Obesity, Dyslipidemia, Hypertension and Type 2 Diabetes Mellitus Using Deep Learning Model: 4–7th Korea National Health and Nutrition Examination Survey


Abstract
:1. Introduction
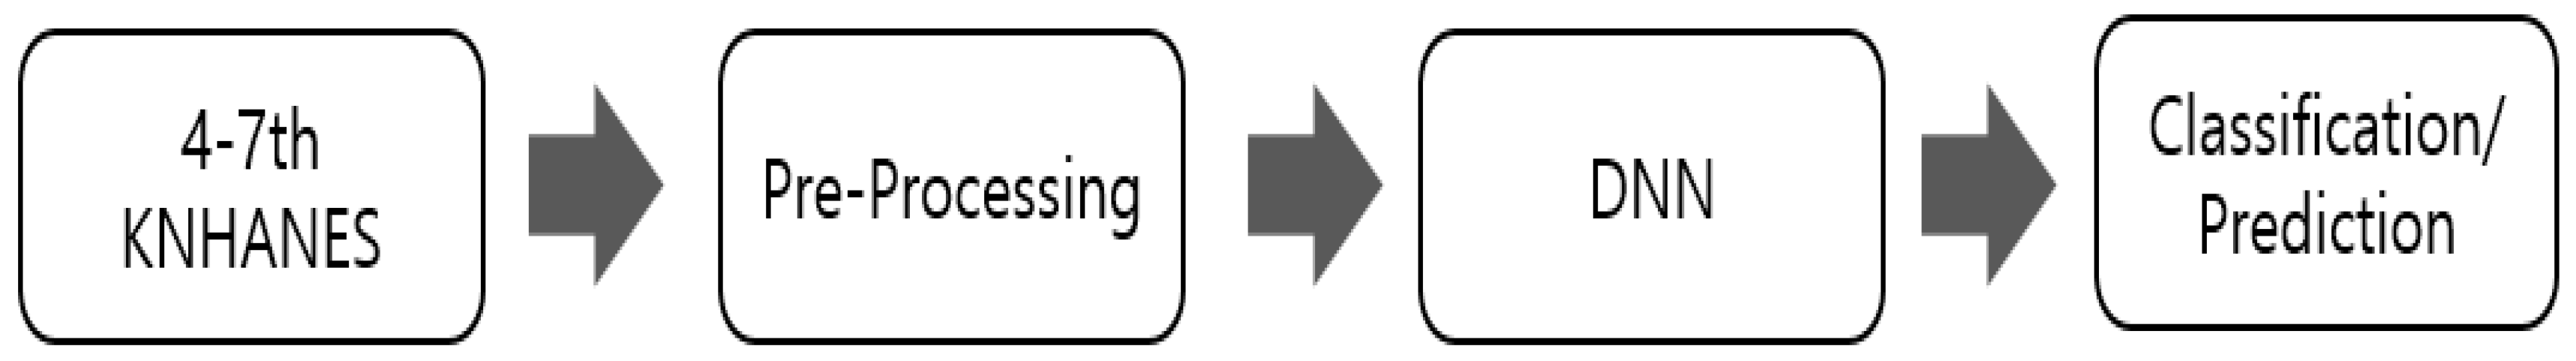
2. Materials and Methods
2.1. Data and Subjects
2.2. Variable Classification
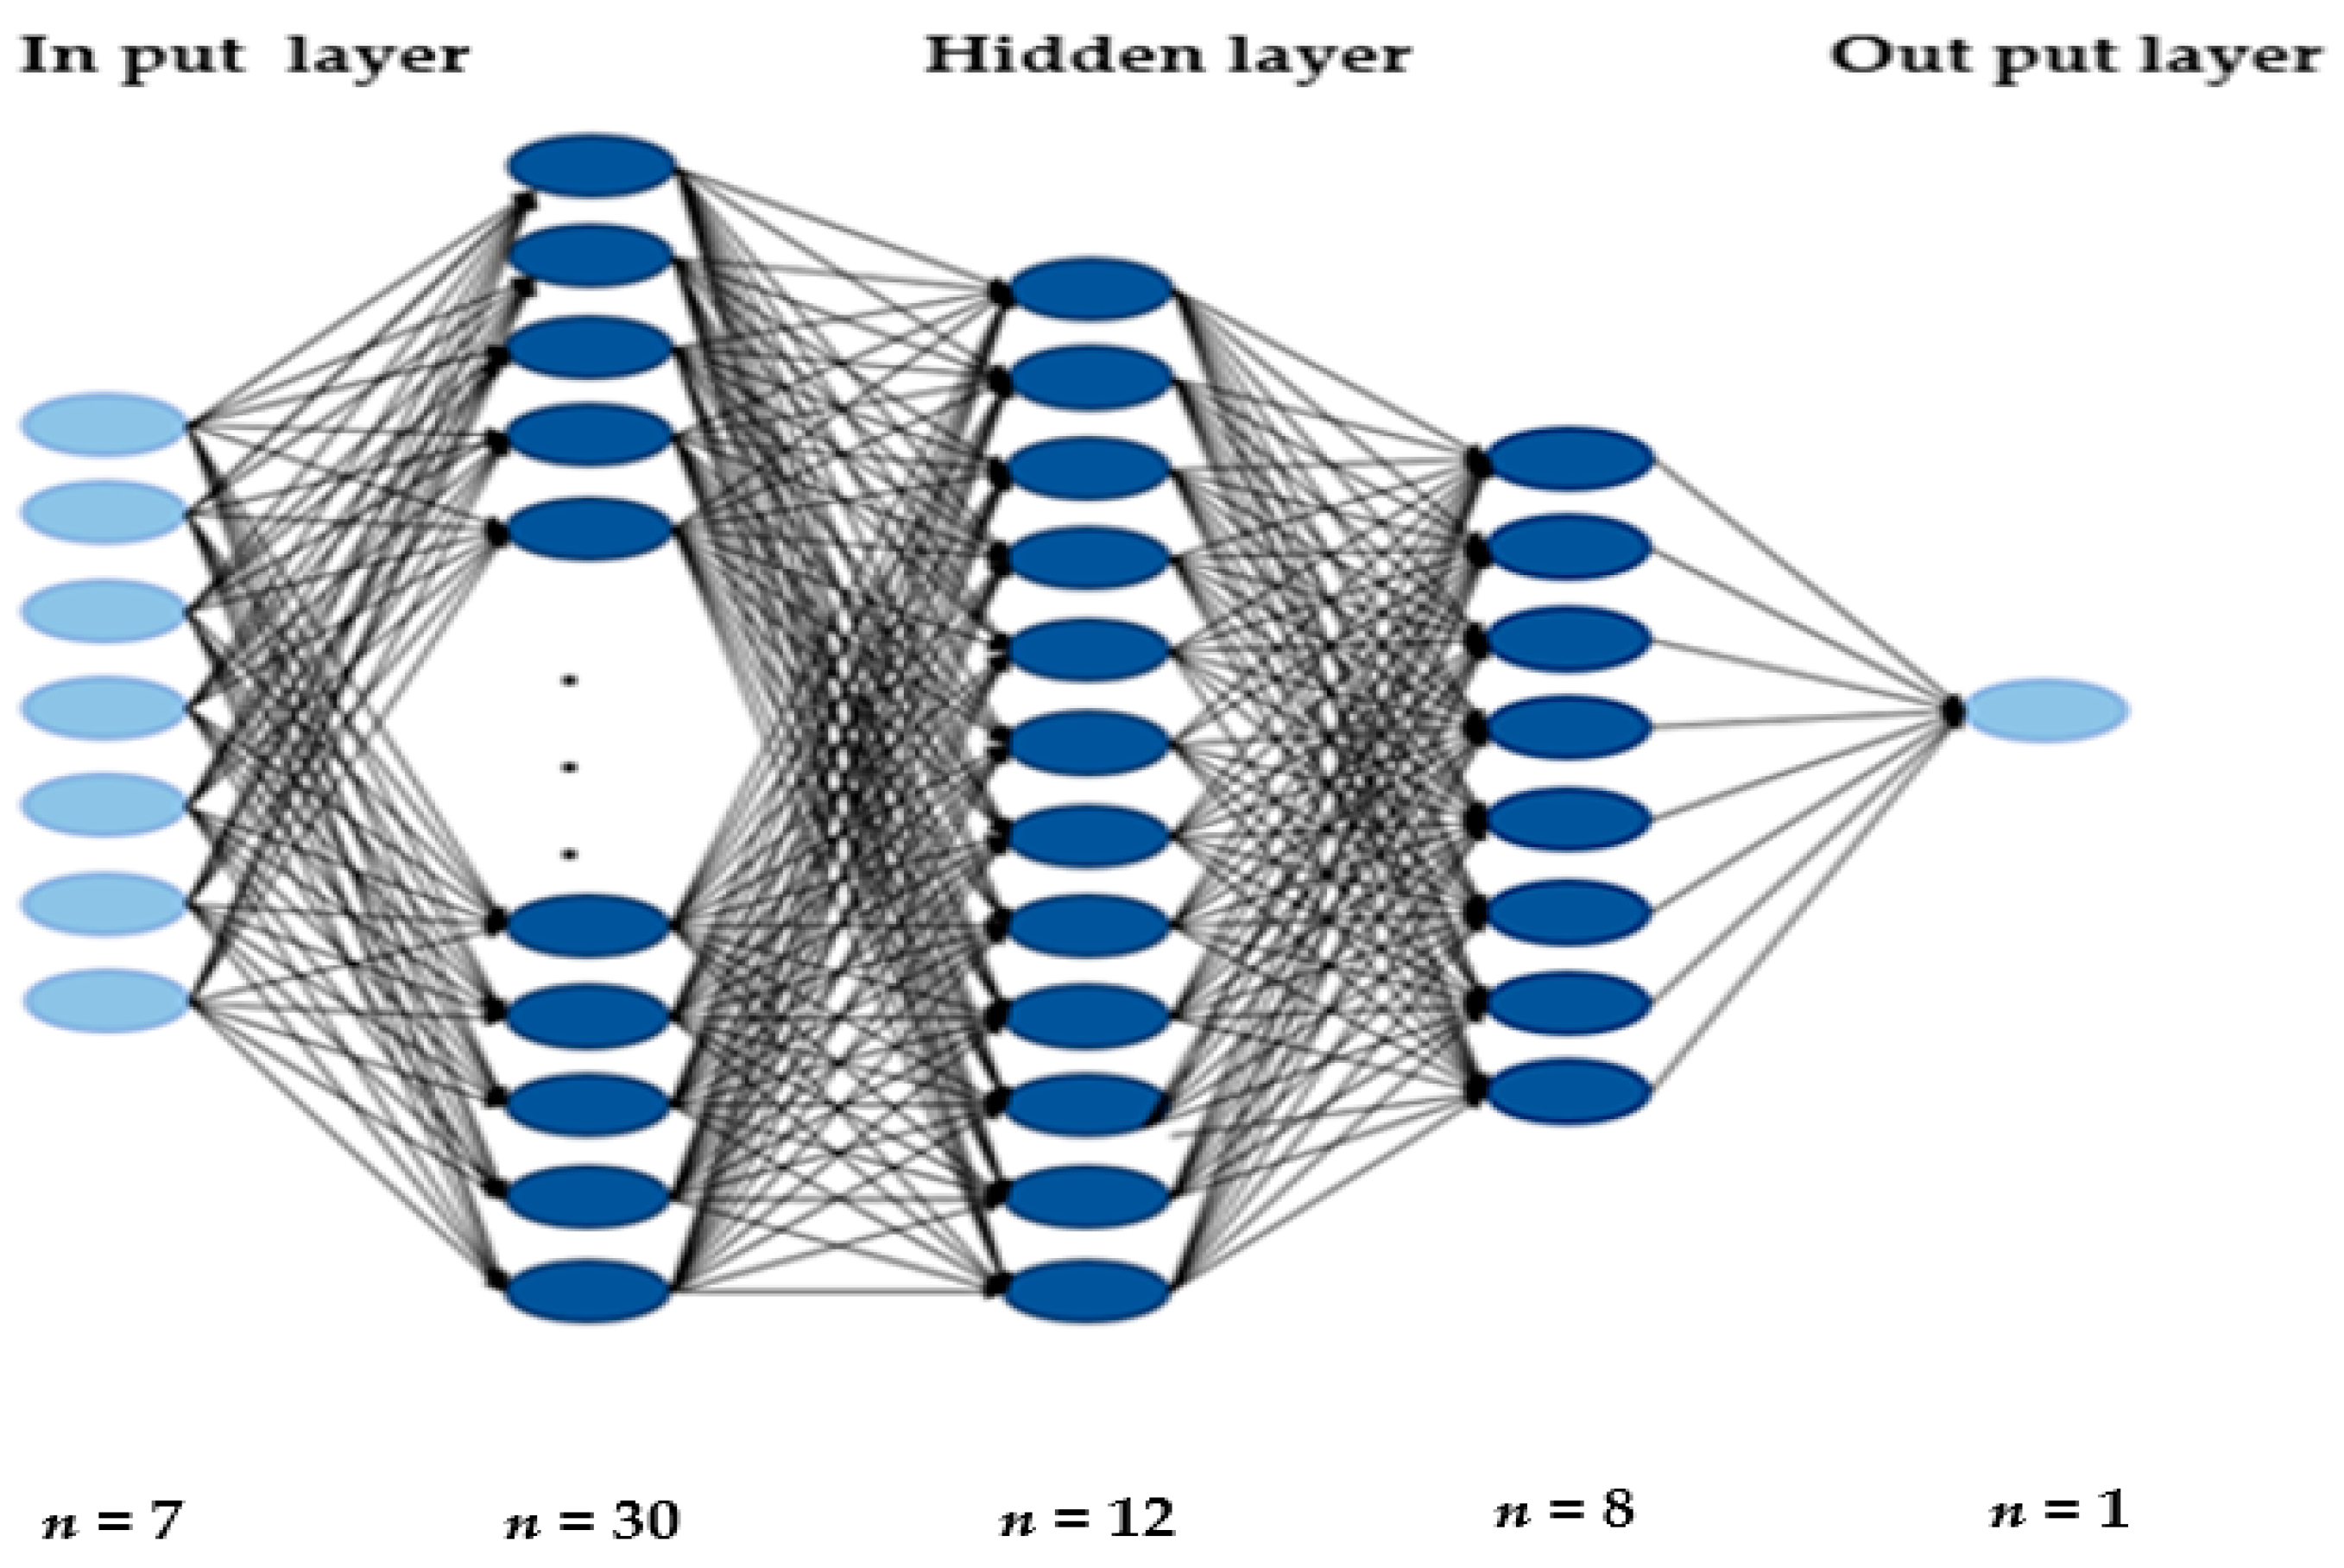
2.3. Deep Learning Performance Evaluation Methods
- (a)
- Confusion matrix
- True Positive (TP) is an outcome where the model correctly predicts the positive class.
- True Negative (TN) is an outcome where the model correctly predicts the negative class.
- False Positive (FP) is an outcome where the model incorrectly predicts the positive class.
- False Negative (FN) is an outcome where the model incorrectly predicts the negative class.
- (b)
- Accuracy formula
2.4. Statistical Analysis
3. Results
3.1. Baseline Characteristics of Datasets by Diagnostic Criteria
3.2. K-Fold Cross-Validation (K = 5)
3.3. Accuracy Comparison between a DNN Model and Other Machine Learning Models
3.4. Wald Test in Logistic Regression
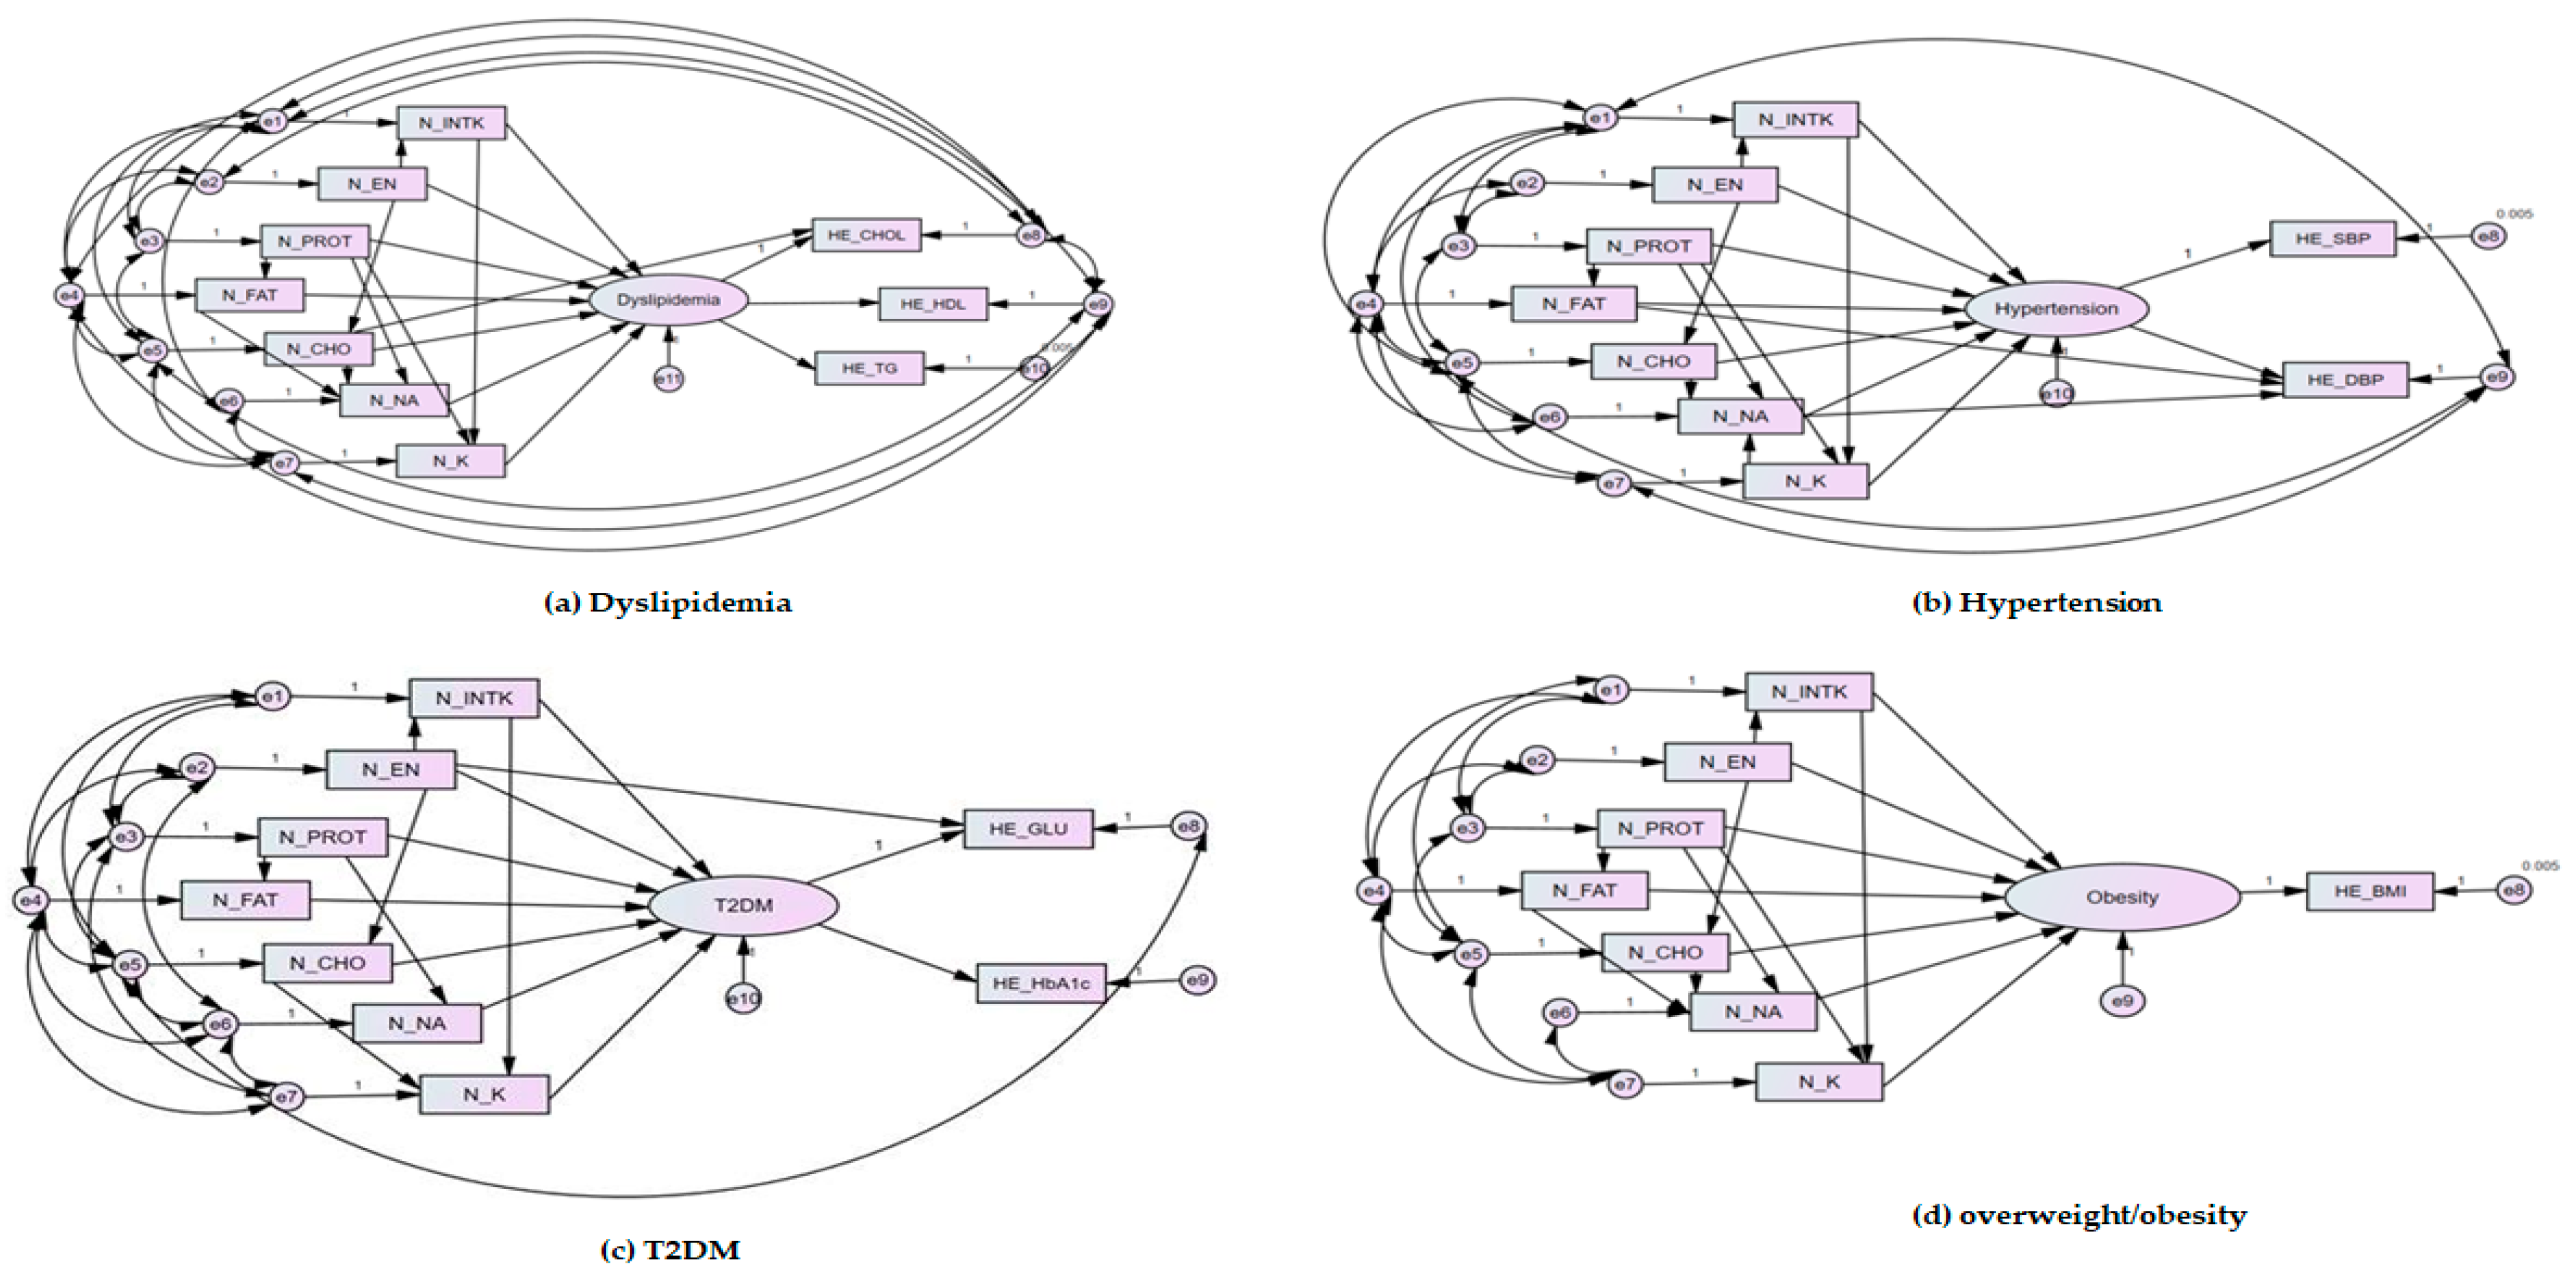
3.5. Evaluation of the Fitted Model of Structural Equation Modelling
4. Discussion
5. Conclusions
Author Contributions
Funding
Institutional Review Board Statement
Informed Consent Statement
Data Availability Statement
Conflicts of Interest
References
- Chooi, Y.C.; Ding, C.; Magkos, F. The epidemiology of obesity. Metab. Clin. Exp. 2019, 92, 6–10. [Google Scholar] [CrossRef] [PubMed] [Green Version]
- The International Diabetes Federation. IDF Diabetes Atlas 9th Edition 2019. Available online: https://diabetesatlas.org/en/ (accessed on 3 December 2020).
- World Health Organization. Cardiovascular Diseases. Available online: https://www.who.int/health-topics/cardiovascular-diseases/#tab=tab_1 (accessed on 3 December 2020).
- Lee, S.-H.; Tao, S.; Kim, H.-S. The Prevalence of Metabolic Syndrome and Its Related Risk Complications among Koreans. Nutrients 2019, 11, 1755. [Google Scholar] [CrossRef] [Green Version]
- Bray, G.A.; Kim, K.K.; Wilding, J.P.H. Obesity: A chronic relapsing progressive disease process. A position statement of the World Obesity Federation. Obes. Rev. 2017, 18, 715–723. [Google Scholar] [CrossRef] [PubMed] [Green Version]
- Blüher, M. Obesity: Global epidemiology and pathogenesis. Nat. Rev. Endocrinol. 2019, 15, 288–298. [Google Scholar] [CrossRef] [PubMed]
- Batsis, J.A.; Sahakyan, K.R.; Rodriguez-Escudero, J.P.; Bartels, S.J.; Lopez-Jimenez, F. Normal weight obesity and functional outcomes in older adults. Eur. J. Intern. Med. 2014, 25, 517–522. [Google Scholar] [CrossRef] [PubMed]
- Hubert, H.B.; Feinleib, M.; McNamara, P.M.; Castelli, W.P. Obesity as an independent risk factor for cardiovascular disease: A 26-year follow-up of participants in the Framingham Heart Study. Circulation 1983, 67, 968–977. [Google Scholar] [CrossRef] [PubMed] [Green Version]
- Menke, A.; Rust, K.F.; Fradkin, J.; Cheng, Y.J.; Cowie, C.C. Associations Between Trends in Race/Ethnicity, Aging, and Body Mass Index with Diabetes Prevalence in the United States: A series of cross-sectional studies. Ann. Intern. Med. 2014, 161, 328–335. [Google Scholar] [CrossRef]
- DeFronzo, R.A.; Ferrannini, E.; Groop, L.; Henry, R.R.; Herman, W.H.; Holst, J.J.; Hu, F.B.; Kahn, C.R.; Raz, I.; Shulman, G.I.; et al. Type 2 diabetes mellitus. Nat. Rev. Dis. Prim. 2015, 1, 15019. [Google Scholar] [CrossRef]
- Wang, J.; Stančáková, A.; Soininen, P.; Kangas, A.J.; Paananen, J.; Kuusisto, J.; Ala-Korpela, M.; Laakso, M. Lipoprotein subclass profiles in individuals with varying degrees of glucose tolerance: A population-based study of 9399 Finnish men. J. Intern. Med. 2012, 272, 562–572. [Google Scholar] [CrossRef]
- Chait, A.; Ginsberg, H.N.; Vaisar, T.; Heinecke, J.W.; Goldberg, I.J.; Bornfeldt, K.E. Remnants of the Triglyceride-Rich Lipoproteins, Diabetes, and Cardiovascular Disease. Diabetes 2020, 69, 508–516. [Google Scholar] [CrossRef] [PubMed]
- Mazzone, T.; Chait, A.; Plutzky, J. Cardiovascular disease risk in type 2 diabetes mellitus: Insights from mechanistic studies. Lancet (Lond. Engl.) 2008, 371, 1800–1809. [Google Scholar] [CrossRef] [Green Version]
- Go, A.S.; Mozaffarian, D.; Roger, V.L.; Benjamin, E.J.; Berry, J.D.; Borden, W.B.; Bravata, D.M.; Dai, S.; Ford, E.S.; Fox, C.S.; et al. Executive Summary: Heart Disease and Stroke Statistics—2013 Update: A report from the American Heart Association. Circulation 2013, 127, 143–152. [Google Scholar] [CrossRef]
- Mozaffarian, D.; Benjamin, E.J.; Go, A.S.; Arnett, D.K.; Blaha, M.J.; Cushman, M.; Das, S.R.; de Ferranti, S.; Després, J.P.; Fullerton, H.J.; et al. Heart Disease and Stroke Statistics-2016 Update: A Report From the American Heart Association. Circulation 2016, 133, e38–e360. [Google Scholar] [CrossRef]
- Yatsuya, H.; Folsom, A.R.; Yamagishi, K.; North, K.E.; Brancati, F.L.; Stevens, J. Race- and Sex-Specific Associations of Obesity Measures with Ischemic Stroke Incidence in the Atherosclerosis Risk in Communities (ARIC) Study. Stroke 2010, 41, 417–425. [Google Scholar] [CrossRef] [Green Version]
- Mackay, J.M.G. Atlas of Heart Disease and Stroke; WHO: Geneva, Switzerland, 2004. [Google Scholar]
- Fox, C.S.; Golden, S.H.; Anderson, C.A.M.; Bray, G.A.; Burke, L.E.; De Boer, I.H.; Deedwania, P.C.; Eckel, R.H.; Ershow, A.G.; Fradkin, J.; et al. Update on Prevention of Cardiovascular Disease in Adults with Type 2 Diabetes Mellitus in Light of Recent Evidence: A Scientific Statement from the American Heart Association and the American Diabetes Association. Diabetes Care 2015, 38, 1777–1803. [Google Scholar] [CrossRef] [PubMed] [Green Version]
- Kweon, S.; Kim, Y.; Jang, M.-J.; Kim, Y.; Kim, K.; Choi, S.; Chun, C.; Khang, Y.-H.; Oh, K. Data resource profile: The Korea National Health and Nutrition Examination Survey (KNHANES). Int. J. Epidemiol. 2014, 43, 69–77. [Google Scholar] [CrossRef] [PubMed] [Green Version]
- Agency, K.D.C.a.P. Findings from Korea National Health and Nutrition Examination Survey. Available online: https://knhanes.cdc.go.kr/knhanes/sub01/sub01_05.do#s5_02 (accessed on 6 January 2021).
- Park, K.; Lim, S.; Park, Y.; Ju, W.; Shin, Y.; Yeom, H. Cardiovascular Disease Risk Factors and Obesity Levels in Korean Adults: Results from the Korea National Health and Nutrition Examination Survey, 2007–2015. Osong Public Health Res. Perspect. 2018, 9, 150–159. [Google Scholar] [CrossRef]
- Huang, L.; Trieu, K.; Yoshimura, S.; Neal, B.; Woodward, M.; Campbell, N.R.C.; Li, Q.; Lackland, D.T.; Leung, A.A.; Anderson, C.A.M.; et al. Effect of dose and duration of reduction in dietary sodium on blood pressure levels: Systematic review and meta-analysis of randomised trials. BMJ (Clin. Res. Ed.) 2020, 368, m315. [Google Scholar] [CrossRef] [PubMed] [Green Version]
- Filippini, T.; Naska, A.; Kasdagli, M.; Torres, D.; Lopes, C.; Carvalho, C.; Moreira, P.; Malavolti, M.; Orsini, N.; Whelton, P.K.; et al. Potassium Intake and Blood Pressure: A Dose-Response Meta-Analysis of Randomized Controlled Trials. J. Am. Heart Assoc. 2020, 9, e015719. [Google Scholar] [CrossRef] [PubMed]
- Graudal, N.; Hubeck-Graudal, T.; Jürgens, G.; McCarron, D.A. The Significance of Duration and Amount of Sodium Reduction Intervention in Normotensive and Hypertensive Individuals: A Meta-Analysis. Adv. Nutr. 2015, 6, 169–177. [Google Scholar] [CrossRef] [PubMed]
- Graudal, N.A.; Hubeck-Graudal, T.; Jurgens, G. Effects of low sodium diet versus high sodium diet on blood pressure, renin, aldosterone, catecholamines, cholesterol, and triglyceride. Cochrane Database Syst. Rev. 2020, 12, CD004022. [Google Scholar] [CrossRef] [PubMed]
- Hall, K.D.; Guo, J. Obesity Energetics: Body Weight Regulation and the Effects of Diet Composition. Gastroenterology 2017, 152, 1718–1727.e3. [Google Scholar] [CrossRef] [Green Version]
- Aburto, N.J.; Hanson, S.; Gutierrez, H.; Hooper, L.; Elliott, P.; Cappuccio, F.P. Effect of increased potassium intake on cardiovascular risk factors and disease: Systematic review and meta-analyses. BMJ (Clin. Res. Ed.) 2013, 346, f1378. [Google Scholar] [CrossRef] [Green Version]
- Shah, M.; Adams-Huet, B.; Bantle, J.P.; Henry, R.R.; Griver, K.A.; Raatz, S.K.; Brinkley, L.J.; Reaven, G.M.; Garg, A. Effect of a High-Carbohydrate Versus a High--cis-Monounsaturated Fat Diet on Blood Pressure in Patients With Type 2 Diabetes. Diabetes Care 2005, 28, 2607–2612. [Google Scholar] [CrossRef] [PubMed] [Green Version]
- Montori, V.M.; Farmer, A.; Wollan, P.C.; Dinneen, S.F. Fish oil supplementation in type 2 diabetes: A quantitative systematic review. Diabetes Care 2000, 23, 1407–1415. [Google Scholar] [CrossRef] [PubMed] [Green Version]
- Lichtenstein, A.H. Nutrients and cardiovascular disease: No easy answers. Curr. Opin. Lipidol. 2005, 16, 1–3. [Google Scholar] [CrossRef]
- Guttag, J.V. Introduction to Computation and Programming Using Python: With Application to Understanding Data, 2nd ed.; MIT Press: Cambridge, MA, USA, 2017. [Google Scholar]
- Chollet, F. Deep Learning with Python; Manning Publications Company: Shelter Island, NY, USA, 2017. [Google Scholar]
- Dinh, A.; Miertschin, S.; Young, A.; Mohanty, S.D. A data-driven approach to predicting diabetes and cardiovascular disease with machine learning. BMC Med. Inform. Decis. Mak. 2019, 19, 1–15. [Google Scholar] [CrossRef] [Green Version]
- Charniak, E. Introduction to Deep Learning; The MIT Press: Cambridge, MA, USA, 2019. [Google Scholar]
- Valavanis, I.K.; Mougiakakou, S.G.; Grimaldi, K.A.; Nikita, K.S. A multifactorial analysis of obesity as CVD risk factor: Use of neural network based methods in a nutrigenetics context. BMC Bioinform. 2010, 11, 453. [Google Scholar] [CrossRef] [Green Version]
- Panaretos, D.; Koloverou, E.; Dimopoulos, A.C.; Kouli, G.-M.; Vamvakari, M.; Tzavelas, G.; Pitsavos, C.; Panagiotakos, D.B. A comparison of statistical and machine-learning techniques in evaluating the association between dietary patterns and 10-year cardiometabolic risk (2002–2012): The ATTICA study. Br. J. Nutr. 2018, 120, 326–334. [Google Scholar] [CrossRef] [Green Version]
- Rigdon, J.; Basu, S. Machine learning with sparse nutrition data to improve cardiovascular mortality risk prediction in the USA using nationally randomly sampled data. BMJ Open 2019, 9, e032703. [Google Scholar] [CrossRef]
- Shang, X.; Li, Y.; Xu, H.; Zhang, Q.; Liu, A.; Du, S.; Guo, H.; Ma, G. Leading dietary determinants identified using machine learning techniques and a healthy diet score for changes in cardiometabolic risk factors in children: A longitudinal analysis. Nutr. J. 2020, 19, 1–16. [Google Scholar] [CrossRef] [PubMed]
- Lee, T.; Kim, J.; Uh, Y.; Lee, H. Deep neural network for estimating low density lipoprotein cholesterol. Clin. Chim. Acta 2019, 489, 35–40. [Google Scholar] [CrossRef] [PubMed]
- Faruqui, S.H.A.; Du, Y.; Meka, R.; Alaeddini, A.; Li, C.; Shirinkam, S.; Wang, J. Development of a Deep Learning Model for Dynamic Forecasting of Blood Glucose Level for Type 2 Diabetes Mellitus: Secondary Analysis of a Randomized Controlled Trial. JMIR mHealth uHealth 2019, 7, e14452. [Google Scholar] [CrossRef] [PubMed]
- Choe, E.K.; Rhee, H.; Lee, S.; Shin, E.; Oh, S.-W.; Lee, J.-E.; Choi, S.H. Metabolic Syndrome Prediction Using Machine Learning Models with Genetic and Clinical Information from a Nonobese Healthy Population. Genom. Inform. 2018, 16, e31. [Google Scholar] [CrossRef] [PubMed] [Green Version]
- Zeng, J.; Zhang, J.; Li, Z.; Li, T.; Li, G. Prediction model of artificial neural network for the risk of hyperuricemia incorporating dietary risk factors in a Chinese adult study. Food Nutr. Res. 2020, 64, 3712. [Google Scholar] [CrossRef] [PubMed] [Green Version]
- Yun, S.H.; Shim, J.-S.; Kweon, S.; Oh, K. Development of a Food Frequency Questionnaire for the Korea National Health and Nutrition Examination Survey: Data from the Fourth Korea National Health and Nutrition Examination Survey (KNHANES IV). Korean J. Nutr. 2013, 46, 186–196. [Google Scholar] [CrossRef] [Green Version]
- Agency, K.D.C.a.P. Survey Contents. Available online: https://knhanes.cdc.go.kr/knhanes/sub02/sub02_03.do#s8_04 (accessed on 1 December 2020).
- White, I.R.; Carlin, J.B. Bias and efficiency of multiple imputation compared with complete-case analysis for missing covariate values. Stat. Med. 2010, 29, 2920–2931. [Google Scholar] [CrossRef]
- Barjhoux, P.J.; Diouane, Y.; Grihon, S.; Bettebghor, D.; Morlier, J. A bi-level methodology for solving large-scale mixed categorical structural optimization. Struct. Multidiscip. Optim. 2020, 62, 337–351. [Google Scholar] [CrossRef]
- Seo, M.H.; Lee, W.-Y.; Kim, S.S.; Kang, J.-H.; Kang, J.-H.; Kim, K.K.; Kim, B.-Y.; Kim, Y.-H.; Kim, W.-J.; Kim, E.M.; et al. 2018 Korean Society for the Study of Obesity Guideline for the Management of Obesity in Korea. J. Obes. Metab. Syndr. 2019, 28, 40–45. [Google Scholar] [CrossRef]
- Lee, H.-Y.; Shin, J.; Kim, G.-H.; Park, S.; Ihm, S.-H.; Kim, H.C.; Kim, K.-I.; Kim, J.H.; Lee, J.H.; Park, J.-M.; et al. 2018 Korean Society of Hypertension Guidelines for the management of hypertension: Part II-diagnosis and treatment of hypertension. Clin. Hypertens. 2019, 25, 1–24. [Google Scholar] [CrossRef]
- Kim, M.K.; Ko, S.H.; Kim, B.Y.; Kang, E.S.; Noh, J.; Kim, S.K.; Park, S.O.; Hur, K.Y.; Chon, S.; Moon, M.K.; et al. 2019 Clinical Practice Guidelines for Type 2 Diabetes Mellitus in Korea. Diabetes Metab. J. 2019, 43, 398–406. [Google Scholar] [CrossRef]
- Rhee, E.-J.; Kim, H.C.; Kim, J.H.; Lee, E.Y.; Kim, B.J.; Kim, E.M.; Song, Y.; Lim, J.H.; Kim, H.J.; Choi, S.; et al. 2018 Guidelines for the management of dyslipidemia. Korean J. Intern. Med. 2019, 34, 723–771. [Google Scholar] [CrossRef] [PubMed] [Green Version]
- Koutsoukas, A.; Monaghan, K.J.; Li, X.; Huan, J. Deep-learning: Investigating deep neural networks hyper-parameters and comparison of performance to shallow methods for modeling bioactivity data. J. Cheminform. 2017, 9, 1–13. [Google Scholar] [CrossRef] [PubMed]
- Beran, T.N.; Violato, C. Structural equation modeling in medical research: A primer. BMC Res. Notes 2010, 3, 267. [Google Scholar] [CrossRef] [PubMed] [Green Version]
- Wagenmakers, E.-J. A practical solution to the pervasive problems of p values. Psychon. Bull. Rev. 2007, 14, 779–804. [Google Scholar] [CrossRef] [PubMed] [Green Version]
- Mazidi, M.; Pennathur, S.; Afshinnia, F. Link of dietary patterns with metabolic syndrome: Analysis of the National Health and Nutrition Examination Survey. Nutr. Diabetes 2017, 7, e255. [Google Scholar] [CrossRef]
- Iwasaki, Y.; Arisawa, K.; Katsuura-Kamano, S.; Uemura, H.; Tsukamoto, M.; Kadomatsu, Y.; Okada, R.; Hishida, A.; Tanaka, K.; Hara, M.; et al. Associations of Nutrient Patterns with the Prevalence of Metabolic Syndrome: Results from the Baseline Data of the Japan Multi-Institutional Collaborative Cohort Study. Nutrients 2019, 11, 990. [Google Scholar] [CrossRef] [PubMed] [Green Version]
- Woo, H.D.; Shin, A.; Kim, J. Dietary Patterns of Korean Adults and the Prevalence of Metabolic Syndrome: A Cross-Sectional Study. PLoS ONE 2014, 9, e111593. [Google Scholar] [CrossRef]
- Boulangé, C.L.; Neves, A.L.; Chilloux, J.; Nicholson, J.K.; Dumas, M.-E. Impact of the gut microbiota on inflammation, obesity, and metabolic disease. Genome Med. 2016, 8, 1–12. [Google Scholar] [CrossRef] [PubMed] [Green Version]
- Karlsson, T.; Rask-Andersen, M.; Pan, G.; Höglund, J.; Wadelius, C.; Ek, W.E.; Johansson, Å. Contribution of genetics to visceral adiposity and its relation to cardiovascular and metabolic disease. Nat. Med. 2019, 25, 1390–1395. [Google Scholar] [CrossRef] [PubMed]
- Popa, S.; Moţa, M.; Moţa, E.; Serafinceanu, C.; Guja, C.; Catrinoiu, D.; Hancu, N.; Lichiardopol, R.; Bala, C.; Popa, A.; et al. Prevalence of overweight/obesity, abdominal obesity and metabolic syndrome and atypical cardiometabolic phenotypes in the adult Romanian population: PREDATORR study. J. Endocrinol. Investig. 2016, 39, 1045–1053. [Google Scholar] [CrossRef] [PubMed]
- Costantino, S.; Paneni, F.; Cosentino, F. Ageing, metabolism and cardiovascular disease. J. Physiol. 2016, 594, 2061–2073. [Google Scholar] [CrossRef] [PubMed]


| Independent Variables | |
|---|---|
| Abbreviations | Full Names |
| N_INTK | Food intake (g) |
| N_EN | Energy intake (Kcal) |
| N_PROT | Protein intake (g) |
| N_FAT | Fat intake (g) |
| N_CHO | Carbohydrate intake (g) |
| N_NA | Sodium intake (mg) |
| N_K | Potassium intake (mg) |
| Dependent Variables | |||
|---|---|---|---|
| Abbreviations | Full Names | Diagnosis | Diagnostic Criteria |
| HE_sbp | Systolic blood pressure (Mean value of 2–3 BP measurements) | ≥80 mmHg | Hypertension |
| HE_dbp | Diastolic blood pressure (Mean value of 2–3 BP measurements) | ≥140 mmHg | |
| HE_BMI | Body mass index | ≥23 kg/m2 | Overweight/obesity |
| HE_glu | Fasting blood glucose | ≥126 mg/dL (7.0 mmol/L) | T2DM |
| HE_HbA1c | Glycated hemoglobin | ≥6.5% | |
| HE_chol | Total cholesterol | ≥240 mg/dL | Dyslipidemia |
| HE_HDL_st2 | Calibration of high-density lipoprotein cholesterol | <40 mg/dL | |
| HE_TG | Triglyceride | ≥200 mg/dL | |
| Predicted Class | |||
|---|---|---|---|
| Positive | Negative | ||
| Actual class | Positive | TP | FN |
| Negative | FP | TN | |
| Dyslipidemia Dataset | Hypertension Dataset | T2DM Dataset | Overweight/Obesity Dataset | ||||||||||||||
|---|---|---|---|---|---|---|---|---|---|---|---|---|---|---|---|---|---|
| Training Dataset | Testing Dataset | Training Dataset | Testing Dataset | Training Dataset | Testing Dataset | Training Dataset | Testing Dataset | ||||||||||
| Total number | 10,731 | 10,991 | 3889 | 10,980 | |||||||||||||
| Age (yr) | 40–50 | 3376 | 844 | 3436 | 860 | 1004 | 251 | 3431 | 858 | ||||||||
| 51–60 | 2804 | 702 | 2868 | 718 | 1091 | 273 | 2867 | 717 | |||||||||
| 61–69 | 2404 | 601 | 2487 | 622 | 1016 | 254 | 2485 | 622 | |||||||||
| Gender | Male | 3523 | 881 | 3608 | 902 | 1374 | 344 | 3601 | 901 | ||||||||
| Female | 5061 | 1266 | 5184 | 1297 | 1736 | 435 | 5182 | 1296 | |||||||||
| Nutrition | N_INTK | 1408.12 (905.87–1736.19) | 1393.82 (888.89–1734.68) | 1401.18 (901.75–1728.11) | 1393.78 (880.41–1733.28) | 1517.06 (966.93–1878.52) | 1521.52 (1009.11–1898.02) | 1400.03 (903.68–1728.97) | 1403.96 (874.05–1743.19) | ||||||||
| N_EN | 1871.35 (1353.14–2232.98) | 1861.38 (1330.12–2246.35) | 1865.20 (1344.48–2228.89) | 1862.07 (1343.46–2240.20) | 1916.55 (1352.02–2302.21) | 1928.98 (1345.41–2326.51) | 1863.99 (1346.98–2229.44) | 1871.48 (1337.82–2249.78) | |||||||||
| N_PROT | 65.91 (42.93–81.01) | 65.74 (41.80–82.08) | 65.79 (42.55–81.24) | 65.07 (42.49–80.52) | 68.23 (43.58–84.02) | 68.61 (44.77–85.80) | 65.65 (42.70–80.79) | 65.87 (42.11–81.96) | |||||||||
| N_FAT | 33.97 (16.32–43.12) | 33.44 (15.82–44.36) | 33.75 (16.06–43.32) | 33.41 (16.09–42.50) | 38.22 (19.45–48.17) | 39.90 (19.445–51.32) | 33.73 (16.14–49.32) | 33.60 (15.89–42.82) | |||||||||
| N_CHO | 308.87 (228.71–371.44) | 306.66 (222.05–370.35) | 307.98 (227.32–370.88) | 307.78 (226.78–370.31) | 299.82 (215.42–362.88) | 300.67 (218.14–358.39) | 307.78 (227.34–370.57) | 309.33 (226.97–369.69) | |||||||||
| N_NA | 4467.38 (2518.68–5678.46) | 4435.47 (2480.86–5644.35) | 4460.92 (2495.87–5661.77) | 4423.25 (2526.00–5651.50) | 3745.26 (2117.68–4753.61) | 3787.99 (2122.55–4659.50) | 4446.75 (2504.61–5650.57) | 4490.53 (2512.68–5733.19) | |||||||||
| N_K | 3017.37 (2007.16–3722.56) | 2982.82 (1941.35–3705.11) | 3009.58 (1989.25–3721.10) | 2975.15 (1980.56–3657.30) | 2940.81 (1636.24–3636.82) | 2956.82 (2049.80–3594.30) | 3008.45 (1997.65–3711.75) | 2984.71 (1947.75–3685.11) | |||||||||
| Disease No = 0 Yes = 1 | 0 | 6294 | 8788 | 3143 | 4118 | ||||||||||||
| 1 | 4437 | 2203 | 746 | 6862 | |||||||||||||
| Dataset by diagnostic criteria | HE_CHOL | 193.84 (169–217) | 194.38 (169–218) | HE_SBP | 120.36 (108–131) | 120.48 (108–131) | HE_GLU | 113.78 (93.0–124.0) | 114.17 (93–125) | HE_BMI | 24.12 (21.99–25.99) | 24.10 (21.88–26.03) | |||||
| HE_ HDL | 48.42 (39.95–55.0) | 48.07 (39.95–54.0) | HE_DBP | 77.99 (71.0–84.0) | 78.22 (70.0–85.0) | HE_HbA1c | 6.17 (5.4–6.5) | 6.16 (5.4–6.5) | |||||||||
| HE_TG | 143.47 (79.0–171.0) | 147.60 (80.0–172.5) | |||||||||||||||
| DNN | Logistic Regression | Decision Tree | |
|---|---|---|---|
| Dyslipidemia | 0.58654 | 0.58448 | 0.52148 |
| Hypertension | 0.79958 | 0.79929 | 0.66773 |
| T2DM | 0.80896 | 0.80818 | 0.71587 |
| Overweight/obesity | 0.62496 | 0.62486 | 0.54026 |
| Diagnostic Criteria | Model | CMIN | CMIN/DF | NFI | CFI | TLI | IFI | GFI | RMSEA |
|---|---|---|---|---|---|---|---|---|---|
| Dyslipidemia | Research Model | 15.022 (p = 0.059) | 1.878 | 1.000 | 1.000 | 0.999 | 1.000 | 1.000 | 0.009 |
| Hypertension | 5.829 (p = 0.212) | 1.457 | 1.000 | 1.000 | 1.000 | 1.000 | 1.000 | 0.006 | |
| T2DM | 7.300 (p = 0.294) | 1.217 | 1.000 | 1.000 | 1.000 | 1.000 | 1.000 | 0.007 | |
| Overweight/Obesity | 7.444 (p = 0.059) | 2.481 | 1.000 | 1.000 | 0.999 | 1.000 | 1.000 | 0.012 | |
| Acceptance Model Criteria | p > 0.05 | ≤3 | ≥0.9 | ≥0.9 | ≥0.9 | ≥0.9 | ≥0.9 | ≤0.08 | |
| Diagnostic Criteria | Dyslipidemia | Hypertension | ||||||||||||
| Path | N_EN | N_PROT | N_FAT | N_CHO | N_NA | N_K | N_INTK | N_EN | N_PROT | N_FAT | N_CHO | N_NA | N_K | N_INTK |
| B | 4.071 | −0.729 | −1.342 | −2.237 | 0.685 | −0.133 | −0.328 | 6.593 | −0.729 | −1.342 | −2.237 | 0.685 | −0.133 | −1.837 |
| β | 0.428 | −0.077 | −0.141 | −0.234 | 0.072 | −0.014 | −0.034 | 0.385 | −0.077 | −0.141 | −0.234 | 0.072 | −0.014 | −0.170 |
| S.E. | 0.351 | 0.196 | 0.171 | 0.227 | 0.116 | 0.171 | 0.171 | 0.570 | 0.196 | 0.171 | 0.227 | 0.116 | 0.171 | 0.306 |
| Coefficient | 0.037 | 0.042 | 0.036 | 0.046 | 0.025 | 0.037 | 0.070 | 0.047 | 0.042 | 0.036 | 0.046 | 0.025 | 0.037 | 0.078 |
| C.R. | 11.586 | −3.727 | −7.833 | −9.868 | 5.898 | −0.779 | −1.916 | 11.563 | −3.727 | −7.833 | −9.868 | 5.898 | −0.779 | −6.014 |
| Waldtest | 0.105 | 0.214 | 0.210 | 0.202 | 0.215 | 0.216 | 0.409 | 0.082 | 0.214 | 0.210 | 0.202 | 0.215 | 0.216 | 0.254 |
| p | *** | *** | *** | *** | *** | 0.436 | 0.055 | *** | *** | *** | *** | *** | 0.436 | *** |
| Diagnostic Criteria | T2DM | Overweight/Obesity | ||||||||||||
| Path | N_EN | N_PROT | N_FAT | N_CHO | N_NA | N_K | N_INTK | N_EN | N_PROT | N_FAT | N_CHO | N_NA | N_K | N_INTK |
| B | 5.084 | −2.987 | −6.107 | −1.369 | 7.416 | 5.895 | −9.175 | 0.422 | −0.088 | −0.102 | −0.173 | 0.136 | −0.034 | −0.073 |
| β | 0.152 | −0.089 | −0.182 | −0.041 | 0.221 | 0.176 | −0.274 | 0.135 | −0.028 | −0.033 | −0.055 | 0.044 | −0.011 | −0.023 |
| S.E. | 1.912 | 1.183 | 1.005 | 1.261 | 0.723 | 1.033 | 0.997 | 0.105 | 0.064 | 0.054 | 0.070 | 0.037 | 0.056 | 0.056 |
| Coefficient | 0.097 | −0.2848 | 0.088 | 0.098 | 0.052 | 0.079 | 0.153 | 0.020 | 0.075 | 0.037 | 0.049 | 0.027 | 0.038 | 0.038 |
| C.R. | 2.659 | −2.524 | −6.077 | −1.085 | 10.258 | 5.709 | −9.205 | 4.017 | −1.38 | −1.891 | −2.487 | 3.655 | −0.607 | 1.295 |
| Waldtest | 0.05 | −0.24 | 0.087 | 0.077 | 0.071 | 0.076 | 0.153 | 0.190 | 1.171 | 0.685 | 0.7 | 0.729 | 0.678 | 0.678 |
| p | 0.008 | 0.012 | *** | 0.278 | *** | *** | *** | *** | 0.167 | 0.059 | 0.013 | *** | 0.544 | 0.195 |
Publisher’s Note: MDPI stays neutral with regard to jurisdictional claims in published maps and institutional affiliations. |
© 2021 by the authors. Licensee MDPI, Basel, Switzerland. This article is an open access article distributed under the terms and conditions of the Creative Commons Attribution (CC BY) license (https://creativecommons.org/licenses/by/4.0/).
Share and Cite
Kim, H.; Lim, D.H.; Kim, Y. Classification and Prediction on the Effects of Nutritional Intake on Overweight/Obesity, Dyslipidemia, Hypertension and Type 2 Diabetes Mellitus Using Deep Learning Model: 4–7th Korea National Health and Nutrition Examination Survey. Int. J. Environ. Res. Public Health 2021, 18, 5597. https://doi.org/10.3390/ijerph18115597
Kim H, Lim DH, Kim Y. Classification and Prediction on the Effects of Nutritional Intake on Overweight/Obesity, Dyslipidemia, Hypertension and Type 2 Diabetes Mellitus Using Deep Learning Model: 4–7th Korea National Health and Nutrition Examination Survey. International Journal of Environmental Research and Public Health. 2021; 18(11):5597. https://doi.org/10.3390/ijerph18115597
Chicago/Turabian StyleKim, Hyerim, Dong Hoon Lim, and Yoona Kim. 2021. "Classification and Prediction on the Effects of Nutritional Intake on Overweight/Obesity, Dyslipidemia, Hypertension and Type 2 Diabetes Mellitus Using Deep Learning Model: 4–7th Korea National Health and Nutrition Examination Survey" International Journal of Environmental Research and Public Health 18, no. 11: 5597. https://doi.org/10.3390/ijerph18115597
APA StyleKim, H., Lim, D. H., & Kim, Y. (2021). Classification and Prediction on the Effects of Nutritional Intake on Overweight/Obesity, Dyslipidemia, Hypertension and Type 2 Diabetes Mellitus Using Deep Learning Model: 4–7th Korea National Health and Nutrition Examination Survey. International Journal of Environmental Research and Public Health, 18(11), 5597. https://doi.org/10.3390/ijerph18115597