
Association between Maternal Origin, Pre-Pregnancy Body Mass Index and Caesarean Section: A Nation-Wide Registry Study


Abstract
:1. Introduction
2. Materials and Methods
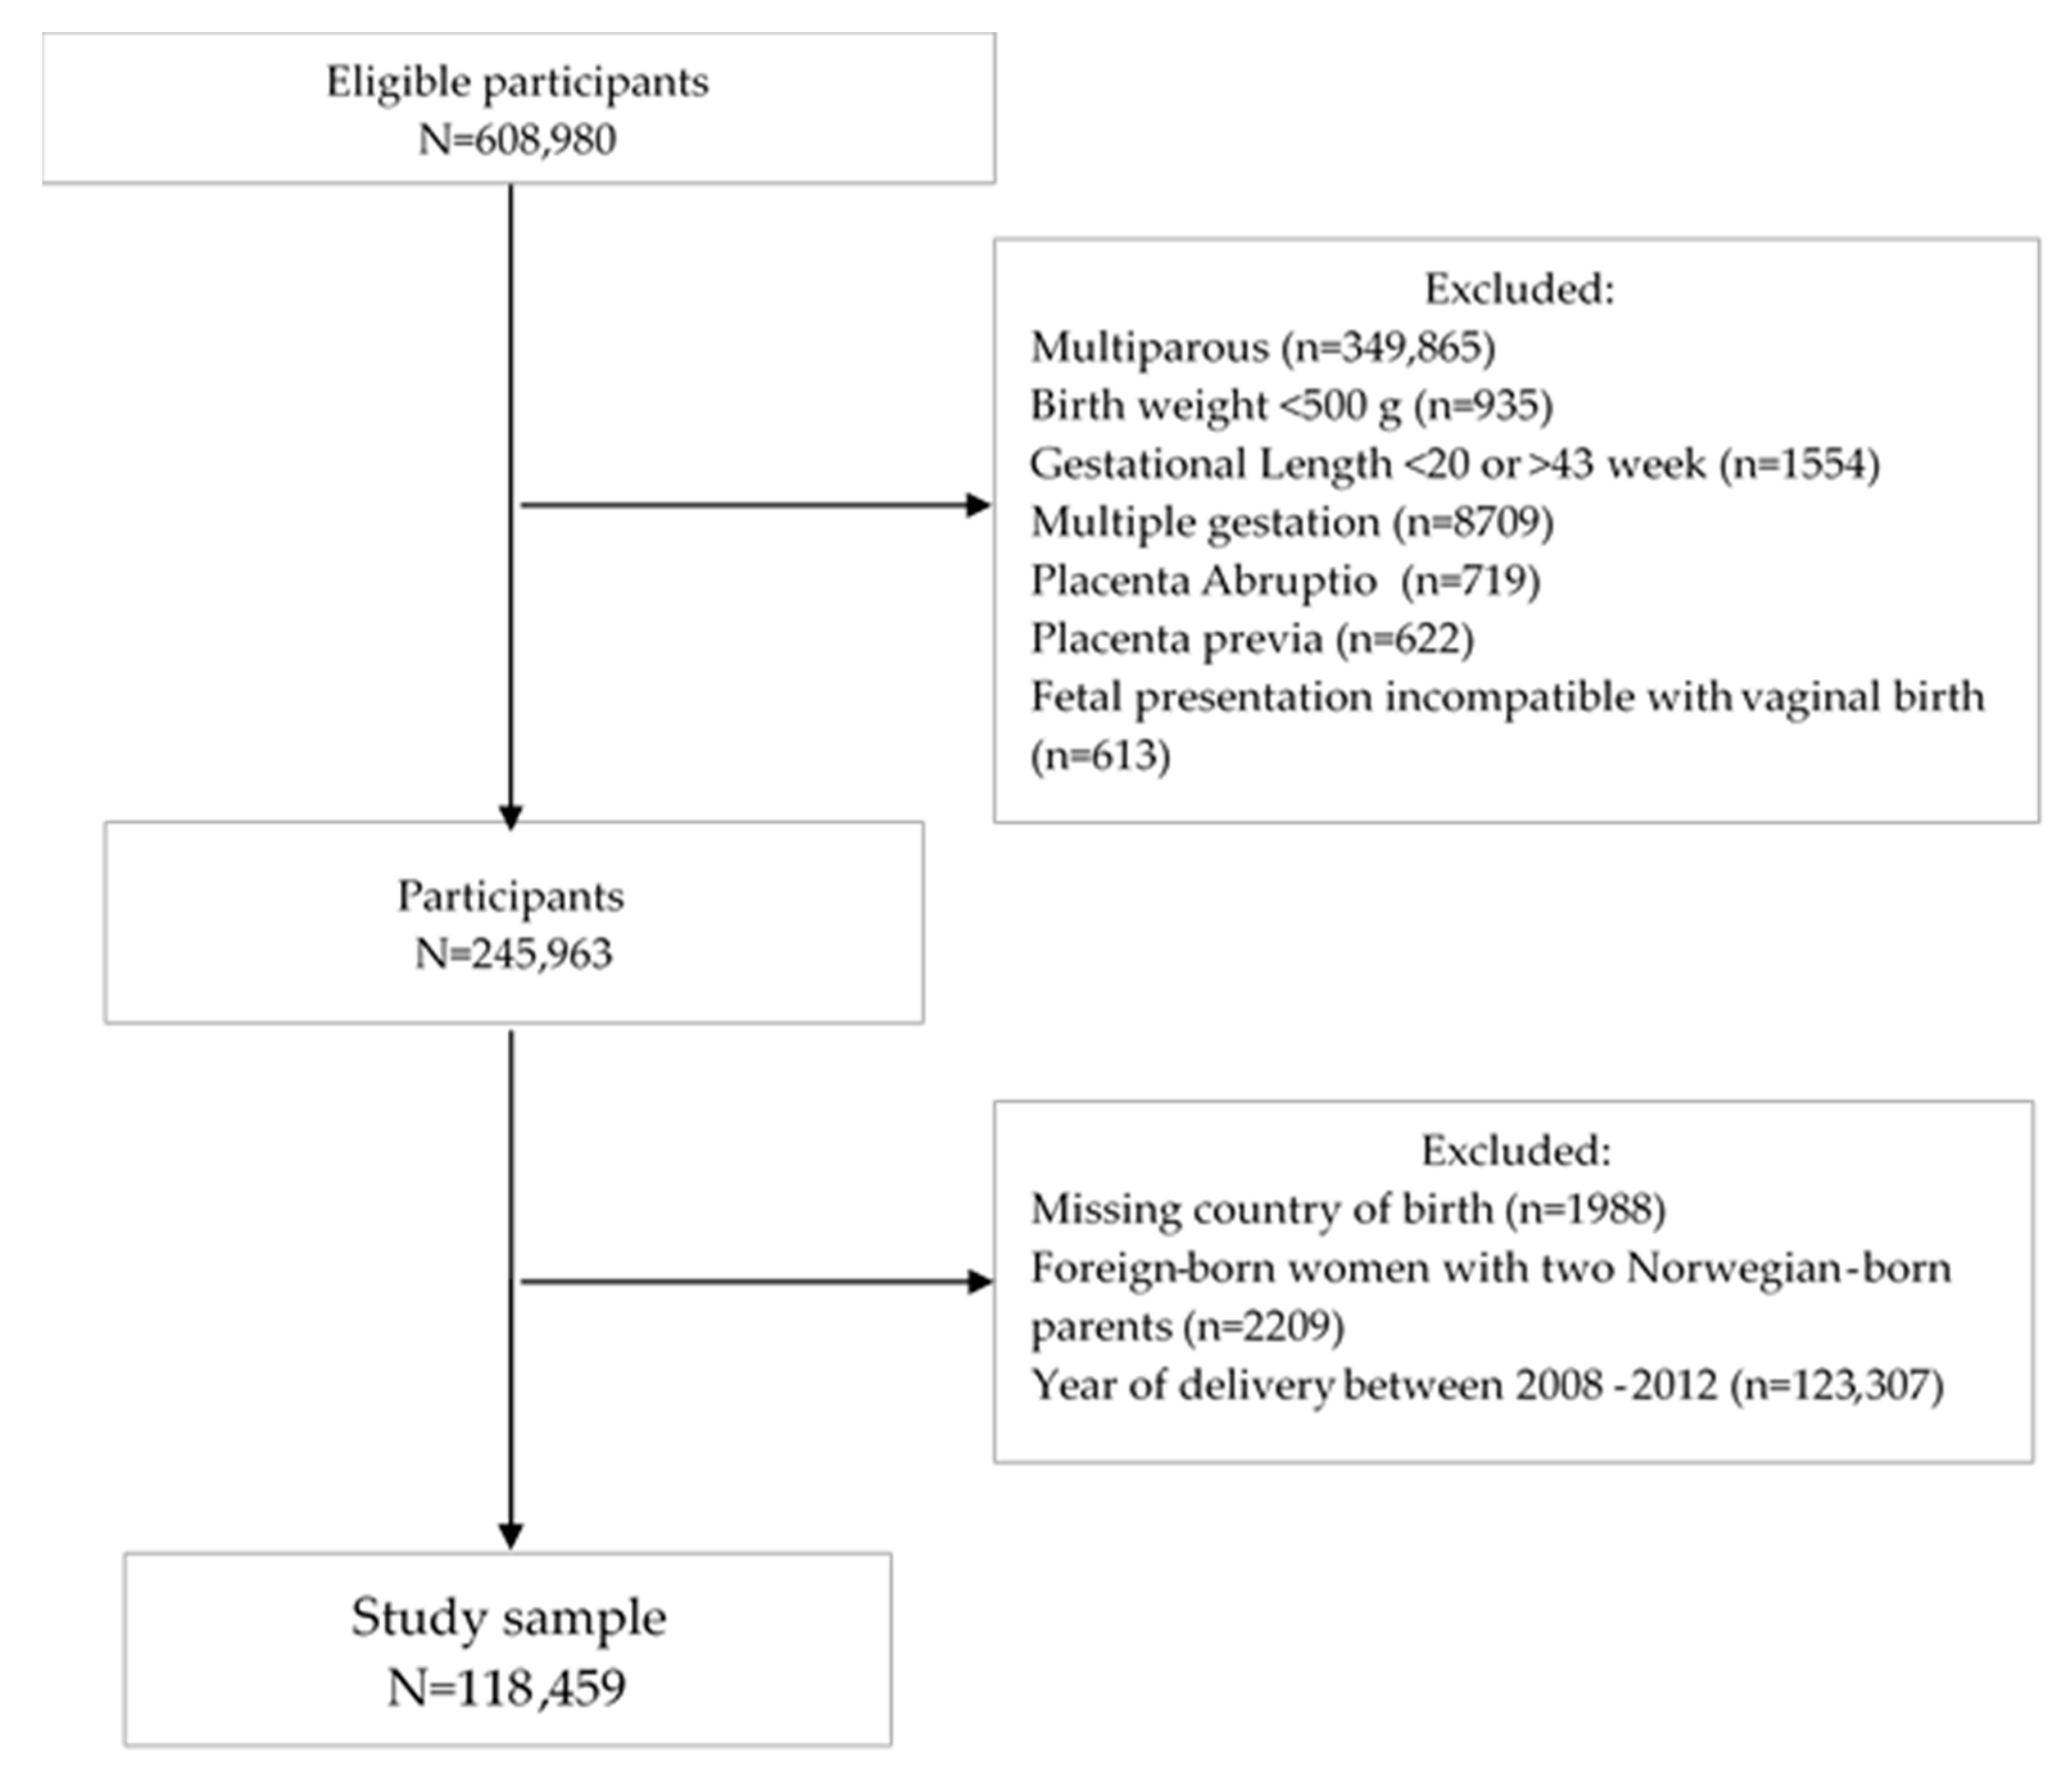
2.1. Study Design and Participants
2.2. Outcome
2.3. Exposures
2.4. Study Factors
2.5. Statistical Analysis
3. Results
3.1. Maternal Characteristics
3.2. Delivery Mode by Maternal Region of Origin
3.3. Maternal Region of Origin and Caesarean Section by Pre-Pregnancy BMI
3.3.1. Elective CS
3.3.2. Emergency CS
3.4. Maternal Region of Origin and Caesarean Section by Pre-Pregnancy BMI among Foreign Born Women
3.5. Maternal Region of Origin and Elective and Emergency CS by Length of Residence
3.6. Sensitivity Analysis
4. Discussion
4.1. Main Findings
4.2. Strengths and Limitations
4.3. Interpretation
5. Conclusions
Implications for Practice
Supplementary Materials
Author Contributions
Funding
Institutional Review Board Statement
Informed Consent Statement
Data Availability Statement
Acknowledgments
Conflicts of Interest
References
- Vogel, J.P.; Betrán, A.P.; Vindevoghel, N.; Souza, J.P.; Torloni, M.R.; Zhang, J.; Tunçalp, Ö.; Mori, R.; Morisaki, N.; Ortiz-Panozo, E.; et al. Use of the Robson classification to assess caesarean section trends in 21 countries: A secondary analysis of two WHO multicountry surveys. Lancet Glob. Health 2015, 3, e260–e270. [Google Scholar] [CrossRef] [Green Version]
- Santas, G.; Santas, F. Trends of caesarean section rates in Turkey. J. Obstet. Gynaecol. 2018, 38, 658–662. [Google Scholar] [CrossRef] [PubMed]
- Silver, R.M. Delivery after Previous Cesarean: Long-Term Maternal Outcomes. Semin. Perinatol. 2010, 34, 258–266. [Google Scholar] [CrossRef]
- Souza, J.P.; Gülmezoglu, A.; Lumbiganon, P.; Laopaiboon, M.; Carroli, G.; Fawole, B.; Ruyan, P.; the WHO Global Survey on Maternal and Perinatal Health Research Group. Caesarean section without medical indications is associated with an increased risk of adverse short-term maternal outcomes: The 2004-2008 WHO Global Survey on Maternal and Perinatal Health. BMC Med. 2010, 8, 71. [Google Scholar] [CrossRef] [PubMed] [Green Version]
- Sandall, J.; Tribe, R.M.; Avery, L.; Mola, G.; Visser, G.H.; Homer, C.S.; Gibbons, D.; Kelly, N.M.; Kennedy, H.P.; Kidanto, H.; et al. Short-term and long-term effects of caesarean section on the health of women and children. Lancet 2018, 392, 1349–1357. [Google Scholar] [CrossRef]
- Gagnon, A.J.; Van Hulst, A.; Merry, L.; George, M.A.; Saucier, J.-F.; Stanger, E.; Wahoush, O.; Stewart, D.E. Cesarean section rate differences by migration indicators. Arch. Gynecol. Obstet. 2012, 287, 633–639. [Google Scholar] [CrossRef]
- Merry, L.; Semenic, S.; Gyorkos, T.W.; Fraser, W.; Small, R.; Gagnon, A.J. International migration as a determinant of emergency caesarean. Women Birth 2016, 29, e89–e98. [Google Scholar] [CrossRef]
- Poncet, L.; Panjo, H.; Andro, A.; Ringa, V. Caesarean delivery in a migration context: The role of prior delivery in the host country. Sex. Reprod. Health Matters 2020, 28, 1763576. [Google Scholar] [CrossRef]
- Betrán, A.P.; Ye, J.; Moller, A.-B.; Zhang, J.; Gülmezoglu, A.M.; Torloni, M.R. The Increasing Trend in Caesarean Section Rates: Global, Regional and National Estimates: 1990–2014. PLoS ONE 2016, 11, e0148343. [Google Scholar] [CrossRef] [Green Version]
- Breckenkamp, J.; Razum, O.; Henrich, W.; Borde, T.; David, M. Effects of maternal obesity, excessive gestational weight gain and fetal macrosomia on the frequency of cesarean deliveries among migrant and non-migrant women—A prospective study. J. Périnat. Med. 2019, 47, 402–408. [Google Scholar] [CrossRef]
- Breckenkamp, J.; Läcke, E.M.; Henrich, W.; Borde, T.; Brenne, S.; David, M.; Razum, O. Advanced cervical dilatation as a predictor for low emergency cesarean delivery: A comparison between migrant and non-migrant Primiparae—Secondary analysis in Berlin, Germany. BMC Pregnancy Childbirth 2019, 19, 1. [Google Scholar] [CrossRef] [PubMed] [Green Version]
- Linard, M.; Deneux-Tharaux, C.; Luton, D.; Schmitz, T.; Mandelbrot, L.; Estellat, C.; Sauvegrain, P.; Azria, E.; PreCARE study group; BIP Study Group; et al. Differential rates of cesarean delivery by maternal geographical origin: A cohort study in France. BMC Pregnancy Childbirth 2019, 19, 1–11. [Google Scholar] [CrossRef] [Green Version]
- Mariani, G.L.; Vain, N.E. The rising incidence and impact of non-medically indicated pre-labour cesarean section in Latin America. Semin. Fetal Neonatal Med. 2019, 24, 11–17. [Google Scholar] [CrossRef] [PubMed] [Green Version]
- Bakken, K.; Skjeldal, O.H.; Stray-Pedersen, B. Higher Risk for Adverse Obstetric Outcomes Among Immigrants of African and Asian Descent: A Comparison Study at a Low-Risk Maternity Hospital in Norway. Birth 2015, 42, 132–140. [Google Scholar] [CrossRef] [PubMed]
- Hillemeier, M.M.; Weisman, C.S.; Chuang, C.; Downs, D.S.; McCall-Hosenfeld, J.; Camacho, F. Transition to Overweight or Obesity Among Women of Reproductive Age. J. Women’s Health 2011, 20, 703–710. [Google Scholar] [CrossRef] [Green Version]
- Lopez-Arana, S.; Avendano, M.; Van Lenthe, F.J.; Burdorf, A. Trends in overweight among women differ by occupational class: Results from 33 low- and middle-income countries in the period 1992–2009. Int. J. Obes. 2013, 38, 97–105. [Google Scholar] [CrossRef] [PubMed] [Green Version]
- Kumar, B.N.; Meyer, H.E.; Wandel, M.; Dalen, I.; Holmboe-Ottesen, G. Ethnic differences in obesity among immigrants from developing countries, in Oslo, Norway. Int. J. Obes. (Lond.) 2006, 30, 684–690. [Google Scholar] [CrossRef] [Green Version]
- Reiss, K.; Breckenkamp, J.; Borde, T.; Brenne, S.; David, M.; Razum, O. Contribution of overweight and obesity to adverse pregnancy outcomes among immigrant and non-immigrant women in Berlin, Germany. Eur. J. Public Health 2015, 25, 839–844. [Google Scholar] [CrossRef] [Green Version]
- Wang, Y.; Beydoun, M.A. The Obesity Epidemic in the United States Gender, Age, Socioeconomic, Racial/Ethnic, and Geographic Characteristics: A Systematic Review and Meta-Regression Analysis. Epidemiol. Rev. 2007, 29, 6–28. [Google Scholar] [CrossRef]
- Rogers, A.J.G.; Harper, L.M.; Mari, G. A conceptual framework for the impact of obesity on risk of cesarean delivery. Am. J. Obstet. Gynecol. 2018, 219, 356–363. [Google Scholar] [CrossRef] [PubMed]
- Harvey, M.W.; Braun, B.; Ertel, K.A.; Pekow, P.S.; Markenson, G.; Chasan-Taber, L. Prepregnancy Body Mass Index, Gestational Weight Gain, and Odds of Cesarean Delivery in Hispanic Women. Obesity 2018, 26, 185–192. [Google Scholar] [CrossRef] [PubMed]
- Dalbye, R.; Gunnes, N.; Blix, E.; Zhang, J.; Eggebø, T.M.; Tokheim, L.N.; Øian, P.; Bernitz, S. Maternal body mass index and risk of obstetric, maternal and neonatal outcomes: A cohort study of nulliparous women with spontaneous onset of labor. Acta Obstet. Gynecol. Scand. 2021, 100, 521–530. [Google Scholar] [CrossRef] [PubMed]
- Santos, S.; Voerman, E.; Amiano, P.; Barros, H.; Beilin, L.; Bergström, A.; Charles, M.; Chatzi, L.; Chevrier, C.; Chrousos, G.; et al. Impact of maternal body mass index and gestational weight gain on pregnancy complications: An individual participant data meta-analysis of European, North American, and Australian cohorts. BJOG Int. J. Obstet. Gynaecol. 2019, 126, 984–995. [Google Scholar] [CrossRef] [PubMed]
- Goel, M.S.; McCarthy, E.P.; Phillips, R.S.; Wee, C.C. Obesity Among US Immigrant Subgroups by Duration of Residence. JAMA 2004, 292, 2860–2867. [Google Scholar] [CrossRef] [PubMed] [Green Version]
- Rasmussen, T.D.; Villadsen, S.F.; Andersen, P.K.; Clausen, T.D.; Andersen, A.-M.N. Ethnic differences in the risk of caesarean section: A Danish population-based register study 2004–2015. BMC Pregnancy Childbirth 2019, 19, 194. [Google Scholar] [CrossRef] [PubMed] [Green Version]
- Harris, L.M.; Forson-Dare, Z.; Gallagher, P.G. Critical disparities in perinatal health—understanding risks and changing the outcomes. J. Perinatol. 2021, 41, 181–182. [Google Scholar] [CrossRef] [PubMed]
- Lehmann, S.; Baghestan, E.; Børdahl, P.; Ebbing, M.; Irgens, L.; Rasmussen, S. Validation of data in the Medical Birth Registry of Norway on delivery after a previous cesarean section. Acta Obstet. Gynecol. Scand. 2017, 96, 892–897. [Google Scholar] [CrossRef] [PubMed] [Green Version]
- IHME. What Is GBD and Why Is It Important? Available online: http://www.healthdata.org/gbd/faq (accessed on 12 April 2021).
- Byrskog, U.; Small, R.; Schytt, E. Community-based bilingual doulas for migrant women in labour and birth—Findings from a Swedish register-based cohort study. BMC Pregnancy Childbirth 2020, 20, 1–12. [Google Scholar] [CrossRef] [PubMed]
- Brinkler, R.; Edwards, M. The association between primary language and quality of recovery following caesarean section: A prospective observational study. Int. J. Obstet. Anesth. 2020, 44, 68–73. [Google Scholar] [CrossRef]
- Bastola, K.; Koponen, P.; Gissler, M.; Kinnunen, T.I. Differences in caesarean delivery and neonatal outcomes among women of migrant origin in Finland: A population-based study. Paediatr. Périnat. Epidemiol. 2020, 34, 12–20. [Google Scholar] [CrossRef]
- Juárez, S.P.; Small, R.; Hjern, A.; Schytt, E. Caesarean Birth is Associated with Both Maternal and Paternal Origin in Immigrants in Sweden: A Population-Based Study. Paediatr. Périnat. Epidemiol. 2017, 31, 509–521. [Google Scholar] [CrossRef]
- Dempsey, J.C.; Ashiny, Z.; Qiu, C.-F.; Miller, R.S.; Sorensen, T.K.; A Williams, M. Maternal pre-pregnancy overweight status and obesity as risk factors for cesarean delivery. J. Matern. Neonatal Med. 2005, 17, 179–185. [Google Scholar] [CrossRef] [PubMed]
- Glazer, K.B.; Danilack, V.A.; Werner, E.F.; Field, A.E.; Savitz, D.A. Elucidating the role of overweight and obesity in racial and ethnic disparities in cesarean delivery risk. Ann. Epidemiol. 2020, 42, 4–11.e4. [Google Scholar] [CrossRef]
- Bakken, K.; Stray-Pedersen, B. Emergency cesarean section among women in Robson groups one and three: A comparison study of immigrant and Norwegian women giving birth in a low-risk maternity hospital in Norway. Health Care Women Int. 2019, 40, 761–775. [Google Scholar] [CrossRef] [Green Version]
- Vangen, S.; Stoltenberg, C.; Skrondal, A.; Magnus, P.; Stray-Pedersen, B. Cesarean section among immigrants in Norway. Acta Obstet. Gynecol. Scand. 2000, 79, 553–558. [Google Scholar]
- Taraldsen, S.; Vangen, S.; Øian, P.; Sørbye, I.K. Female genital mutilation/cutting, timing of deinfibulation, and risk of cesarean section. Acta Obstet. Gynecol. Scand. 2021, 100, 587–595. [Google Scholar] [CrossRef]
- Sørbye, I.K.; Daltveit, A.K.; Sundby, J.; Stoltenberg, C.; Vangen, S. Caesarean section by immigrants’ length of residence in Norway: A population-based study. Eur. J. Public Health 2014, 25, 78–84. [Google Scholar] [CrossRef] [PubMed]
- Juárez, S.P.; Small, R.; Hjern, A.; Schytt, E. Length of residence and caesarean section in migrant women in Sweden: A population-based study. Eur. J. Public Health 2018, 28, 1073–1079. [Google Scholar] [CrossRef] [PubMed]
- Henriksen, L.; Grimsrud, E.; Schei, B.; Lukasse, M. Factors related to a negative birth experience—A mixed methods study. Midwifery 2017, 51, 33–39. [Google Scholar] [CrossRef] [PubMed]
- Almeida, L.M.; Caldas, J.; Ayres-De-Campos, D.; Barrientos, D.M.S.; Dias, S. Maternal Healthcare in Migrants: A Systematic Review. Matern. Child Health J. 2013, 17, 1346–1354. [Google Scholar] [CrossRef] [PubMed]
- Løvåsmoen, E.M.L.; Bjørgo, M.N.; Lukasse, M.; Schei, B.; Henriksen, L. Women’s preference for caesarean section and the actual mode of delivery—Comparing five sites in Norway. Sex. Reprod. Health 2018, 16, 206–212. [Google Scholar] [CrossRef] [PubMed]
- Merry, L.; Small, R.; Blondel, B.; Gagnon, A.J. International migration and caesarean birth: A systematic review and meta-analysis. BMC Pregnancy Childbirth 2013, 13, 27. [Google Scholar] [CrossRef] [Green Version]
- Small, R.; Roth, C.; Raval, M.; Shafiei, T.; Korfker, D.; Heaman, M.; McCourt, C.; Gagnon, A. Immigrant and non-immigrant women’s experiences of maternity care: A systematic and comparative review of studies in five countries. BMC Pregnancy Childbirth 2014, 14, 152. [Google Scholar] [CrossRef] [PubMed] [Green Version]
- Gagnon, A.J.; Merry, L.; Haase, K. Predictors of emergency cesarean delivery among international migrant women in Canada. Int. J. Gynecol. Obstet. 2013, 121, 270–274. [Google Scholar] [CrossRef] [PubMed]
- Sauvegrain, P.; Azria, E.; Chiesa-Dubruille, C.; Deneux-Tharaux, C. Exploring the hypothesis of differential care for African immigrant and native women in France with hypertensive disorders during pregnancy: A qualitative study. BJOG Int. J. Obstet. Gynaecol. 2017, 124, 1858–1865. [Google Scholar] [CrossRef] [PubMed] [Green Version]
- Chen, I.; Opiyo, N.; Tavender, E.; Mortazhejri, S.; Rader, T.; Petkovic, J.; Yogasingam, S.; Taljaard, M.; Agarwal, S.; Laopaiboon, M.; et al. Non-clinical interventions for reducing unnecessary caesarean section. Cochrane Database Syst. Rev. 2018, 9, CD005528. [Google Scholar] [CrossRef] [PubMed]


| Characteristics | Vaginal Delivery n = 98,247 (82.9%) | Elective CS n = 3816 (3.2%) | Emergency CS n = 16,396 (13.8%) | |
|---|---|---|---|---|
| Maternal region of origin (GBD) | ||||
| Norway | 62,067 (83.8) | 2414 (3.3) | 9562 (12.9) | |
| High-income countries | 12,338 (83.5) | 489 (3.3) | 1949 (13.2) | |
| Europe Central Asia | 10,787 (83.6) | 476 (3.7) | 1642 (12.7) | |
| Sub-Saharan Africa | 2835 (72.4) | 89 (2.3) | 992 (25.3) | |
| North Africa & the Middle East | 3770 (81.9) | 142 (3.1) | 690 (14.9) | |
| South Asia | 1827 (80.2) | 58 (2.6) | 392 (17.2) | |
| Southeast Asia, East Asia & the Pacific | 3847 (78.6) | 109 (2.2) | 938 (19.2) | |
| Latin America & the Caribbean | 776 (74.2) | 39 (3.7) | 231 (22.1) | |
| Maternal age: | ≤24 years | 23,385 (88.8) | 524 (2.8) | 2712 (9.3) |
| 25–34 years | 65,778 (82.7) | 2436 (3.2) | 10,881 (14.1) | |
| ≥35 years | 9084 (67.5) | 856 (8.4) | 2803 (24.1) | |
| Pre-pregnancy BMI (kg/m2): | Underweight (<18.5) | 3922 (87.7) | 143 (3.2) | 407 (9.1)) |
| Normal weight (18.5–24.9) | 50,676 (85.1) | 1744 (2.9) | 7122 (11.9) | |
| Overweight/Obese (≥25) | 21,304 (77.9) | 939 (3.4) | 5115 (18.7) | |
| Missing Information | 22,345 (82.5) | 990 (3.7) | 3752 (13.9) | |
| Married | 90 173 (83.1) | 3428 (3.2) | 14,876 (13.7) | |
| Educational level 1 | No education/Primary | 13,646 (81.5) | 536 (3.2) | 2564 (15.3) |
| Secondary | 21,283 (82.4) | 855 (3.3) | 3693 (14.3) | |
| University/College | 54,915 (83.7) | 2128 (3.2) | 8558 (13.1) | |
| Unknown | 8403 (81.7) | 297 (2.9) | 1581 (15.4) | |
| Smokers | 8497 (80.8) | 385 (3.7) | 1634 (15.5) | |
| SGA 5th percentile | 5396 (75.2) | 272 (3.8) | 1508 (21.0) | |
| LGA 10th percentile | 4509 (68.9) | 318 (4.9) | 1715 (26.2) | |
| Preeclampsia | 2666 (60.6) | 133 (3.0) | 1599 (36.4) | |
| GDM | 3826 (70.3) | 267 (4.9) | 1352 (24.8) | |
| Norwegian Health regions: | Southeast West Mid North | 55,956 (82.1) | 2545 (3.7) | 9661 (14.2) |
| 21,900 (86.2) | 543 (2.1) | 2954 (11.6) | ||
| 12,646 (81.1) | 453 (2.9) | 2369 (15.3) | ||
| 7745 (82.1) | 275 (2.9) | 1412 (14.9) | ||
| Paternal birthplace: 1 | Foreign-born | 70,004 (83.4) | 2720 (3.2) | 11,224 (13.4) |
| Norwegian-born | 25,288 (82.5) | 943 (3.1) | 4436 (14.5) | |
| Elective CS | Underweight (BMI < 18.5) n = 143 (3.2%) | Normal (BMI 18.5–24.9) n = 1744 (2.9%) | Overweight/obese (BMI ≥ 25.0) n= 939 (3.4%) | Missing BMI n = 990 (3.7%) | |||||
|---|---|---|---|---|---|---|---|---|---|
| Maternal Region of Origin | Cases n (%) | RRR (95% CI) | RRR (95% CI) | RRR (95% CI) | RRR (95% CI) | ||||
| Unadjusted | Adjusted * | Unadjusted | Adjusted * | Unadjusted | Adjusted * | Unadjusted | Adjusted * | ||
| Norway | 2414 (3.3) | Reference | Reference | Reference | Reference | Reference | Reference | Reference | Reference |
| High-income countries | 489 (3.3) | 0.85 (0.49–1.49) | 0.79 (0.44–1.41) | 1.06 (0.92–1.23) | 0.99 (0.85–1.15) | 0.88 (0.71–1.10) | 0.77 (0.61–0.98) | 1.11 (0.92–1.34) | 1.03 (0.81–131) |
| Europe & Central Asia | 476 (3.7) | 0.84 (0.53–1.33) | 0.94 (0.53–1.68) | 1.16 (1.01–1.33) | 1.17 (0.98–1.40) | 1.47 (1.18–1.83) | 1.42 (1.09–1.86) | 1.04 (0.85–1.29) | 1.17 (0.86–1.58) |
| Sub-Saharan Africa | 89 (2.3) | 0.82 (0.41–1.65) | 0.86 (0.37–1.96) | 0.70 (0.49–1.00) | 0.57 (0.37–0.87) | 1.30 (0.87–1.92) | 1.23 (0.79–1.91) | 0.63 (0.41–0.96) | 0.75 (0.41–1.35) |
| North Africa & the Middle East | 142 (3.1) | 0.54 (0.22–1.35) | 0.68 (0.25–1.82) | 1.12 (0.87–1.43) | 1.23 (0.93–1.62) | 0.78 (0.52–1.17) | 0.64 (0.39–1.05) | 0.97 (0.71–1.35) | 1.54 (0.99–2.38) |
| South Asia | 58 (2.6) | 0.22 (0.03–1.60) | 0.27 (0.04–2.04) | 0.87 (0.51–1.28) | 0.86 (0.56–1.33) | 1.31 (0.81–2.12) | 1.37 (0.82–2.27) | 0.55 (0.31–0.99) | 0.64 (0.28–1.48) |
| Southeast Asia, East Asia & Pacific | 109 (2.2) | 0.31 (0.12–0.77) | 0.32 (0.13–0.82) | 0.68 (0.51–0.90) | 0.56 (0.41–0.77) | 0.83 (0.50–1.38) | 0.74 (0.43–1.25) | 0.99 (0.71–1.40) | 0.92 (0.60–1.41) |
| Latin America & the Caribbean | 39 (3.7) | 2.31 (0.69–7.74) | 2.28 (0.66–7.83) | 1.49 (0.96–2.32) | 1.01 (0.61–1.66) | 0.91 (0.37–2.23) | 0.65 (0.24–1.79) | 1.10 (0.58–2.09) | 1.08 (0.48–2.36) |
| Emergency CS | Underweight (BMI < 18.5) n= 407 (9.1%) | Normal (BMI 18.5–24.9) n = 7122 (12.0%) | Overweight/obese (BMI ≥ 25.0) n = 5115 (18.7%) | Missing BMI n = 3752 (13.9%) | |||||
| Maternal Region of Origin | Cases n (%) | RRR (95% CI) | RRR (95% CI) | RRR (95% CI) | RRR (95% CI) | ||||
| Unadjusted | Adjusted * | Unadjusted | Adjusted * | Unadjusted | Adjusted * | Unadjusted | Adjusted * | ||
| Norway | 9562 (12.9) | Reference | Reference | Reference | Reference | Reference | Reference | Reference | Reference |
| High-income countries | 1949 (13.2) | 0.98 (0.67–1.45) | 0.86 (0.57–1.30) | 1.04 (0.96–1.12) | 0.97 (0.90–1.06) | 1.10 (0.99–1.21) | 1.03 (0.93–1.14) | 1.03 (0.92–1.15) | 1.03 (0.92–1.15) |
| Europe & Central Asia | 1642 (12.7) | 1.03 (0.75–1.41) | 1.01 (0.68–1.49) | 1.13 (1.04–1.22) | 1.11 (1.01–1.22) | 1.04 (0.92–1.18) | 0.97 (0.84–1.12) | 0.96 (0.85–1.09) | 0.96 (0.85–1.09) |
| Sub-Saharan Africa | 992 (25.3) | 2.03 (1.46–2.97) | 2.06 (1.31–3.22) | 2.63 (2.35–2.95) | 2.61 (2.28–2.99) | 2.40 (2.05–2.81) | 2.18 (1.81–2.63) | 2.13 (1.84–2.47) | 2.13 (1.84–2.47) |
| North Africa & the Middle East | 690 (14.9) | 1.44 (0.93–2.23) | 1.39 (0.81–2.37) | 1.24 (1.09–1.41) | 1.25 (1.07–1.45) | 1.27 (1.09–1.49) | 1.28 (1.06–1.54) | 1.14 (0.96–1.35) | 1.14 (0.96–1.35) |
| South Asia | 392 (17.2) | 2.24 (1.36–3.72) | 2.59 (1.45–4.62) | 1.32 (1.11–1.58) | 1.48 (1.23–1.79) | 1.66 (1.34–2.05) | 1.64 (1.29–2.08) | 1.38 (1.11–1.71) | 1.38 (1.11–1.71) |
| Southeast Asia, East Asia & Pacific | 938 (19.2) | 1.83 (1.33–2.52) | 1.52 (1.06–2.18) | 1.86 (1.68–2.06) | 1.65 (1.47–1.84) | 1.56 (1.29–1.889 | 1.37 (1.12–1.68) | 1.67 (1.43–1.95) | 1.67 (1.43–1.95) |
| Latin America & the Caribbean | 231 (22.1) | 2.75 (1.19–6.36) | 2.37 (0.99–5.65) | 2.02 (1.63–2.51) | 1.62 (1.29–2.04) | 1.67 (1.19–2.33) | 1.42 (0.99–2.04) | 2.30 (1.75–3.01) | 2.30 (1.75–3.01) |
| Elective CS | Underweight (BMI < 18.5) n = (%) | Normal (BMI 18.5–24.9) n = (%) | Overweight/obese (BMI ≥ 25.0) n = (%) | Missing BMI n = (%) | |||||
|---|---|---|---|---|---|---|---|---|---|
| Maternal region of origin | Cases % | RRR (95% CI) | RRR (95% CI) | RRR (95% CI) | RRR (95% CI) | ||||
| Unadjusted | Adjusted * | Unadjusted | Adjusted * | Unadjusted | Adjusted * | Unadjusted | Adjusted * | ||
| High-income countries | 3.6 | Reference | Reference | Reference | Reference | Reference | Reference | Reference | Reference |
| Europe & Central Asia | 3.6 | 0.92 (0.37–2.31) | 1.50 (0.56–3.99) | 0.94 (0.75–1.17) | 1.18 (0.92–1.51) | 1.53 (1.05–2.24) | 2.19 (1.43–3.35) | 0.85 (0.62–1.17) | 1.24 (0.80.1.91) |
| Sub-Saharan Africa | 2.3 | 0.90 (0.31–2.65) | 1.76 (0.51–6.07) | 0.55 (0.36–0.84) | 0.63 (0.38–1.06) | 1.36 (0.81–2.29) | 1.96 (1.05–3.63) | 0.61 (0.37–0.99) | 1.26 (0.62–2.57) |
| North Africa & Middle East | 3.1 | 0.59 (0.17–2.14) | 1.31 (0.34–5.06) | 0.92 (0.68–1.26) | 1.32 (0.93–1.87) | 0.83 (0.49–1.43) | 1.10 (0.59–2.06) | 0.88 80.58–1.33) | 2.03 (1.14–3.59) |
| South Asia | 2.3 | 1 | 1 | 0.61 (0.35–1.05) | 0.70 (0.38–1.29) | 1.19 (0.59–2.42) | 1.91 (0.90–4.05) | 0.56 (0.29–1.11) | 0.67 (0.23–1.95) |
| Southeast Asia, East Asia & Pacific | 2.5 | 0.42 (0.13–1.39) | 0.52 (0.15–1.76) | 0.62 (0.44–0–87) | 0.59 (0.41–0.85) | 1.22 (0.67–2.20) | 1.27 (0.68–2.39) | 0.96 (0.63–1.45) | 1.16 (0.68–1.98) |
| Latin America & Caribbean | 4.1 | 3.95 (0.92–16.99) | 4.23 (0.95–18.91) | 1.28 (0.78–2.11) | 0.94 (0.54–1.64) | 0.99 (0.35–2.82) | 0.78 (0.23–2.62) | 1.15 (0.58–2.27) | 1.51 (0.65–3.52) |
| Emergency CS | Underweight (BMI < 18.5) n = (%) | Normal (BMI 18.5–24.9) n = (%) | Overweight/obese (BMI≥ 25.0) n = (%) | Missing BMI n = (%) | |||||
| Maternal Region of Origin | Cases % | RRR (95% CI) | RRR (95% CI) | RRR (95% CI) | RRR (95% CI) | ||||
| Unadjusted | Adjusted * | Unadjusted | Adjusted * | Unadjusted | Adjusted * | Unadjusted | Adjusted * | ||
| High-income countries | 14.2 | Reference | Reference | Reference | Reference | Reference | Reference | Reference | Reference |
| Europe & Central Asia | 12.8 | 0.88 (0.50–1.55) | 1.14 (0.61–2.13) | 0.95 (0.84–1.08) | 1.09 (0.95–1.25) | 0.84 (0.70–1.01) | 0.94 (0.77–1.14) | 0.95 (0.78–1.14) | 1.07 (0.84–1.36) |
| Sub-Saharan Africa | 26.6 | 1.75 (0.97–3.17) | 2.98 (1.49–5.99) | 2.35 (2.02–2.74) | 2.89 (2.41–3.47) | 2.15 (1.75–2.65) | 2.49 (1.93–3.22) | 2.22 (1.81–2.73) | 2.73 (2.03–3.67) |
| North Africa & Middle East | 15.8 | 1.31 (0.68–2.52) | 1.93 (0.92–4.05) | 1.11 (0.9–1.31) | 1.32 (1.09–1.59) | 1.08 (0.87–1.34) | 1.32 (1.03–1.69) | 1.20 (0.96–1.51) | 1.51 (1.11–2.05) |
| South Asia | 17.7 | 1.48 (0.64–3.40) | 2.55 (1.05–6.19) | 1.19 (0.94–1.50) | 1.55 (1.21–1.98) | 1.34 (0.99–1.80) | 1.57 (1.13–2.18) | 1.42 (1.07–1.89) | 1.70 (1.16–2.49) |
| Southeast Asia, East Asia & Pacific | 20.9 | 1.59 (0.89–2.83) | 1.82 (0.97–3.40) | 1.76 (1.52–2.03) | 1.78 (1.52–2.07) | 1.51 (1.18–1.93) | 1.44 (1.11–1.87) | 1.83 (1.48–2.26) | 1.70 (1.31–2.22) |
| Latin America & Caribbean | 23.9 | 2.79 (0.99–7.86) | 3.30 (1.11–9.72) | 1.86 (1.46–2.38) | 1.69 (1.30–2.19) | 1.54 (1.04–2.28) | 1.43 (0.94–2.16) | 2.48 (1.80–3.40) | 2.28 (1.52–3.42) |
| Length of Residency | Elective CS | |||||
|---|---|---|---|---|---|---|
| 0–4 years n = 486 (46.2%) | ≥5 years n = 428 (40.7%) | <0 years n = 138 (13.1%) | ||||
| RRR (95% CI) | RRR (95% CI) | RRR (95% CI) | ||||
| Unadjusted | Adjusted * | Unadjusted | Adjusted * | Unadjusted | Adjusted * | |
| Maternal region of origin | ||||||
| High-income countries | Reference | Reference | Reference | Reference | Reference | Reference |
| Europe & Central Asia | 0.93 (0.70–1.22) | 1.07 (0.79–1.44) | 1.58 (1.17–2.13) | 1.90 (1.36–2.66) | 0.74 (0.43–1.26) | 0.66 (0.37–1.16) |
| Sub-Saharan Africa | 0.76 (0.50–1.15) | 0.74 (0.44–1.25) | 0.80 (0.48–1.35) | 1.02 (0.56–1.84) | 0.82 (0.35–1.87) | 0.95 (0.39–2.31) |
| North Africa & the Middle East | 0.70 (0.47–1.07) | 0.78 (0.49–1.24) | 1.15 (0.77–1.72) | 1.56 (0.99–2.46) | 0.77 (0.39–1.51) | 0.70 (0.33–1.48) |
| South Asia | 0.47 (0.24–0.92) | 0.51 (0.25–1.04) | 1.37 (0.75–2.52) | 1.84 (0.95–3.56) | 0.40 (0.09–1.74) | 0.20 (0.03–1.55) |
| Southeast Asia, East Asia & Pacific | 0.52 (0.33–0.82) | 0.48 (0.47–1.82) | 1.04 (0.69–1.57) | 1.27 (0.82–1.96) | 0.46 (0.17–1.23) | 0.35 (0.12–1.07) |
| Latin America & the Caribbean | 1.14 (0.61–2.13) | 0.92 (0.47–1.82) | 1.44 (0.68–3.05) | 1.44 (0.65 (3.23) | 1.76 (0.69–4.50) | 1.16 (0.38–3.57) |
| Length of residency | Emergency CS | |||||
| 0–4 years n = 2815 (52.2%) | ≥5 years n = 1849 (34.3%) | <0 years n = 727 (13.5%) | ||||
| RRR (95% CI) | RRR (95% CI) | RRR (95% CI) | ||||
| Unadjusted | Adjusted * | Unadjusted | Adjusted * | Unadjusted | Adjusted * | |
| Maternal region of origin | ||||||
| High-income countries | Reference | Reference | Reference | Reference | Reference | Reference |
| Europe & Central Asia | 0.92 (0.79–1.06) | 1.01(0.86–1.18) | 1.07 (0.91–1.26) | 1.13 (0.95–1.35) | 0.68 (0.50–0.91) | 0.71 (0.51–0.97) |
| Sub-Saharan Africa | 2.37 (2.00–2.80) | 2.70 (2.19–3.32) | 2.12 (1.74–2.59) | 2.36 (1.88–2.97) | 1.91 (1.33–2.73) | 1.93 (1.26–2.95) |
| North Africa & the Middle East | 1.14 (0.95–1.38) | 1.23 (0.99–1.52) | 1.21 (0.99–1.48) | 1.26 (0.99–1.58) | 0.82 (0.57–1.18) | 0.98 (0.66–1.46) |
| South Asia | 1.20 (0.95–1.53) | 1.39 (1.07–1.81) | 1.33 (0.97–1.83) | 1.60 (1.14–2.24) | 1.37 (0.84–2.23) | 1.57 (0.93–2.68) |
| Southeast Asia, East Asia & Pacific | 1.70 (1.43–2.01) | 1.72 (1.43–2.06) | 1.71 (1.42–2.05) | 1.85 (1.52–2.25) | 1.47 (1.01–2.13) | 1.58 (1.06–2.36) |
| Latin America & the Caribbean | 1.86 (1.40–2.46) | 1.71 (1.27–2.31) | 1.62 (1.11–2.35) | 1.64 (1.11–2.43) | 1.92 (1.15–3.21) | 2.02 (1.17–3.48) |
Publisher’s Note: MDPI stays neutral with regard to jurisdictional claims in published maps and institutional affiliations. |
© 2021 by the authors. Licensee MDPI, Basel, Switzerland. This article is an open access article distributed under the terms and conditions of the Creative Commons Attribution (CC BY) license (https://creativecommons.org/licenses/by/4.0/).
Share and Cite
Jatta, F.; Sundby, J.; Vangen, S.; Lindskog, B.V.; Sørbye, I.K.; Owe, K.M. Association between Maternal Origin, Pre-Pregnancy Body Mass Index and Caesarean Section: A Nation-Wide Registry Study. Int. J. Environ. Res. Public Health 2021, 18, 5938. https://doi.org/10.3390/ijerph18115938
Jatta F, Sundby J, Vangen S, Lindskog BV, Sørbye IK, Owe KM. Association between Maternal Origin, Pre-Pregnancy Body Mass Index and Caesarean Section: A Nation-Wide Registry Study. International Journal of Environmental Research and Public Health. 2021; 18(11):5938. https://doi.org/10.3390/ijerph18115938
Chicago/Turabian StyleJatta, Fatou, Johanne Sundby, Siri Vangen, Benedikte Victoria Lindskog, Ingvil Krarup Sørbye, and Katrine Mari Owe. 2021. "Association between Maternal Origin, Pre-Pregnancy Body Mass Index and Caesarean Section: A Nation-Wide Registry Study" International Journal of Environmental Research and Public Health 18, no. 11: 5938. https://doi.org/10.3390/ijerph18115938
APA StyleJatta, F., Sundby, J., Vangen, S., Lindskog, B. V., Sørbye, I. K., & Owe, K. M. (2021). Association between Maternal Origin, Pre-Pregnancy Body Mass Index and Caesarean Section: A Nation-Wide Registry Study. International Journal of Environmental Research and Public Health, 18(11), 5938. https://doi.org/10.3390/ijerph18115938