
Association of Livestock Ownership and Household Dietary Quality: Results from a Cross-Sectional Survey from Rural India


Abstract
:1. Introduction
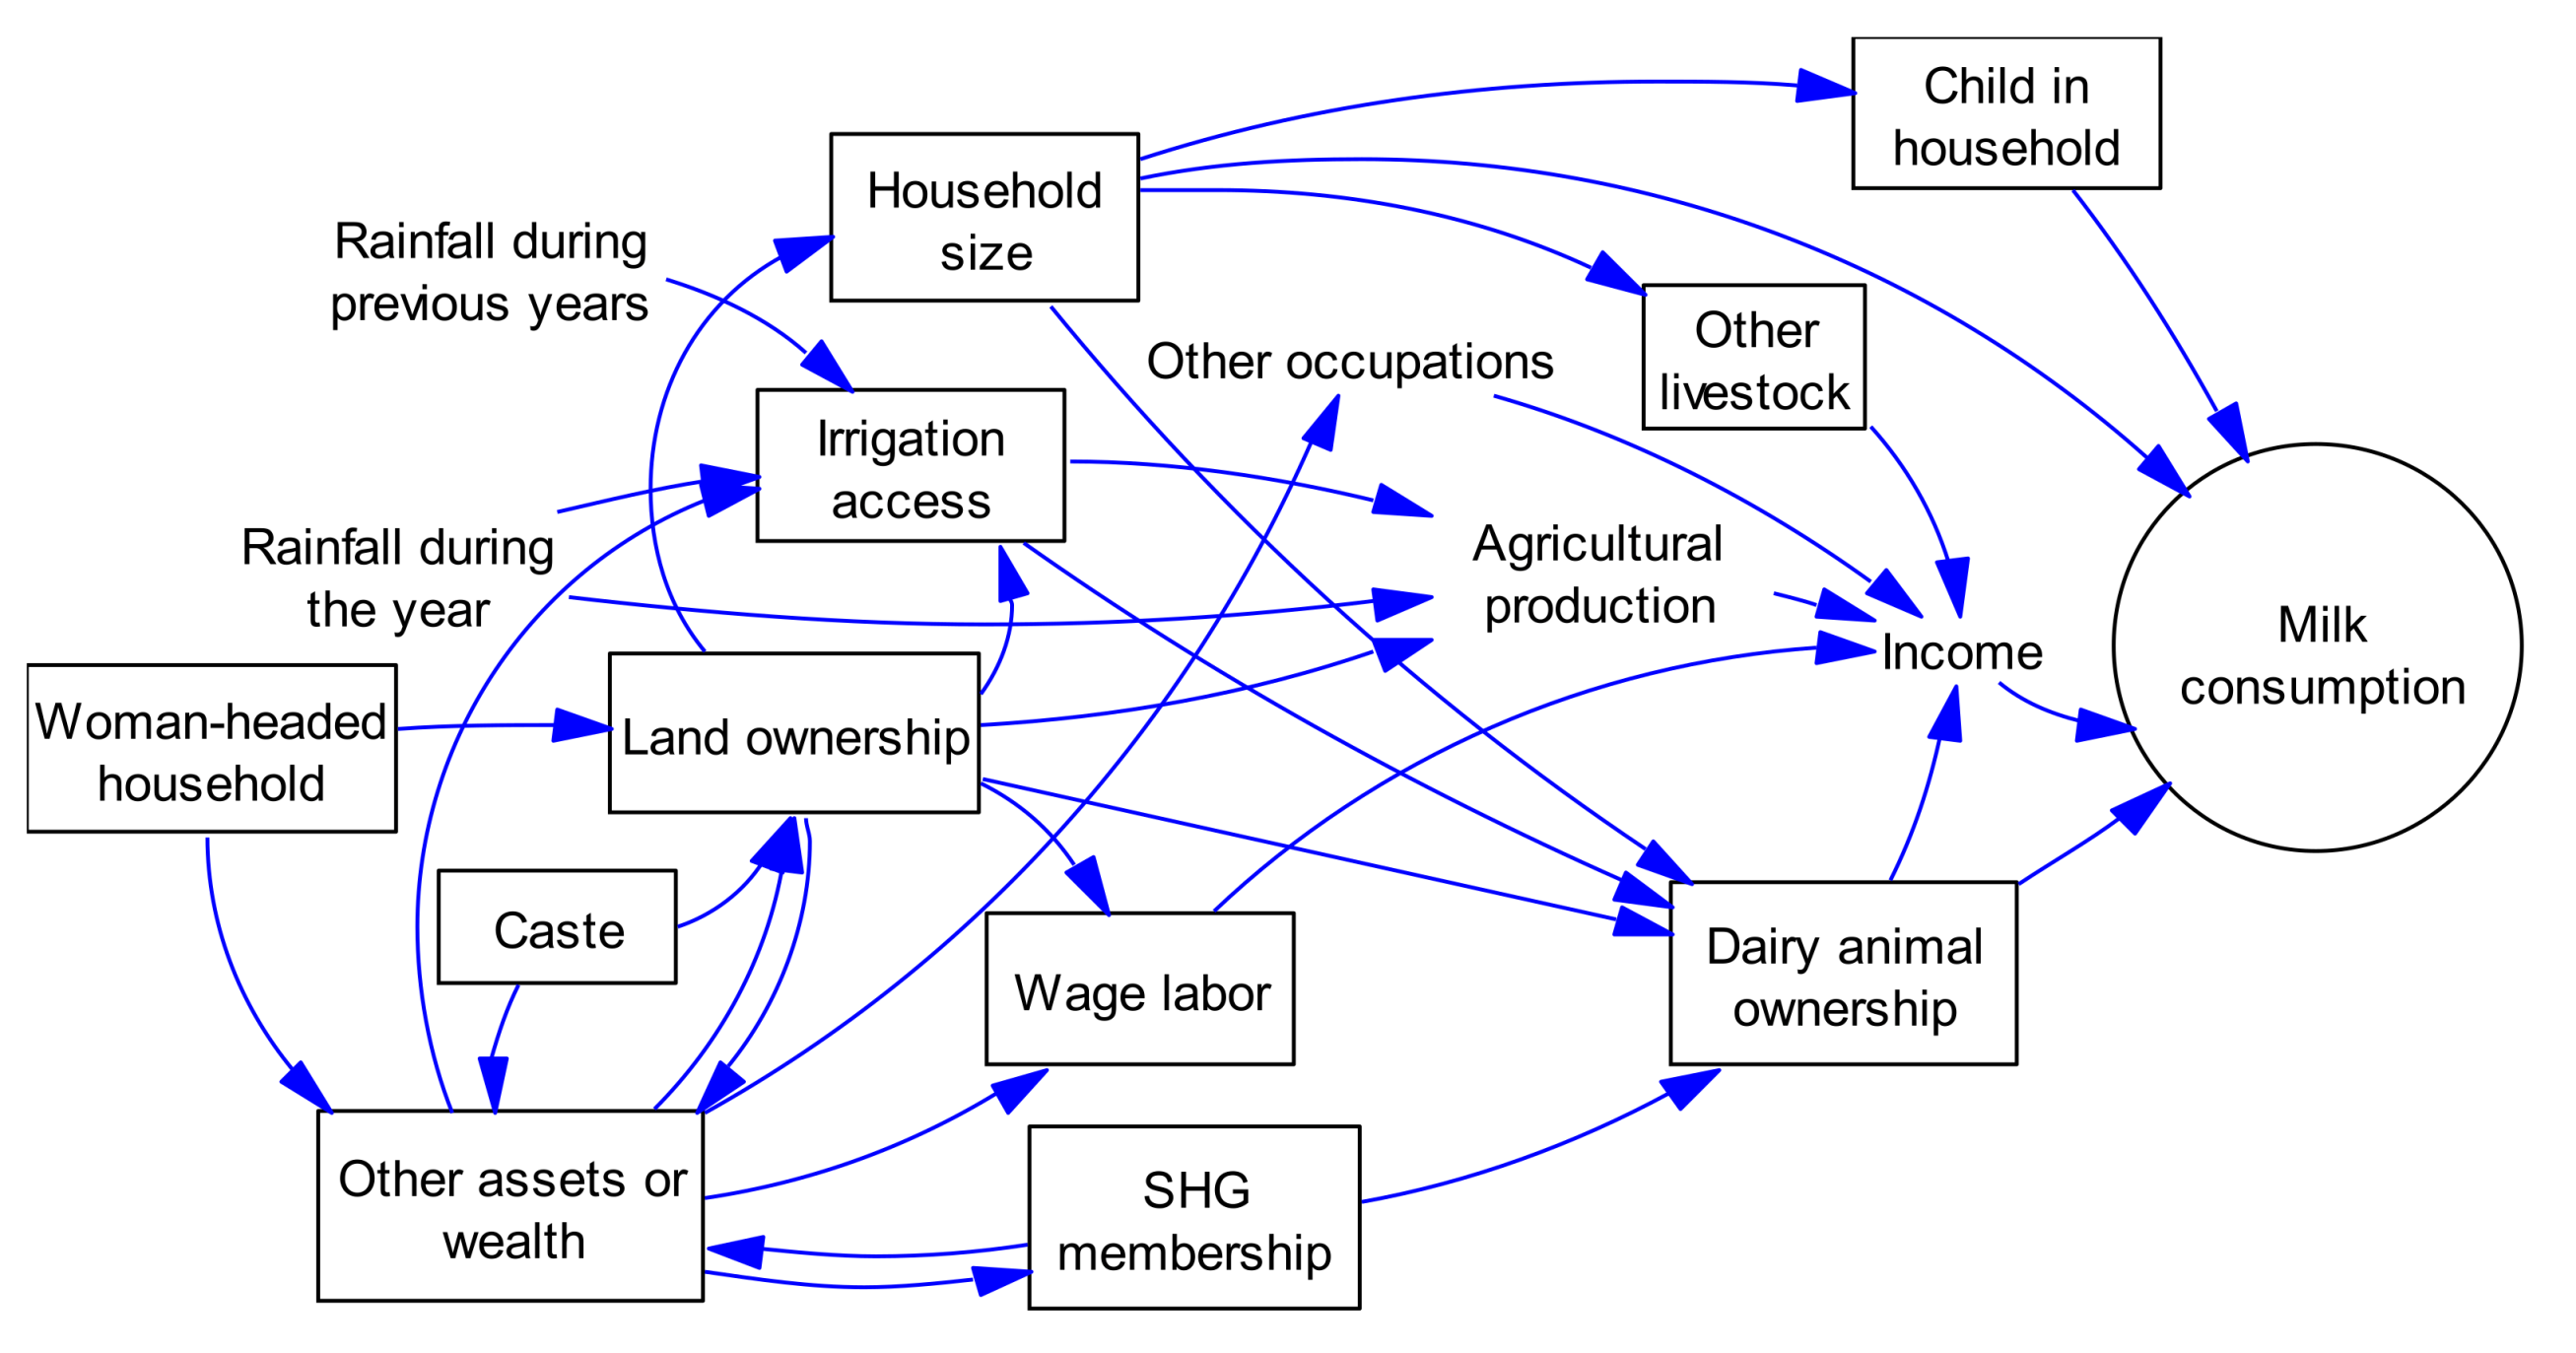
2. Materials and Methods
2.1. Study Design and Study Setting
2.2. Data Collection
2.3. Statistical Analysis
3. Results
3.1. Socio-Demographic Characteristics of the Study Population
3.2. Status of Health Determinants and Correlation of Household Milk Consumption with Dietary Variables
3.3. Association between Ownership of Dairy Animal(s) and Milk Consumption
4. Discussion
4.1. Interpretation from a Household Nutrition Perspective
4.2. Interpretation in the Light of WSD Projects
4.3. Interpreting Effects of Household Size and Wage Labour—Novel Results
4.4. Limitations of the Study
4.5. Scope for Future Research and Practice
5. Conclusions
Author Contributions
Funding
Institutional Review Board Statement
Informed Consent Statement
Data Availability Statement
Acknowledgments
Conflicts of Interest
References
- UN. United Nations Decade of Action on Nutrition 2016–2025—Work Programme; United Nations: New York, NY, USA, 2017. [Google Scholar]
- Murray, C.J.L.; Aravkin, A.Y.; Zheng, P.; Abbafati, C.; Abbas, K.M.; Abbasi-Kangevari, M.; Abd-Allah, F.; Abdelalim, A.; Abdollahi, M.; Abdollahpour, I.; et al. Global Burden of 87 Risk Factors in 204 Countries and Territories, 1990–2019: A Systematic Analysis for the Global Burden of Disease Study 2019. Lancet 2020, 396, 1223–1249. [Google Scholar] [CrossRef]
- India State-Level Disease Burden Initiative Collaborators Nations within a Nation: Variations in Epidemiological Transition across the States of India, 1990–2016 in the Global Burden of Disease Study. Lancet 2017, 390, 2437–2460. [CrossRef] [Green Version]
- IIPS; ICF. National Family Health Survey (NFHS-4), 2015–2016: India; International Institute for Population Sciences: Mumbai, India, 2017. [Google Scholar]
- Kadiyala, S.; Harris, J.; Headey, D.; Yosef, S.; Gillespie, S. Agriculture and Nutrition in India: Mapping Evidence to Pathways. Ann. N. Y. Acad. Sci. 2014, 1331, 43–56. [Google Scholar] [CrossRef]
- Kim, R.; Rajpal, S.; Joe, W.; Corsi, D.J.; Sankar, R.; Kumar, A.; Subramanian, S.V. Assessing Associational Strength of 23 Correlates of Child Anthropometric Failure: An Econometric Analysis of the 2015–2016 National Family Health Survey, India. Soc. Sci. Med. 2019, 238, 112374. [Google Scholar] [CrossRef]
- Pritchard, B.; Rammohan, A.; Sekher, M. Land Ownership, Agriculture, and Household Nutrition: A Case Study of North Indian Villages. Geogr. Res. 2017, 55, 180–191. [Google Scholar] [CrossRef]
- Hoddinott, J.; Headey, D.; Dereje, M. Cows, Missing Milk Markets, and Nutrition in Rural Ethiopia. J. Dev. Stud. 2015, 51, 958–975. [Google Scholar] [CrossRef] [Green Version]
- Minocha, S.; Thomas, T.; Kurpad, A.V. Dietary Protein and the Health-Nutrition-Agriculture Connection in India. J. Nutr. 2017, 147, 1243–1250. [Google Scholar] [CrossRef] [PubMed] [Green Version]
- Government of India. National Livestock Mission—Operational Guidelines; Government of India: New Delhi, India, 2016.
- Bhagowalia, P.; Headey, D.; Kadiyala, S. Agriculture, Income, and Nutrition Linkages in India: Insights from a Nationally Representative Survey; International Food Policy Research Institute: Washington, DC, USA, 2012. [Google Scholar]
- Kabunga, N.S.; Ghosh, S.; Webb, P. Does Ownership of Improved Dairy Cow Breeds Improve Child Nutrition? A Pathway Analysis for Uganda. PLoS ONE 2017, 12, e0187816. [Google Scholar] [CrossRef] [Green Version]
- Pradyumna, A.; Mishra, A.; Utzinger, J.; Winkler, M.S. Perceived Health Impacts of Watershed Development Projects in Southern India—A Qualitative Study. Int. J. Environ. Res. Public. Health 2020, 17, 3448. [Google Scholar] [CrossRef]
- Government of India. Common Guidelines for Watershed Development Projects—2008 (Revised 2011); Government of India: New Delhi, India, 2011.
- Pradyumna, A.; Farnham, A.; Utzinger, J.; Winkler, M.S. Health Impact Assessment of a Watershed Development Project in Southern India: A Case Study. Impact Assess. Proj. Apprais. 2021, 39, 118–126. [Google Scholar] [CrossRef]
- Office of the Registrar General & Census Commissioner. Census of India—District Census Hand Book: Village Amenities (for Karnataka); Government of India: New Delhi, India, 2011.
- BCCI-K. Karnataka Climate Change Action Plan—An Interim Report Submitted by “Bangalore Climate Change Initiate—Karnataka (BCCI-K)” to Government of Karnataka; Bangalore Climate Change Initiate—Karnataka: Bengaluru, India, 2011. [Google Scholar]
- O’Brien, K.; Leichenko, R.; Kelkar, U.; Venema, H.; Aandahl, G.; Tompkins, H.; Javed, A.; Bhadwal, S.; Barg, S.; Nygaard, L. Mapping Vulnerability to Multiple Stressors: Climate Change and Globalization in India. Glob. Environ. Change Hum. Policy Dimens. 2004, 14, 303–313. [Google Scholar] [CrossRef]
- Censis India 2011. Malur Taluk Population Kolar, Karnataka, List of Villages & Towns in Malur Taluk. Available online: https://www.censusindia2011.com/karnataka/kolar/malur-population.html (accessed on 18 May 2021).
- Pradyumna, A.; Farnham, A.; Utzinger, J.; Winkler, M.S. Health of Farming Communities Prior to Modification of the Occupational Environment through a Watershed Development Project in Kolar, India. Indian J. Occup. Environ. Med. 2021. In press. [Google Scholar]
- IIPS. National Family Health Survey-4: District Fact Sheet: Kolar, Karnataka; International Institute for Population Sciences: Mumbai, India, 2016. [Google Scholar]
- Technical Committee on Watershed Programmes in India. From Hariyali to Neeranchal—Report of the Technical Committee on Watershed Programmes in India; Government of India: New Delhi, India, 2006.
- Meenakshi, A.K.; Ramanathan, S. Evaluation of Watershed Programmes and LEISA; MYRADA: Bengaluru, India, 2010. [Google Scholar]
- Hartung, C.; Lerer, A.; Anokwa, Y.; Tseng, C.; Brunette, W.; Borriello, G. Open Data Kit: Tools to Build Information Services for Developing Regions; ACM: New York, NY, USA, 2010; pp. 1–12. [Google Scholar]
- R Core Team. R: A Language and Environment for Statistical Computing; R Foundation for Statistical Computing: Vienna, Austria, 2018. [Google Scholar]
- Azzarri, C.; Zezza, A.; Haile, B.; Cross, E. Does Livestock Ownership Affect Animal Source Foods Consumption and Child Nutritional Status? Evidence from Rural Uganda. J. Dev. Stud. 2015, 51, 1034–1059. [Google Scholar] [CrossRef] [Green Version]
- Fierstein, J.L.; Eliasziw, M.; Rogers, B.L.; Forrester, J.E. Nonnative Cattle Ownership, Diet, and Child Height-for-Age: Evidence from the 2011 Uganda Demographic and Health Survey. Am. J. Trop. Med. Hyg. 2017, 96, 74–82. [Google Scholar] [CrossRef] [Green Version]
- Nicholson, C.F.; Thornton, P.K.; Muinga, R.W. Household-Level Impacts of Dairy Cow Ownership in Coastal Kenya. J. Agric. Econ. 2004, 55, 175–195. [Google Scholar] [CrossRef] [Green Version]
- Romeo, A.; Meerman, J.; Demeke, M.; Scognamillo, A.; Asfaw, S. Linking Farm Diversification to Household Diet Diversification: Evidence from a Sample of Kenyan Ultra-Poor Farmers. Food Secur. 2016, 8, 1069–1085. [Google Scholar] [CrossRef] [Green Version]
- Rawlins, R.; Pimkina, S.; Barrett, C.B.; Pedersen, S.; Wydick, B. Got Milk? The Impact of Heifer International’s Livestock Donation Programs in Rwanda on Nutritional Outcomes. Food Policy 2014, 44, 202–213. [Google Scholar] [CrossRef] [Green Version]
- Sunil, V.R.; Chandel, B.S.; Makarabbi, G. Economics of Milk Production in Mandya District of Karnataka. Econ. Aff. 2016, 61, 659–665. [Google Scholar] [CrossRef]
- Sharif, M.; Dixit, P. Dairy Farming in Southern Karnataka: An Economic Analysis under Varying Groundwater Regimes. Indian J. Dairy Sci. 2015, 68, 65–72. [Google Scholar]
- Basu, P.; Chakraborty, J. Land, Labor, and Rural Development: Analyzing Participation in India’s Village Dairy Cooperatives. Prof. Geogr. 2008, 60, 299–313. [Google Scholar] [CrossRef]
- Thirunavukkarasu, D.; Narmatha, N.; Doraisamy, K.A.; Saravanakumar, V.R.; Sakthivel, K.M. Future Prospects of Smallholder Dairy Production: Pragmatic Evidence from Crop-Livestock Farming Systems of an Economically Transforming State in India. Cuad. Desarro. Rural 2019, 16. [Google Scholar] [CrossRef]
- Joshi, S.; Gokhale, S. Status of Mastitis as an Emerging Disease in Improved and Periurban Dairy Farms in India. Ann. N. Y. Acad. Sci. 2006, 1081, 74–83. [Google Scholar] [CrossRef]
- Daftary, D. Market-Driven Dairying and the Politics of Value, Labor and Affect in Gujarat, India. J. Peasant Stud. 2019, 46, 80–95. [Google Scholar] [CrossRef]
- Winkler, M.S.; Furu, P.; Viliani, F.; Cave, B.; Divall, M.; Ramesh, G.; Harris-Roxas, B.; Knoblauch, A.M. Current Global Health Impact Assessment Practice. Int. J. Environ. Res. Public. Health 2020, 17, 2988. [Google Scholar] [CrossRef] [PubMed]
- IFPRI. Global Nutrition Report 2015: Actions and Accountability to Advance Nutrition and Sustainable Development; International Food Policy Research Institute: Washington, DC, USA, 2015. [Google Scholar]
- Ruel, M.T.; Alderman, H.; the Maternal and Child Nutrition Study Group. Nutrition-Sensitive Interventions and Programmes: How Can They Help to Accelerate Progress in Improving Maternal and Child Nutrition? Lancet 2013, 382, 536–551. [Google Scholar] [CrossRef] [Green Version]


| Variable | Owns Dairy Animal(s) (n = 84) | Does Not Own Dairy Animal(s) (n = 111) | Total (n = 195) |
|---|---|---|---|
| Respondent details | |||
| Age (median [P25–75]) a in years | 34.5 (26.0–41.3) | 35 (28–47) | 35 (27–45) |
| Respondent is female | 75 (89.3%) | 107 (96.4%) | 182 (93.3%) |
| Respondent is illiterate | 42 (50.0%) | 69 (62.2%) | 111 (56.9%) |
| Household characteristics | |||
| Household size (median (P25–75)) | 5 (4.8–7) | 4 (3–5) | 5 (4–6) |
| Under-5 child in household | 23 (27.4%) | 22 (19.8%) | 45 (23.1%) |
| Woman-headed household | 2 (2.4%) | 25 (22.5%) | 27 (13.8%) |
| Caste | |||
| General category | 52 (61.9%) | 68 (61.3%) | 120 (61.5%) |
| Scheduled caste (SC) | 2 (2.4%) | 13 (11.7%) | 15 (7.7%) |
| Scheduled tribe (ST) | 30 (35.7%) | 30 (27.0%) | 60 (30.8%) |
| Primary income source | |||
| Agriculture | 61 (72.6%) | 70 (63.1%) | 131 (67.2%) |
| Daily wage | 14 (16.7%) | 24 (21.6%) | 38 (19.5%) |
| Livestock rearing | 3 (3.6%) | 2 (1.8%) | 5 (2.6%) |
| Other | 6 (7.2%) | 15 (13.5%) | 21 (10.8%) |
| Land ownership in acres b (mean [standard deviation]) | 2.75 [1.47] | 2.09 [1.46] | 2.37 [1.49] |
| Access to irrigation | 49 (58.3%) | 28 (25.2%) | 77 (39.5%) |
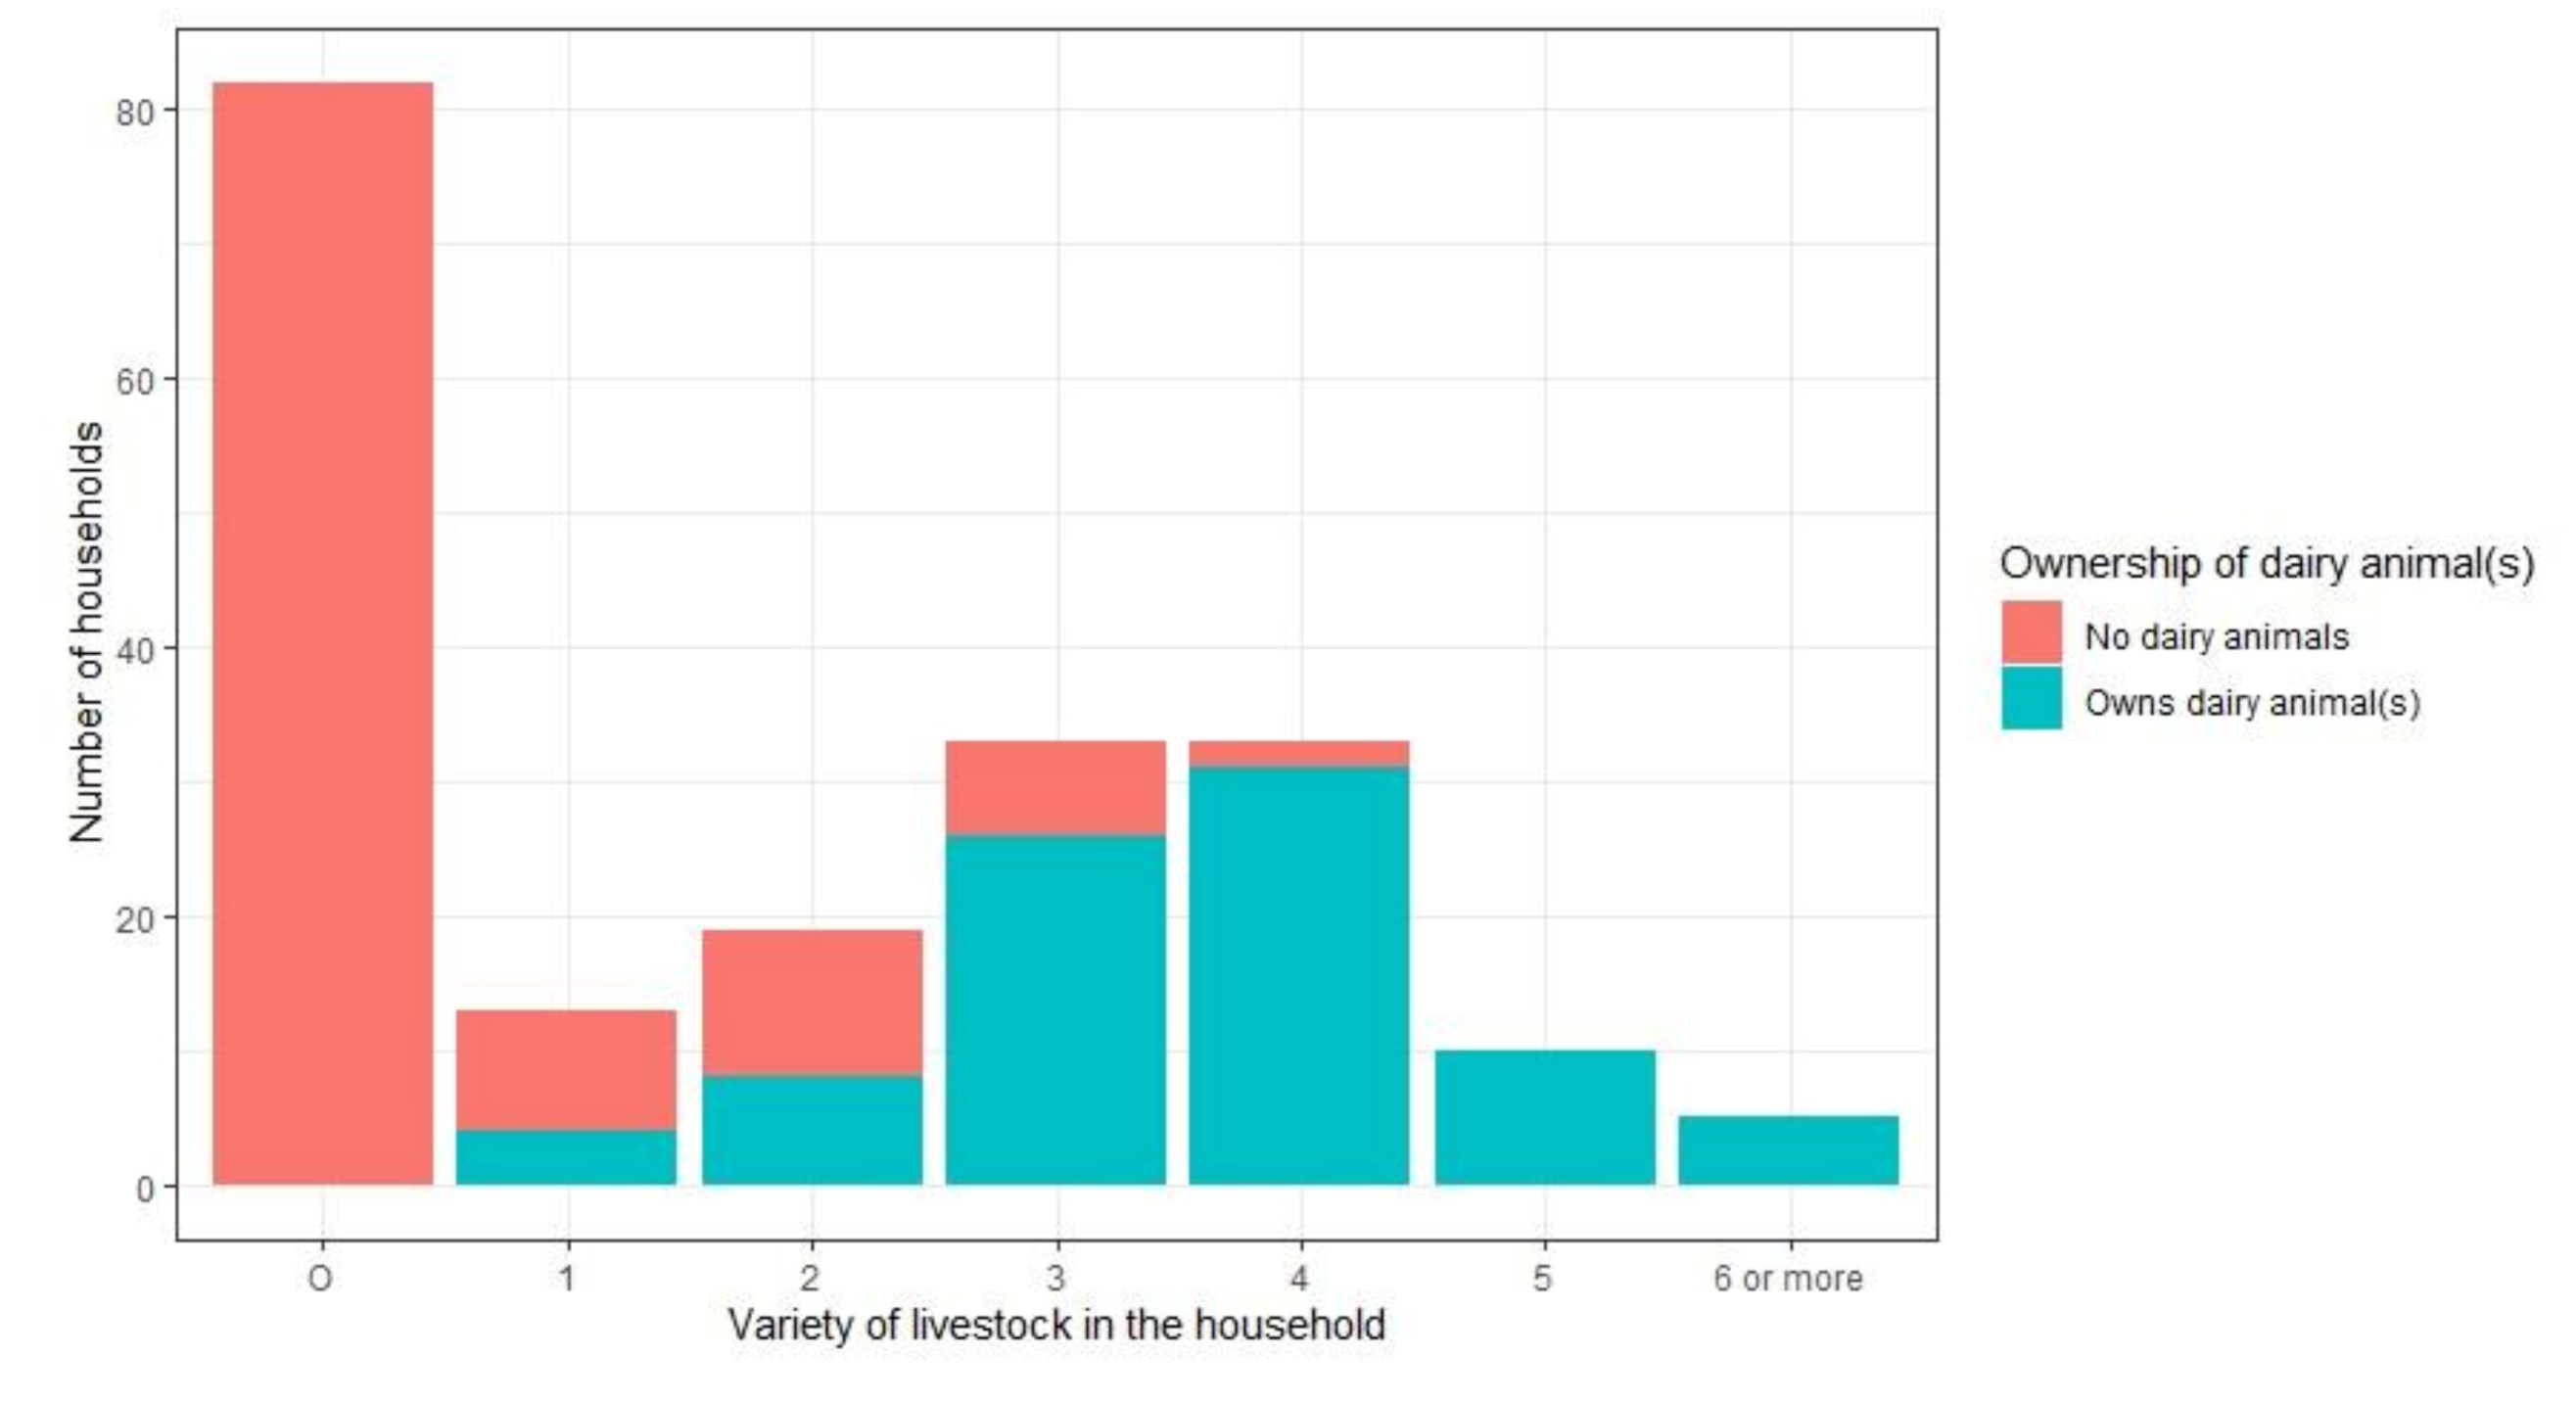
| Owns non-dairy livestock | 80 (95.2%) | 29 (26.1%) | 109 (55.9%) |
| Regular travel for wage labor | 33 (39.3%) | 49 (44.1%) | 82 (42.1%) |
| Undertook seasonal migration | 2 (2.4%) | 10 (9.0%) | 12 (6.2%) |
| SHG membership | 35 (41.7%) | 37 (33.3%) | 72 (36.9%) |
| Owning a motorizedvehicle | 78 (92.9%) | 90 (81.1%) | 168 (86.2%) |
| Social welfare card | |||
| Below poverty line | 77 (91.7%) | 105 (94.6%) | 182 (93.3%) |
| Antyodaya scheme | 7 (8.3%) | 5 (4.5%) | 12 (6.2%) |
| Variable | Owns Dairy Animal(s) (n = 84) | Does Not Own Dairy Animal (n = 111) | Total (n = 195) |
|---|---|---|---|
| Experienced food insecurity in the past two years | 15 (17.9%) | 25 (22.5%) | 40 (20.5%) |
| Consume any milk regularly | 74 (88.1%) | 69 (62.2%) | 143 (73.3%) |
| Variety of vegetables consumed previous week (median (P25–P75) a | 6 (5–7) | 6 (4–7) | 6 (5–7) |
| Egg consumption frequency in a month (median (P25–P75) | 2 (2–4) | 2 (1–3) | 2 (1–4) |
| Meat consumption frequency in a month | 4 (4–4.3) | 4 (3–4) | 4 (4–4) |
| Fruit consumption frequency in a month (median (P25–P75) | 2 (1–3) | 1 (0–2) | 1 (0–2) |
| No knowledge of any iron-rich foods | 2 (2.4%) | 11 (9.9%) | 13 (6.7%) |
| Latrine ownership | 79 (94.0%) | 102 (91.9%) | 181 (92.8%) |
| Any member consumesalcohol | 7 (8.3%) | 20 (18.0%) | 27 (13.8%) |
| Any member smokes | 11 (13.1%) | 20 (18.0%) | 31 (15.9%) |
| Any member chews tobacco | 21 (25.0%) | 25 (22.5%) | 46 (23.6%) |
| First choice healthcare provider for fever | |||
| Local government hospital | 50 (59.5%) | 91 (82.0%) | 141 (72.3%) |
| Local private doctor | 32 (38.1%) | 17 (15.3%) | 49 (25.1%) |
| Health insurance cover | |||
| Governmental schemes | 34 (40.5%) | 51 (45.9%) | 85 (43.6%) |
| Private | 1 (1.2%) | 0 (0.0%) | 1 (0.5%) |
| None | 49 (58.3%) | 60 (54.1%) | 109 (55.9%) |
| Factor Related to Dietary Quality | Kendall’s tau | p-Value |
|---|---|---|
| Variety of vegetables consumed | 0.163 | 0.017 * |
| Frequency of fruit consumption | 0.016 | 0.816 |
| Frequency of egg consumption | 0.265 | <0.001 * |
| Frequency of meat consumption | 0.139 | 0.049 * |
| Variable | Crude OR (95% CI) | Adjusted OR (95% CI) | SA: Adjusted OR (95% CI) |
|---|---|---|---|
| Owns dairy animal(s) | 4.50 (2.17–10.14) *** | 2.11 (0.87–5.45) | 2.20 (0.77–6.45) |
| Household size | 2.00 (1.56–2.66) *** | 1.88 (1.34–2.77) *** | 1.62 (1.06–2.77) |
| Woman-headed household | 0.19 (0.08–0.43) *** | 0.78 (0.25–2.58) | NA |
| Whether SC a | 2.50 (0.66–16.35) | - | - |
| Whether ST a | 1.13 (0.57–2.32) | - | - |
| Whether general caste | 0.71 (0.36–1.37) | 0.71 (0.31–1.58) | 0.36 (0.1–1.14) |
| Child in household | 1.92 (0.86–4.73) | 0.48 (0.16–1.45) | 0.73 (0.15–4.16) |
| Wage labor main income source | 0.87 (0.4–1.97) | 2.89 (1.04–9.03) | 2.01 (0.52–9.17) |
| Land owned | 1.67 (1.23–2.35) ** | 1.06 (0.8–1.47) | 1.8 (0.96–3.92) |
| Irrigation access | 3.19 (1.57–6.99) ** | 1.30 (0.53–3.29) | 1.75 (0.55–5.74) |
| SHG member | 1.29 (0.67–2.56) | 1.04 (0.47–2.37) | 3.38 (0.97–14.98) |
| Owns motorised vehicle | 9.72 (4.04–25.4) *** | 4.08 (1.23–14.31) * | 1.21 (0.19–6.53) |
| Any non-dairy livestock owned b | 3.71 (1.92–7.42) *** | - | - |
Publisher’s Note: MDPI stays neutral with regard to jurisdictional claims in published maps and institutional affiliations. |
© 2021 by the authors. Licensee MDPI, Basel, Switzerland. This article is an open access article distributed under the terms and conditions of the Creative Commons Attribution (CC BY) license (https://creativecommons.org/licenses/by/4.0/).
Share and Cite
Pradyumna, A.; Winkler, M.S.; Utzinger, J.; Farnham, A. Association of Livestock Ownership and Household Dietary Quality: Results from a Cross-Sectional Survey from Rural India. Int. J. Environ. Res. Public Health 2021, 18, 6060. https://doi.org/10.3390/ijerph18116060
Pradyumna A, Winkler MS, Utzinger J, Farnham A. Association of Livestock Ownership and Household Dietary Quality: Results from a Cross-Sectional Survey from Rural India. International Journal of Environmental Research and Public Health. 2021; 18(11):6060. https://doi.org/10.3390/ijerph18116060
Chicago/Turabian StylePradyumna, Adithya, Mirko S. Winkler, Jürg Utzinger, and Andrea Farnham. 2021. "Association of Livestock Ownership and Household Dietary Quality: Results from a Cross-Sectional Survey from Rural India" International Journal of Environmental Research and Public Health 18, no. 11: 6060. https://doi.org/10.3390/ijerph18116060