Abstract
Over the past decades, both the quantity and quality of food supply for millions of people have improved substantially in the course of economic growth across the developing world. However, the number of undernourished people has resumed growth in the 2010s amid food supply disruptions, economic slowdowns, and protectionist restrictions to agricultural trade. Having been common to most nations, these challenges to the food security status of the population still vary depending on the level of economic development and national income of individual countries. In order to explore the long-run determinants of food supply transformations, this study employs five-stage multiple regression analysis to identify the strengths and directions of effects of agricultural production parameters, income level, price indices, food trade, and currency exchange on supply of calories, proteins, and fats across 11 groups of agricultural products in 1980–2018. To address the diversity of effects across developing nations, the study includes 99 countries of Asia, Europe, Latin America, the Middle East, and Africa categorized as low-income, lower-middle-income, and upper-middle-income economies. It is found that in low-income countries, food supply parameters are more strongly affected by production factors compared to economic and trade variables. The effect of economic factors on the food supply of higher-value food products, such as meat and dairy products, fruit, and vegetables, increases with the rise in the level of income, but it stays marginal for staples in all three groups of countries. The influence of trade factors on food supply is stronger compared to production and economic parameters in import-dependent economies irrelevant of the gross national income per capita. The approach presented in this paper contributes to the research on how food supply patterns and their determinants evolve in the course of economic transformations in low-income countries.
1. Introduction
Dietary patterns in various parts of the world are affected by a complex mix of variables that evolve over time. Since the 1980s, many countries of the world have demonstrated significant progress in improving the food security status of their populations and lifting people out of extreme poverty. Over a third of the world suffered from extreme poverty four decades ago, while only one-tenth of people lived below the international poverty line in the mid-2010s [1], the lowest level in recorded history [2]. Food security policies and interventions focused on agricultural production in the world’s poorest countries allowed to substantially increase food supplies, improve the quality of nutrition, and meet at least basic dietary energy needs [3]. The nutrient adequacy of diets became a core factor of food security and public health programs across the developing world.
The ways in which people modify their diets vary according to the income level [4,5,6], availability and affordability of healthy foods [7], domestic agricultural production and trade [8], stability of food supply [9], and many other determinants. Recent literature in the sphere of food security has emphasized the need for a complex approach to revealing how healthy diets are differently affected by a set of production, economic, and trade factors of food security [7]. Despite the efforts to combat malnutrition, the number of undernourished people has resumed growth in 2015 [10]. According to the estimations made by the Food and Agriculture Organization (FAO) and the World Health Organization [11], more than 1.3 billion people do not have regular access to nutritious and sufficient food, while over 690 million people suffer from hunger [3]. In 2020, the economic decline and disruption of food production and supply chains due to the COVID-19 pandemic have merely deepened the food insecurity problem, as the number of people suffering acute hunger appeared to double [12], while that of undernourished increased by at least 80 million people [3]. In many economies of Africa and Latin America, debt has increased significantly during the last decade [13], thus contributing to weakening growth prospects and challenging food security. If the negative trend continues, the FAO projects the number of undernourished people in the world to exceed 840 million in 2030 [3].
Lower incomes degrade dietary choices [8], as do agricultural production disruptions and food chain breakups [14]. In response to a degrading food security situation, people are forced to compromise on the nutritional quality of the food they consume, as well as reduce consumption. According to Laborde et al. [15], in low-income countries, poor households spend over 25% of their total income on staple foods and about half of their income on unprocessed nonstaple foods such as fruits, vegetables, and animal-source products. The diets become less diversified and less healthy as people cut consumption of pricier nonstaples. Recent systematic reviews and meta-analyses by Alarcon et al. [16] and Rousham et al. [17] report the increase in consumption of cheap, nutrient-poor, calorie-rich, and ultraprocessed foods not meeting international recommendations on salt, sugar, and fat levels [18]. These shifts in consumption patterns have large impacts on nutrition security and increase the risk of health consequences [19]. The achievements in the sphere of public health have remained rather modest in the least-developed and lower-income countries. At least 30% of the world’s population is affected by some form of malnutrition, including stunting, wasting, overweight, micronutrient deficiencies, or nutrition-related noncommunicable diseases (NCDs) [20]. Low-income economies of Africa and Asia concentrate about 94% of all stunted children in the world [3]. As found by Hirvonen et al. [21], dietary adjustments reduce the quality of nutrition and increase deficiencies of micronutrient consumption with potentially lasting adverse consequences for human health, especially for children, young people, and women of reproductive age [8]. For instance, the WHO [22,23] reports anemia becoming an increasingly challenging nutrition target to monitor globally.
Proceeding from the outlined tendencies in food consumption, this study aims to reveal how production, economic, and trade factors affect food supply patterns across a variety of country income groups and regions. The three hypotheses established in Section 2 test the specifics and major determinants of the supply of calories, proteins, and fats in diverse economic environments.
2. Theoretical Framework and Hypotheses
The theoretical framework employed in this study is based on the production–income–trade triangle that has been widely defined to be a cornerstone in the quality of diets in low-income countries [24,25]. Dual-process theories suggest that under economic stress, people tend to make no optimal food consumption choices [26]. Concerning healthy eating, this means that budgetary constraints could result in intuitive consumption decisions based on prices or physical availability of certain foods rather than their health benefits. Mackenbach [27] and Jetter et al. [28] acknowledge that the recognition of systematic determinants of food choices inspired by affordability and availability factors is crucial in understanding food supply patterns in poorer communities. Although some scholars have advocated for considering the systemic interactions of the three drivers of nutrient supply [7], this has been rarely done in relation to different country income groups within the same study. The FAO [3] reports that in lower-income countries, diets include more staple foods and less high-nutrient animal-source products, fruit, and vegetables compared to higher-income societies. According to Ranjit et al. [29] and Prabhakar et al. [30], food consumption habits and practices are less diversified among food-insecure low-income populations, where domestic sources of food supply prevail. Low-income countries rely more heavily on locally produced cereals, roots, tubers, and plantains (nearly 60% of aggregated food supply) than higher-income economies (only 22% of food supply). In view of such reliance, since the 1980s, nutrition improvement policies across the poorest countries have particularly emphasized the production of staple foods [31] with less attention given to the nutritional diet quality. As shown by Urgell-Lahuerta et al. [32], Malaiarasan et al. [33], and Herrera-Cuenca et al. [34], food intervention programs based on locally produced staples rarely diversify between people with health issues (diabetes, kidney disease, etc.) or population groups with special needs such as the elderly, pregnant women, and children. The per capita availability of cereals, roots, tubers, and plantains has increased driven by a rise in supply in Africa and some parts of Southeast Asia, but the quality of diets remains a problem. Therefore, it is safe to hypothesize that in Hypothesis 1.
Hypothesis 1.
Low-income countries, diets are predominantly based on locally produced staples, while an adequate supply of calories and nutrients is mainly ensured by production factors.
However, there remains the problem of poor year-round access to economically affordable sufficient diets in the majority of low-income communities. This puts a spotlight on nonproduction aspects of diet quality in the nutrition policy debate in developing countries. The income-related discrepancies in the per capita availability of foods have become particularly evident recently despite all efforts on combating economic inequality between and within countries. According to Beaulac et al. [35] and Hendrickson et al. [36], the evidence of poorer access to healthy food in lower-income and minority areas could be found even in developed countries. In the poorest communities, however, this problem has manifested itself most dramatically. Meira et al. [4], Rizky Maulidiana and Sutjiati [37], Smita et al. [38], and Carpio et al. [39] demonstrated the pivotal role of the level of income in establishing food consumption patterns in the least-developed economies. Wu et al. [40], Arce et al. [5], and Ranjit et al. [29] found economic factors to influence the intake of value-added nutrient-rich products, but such an effect could be expected. What is more striking is the dependence of staple intake on the level of income revealed by Sarica et al. [41], Sikandar et al. [42], and Qiu et al. [43].
Over the past decades, food security interventions have shifted from closing the dietary energy gap by means of increased production of staples to making diets more affordable in economic terms [44]. Malaiarasan et al. [33] and Urgell-Lahuerta et al. [32] demonstrated positive shifts in nutritional intake due to food interventions and price subsidies in low- and middle-income countries, irrespective of the actual income level of households. Due to a limited capacity to produce staple crops domestically, low-income economies are rather vulnerable to food inflation and other economic determinants of food consumption, such as per capita income [10]. According to Hussein et al. [45], nutrient intake in food-insecure least-developed countries is extremely sensitive to income shocks, especially for animal products which are the main sources of protein. However, the evidence of the economic factors–food supply relationship is inconclusive. Reeves et al. [46], Otsuka [47], Power [48], Esturk and Ören [49], Smith et al. [50], and Sonnino et al. [51], among others, demonstrated the likelihood of diets’ diversity and nutrient value to degrade with income inequality, while Elbushra and Ahmed [52], Ritchie et al. [53], and Thome et al. [54] found cointegration between economic parameters and food supply to be rather weak. According to the FAO [3], a key reason for growing food insecurity in developing countries is that many people cannot afford the increasing cost of healthy diets. The latter exceeds average food expenditures throughout Africa and Southeast Asia, where around 57% of the population cannot afford a healthy diet [3]. In lower-middle-income economies, where people are moderately food-insecure compared to low-income countries, typical diet composition is particularly determined by purchasing power of the population and prices of food and agricultural products. Nutritious foods are more expensive than energy-dense foods [55], and poverty constrains adequate access to healthy foods. Reducing food prices and increasing incomes can be an effective way of raising the overall supply of food and diversifying diets away from staples. Proceeding from this reasoning, we suggest the Hypothesis 2.
Hypothesis 2.
The rise in a gross national income per capita stipulates a stronger influence of economic factors on food supply compared with that of production factors.
In addition to low productivity, income inequality, and food inflation, food supply in many low-income countries critically depends on international trade. Integration of domestic supply chains into the global food market is widely viewed as a way to stabilize access to food in periods of domestic shortages [56,57]. It can also improve the availability of major foods by complementing the production capacity of the domestic agricultural sector [58,59]. Over the decades, food trade has become unprecedentedly liberalized within the World Trade Organization (WTO) multilateral framework and regional trade agreements. Since the 1980s, progressing globalization and trade have transformed food consumption patterns [60] and blended territorial diets. As shown by Drewnowski and Popkin [61] and Haddad et al. [62], dietary patterns in faster-growing developing economies have shifted more substantially from energy-dense staples to diets with a higher proportion of energy from animal-source foods. The standard conclusion drawn by many scholars, including Smith and Glauber [56], Yeung et al. [63], and Verter [64], among others, is that the importance of international trade in establishing sustainable food and nutrition security in developing countries is likely to increase in both the medium and long term. The FAO [3] observes most of the global increases in animal-source foods to occur in upper-middle-income countries, primarily, in Asia. The contribution from animal-source foods to a typical diet in upper-middle-income economies has reached 20% compared with only 11% in low-income countries [3]. Due to trade, territorial diets have become less linked to specific regions of the world [65], while in many low-income countries, food consumption habits have increasingly focused on added sugars and fats of high energy density and low nutritional value to the disadvantage of fruits, vegetables, and other forms of dietary fiber such as whole grains [66,67]. Since the early 2010s, the global agricultural market has been increasingly distorted by protectionist measures and trade restrictions imposed by major actors, such as the USA, Russia, and the EU [30,57]. Such policies contribute to distorting food supply chains, thereby threatening food security in low-income countries, many of which are net importers of food and agricultural products [68]. While lower-income countries rely on less-diversified, cheaper food imports [59], we assume as Hypothesis 3.
Hypothesis 3.
Higher-income economies which are more deeply integrated into global food chains experience a stronger influence of trade factors on domestic food supply compared to production and economic determinants.
Section 3 establishes the approach to testing the three hypotheses; Section 4 presents major results; Section 5 discusses findings through the supply–production, supply–income, and supply–trade lens; and Section 6 summarizes the test outcomes and outlines future research directions and potential policy implications of the study.
3. Materials and Methods
The methodology was built on revealing the effects of three categories of production, trade, and economic variables Xn on the parameters of food intake Yn across low-income, lower-middle-income, and upper-middle-income economies in six regions of the world. The study employed the algorithm as specified in Table 1 and detailed in Section 3.1, Section 3.2, Section 3.3, Section 3.4 and Section 3.5.

Table 1.
Study algorithm: stages, methods, and results.
3.1. Variables
The assessment of food supply quantity and diet quality has not been unified internationally. No composite index has been validated to measure the production, economic, and trade dimensions of diet quality [69,70]. One of the common approaches to measuring the food supply available for human consumption is to divide the respective quantity of primary agricultural products and the number of processed commodities by the population actually partaking in them. In terms of quantity, the FAO [71] reports data on food supplies as per capita daily calorie intake. FAO Food Balance Sheets (FBS) have been widely used as a proxy of the national average food supply to identify multiple aspects of dietary patterns in developing countries. For some low-income nations, the FBS is the only data source available for studying food consumption patterns over a long period of time. Therefore, we used the food supply dependent variable Y1 to estimate the average apparent intake of dietary energy in daily kilocalories per capita. A sufficient intake of calories to support energy balance for work and other activities every day is a benchmark of the energy-sufficient diet that is identified by the absolute lowest cost of meeting calorie needs from the cheapest starchy staple available in a country [3]. Alternatively, the nutrient-adequate diet provides not only a sufficient quantity of calories but also a qualitatively balanced mix of nutrients. To reflect the ability of a country’s food system to ensure affordability of major nutrients in the required proportions, we expressed the data on per capita food supplies in terms of protein (Y2) and fat (Y3) content (Table 2).
Table 2.
Regressands and regressors used in the study.
The overall calorie supply and protein and fat content were obtained from the FAO’s database [71] for 11 groups of food products out of 19 categories classified by the FAO/WHO Global Individual Food Consumption Data Tool [74] based on their nutritional relevance. The modifications were made to cater to the availability of data on Y1–3 variables in the entire period of 1980–2018, as well as the specifics of diets in particular regions included in the study. Thus, we included subcategories “Fruit, citrus” and “Fruit, tropical fresh” to Yn.2 group and “Vegetables, leguminous” to Yn.3 group and specified subcategories of meat in Yn.7 group instead of “Red meat” and “Processed meat” used in the original FAO classification (Table 3).
Table 3.
Regressands and corresponding food group classifications used in the study.
Proceeding from the hypotheses established above, three categories of regressors were used to reflect the production (X1–3), economic (X4–7), and trade (X8–10) dimensions of effects on the intake of calories and nutrients. The food supply available in a country is the result of the total quantity of foodstuffs produced domestically (X1) added to the total quantity imported (X9) and adjusted to any change in supply that may have occurred because of export (X8) [3]. In developing economies, where a significant portion of GDP comes from primary sectors, the contribution of domestic production to food availability critically depends on the performance of the agricultural sector and its portion in the gross product (X3). In terms of the per capita food supply, the availability parameters are reflected by the gross per capita agricultural production index (X2). Low economic access to energy-sufficient and nutritionally adequate diets is one of the crucial factors of food insecurity. According to the FAO [3], costly and unaffordable healthy diets are associated with the increase in all forms of malnutrition not only in low-income countries but across the developing world, with over 1.5 billion people who cannot afford a diet that meets the required levels of essential nutrients. Therefore, we used income (X4) and price (X5–7) parameters to see how calories intake patterns have been transformed under the influence of economic factors.
3.2. Collinearity
When establishing multiple regression models, it is crucial to exclude regressors that strongly correlate with each other. This is done to eliminate the distorting effects of collinear variables on the regression analysis results. To ensure the robustness of the models, we employed the variance inflationary factor (VIF) test, one of the most commonly used approaches for measuring and reducing collinearity [75,76,77,78]. As recommended by Montgomery et al. [79], Kutner et al. [80], Snee [81], and Levine et al. [82], among others, when for a pair of regressors VIF > 5, such variables are considered collinear and excluded from the model. Following this guidance, at Stage 2, we checked sets of Xn variables for collinearity and eliminated those for which the VIF exceeds 5. The calculation was performed for 10 multitudes of X1–10 regressors per country included in the study, a total of 990 calculations (see Section 3.4 for the list of countries).
3.3. Redundancy
At Stage 3, we proceeded with the resulting sets of non-collinear Xn regressors and tested whether all of them yield low-redundant regression models. According to Johnsson [83], Zhou and Jiang [84], Evans [85], and Qi et al. [86], when regression analysis involves a significant quantity of data, regression models can be tested for redundancy without checking all sets of independent variables. As shown by Gupta [87], Hosmer et al. [88], and Sullivan and Wilson [89], this can be done by applying the stepwise regression technique. Among the stepwise regression variations, the best subsets approach (BSA) has gained particularly widespread acceptance in contemporary studies on multicollinearity [10,90,91] and prediction of interactions between variables in large arrays [92,93,94].
The BSA approach is based on the adjustment of R2 values in individual Y–X multitudes to account for the number of regressors and the sample size [82,95]. Due to the fact that at Stage 3 we compared non-collinear sets of Xn variables with different numbers of regressors, the application of adjusted R2 instead of R2 was preferable. The goal was to identify the dataset with the largest adjusted R2, which was then used at Stage 4 for regression analysis. According to Ermakov et al. [96], Nikolov and Stoimenova [97], and Alshqaq and Abuzaid [98], such a goal can be achieved by using a criterion of Mallows’ Cp statistic. Following the results of Hansen [99], Irurozki et al. [100], Liao and Zou [101], Feng et al. [102], and Aydin and Yilmaz [103], we utilized the Cp criterion to measure the differences between the models constructed at Stage 2 and optimal (or true) models that best explain the correlations. The closer the Cp is to the number of variables in a dataset, the more accurate the model would be (only random differences from the optimal model might occur) [10]. Thus, Stage 3 resulted in identifying the sets of variables where Cp was close to or below (k + 1) (where k is the number of regressors).
3.4. Regression
Having checked the collinearity of Xn variables and redundancy of the established multitudes, we proceeded with multiple regression analysis across all non-collinear regressors aggregated in 33 datasets separately for each of the three Yn (Table 2) in 11 food groups (Table 3). The Yn and Xn parameters were aggregated from 1980 through 2018 from 99 countries categorized as low-income (22 countries), lower-middle-income (37 countries), and upper-middle-income economies (40 countries) according to the World Bank Country Classification [104]. Averaged values are presented in Appendix A, Table A1, Table A2 and Table A3, for Yn and Appendix B, Table A4, Table A5 and Table A6, for Xn. To capture potential divergences in both calorie intake patterns from particular local foods and economic, production, and trade specificities in particular locations, we selected the countries from six regions of Africa, Asia, Latin America, and the Middle East (Table 4).
Table 4.
Countries included in the study.
3.5. Strength and Direction of Relationships
The study was finalized by revealing the positive and negative impacts of Xn regressors on Yn regressands separately for the three groups of countries and six regions. Based on the scale previously tested in Gao and Erokhin [10], positive effects were differentiated as highly positive (HP), positive (P), and marginally positive (MP); the negative ones were differentiated as extremely negative (EN), negative (N), and moderately negative (MN) (Table 5).
Table 5.
Xn intervals and effects on Yn.
To determine to which of the six options Xn falls, the two Xmax and Xmin extremes were excluded from the model (Equation (1)) and then the Xmean value was calculated for each of the multitudes.
The effects in X–Y multitudes were measured and classified for 990 sets of regressors and regressands (33 Yn (3 Y regressands and 11 food groups) and 10 Xn regressors in 3 groups of economies).
4. Results
Collinearity was checked across X1–10 variables in 99 countries included in the study. Established regression multitudes were calculated with all ten regressors to find the variance inflationary factor values and eliminate those Xn for which VIF exceeds 5 (or R2 > 0.8). Further application of the best-subsets stepwise regression to the remaining Xn allowed us to check whether any of the collinear regressors were not detected by the VIF method (Table 6). Based on the adjusted coefficient of multiple determination and Mallows’ Cp statistic, the best subsets of Xn were selected out of competing multitudes for each country.
Table 6.
Collinearity check and selection of the best subsets.
Having established non-collinear arrays of independent variables, we then performed multiple regression analysis for 99 countries (33 multitudes for each country) and generalized the results for the three categories of economies.
In low-income economies, the production-related variables X1–3 exert prominent positive influence over all three regressands (Table 7). We register highly positive effects of gross agricultural production value (X1) and gross per capita agricultural production index (X2) on calorie and protein supply from cereals and tubers and fat supply from meat, dairy products, and animal and plant oils. This confirms our assumption that in low-income countries, food security is primarily ensured by the availability of domestically produced staples, such as cereals, roots, tubers, plantains, vegetables, and meat.
Table 7.
The effects of Xn on Yn in low-income economies.
Compared to the production variables, the effects of economic and trade regressors on food, protein, and fat supply in low-income countries are both less pronounced and more heterogeneous. Calorie supply is moderately affected by the per capita value of the nominal gross national income. This could be explained by the overall low value of X4 and insignificant differences in this parameter across all countries included in the low-income group. Price-related parameters X5–7 are more influential, with negative extremes in major food groups (cereals, roots, tubers, and pulses). The strongest influence of economic parameters on the per capita supply of calories and nutrients is revealed in the SSA countries (Burkina Faso, Ethiopia, Guinea, Mali, Mozambique, and Sierra Leone), as well as in CA and MENA regions (Tajikistan, Yemen). This finding indicates that rising commodity price and consumer price indices substantially deteriorate calorie and nutrient supply across low-income countries as food inflation is tightly linked with poorer economic access to staples.
Trade positively affects food supply, particularly when we assess the import of value-added processed foods, including meat, milk, and dairy products. In most low-income countries, the domestic supply of a high-calorie diet is scarce, which is why imports appreciably improve food availability. In sub-Saharan Africa (Burkina Faso, Chad, Mali, Niger, and Tanzania), imports of food and agricultural products are identified to be effective at increasing the food supply. However, we see that currency exchange adversely affects economic access to imports, making food from abroad less affordable when local currency depreciates. Extremely negative effects of X10 on Yn are most noticeable for higher-value meat and dairy imports. In the same vein, in lower-middle-income countries, economic effects are more prominent in higher-value food groups. In favor of Hypothesis 2, we see that the calorie supply in the “Meat and meat products” and “Milk and dairy products” categories is highly positively linked with the per capita value of nominal gross national income. Nevertheless, for lower-valued staples, the relationship between X4–7 and Yn is weaker (Table 8).
Table 8.
The effects of Xn on Yn in lower-middle-income economies.
Similar to low-income countries, such a weak cointegration between economic variables and calorie supply in lower-middle-income economies could be explained by the high portion of locally produced staples in a diet. This effect is noticeable in the SA countries (Cambodia, India, Indonesia, Pakistan), where the portion of locally produced seasonal food in consumption is higher than in Africa and other regions included in the study. In Cote d’Ivoire, Nigeria, Zambia, Kenya, and some other SSA countries, the diversity of locally produced staples is narrower compared to Asia. When a portion of marketed food in supply is higher, economic parameters have a more meaningful effect in aggravating the quality of diets. Amid rising price indices and falling currency exchange rates, food purchases from abroad go down. The effects of X5–7 and X10 on the supply of calories, proteins, and fats are predominantly negative.
The strength of the X8–10–Yn relationship depends on the self-sufficiency degree of a country rather than the level of income. This confronts our suggestion that food supply in lower-middle-income economies is primarily affected by nontrade factors. In the countries where a large portion of the food availability in the domestic market is ensured by imports, currency exchange negatively influences the quantity of protein and fat supply. The stronger link between food supply parameters and trade-related variables in lower-middle-income economies compared to low-income countries stems from the fact that the former import higher-quality and pricier food products.
Upper-middle-income economies are more deeply integrated into global food supply chains compared to low-income and lower-middle-income countries. From this perspective, in furtherance of Hypothesis 3, the most significant causal relationships between trade-related variables X8–10 and the three regressands are found in this array of countries, especially in those with the highest value of nominal gross national income per capita (Brazil, Turkey, Russia, Colombia, Peru). As distinguished from the other two categories, in upper-middle-income economies, we see a prominent positive effect of food exports on the quantity of the supply of calories, proteins, and fats domestically (Table 9). This counterintuitive correlation can be explained by the role of food exports in establishing national income. Higher exports contribute to the growth in nominal gross national income per capita, which is then translated into stronger purchasing power in the domestic market and improved economic access of people to more qualitative and diverse diets [105].
Table 9.
The effects of Xn on Yn in upper-middle-income economies.
Dismissing the suggestion that the influence of economic factors on calorie supply quantity diminishes with the growth in the level of income, the X4–Yn effect is found to be the strongest in upper-middle-income countries. It is highly positive not only for meat and dairy products, but also for lower-value staples, such as cereals, vegetable oils, and animal fats. This finding relates to the fact that in higher-income countries, diets are more diversified compared to lower-income economies, and the economic effects on calorie supply spread from high-value categories to a greater variety of foods, including staples. At the same time, while higher prices for staple foods can aggravate poverty traps in low-income countries, they have a less prominent effect on diets in relatively well-off households. The effects of X5–7 on Yn across upper-middle-income economies are more moderate compared to low-income and lower-middle-income countries.
5. Discussion
5.1. Hypothesis 1: Supply and Production
As acknowledged by the FAO and the WHO [11], “current food systems are being increasingly challenged to provide adequate, safe, diversified, and nutrient-rich food for all that contribute to healthy diets”. Changes in agriculture productivity [106,107], economic slowdowns and rises [57,108], and trade liberalization and protectionist restrictions on food exports and imports [109,110,111,112] help explain much of the observed transformations in the food supply in recent decades. Having been common to most nations, these challenges still vary depending on the level of economic development and income of individual countries.
Globally, food supply in terms of per capita value of calories, proteins, and fats has been on the rise since the 1980s, with the most significant improvement in the 1990s (Figure 1). It is hardly surprising that supply quantity is higher in wealthier countries compared to lower-income communities, but what matters is the dynamics of food supply parameters. Across low-income economies (in our array, mainly represented by the countries of sub-Saharan Africa), we see a distinct slowdown in protein supply quantity and even a decline in that of calories and fats in the last 8 to 10 years. The FAO [3] explains the decline in per capita food supply in low-income countries of Middle Africa and parts of Eastern Africa by a combination of civil conflicts in the continent (for instance, in the Central African Republic and Somalia) and a drop in crop yields because of climate variability. Both factors relate to degrading productivity of domestic agricultural sectors—due to either external disruptions or internal underperformance. In confirmation of Hypothesis 1, this well agrees with our finding of a highly positive and strong relationship in low-income countries between per capita food supply and production-related variables, such as gross agricultural production value, gross per capita agricultural production index, and agricultural sector’s share of GDP. The most significant correlations between X1–3 production variables and Yn are revealed in the Central African Republic, Chad, Gambia, Guinea-Bissau, and Sudan, the countries where the FAO [3] has been recording increases in undernourishment since the early 2000s.
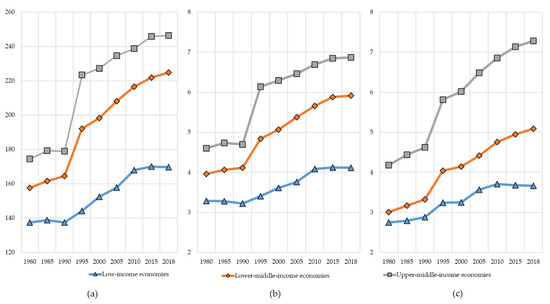
Figure 1.
Changes in (a) food supply, kcal/capita/day; (b) protein supply, g/capita/day; and (c) fat supply, g/capita/day in low-income, lower-middle-income, and upper-middle-income economies in 1980–2018. Source: authors’ development.
Cereal availability is highest in low-income countries among the three groups of economies included in the study (about 390 g/capita/day compared to 260 g/capita/day in upper-middle-income countries). This value has not changed much over decades, and the X1–3–Yn link has not weakened. For roots, tubers, and plantains and pulses, seeds, and nuts, we see a closer relationship between production factors and per capita calorie supply in the 2010s compared to the 1980–1990s. This goes in line with the FAO’s [3] projection of an increase in calorie supply in Africa by 2030 that would be achieved primarily by means of roots and pulses.
As demonstrated by Ma et al. [113] and Smith and Siciliano [114], an intensive increase in the production of staples in favor of present needs versus future yields has direct consequences on environmental degradation of land and other natural resources in developing countries. Thus, while contributing to the malnutrition fight by improving food availability in the market, local farmers compromise longer-term food security prospects. According to Galeana-Pizana et al. [115] and Van Wesenbeeck et al. [116], this particularly relates to smallholder agriculture through smaller farm size, lack of education among farmers, lower levels of trust in science, and time and labor constraints. Poorer yields of such staples as maize, sorghum, and groundnuts in the Great Lakes and the Horn of Africa areas [3] have particularly affected a stagnation of per capita calorie supply and rise in undernourishment in SSA countries in recent years. Diminished production performance is commonly addressed by applying more fertilizers. Increased use of chemical fertilizers by both farmers and large agricultural producers has played a vital role in improving food availability across the developing world, but fertilizer overuse has been deteriorating the environment and human health [116]. Alarcon et al. [16] term this threat “the double burden” in the sense that the existing malnutrition challenge is now being increasingly affected by food safety and environmental issues. The latter includes the formation of poisonous nitrates in groundwater [117], acidification of soils [118], higher emissions of acidifying substances and greenhouse gases [119], and plant uptake of hazardous micronutrients that are transmitted to human food and animal feed [120]. Therefore, improvements in the volume of food supply (Figure 1) do not necessarily result in healthier diets.
Government control means a lot to establishing more environmentally responsible food systems. However, the rigidity of regulations is very much compromised by the need to supply affordable food in sufficient quantity to people across all income groups. In upper-income countries, this “feed now–response tomorrow” dilemma could be addressed on the part of society by taking the “responsible eating” line. As Mihajlov and Puda [121] rightfully mention, modifying food choices towards healthier diets along with reducing food loss and waste can decrease greenhouse gas emissions and improve the production potential of food systems in the long run. While Piras et al. [122] found the largest share of food to be wasted at the household level in developed countries, the waste–consumption relationship is mediated by the level of income even across the developing world. For instance, Eini-Zinab et al. [123] revealed that eating more dairy products and fruits and vegetables and less bread, rice, pasta, legumes, hydrogenated fats, and sugars could reduce the total water and carbon footprints of the agricultural sector by 14% each. In lower-income communities, however, people struggle for eating rather than healthy eating, even less responsible eating. Rice, wheat, sugars, and other staples dominate food rations. We found highly positive effects of production variables on calorie supply from cereals (Y1), roots and plantains (Y4), and pulses (Y5). This finding confirms the estimation that low-income countries rely heavily on the domestic production of staple foods to combat undernourishment. As emphasized by Ecker and Hatzenbuehler [124], farmers in least-developed countries increasingly plant staples for their consumption at the expense of dietary diversification.
5.2. Hypothesis 2: Supply and Income
According to Vermeulen et al. [125] and Myers et al. [126], in addition to impacts on the quality and safety of food products, environmental shocks can affect prices and food availability. As we can see from the discussion above, food affordability reasoning is critical for making consumption decisions in lower-income communities. In higher-income ones, the perception of price in terms of the relationship between monetary value and health consequences is different. The “I am not rich enough to buy cheap products” behavior mode [121] does not work well for low-income countries, but it could benefit environment-responsible consumption in wealthier communities. While in low-income countries, cereals, roots, tubers, and plantains represent nearly 60% of all food available by weight, this percentage decreases with a rise in the level of economic development. In the studies from higher-income countries, Hanson and Connor [127], Johnson et al. [128], and Leung et al. [129], among others, have shown that both dietary diversity and consumption of highly nutritious products (food from animal sources, fruits, vegetables, etc.) tend to improve as the purchasing power of the population goes up. Green et al. [130] and Wu et al. [40] found food prices to have a greater effect on food consumption in low-income countries compared to other factors. Our findings, however, indicate stronger linkages between economic variables and per capita food supply in lower-middle-income countries than in low-middle economies. Thus, acknowledging previous results of Mundo-Rosas et al. [131], Ballard et al. [132], Vega-Macedo et al. [133], and other scholars, we can prove Hypothesis 2 by saying that both quantity and quality of calorie supply vary according to the income level of the country.
Nevertheless, we must admit that Hypothesis 2 is confirmed only for higher-value meat and dairy products, fruits, and vegetables, while for cereals, roots, and pulses, the relationship between X4–7 and Yn is weaker. This agrees with Stewart et al. [134] and Mackenbach [27], who recently linked the consumption of fruits and vegetables with the way households prioritize healthy eating. According to the FAO [3], the availability of fruits and vegetables in low-income and lower-middle-income has substantially increased since the 1990s, but it remains far below the 400 g/capita/day consumption target established by the WHO [135,136]. Only in upper-middle-income countries is this adequate food intake threshold met, but consumption of fruits and vegetables is distributed inadequately between regions. Thus, Hall et al. [137] and Afshin et al. [138] reported higher per capita values in Southeast Asia and lower supply quantity in Central Asia, Africa, and the Middle East. Upper-middle-income economies also demonstrate the most substantial increase in the amount of animal-source foods available.
The correlation between income (X4), cost of a diet (X5–7), and food security status of households has an important impact on the public health situation in a country [10,139]. Many scholars, including Herforth and Ahmed [140], Dizon et al. [141], Beydoun et al. [142], Grossman et al. [143], and Headey and Alderman [144], linked the cost and affordability of food and agricultural products with the quality and nutrition outcomes of a diet. Low intake of diverse complementary foods due to the economic unaffordability of an adequate supply can cause critical nutrient gaps in the diets [37,145,146]. Headey and Alderman [144] partially explained country-to-country differences in the prevalence of undernutrition and overweight among adults by varying levels of relative food prices.
Increased availability of animal-source products may have positive or negative implications for health depending on the context [3]. According to Hussein et al. [45], the extent to which protein-rich animal products such as meat and milk are consumed is extremely sensitive to income shocks. Exogenous influences, including food inflation, degrading purchasing power, and household budget constraints, are highly likely to result in a lower diversity of diets with less emphasis on meat and dairy consumption. Negative macronutrient implications have adverse consequences for levels of malnutrition. In low-income and lower-middle-income countries, where the impact of economic variables on Y1–3 is particularly strong, a tiny increase in the per capita supply of meat and other sources of quality protein can greatly improve the nutritional adequacy of diets. For higher-income communities, however, the effect of a continuing increase in consumption of meat above the healthy threshold could be ambiguous. For instance, Afshin et al. [138] associated increased consumption of red and processed meat in high-income countries with a risk of certain types of cancer [147] and other diet-related NCDs. Underconsumption of animal-source proteins and nutrients, on the contrary, can cause adverse health outcomes, including chronic conditions, mental health challenges, and increased risk of mortality, as found by Bakalis et al. [148], Garcia et al. [149], Berkowitz et al. [150], and Gundersen and Ziliak [151].
The finding that diet diversity improves with increasing level of income is consistent with the theoretical assumptions on consumer behavior previously formulated by Dorce et al. [152], Panait et al. [153], Chandra et al. [154], and Qiu et al. [43]. People who feel increasingly food secure due to a higher purchasing power are more certain about their ability to obtain higher-quality and more nutritious foods. Those who are increasingly food-insecure, on the contrary, are forced to compromise on the cost and quality of their diet and cut consumption of the most expensive (and healthier) products first [108,155,156]. Thus, Hirvonen et al. [21] and Van Hoyweghen et al. [157] revealed that reductions in household food consumption mainly reduced purchases of nutrient-dense foods. Shahzad et al. [158] proved convincingly that households handled the negative income shocks by eating less preferred food and getting support from government and charity organizations. The results of recent studies made by Swinnen and Vos [8] and Ceballos et al. [159] are also consistent with our finding of a stronger income–consumption link in wealthier communities compared to lower-income economies. Muhammad et al. [160] found that the purchase of pricier fruits and milk was particularly sensitive to changes in income and prices. According to Allee et al. [161], an increase in income directly influences an improvement in the food security status of the population, but the strength of this effect varies depending on the country. Thome et al. [54], Ritchie et al. [53], and Elbushra and Ahmed [52] explained the stronger influence of economic parameters on calorie supply in middle-income countries compared to low-income economies by a lower portion of locally produced staples in consumption. In our study, in confrontation with Hypotheses 2 and 3, the variability of the income–food supply relationship is found to be significant in both lower-middle-income and upper-middle-income countries with no decisive prevalence in the former.
5.3. Hypothesis 3: Supply and Trade
Recent food security literature commonly acknowledges the pivotal role of trade in ensuring access to nutrients for all at affordable prices through diversified international supply chains [9,56]. In the course of economic growth that has been progressing since the 1980–1990s across developing countries of Asia, Latin America, and some parts of Africa, many countries have been able to increase food purchases from abroad. This has substantially improved both the quantity of food supply and the diversity of diets in food-insecure communities [57,162]. Popkin [163], Bonaccio et al. [164], Popkin et al. [165], Annim and Frempong [166], and Lewis et al. [167], among others, show how diets shift away from staples towards more animal-source foods, sugars, fats, and oils with an increase in per capita income. Since the early 2000s, the largest increases in the availability of meat and dairy products, sugars, and fats have been observed in upper-middle-income countries. The FAO [3] acknowledges that the world’s most dramatic reductions in hunger in China and India have stemmed from long-term economic growth in both countries, agricultural development, and improved access to a variety of nutritious foods, including imports. Our study reveals the positive relationship between trade parameters X8–10 and the supply of calories, proteins, and fats in China to be one of the strongest among upper-middle-income countries. This finding correlates with the results of many studies that associate radical improvement in China’s food security with increasing integration of the country into international food supply chains [168,169,170]. A similar positive link between trade and improvements in the availability of food has been reported for many countries in Asia, Africa, and Latin America [9,57,59] in the sense of equalizing the quality of nutrition across the developing world and establishing a kind of what Hodges and Kimball [171] called “the global diet”. Most scholars, however, differentiate the effects of trade on food security from minor in least-developed countries to significant in upper-income economies [172,173]. Amid the backdrop of the overall positive correlation between trade variables and Yn, this income–trade–security pattern goes in line with our assumption that in higher-income economies, food supply more critically depends on trade factors rather than production or economic determinants.
There are, however, two exclusions that do not entirely favor Hypothesis 3. First is that a strong X8–10–Yn link is identified for some upper-middle-income economies, such as China, Russia, Turkey, Namibia, and Lebanon, but not all. For the remaining countries in this income group, the correlation is rather moderate (mainly marginally positive or moderately negative). On the other hand, distinct positive links between trade variables and food supply are revealed for many lower-middle-income countries, for example, Algeria, Tunisia, Cote d’Ivoire, Kyrgyzstan, and Uzbekistan. Overall, these findings are not consistent with the bulk of existing literature with respect to the strength of effects of international trade on food availability. Nevertheless, some studies, for instance, those of Hendrix et al. [174] and Wood et al. [68], revealed food import to be essential for meeting basic dietary needs in developing and least-developed countries. Frankenberg and Thomas [175] and Smith and Glauber [56] associated food price fluctuations in the global market with stronger adverse effects on the quality of diets in lower-income households compared to relatively well-off ones. Since the FAO [3] has been reporting continuous progress in improving per capita food supply in lower-middle-income countries such as Nepal, Pakistan, and Sri Lanka, the trade–supply pattern should be further checked. Our assumption was that the revealed duality in trade–supply relationships in lower-middle and upper-middle countries can be explained by varying degrees of dependence of domestic markets on agricultural imports. In relation to Hypothesis 3, this study resulted in finding stronger X8–9–Yn correlations in less self-sufficient countries that heavily depend on food supplies from abroad. Thus, it is safe to conclude that trade factors strongly affect the supply of calories, proteins, and fats in import-dependent economies regardless of the level of a gross national income per capita. Following Erokhin and Gao [10], Martin and Anderson [176], and Deuss [177], we assume that trade effects could be more pronounced in countries that particularly rely on supply from abroad to meet the demand for food in the domestic market. In such economies, disruptions in the food supply could have serious negative consequences for the nutritional security of the population. This agrees with Puma et al. [178], who found that LDCs suffer greater import losses due to disruption of food supply chains through their increased dependence on imports of staple foods. Currency depreciation drives up the cost of food imports; the effect of X10 on Yn is extremely negative in both lower-middle and upper-middle-income countries where food supply strongly depends on imports. Therefore, currency exchange becomes a factor of both food availability (more expensive imports due to currency depreciation) and access to food (the higher price of imported food on the domestic market when expressed in national currency) [10].
6. Conclusions
Diets in low-income countries evolve over time, being affected by diverse factors that interact in a complex manner to shape individual food availability and accessibility patterns in various income groups of economies in various regions of the world. In this study, we attempted to reveal the long-term trends in the influence of production, economic, and trade effects on the per capita supply of calories, proteins, and fats in low-income nations. The relationships between the regressands and corresponding regressors were discovered individually for 99 countries of East Asia and Pacific, South Asia, Europe and Central Asia, Latin America and the Caribbean, the Middle East and North Africa, and sub-Saharan Africa and generalized for the three income groups, given the alternations between the highest positive and most negative influences on the dependent variables. The consecutive application of the variance inflationary factor method, stepwise regression, best subsets approach, Mallows’ Cp statistic, and multiple regression method allowed us to identify the strengths and directions of effects of agricultural production parameters, income level, commodity and consumer price indices, food trade, and currency exchange on supply of calories and nutrients across 11 food groups.
6.1. Hypotheses Results
Three key findings emerged from the testing of the established hypotheses (Table 10).
Table 10.
Summary of production, economic, and trade effects on the supply of calories, proteins, and fats in the three income groups of countries in 1980–2018.
- In low-income countries, food supply parameters are more strongly affected by production factors, such as agricultural production value, per capita agricultural production index, and the agricultural sector’s share of GDP.
- The effect of economic factors on the per capita supply of calories and nutrients increases with the rise in the level of income—it is the lowest in low-income countries and the highest in upper-middle-income economies. However, the effect is mainly tracked for higher-value food products, such as meat and dairy products, fruits, and vegetables, while it is marginal for staples.
- The effects of trade factors on food supply are stronger compared to production and economic determinants in import-dependent countries irrelevant of the income group they belong to. This effect is equally recorded in both lower-middle and upper-middle-income countries.
Food systems in low-income countries have been undergoing substantial changes in recent decades, but the evidence on how these transformations have affected nutritional security is limited. The results of testing these hypotheses demonstrate the necessity of taking an expanded view of food security, one that includes aspects of availability and affordability of adequate nutrient intake. Therefore, the contribution of the study to the literature could be expressed in the following three novel and essential outcomes:
First, such parameters as calorie, protein, and fat supply have not been comprehensively investigated against production, income, and trade variables. The effects on nutrient supply are assessed separately based on the established rating scale.
Second, the five-stage approach allowed for integration and clarification of the previously fragmented information on nutrient supply across diverse income patterns within the developing world. There have been studies on differences in food supply between developed and developing countries, but few scholars have captured the variation in economic factors between low-income, lower-middle-income, and upper-middle-income economies.
Third, the overlapping of the rating scale and income patterns provided the picture of strengths and directions of effects of agricultural production parameters, income level, price indices, food trade, and currency exchange on nutrient supply. In such a way, the study adds to the understanding of individual drivers of nutrition security across 99 countries.
6.2. Future Research Directions
Based on the obtained findings, we see potential implications of this study for further research on how food supply patterns and their determinants evolve in the course of economic transformations in low-income countries.
The set of production, economic, and trade variables used as regressors is open-ended. To capture a multidimensional character of food and nutrition security, it could be expanded by the parameters of stability of food supply and utilization of food and agricultural products. The five-stage regression analysis that involved collinearity checks based on the VIF and BSA methods resulted in establishing non-collinear regression models where regressands’ variations were well explained by regressors. However, due to the ongoing economic and social changes in low-income countries, a further focus on finding the most feasible influencing factors of the food supply could place the issue in the larger context of the quality and diversity of diets and their effects on public health in particular countries.
The projections on undernourishment may be substantially altered by differential impacts of production, economic, and trade factors on food supply across the regions. For the purpose of this study, we picked 22 low-income, 37 lower-middle-income, and 40 upper-middle-income countries, for which all Xn and Yn data were available for the entire period of 1980–2018. Currently, the FAO provides information on calorie, protein, and fat supply quantity only at the national, aggregate level, not actual individual food or nutrient intake or the distribution of access to the food available by the different population groups. Therefore, in some cases, aggregated figures for income country groups might not fully reflect food supply specifics in individual countries or social groups. Both the array of countries and the time frame could be adjusted as more comprehensive data become available from the FAO, WHO, WTO, and other databases.
The environment-related effects of food production factors on nutrient supply addressed in the discussion should be further investigated. As demonstrated by many scholars [9,14,179,180], climate change, poor natural conditions, and fragile ecologies in many least-developed and developing countries make it difficult to combat malnutrition and simultaneously follow sustainable farming practices. For ensuring long-term food and nutritional security across the developing world, future studies must differentiate nutrient supply drivers between income patterns. The probing into the optimal use of fertilizers [116], liming [181], cultivation systems [115], food waste control [182,183], and environmentally responsible food consumption [121] should be conducted individually for lower- and upper-income countries in order to customize food policy measures.
6.3. Potential Policy Implications
Several policy recommendations could emerge from the study as well. The discussion of our results through the lens of healthy eating demonstrates that in low-income countries, this type of food consumption behavior is a matter of prioritization by policymakers rather than households. This is especially true for the poorest communities, where permanent nutrition insecurity presents serious health impacts. To make healthy diets more affordable, potential options should target every possible reduction in the final price of nutrient-rich products, including government support of shorter supply chains in meat and dairy sectors, increase in public investment in cleaner crop production, tax reliefs, and incentives for the application of organic fertilizers. In least-developed countries, price subsidies for fruits, vegetables, and meat can help the poor diversify their diets. As our findings showed diverse effects of economic and production factors on food supply, physical availability of food must be considered along with economic access. Subsidizing transaction costs of access points of sale could improve the availability of food in the most vulnerable communities. Furthermore, social safety nets and aid programs should be strengthened in the countries where the X1–3–Y relationship was found to be the strongest. In wealthier communities, where income-related effects on nutrient supply are less pronounced, we envision programs that could incentivize people to acknowledge the responsible eating concept. This includes a more conscious selection and use of food products, making consumption choices that involve locally grown food, and diversifying diets by introducing more fresh foods.
Author Contributions
Conceptualization, V.E. and L.D.; methodology, V.E. and L.D.; software, Y.Z.; validation, J.-V.A. and A.I.; formal analysis, V.E., J.-V.A., A.I. and Y.Z.; investigation, V.E., L.D. and T.G.; resources, L.D.; data curation, J.-V.A. and A.I.; writing—original draft preparation, V.E. and L.D.; writing—review and editing, V.E. and L.D.; visualization, V.E., L.D. and Y.Z.; supervision, T.G.; project administration, T.G.; funding acquisition, L.D. All authors have read and agreed to the published version of the manuscript.
Funding
This paper belongs to the results of the Center for European Studies of Wuhan University (WHUGBQU2021-07).
Institutional Review Board Statement
Not applicable.
Informed Consent Statement
Not applicable.
Data Availability Statement
The data presented in this study are available on request from the corresponding author.
Conflicts of Interest
The authors declare no conflict of interest. The founding sponsor had no role in the design of the study; in the collection, analyses, or interpretation of data; in the writing of the manuscript; or in the decision to publish the results.
Appendix A
Table A1.
Food supply (Y1) per country categories and food groups in 1980–2018, kcal/capita/day.
Table A1.
Food supply (Y1) per country categories and food groups in 1980–2018, kcal/capita/day.
| Index | Food Group | 1980 | 1985 | 1990 | 1995 | 2000 | 2005 | 2010 | 2015 | 2018 |
|---|---|---|---|---|---|---|---|---|---|---|
| Low-income economies | ||||||||||
| Y1.1 | Cereals | 630.773 | 685.000 | 670.409 | 738.591 | 774.136 | 780.273 | 861.500 | 882.864 | 884.136 |
| Y1.2 | Fruits | 104.727 | 102.182 | 97.091 | 98.045 | 90.545 | 89.909 | 87.182 | 85.727 | 81.455 |
| Y1.3 | Vegetables | 23.136 | 22.091 | 22.909 | 26.091 | 25.364 | 28.045 | 27.727 | 35.545 | 37.773 |
| Y1.4 | Roots, tubers, plantains | 302.000 | 270.818 | 266.409 | 231.273 | 280.318 | 276.682 | 275.545 | 272.045 | 265.545 |
| Y1.5 | Pulses, seeds, nuts | 91.182 | 79.818 | 78.000 | 75.955 | 84.364 | 93.273 | 108.909 | 109.773 | 107.364 |
| Y1.6 | Eggs | 2.727 | 2.955 | 3.045 | 3.045 | 2.864 | 3.455 | 3.682 | 4.091 | 3.955 |
| Y1.7 | Meat | 61.273 | 59.227 | 60.727 | 63.773 | 67.682 | 71.000 | 74.364 | 73.182 | 72.818 |
| Y1.8 | Fish, shellfish | 12.455 | 10.727 | 11.500 | 10.864 | 11.091 | 12.455 | 13.955 | 14.591 | 14.909 |
| Y1.9 | Milk and dairy products | 48.864 | 48.045 | 47.318 | 53.182 | 54.455 | 63.045 | 67.136 | 59.364 | 60.500 |
| Y1.10 | Fats and oils | 154.955 | 160.864 | 168.000 | 192.000 | 187.000 | 206.227 | 212.045 | 212.091 | 212.045 |
| Y1.11 | Sugars and sweeteners | 80.227 | 84.727 | 86.682 | 92.591 | 99.500 | 111.773 | 114.682 | 120.909 | 125.273 |
| Lower-Middle-income economies | ||||||||||
| Y1.1 | Cereals | 983.703 | 1012.757 | 1022.432 | 1172.865 | 1181.351 | 1223.243 | 1238.135 | 1262.378 | 1269.000 |
| Y1.2 | Fruits | 68.595 | 64.703 | 58.568 | 70.135 | 69.486 | 78.270 | 85.838 | 96.595 | 99.459 |
| Y1.3 | Vegetables | 23.081 | 24.270 | 25.676 | 32.351 | 40.703 | 45.973 | 54.243 | 62.486 | 62.405 |
| Y1.4 | Roots, tubers, plantains | 148.162 | 147.703 | 155.216 | 180.459 | 188.811 | 198.541 | 208.189 | 210.270 | 213.486 |
| Y1.5 | Pulses, seeds, nuts | 51.405 | 54.162 | 56.027 | 55.297 | 61.270 | 68.054 | 74.838 | 70.486 | 72.351 |
| Y1.6 | Eggs | 6.973 | 7.189 | 7.378 | 9.595 | 10.108 | 11.568 | 13.324 | 15.054 | 15.216 |
| Y1.7 | Meat | 71.622 | 72.649 | 77.459 | 97.703 | 103.595 | 112.486 | 127.676 | 137.324 | 138.838 |
| Y1.8 | Fish, shellfish | 15.162 | 16.811 | 16.730 | 16.378 | 20.027 | 22.297 | 25.297 | 27.730 | 27.243 |
| Y1.9 | Milk and dairy products | 61.297 | 62.649 | 60.514 | 91.270 | 99.027 | 106.649 | 111.622 | 118.676 | 119.135 |
| Y1.10 | Fats and oils | 151.541 | 164.081 | 175.351 | 208.946 | 208.676 | 221.919 | 237.757 | 241.054 | 252.405 |
| Y1.11 | Sugars and sweeteners | 151.324 | 150.405 | 153.378 | 178.378 | 197.568 | 199.378 | 204.730 | 199.081 | 202.757 |
| Upper-middle-income economies | ||||||||||
| Y1.1 | Cereals | 863.450 | 885.575 | 876.200 | 1115.475 | 1125.350 | 1113.275 | 1115.250 | 1139.375 | 1134.750 |
| Y1.2 | Fruits | 97.300 | 97.725 | 94.500 | 109.650 | 114.350 | 118.200 | 121.725 | 133.450 | 135.750 |
| Y1.3 | Vegetables | 29.700 | 32.925 | 35.050 | 51.075 | 57.325 | 66.800 | 69.700 | 71.850 | 71.350 |
| Y1.4 | Roots, tubers, plantains | 110.900 | 109.750 | 104.525 | 134.725 | 133.600 | 143.050 | 139.800 | 147.700 | 142.975 |
| Y1.5 | Pulses, seeds, nuts | 56.500 | 55.375 | 53.975 | 55.075 | 51.025 | 54.975 | 51.625 | 51.075 | 51.225 |
| Y1.6 | Eggs | 16.300 | 16.975 | 18.725 | 24.225 | 25.300 | 28.950 | 31.800 | 34.850 | 36.375 |
| Y1.7 | Meat | 129.450 | 137.000 | 140.975 | 190.950 | 197.125 | 206.550 | 230.800 | 234.525 | 240.550 |
| Y1.8 | Fish, shellfish | 23.300 | 26.150 | 22.400 | 27.575 | 31.725 | 32.550 | 35.375 | 34.075 | 31.275 |
| Y1.9 | Milk and dairy products | 106.600 | 102.875 | 107.350 | 160.725 | 166.400 | 173.925 | 176.875 | 184.200 | 185.950 |
| Y1.10 | Fats and oils | 210.325 | 229.650 | 242.375 | 280.750 | 290.050 | 319.900 | 333.475 | 348.525 | 357.500 |
| Y1.11 | Sugars and sweeteners | 274.825 | 278.200 | 272.325 | 307.675 | 306.550 | 323.000 | 320.175 | 324.000 | 323.300 |
Source: authors’ development.
Table A2.
Protein supply quantity (Y2) per country categories and food groups in 1980–2018, g/capita/day.
Table A2.
Protein supply quantity (Y2) per country categories and food groups in 1980–2018, g/capita/day.
| Index | Food Group | 1980 | 1985 | 1990 | 1995 | 2000 | 2005 | 2010 | 2015 | 2018 |
|---|---|---|---|---|---|---|---|---|---|---|
| Low-income economies | ||||||||||
| Y2.1 | Cereals | 15.098 | 16.404 | 16.115 | 18.122 | 18.995 | 19.095 | 20.911 | 21.435 | 21.465 |
| Y2.2 | Fruits | 1.187 | 1.152 | 1.096 | 1.103 | 1.029 | 1.020 | 1.005 | 0.960 | 0.909 |
| Y2.3 | Vegetables | 1.263 | 1.210 | 1.224 | 1.340 | 1.279 | 1.380 | 1.352 | 1.715 | 1.791 |
| Y2.4 | Roots, tubers, plantains | 2.928 | 2.705 | 2.628 | 2.474 | 3.033 | 3.026 | 3.044 | 3.049 | 2.989 |
| Y2.5 | Pulses, seeds, nuts | 5.953 | 5.184 | 5.049 | 4.928 | 5.464 | 6.044 | 7.043 | 7.090 | 6.917 |
| Y2.6 | Eggs | 0.227 | 0.236 | 0.256 | 0.254 | 0.238 | 0.278 | 0.304 | 0.335 | 0.319 |
| Y2.7 | Meat | 4.765 | 4.598 | 4.586 | 4.610 | 4.953 | 5.271 | 5.507 | 5.249 | 5.321 |
| Y2.8 | Fish, shellfish | 1.991 | 1.705 | 1.846 | 1.749 | 1.770 | 1.971 | 2.211 | 2.346 | 2.366 |
| Y2.9 | Milk and dairy products | 2.717 | 2.805 | 2.591 | 2.848 | 2.901 | 3.262 | 3.480 | 3.109 | 3.157 |
| Y2.10 | Fats and oils | 0.027 | 0.027 | 0.029 | 0.029 | 0.028 | 0.030 | 0.035 | 0.030 | 0.032 |
| Y2.11 | Sugars and sweeteners | 0.010 | 0.007 | 0.005 | 0.005 | 0.003 | 0.003 | 0.003 | 0.003 | 0.003 |
| Lower-middle-income economies | ||||||||||
| Y2.1 | Cereals | 24.586 | 25.218 | 25.418 | 29.670 | 29.751 | 30.547 | 30.780 | 31.469 | 31.608 |
| Y2.2 | Fruits | 0.768 | 0.736 | 0.667 | 0.771 | 0.761 | 0.881 | 0.968 | 1.091 | 1.114 |
| Y2.3 | Vegetables | 1.159 | 1.211 | 1.270 | 1.550 | 1.946 | 2.153 | 2.531 | 2.895 | 2.879 |
| Y2.4 | Roots, tubers, plantains | 1.818 | 1.823 | 1.894 | 2.327 | 2.540 | 2.787 | 2.960 | 2.948 | 3.004 |
| Y2.5 | Pulses, seeds, nuts | 3.332 | 3.502 | 3.632 | 3.578 | 3.969 | 4.409 | 4.832 | 4.535 | 4.667 |
| Y2.6 | Eggs | 0.558 | 0.569 | 0.586 | 0.767 | 0.811 | 0.917 | 1.053 | 1.188 | 1.201 |
| Y2.7 | Meat | 5.309 | 5.299 | 5.562 | 6.816 | 7.349 | 8.023 | 9.012 | 9.680 | 9.742 |
| Y2.8 | Fish, shellfish | 2.395 | 2.641 | 2.615 | 2.560 | 3.108 | 3.437 | 3.916 | 4.276 | 4.211 |
| Y2.9 | Milk and dairy products | 3.520 | 3.633 | 3.515 | 5.115 | 5.432 | 5.912 | 6.091 | 6.480 | 6.542 |
| Y2.10 | Fats and oils | 0.043 | 0.042 | 0.048 | 0.056 | 0.061 | 0.073 | 0.079 | 0.089 | 0.090 |
| Y2.11 | Sugars and sweeteners | 0.034 | 0.031 | 0.024 | 0.021 | 0.020 | 0.020 | 0.021 | 0.018 | 0.016 |
| Upper-middle-income economies | ||||||||||
| Y2.1 | Cereals | 22.094 | 22.713 | 22.435 | 29.201 | 29.295 | 28.766 | 28.787 | 29.362 | 29.232 |
| Y2.2 | Fruits | 1.117 | 1.113 | 1.098 | 1.258 | 1.312 | 1.333 | 1.375 | 1.525 | 1.561 |
| Y2.3 | Vegetables | 1.376 | 1.516 | 1.566 | 2.293 | 2.538 | 2.934 | 3.099 | 3.185 | 3.166 |
| Y2.4 | Roots, tubers, plantains | 1.647 | 1.650 | 1.568 | 2.323 | 2.287 | 2.490 | 2.396 | 2.485 | 2.436 |
| Y2.5 | Pulses, seeds, nuts | 3.612 | 3.538 | 3.439 | 3.520 | 3.274 | 3.526 | 3.309 | 3.277 | 3.287 |
| Y2.6 | Eggs | 1.263 | 1.315 | 1.447 | 1.870 | 1.956 | 2.239 | 2.454 | 2.682 | 2.799 |
| Y2.7 | Meat | 9.523 | 10.015 | 10.373 | 13.665 | 14.173 | 15.004 | 16.811 | 17.035 | 17.549 |
| Y2.8 | Fish, shellfish | 3.539 | 3.981 | 3.484 | 4.302 | 4.923 | 4.957 | 5.314 | 5.132 | 4.723 |
| Y2.9 | Milk and dairy products | 6.312 | 6.122 | 6.137 | 8.980 | 9.346 | 9.708 | 9.948 | 10.505 | 10.634 |
| Y2.10 | Fats and oils | 0.073 | 0.081 | 0.085 | 0.102 | 0.098 | 0.114 | 0.116 | 0.129 | 0.131 |
| Y2.11 | Sugars and sweeteners | 0.032 | 0.031 | 0.026 | 0.027 | 0.025 | 0.024 | 0.023 | 0.023 | 0.023 |
Source: authors’ development.
Table A3.
Fat supply quantity (Y3) per country categories and food groups in 1980–2018, g/capita/day.
Table A3.
Fat supply quantity (Y3) per country categories and food groups in 1980–2018, g/capita/day.
| Index | Food Group | 1980 | 1985 | 1990 | 1995 | 2000 | 2005 | 2010 | 2015 | 2018 |
|---|---|---|---|---|---|---|---|---|---|---|
| Low-income economies | ||||||||||
| Y3.1 | Cereals | 3.354 | 3.636 | 3.480 | 4.103 | 4.265 | 4.655 | 4.894 | 5.010 | 4.856 |
| Y3.2 | Fruits | 0.514 | 0.497 | 0.469 | 0.456 | 0.447 | 0.507 | 0.585 | 0.481 | 0.454 |
| Y3.3 | Vegetables | 0.227 | 0.217 | 0.219 | 0.246 | 0.225 | 0.246 | 0.237 | 0.284 | 0.294 |
| Y3.4 | Roots, tubers, plantains | 0.407 | 0.367 | 0.348 | 0.322 | 0.386 | 0.384 | 0.390 | 0.443 | 0.435 |
| Y3.5 | Pulses, seeds, nuts | 0.475 | 0.419 | 0.422 | 0.410 | 0.465 | 0.497 | 0.582 | 0.584 | 0.560 |
| Y3.6 | Eggs | 0.193 | 0.200 | 0.216 | 0.214 | 0.200 | 0.235 | 0.259 | 0.287 | 0.274 |
| Y3.7 | Meat | 4.535 | 4.400 | 4.550 | 4.871 | 5.145 | 5.372 | 5.634 | 5.635 | 5.561 |
| Y3.8 | Fish, shellfish | 0.436 | 0.376 | 0.385 | 0.380 | 0.393 | 0.445 | 0.502 | 0.504 | 0.525 |
| Y3.9 | Milk and dairy products | 2.556 | 2.376 | 2.569 | 2.929 | 3.066 | 3.580 | 3.764 | 3.318 | 3.350 |
| Y3.10 | Fats and oils | 17.520 | 18.200 | 18.985 | 21.702 | 21.152 | 23.339 | 23.958 | 23.946 | 23.965 |
| Y3.11 | Sugars and sweeteners | 0.009 | 0.005 | 0.003 | 0.003 | 0.001 | 0.001 | 0.001 | 0.001 | 0.001 |
| Lower-middle-income economies | ||||||||||
| Y3.1 | Cereals | 5.469 | 5.581 | 5.562 | 6.021 | 6.011 | 6.199 | 6.389 | 6.626 | 6.749 |
| Y3.2 | Fruits | 0.342 | 0.343 | 0.328 | 0.384 | 0.405 | 0.408 | 0.456 | 0.506 | 0.554 |
| Y3.3 | Vegetables | 0.199 | 0.210 | 0.221 | 0.273 | 0.333 | 0.372 | 0.422 | 0.491 | 0.481 |
| Y3.4 | Roots, tubers, plantains | 0.259 | 0.249 | 0.264 | 0.291 | 0.305 | 0.318 | 0.338 | 0.342 | 0.348 |
| Y3.5 | Pulses, seeds, nuts | 0.276 | 0.298 | 0.301 | 0.290 | 0.322 | 0.361 | 0.399 | 0.382 | 0.403 |
| Y3.6 | Eggs | 0.480 | 0.488 | 0.500 | 0.664 | 0.703 | 0.801 | 0.924 | 1.041 | 1.056 |
| Y3.7 | Meat | 5.413 | 5.534 | 5.956 | 7.595 | 8.002 | 8.665 | 9.883 | 10.639 | 10.763 |
| Y3.8 | Fish, shellfish | 0.528 | 0.604 | 0.600 | 0.591 | 0.738 | 0.822 | 0.925 | 1.020 | 0.992 |
| Y3.9 | Milk and dairy products | 2.999 | 3.028 | 3.034 | 4.752 | 5.195 | 5.618 | 5.791 | 6.169 | 6.189 |
| Y3.10 | Fats and oils | 17.105 | 18.531 | 19.784 | 23.581 | 23.553 | 25.045 | 26.824 | 27.195 | 28.462 |
| Y3.11 | Sugars and sweeteners | 0.003 | 0.004 | 0.005 | 0.004 | 0.004 | 0.004 | 0.005 | 0.005 | 0.005 |
| Upper-middle-income economies | ||||||||||
| Y3.1 | Cereals | 3.839 | 3.879 | 3.907 | 4.817 | 4.947 | 5.151 | 5.243 | 5.512 | 5.570 |
| Y3.2 | Fruits | 0.617 | 0.607 | 0.549 | 0.630 | 0.694 | 0.729 | 0.801 | 0.937 | 0.977 |
| Y3.3 | Vegetables | 0.245 | 0.270 | 0.282 | 0.412 | 0.467 | 0.538 | 0.564 | 0.590 | 0.583 |
| Y3.4 | Roots, tubers, plantains | 0.248 | 0.247 | 0.230 | 0.280 | 0.273 | 0.288 | 0.280 | 0.301 | 0.290 |
| Y3.5 | Pulses, seeds, nuts | 0.308 | 0.302 | 0.301 | 0.308 | 0.284 | 0.297 | 0.279 | 0.282 | 0.283 |
| Y3.6 | Eggs | 1.124 | 1.171 | 1.284 | 1.673 | 1.752 | 2.005 | 2.200 | 2.403 | 2.509 |
| Y3.7 | Meat | 9.763 | 10.367 | 10.659 | 14.646 | 15.093 | 15.746 | 17.566 | 17.871 | 18.289 |
| Y3.8 | Fish, shellfish | 0.878 | 0.990 | 0.817 | 1.000 | 1.147 | 1.236 | 1.373 | 1.317 | 1.201 |
| Y3.9 | Milk and dairy products | 5.265 | 5.118 | 5.496 | 8.551 | 8.906 | 9.327 | 9.495 | 9.998 | 10.091 |
| Y3.10 | Fats and oils | 23.698 | 25.857 | 27.326 | 31.645 | 32.692 | 36.072 | 37.594 | 39.299 | 40.301 |
| Y3.11 | Sugars and sweeteners | 0.008 | 0.008 | 0.006 | 0.007 | 0.005 | 0.004 | 0.004 | 0.004 | 0.003 |
Source: authors’ development.
Appendix B
Table A4.
Regressors (Xn) in low-income economies, averaged values, 1980–2018.
Table A4.
Regressors (Xn) in low-income economies, averaged values, 1980–2018.
| Index | Variable | 1980 | 1985 | 1990 | 1995 | 2000 | 2005 | 2010 | 2015 | 2018 |
|---|---|---|---|---|---|---|---|---|---|---|
| X1 | Gross agricultural production value, USD 1 million | 807.51 | 849.99 | 1032.41 | 1483.46 | 1776.76 | 2253.33 | 3170.37 | 3464.77 | 3839.63 |
| X2 | Gross per capita agricultural production index, points (2014–2016 = 100) | 93.28 | 88.71 | 83.62 | 85.94 | 88.52 | 92.13 | 102.26 | 99.14 | 100.49 |
| X3 | Agricultural sector’s share of gross domestic product, % | 35.46 | 36.04 | 34.66 | 38.48 | 35.69 | 34.26 | 34.06 | 32.03 | 31.72 |
| X4 | Nominal gross national income at current prices per capita, USD | 370.59 | 342.01 | 388.71 | 343.26 | 309.46 | 417.37 | 650.22 | 720.86 | 709.66 |
| X5 | Commodity price index, food products, points (2000 = 100) | 183.87 | 103.35 | 121.77 | 138.85 | 100.00 | 128.44 | 231.56 | 203.50 | 194.55 |
| X6 | Commodity price index, agricultural raw materials, points (2000 = 100) | 131.11 | 93.97 | 128.18 | 150.36 | 100.00 | 129.42 | 225.72 | 160.57 | 165.55 |
| X7 | Consumer price index, points (2010 = 100) | 10.75 | 16.43 | 18.56 | 32.97 | 48.27 | 69.57 | 100.00 | 151.59 | 216.23 |
| X8 | Total exports of food and agricultural products, USD 1 million | 57.91 | 36.36 | 43.36 | 113.49 | 108.82 | 157.98 | 294.58 | 398.84 | 492.15 |
| X9 | Total imports of food and agricultural products, USD 1 million | 57.14 | 49.68 | 25.36 | 135.63 | 150.15 | 300.10 | 606.59 | 776.90 | 885.37 |
| X10 | Currency exchange rate, local currency units/USD | 68.77 | 143.92 | 152.35 | 330.02 | 570.10 | 683.38 | 843.73 | 1115.71 | 1364.16 |
Source: authors’ development.
Table A5.
Regressors (Xn) in lower-middle-income economies, averaged values, 1980–2018.
Table A5.
Regressors (Xn) in lower-middle-income economies, averaged values, 1980–2018.
| Index | Variable | 1980 | 1985 | 1990 | 1995 | 2000 | 2005 | 2010 | 2015 | 2018 |
|---|---|---|---|---|---|---|---|---|---|---|
| X1 | Gross agricultural production value, USD 1 million | 6379.55 | 7697.09 | 9184.69 | 11329.70 | 12871.71 | 14906.79 | 17883.47 | 20824.23 | 23289.33 |
| X2 | Gross per capita agricultural production index, points (2014–2016 = 100) | 70.07 | 68.23 | 69.11 | 75.96 | 81.57 | 86.57 | 94.53 | 101.02 | 104.42 |
| X3 | Agricultural sector’s share of gross domestic product, % | 23.63 | 22.26 | 22.60 | 24.73 | 22.66 | 19.58 | 17.94 | 17.21 | 16.32 |
| X4 | Nominal gross national income at current prices per capita, USD | 653.71 | 584.04 | 639.42 | 734.27 | 737.89 | 1108.54 | 1799.39 | 2143.28 | 2286.77 |
| X5 | Commodity price index, food products, points (2000 = 100) | 183.87 | 103.35 | 121.77 | 138.85 | 100.00 | 128.44 | 231.56 | 203.50 | 194.55 |
| X6 | Commodity price index, agricultural raw materials, points (2000 = 100) | 131.11 | 93.97 | 128.18 | 150.36 | 100.00 | 129.42 | 225.72 | 160.57 | 165.55 |
| X7 | Consumer price index, points (2010 = 100) | 14.68 | 18.18 | 25.61 | 40.98 | 54.20 | 69.30 | 100.00 | 135.63 | 164.39 |
| X8 | Total exports of food and agricultural products, USD 1 million | 340.73 | 284.16 | 291.78 | 751.25 | 732.55 | 1262.57 | 2454.22 | 3421.79 | 3946.75 |
| X9 | Total imports of food and agricultural products, USD 1 million | 265.27 | 282.76 | 335.24 | 670.25 | 716.06 | 1244.13 | 2564.81 | 3358.89 | 3855.78 |
| X10 | Currency exchange rate, local currency units/USD | 28.31 | 61.82 | 250.01 | 485.26 | 867.18 | 1032.32 | 1065.55 | 1225.72 | 1441.59 |
Source: authors’ development.
Table A6.
Regressors (Xn) in upper-middle-income economies, averaged values, 1980–2018.
Table A6.
Regressors (Xn) in upper-middle-income economies, averaged values, 1980–2018.
| Index | Variable | 1980 | 1985 | 1990 | 1995 | 2000 | 2005 | 2010 | 2015 | 2018 |
|---|---|---|---|---|---|---|---|---|---|---|
| X1 | Gross agricultural production value, USD 1 million | 14058.49 | 17690.97 | 20953.41 | 28448.85 | 32940.97 | 38623.30 | 44410.85 | 50580.01 | 53064.79 |
| X2 | Gross per capita agricultural production index, points (2014–2016 = 100) | 84.00 | 83.88 | 82.65 | 93.40 | 91.98 | 95.25 | 97.31 | 99.96 | 101.07 |
| X3 | Agricultural sector’s share of gross domestic product, % | 11.91 | 10.95 | 11.02 | 15.21 | 11.46 | 9.63 | 8.45 | 8.14 | 7.73 |
| X4 | Nominal gross national income at current prices per capita, USD | 1491.07 | 1291.79 | 1673.61 | 2340.99 | 2440.59 | 3653.83 | 6040.82 | 6638.53 | 7091.28 |
| X5 | Commodity price index, food products, points (2000 = 100) | 183.87 | 103.35 | 121.77 | 138.85 | 100.00 | 128.44 | 231.56 | 203.50 | 194.55 |
| X6 | Commodity price index, agricultural raw materials, points (2000 = 100) | 131.11 | 93.97 | 128.18 | 150.36 | 100.00 | 129.42 | 225.72 | 160.57 | 165.55 |
| X7 | Consumer price index, points (2010 = 100) | 7.41 | 10.32 | 15.27 | 34.01 | 53.00 | 72.17 | 100.00 | 136.00 | 163.24 |
| X8 | Total exports of food and agricultural products, USD 1 million | 862.48 | 915.05 | 1231.47 | 2286.01 | 2226.51 | 3979.44 | 7686.02 | 9504.70 | 10956.62 |
| X9 | Total imports of food and agricultural products, USD 1 million | 391.25 | 253.92 | 521.82 | 1551.42 | 1544.82 | 2698.25 | 5783.36 | 7202.73 | 8428.83 |
| X10 | Currency exchange rate, local currency units/USD | 28.77 | 58.96 | 128.06 | 287.84 | 643.25 | 804.01 | 766.54 | 1386.69 | 1726.99 |
Source: authors’ development.
References
- Asai, M.; Mahler, D.G.; Malgioglio, S.; Narayan, A.; Nguyen, M.C. Which Countries Reduced Poverty Rates the Most? Available online: https://blogs.worldbank.org/opendata/which-countries-reduced-poverty-rates-most (accessed on 26 April 2021).
- Barne, D.; Wadhwa, D. Year in Review: 2018 in 14 Charts. Available online: https://www.worldbank.org/en/news/feature/2018/12/21/year-in-review-2018-in-14-charts (accessed on 26 April 2021).
- Food and Agriculture Organization of the United Nations; International Fund for Agricultural Development; United Nations Children’s Fund; World Food Programme; World Health Organization. The State of Food Security and Nutrition in the World 2020. Transforming Food Systems for Affordable Healthy Diets; FAO: Rome, Italy, 2020. [Google Scholar]
- Meira, A.; Givisiez, P.; Souza, F.G.; De Leon, C.; Azevedo, P.; Silva, N.; Oliveira, C. Food Security and Safety Mismatch in Low-Income Settings: Evidence from Milk Produced by Smallholders in Semiarid Paraiba, Northeastern Brazil. J. Arid. Environ. 2021, 188, 104453. [Google Scholar] [CrossRef]
- Arce, S.; Ottaviano, F.; Sosa, M. Sensory Acceptability, Consumption Frequency, and Factors Associated with Consumption of Fruits and Vegetables Among Low and Medium Income Consumers in Argentina. J. Sens. Stud. 2021, 36, 12632. [Google Scholar] [CrossRef]
- Laborde, D.; Martin, W.; Swinnen, J.; Vos, R. COVID-19 Risks to Global Food Security. Science 2020, 369, 500–502. [Google Scholar] [CrossRef]
- Metta, K.; Olabisi, L.; Wallace, R. A System Dynamics Approach to Examining Household Food Insecurity. J. Agric. Food Syst. Community Dev. 2021, 10, 455–472. [Google Scholar] [CrossRef]
- Swinnen, J.; Vos, R. COVID-19 Impacts on Global Food Systems and Household Welfare: Key Insights from the Special Issue. Agric. Econ. 2021, 52, 365–374. [Google Scholar] [CrossRef]
- Rahaman, A.; Kumari, A.; Zeng, X.; Khalifa, I.; Farooq, M.; Singh, N.; Ali, S.; Alee, M.; Aadil, R. The Increasing Hunger Concern and Current Need in the Development of Sustainable Food Security in the Developing Countries. Trends Food Sci. Technol. 2021, 113, 423–429. [Google Scholar] [CrossRef]
- Erokhin, V.; Gao, T. Impacts of COVID-19 on Trade and Economic Aspects of Food Security: Evidence from 45 Developing Countries. Int. J. Environ. Res. Public Health 2020, 17, 5775. [Google Scholar] [CrossRef] [PubMed]
- Food and Agriculture Organization of the United Nations; World Health Organization. Sustainable Healthy Diets–Guiding Principles; FAO: Rome, Italy, 2019; pp. 5–15. [Google Scholar]
- World Food Programme. COVID-19 Will Double Number of People Facing Food Crises Unless Swift Action Is Taken. Available online: https://www.wfpusa.org/news-release/covid-19-will-double-number-of-peoplefacing-food-crises-unless-swift-action-is-taken/ (accessed on 27 April 2021).
- Kose, M.A.; Nagle, P.; Ohnsorge, F.; Sugawara, N. Global Waves of Debt: Causes and Consequences; World Bank: Washington, DC, USA, 2020. [Google Scholar]
- Huang, G.; Tsai, F. Social Innovation for Food Security and Tourism Poverty Alleviation: Some Examples from China. Front. Psychol. 2021, 12, 614469. [Google Scholar] [CrossRef]
- Laborde, D.; Martin, W.; Vos, R. Impacts of COVID-19 on Global Poverty, Food Security and Diets. Agric. Econ. 2021, 52, 375–390. [Google Scholar] [CrossRef]
- Alarcon, P.; Dominguez-Salas, P.; Fevre, E.; Rushton, J. The Importance of a Food Systems Approach to Low and Middle Income Countries and Emerging Economies: A Review of Theories and Its Relevance for Disease Control and Malnutrition. Front. Sustain. Food Syst. 2021, 5, 642635. [Google Scholar] [CrossRef]
- Rousham, E.; Pradeilles, R.; Akparibo, R.; Aryeetey, R.; Bash, K.; Booth, A.; Muthuri, S.; Osei-Kwasi, H.; Marr, C.; Norris, T.; et al. Dietary Behaviours in the Context of Nutrition Transition: A Systematic Review and Meta-Analyses in Two African Countries. Public Health Nutr. 2020, 23, 1948–1964. [Google Scholar] [CrossRef] [PubMed]
- Global Nutrition Report. 2020 Global Nutrition Report: Action on Equity to End Malnutrition; Development Initiatives: Bristol, UK, 2020. [Google Scholar]
- Heady, D.; Heidkamp, R.; Osendarp, S.; Ruel, M.; Scott, N.; Black, R.; Shekar, M.; Bouis, H.; Flory, A.; Haddad, L.; et al. Impacts of COVID-19 on Childhood Malnutrition and Nutrition-Related Mortality. Lancet 2020, 396, 519–521. [Google Scholar] [CrossRef]
- Global Panel on Agriculture and Food Systems for Nutrition. The Cost of Malnutrition: Why Policy Action Is Urgent; Global Panel: London, UK, 2016. [Google Scholar]
- Hirvonen, K.; Minten, B.; Mohammed, B.; Tamru, S. Food Prices and Marketing Margins during the COVID-19 Pandemic: Evidence from Vegetable Value Chains in Ethiopia. Agric. Econ. 2021, 52, 407–421. [Google Scholar] [CrossRef]
- World Health Organization. Prevalence of Anaemia in Women of Reproductive Age–Estimates by Country; WHO: Geneva, Switzerland, 2017. [Google Scholar]
- World Health Organization. Vitamin and Mineral Nutrition Information System (VMNIS)–Micronutrients Database; WHO: Geneva, Switzerland, 2020. [Google Scholar]
- Conner, D.S.; Levine, R. Circles of Association: The Connections of Community-Based Food Systems. J. Hunger Environ. Nutr. 2007, 1, 5–25. [Google Scholar] [CrossRef]
- Fleischer, N.; Liese, A.; Hammond, R.; Coleman-Jensen, A.; Gundersen, C.; Hirschman, J.; Frongillo, E.; Ma, X.; Mehta, N.; Jones, S. Using Systems Science to Gain Insight into Childhood Food Security in the United States: Report of an Expert Mapping Workshop. J. Hunger Environ. Nutr. 2017, 13, 362–384. [Google Scholar] [CrossRef]
- Strack, F.; Deutsch, R. Reflective and Impulsive Determinants of Social Behavior. Personal. Soc. Psychol. Rev. 2004, 8, 220–247. [Google Scholar] [CrossRef] [PubMed]
- Mackenbach, J.D. Healthy Eating: A Matter of Prioritisation by Households or Policymakers? Public Health Nutr. 2021, 24, 1851–1853. [Google Scholar] [CrossRef] [PubMed]
- Jetter, K.M.; Adkins, J.; Cortez, S.; Hopper, G.K., Jr.; Shively, V.; Styne, D.M. Yes We Can: Eating Healthy on a Limited Budget. J. Nutr. Educ. Behav. 2019, 51, 268–276. [Google Scholar] [CrossRef] [PubMed]
- Ranjit, N.; Macias, S.; Hoelscher, D. Factors Related to Poor Diet Quality in Food Insecure Populations. Transnatl. Behav. Med. 2020, 10, 1297–1305. [Google Scholar] [CrossRef]
- Prabhakar, A.C.; Kaur, G.; Erokhin, V. Regional Trade and Development Strategies in the Era of Globalization; IGI Global: Hershey, PA, USA, 2020. [Google Scholar] [CrossRef]
- Sen, A. Poverty and Famines: An Essay on Entitlement and Deprivation; Oxford University Press: Oxford, UK, 1983. [Google Scholar]
- Urgell-Lahuerta, C.; Carrillo-Alvarez, E.; Salinas-Roca, B. Interventions on Food Security and Water Uses for Improving Nutritional Status of Pregnant Women and Children Younger Than Five Years in Low-Middle Income Countries: A Systematic Review. Int. J. Environ. Res. Public Health 2021, 18, 4799. [Google Scholar] [CrossRef]
- Malaiarasan, U.; Paramasivam, R.; Felix, T. Does Food Price Subsidy Affect Dietary Diversity? Evidence from South India. Margin–J. Appl. Econ. Res. 2021, 15, 268–290. [Google Scholar] [CrossRef]
- Herrera-Cuenca, M.; Jimenez, M.L.; Sifontes, Y. Challenges in Food Security, Nutritional, and Social Public Policies for Venezuela: Rethinking the Future. Front. Sustain. Food Syst. 2021, 5, 635981. [Google Scholar] [CrossRef]
- Beaulac, J.; Kristjansson, E.; Cummins, S. A Systematic Review of Food Deserts, 1966–2007. Prev. Chronic Dis. 2009, 6, A105. [Google Scholar]
- Hendrickson, D.; Smith, C.; Eikenberry, N. Fruit and Vegetable Access in Four Low-Income Food Deserts Communities in Minnesota. Agric. Hum. Values 2006, 23, 371–383. [Google Scholar] [CrossRef]
- Rizky Maulidiana, A.; Sutjiati, E. Low Intake of Essential Amino Acids and Other Risk Factors of Stunting Among Under-Five Children in Malang City, East Java, Indonesia. J. Public Health Res. 2021, 10, 2161. [Google Scholar] [CrossRef] [PubMed]
- Smita; Rajpal, S.; Lu, S.-Y.; Joe, W. Why Market Orientation Matters for Agriculture and Fishery Workers? Unravelling the Association Between Households’ Occupational Background and Caloric Deprivation in India. BMC Public Health 2021, 21, 681. [Google Scholar] [CrossRef] [PubMed]
- Carpio, C.; Kalenkoski, C.; Moyeda-Carabaza, A.; Murimi, M. The Effect of Time Use and Food Cost on Dietary Quality. Public Health Nutr. 2020, 23, 3284–3294. [Google Scholar] [CrossRef] [PubMed]
- Wu, B.; Shang, X.; Chen, Y. Household Dairy Demand by Income Groups in an Urban Chinese Province: A Multistage Budgeting Approach. Agribusiness 2020. [Google Scholar] [CrossRef]
- Sarica, D.; Demircan, V.; Erturk, A.; Arslantas, N. An Econometric Analysis of the Factors Affecting Consumers’ Bread Waste and Consumption Behaviour: A Case Study of Isparta Province, Turkey. Br. Food J. 2021, 123, 1449–1464. [Google Scholar] [CrossRef]
- Sikandar, F.; Erokhin, V.; Shu, W.H.; Rehman, S.; Ivolga, A. The Impact of Foreign Capital Inflows on Agriculture Development and Poverty Reduction: Panel Data Analysis for Developing Countries. Sustainability 2021, 13, 3242. [Google Scholar] [CrossRef]
- Qiu, H.; Leng, G.; Feng, X.; Yang, S. Effects of the Poverty Alleviation Relocation Program on Diet Quality Among Low-Income Households. China Agric. Econ. Rev. 2020. [Google Scholar] [CrossRef]
- World Health Organization. Double-Duty Actions for Nutrition. Policy Brief; WHO: Geneva, Switzerland, 2017. [Google Scholar]
- Hussein, M.; Law, C.; Fraser, I. An Analysis of Food Demand in a Fragile and Insecure Country: Somalia as a Case Study. Food Policy 2021, 101, 102092. [Google Scholar] [CrossRef]
- Reeves, A.; Loopstra, R.; Stuckler, D. The Growing Disconnect between Food Prices and Wages in Europe: Cross-National Analysis of Food Deprivation and Welfare Regimes in Twenty-One EU Countries, 2004–2012. Public Health Nutr. 2017, 20, 1414–1422. [Google Scholar] [CrossRef] [PubMed]
- Otsuka, K. Food Insecurity, Income Inequality, and the Changing Comparative Advantage in World Agriculture. Agric. Econ. 2013, 44, 7–18. [Google Scholar] [CrossRef]
- Power, E.M. Determinants of Healthy Eating Among Low-Income Canadians. Can. J. Public Health 2005, 96, 537–542. [Google Scholar]
- Esturk, O.; Ören, M.N. Impact of Household Socio-Economic Factors on Food Security: Case of Adana. Pak. J. Nutr. 2013, 13, 1–6. [Google Scholar] [CrossRef]
- Smith, L.C.; El Obeid, A.E.; Jensen, H.H. The Geography and Causes of Food Insecurity in Developing Countries. Agric. Econ. 2000, 22, 199–215. [Google Scholar] [CrossRef]
- Sonnino, R.; Faus, A.M.; Maggio, A. Sustainable Food Security: An Emerging Research and Policy Agenda. Int. J. Sociol. Agric. Food 2014, 21, 173–188. [Google Scholar]
- Elbushra, A.A.; Ahmed, A.E. Food Security in Sudan: A Historical Analysis of Food Availability. Iraqi J. Agric. Sci. 2020, 51, 422–431. [Google Scholar] [CrossRef][Green Version]
- Ritchie, H.; Reay, D.; Higgins, P. Sustainable Food Security in India–Domestic Production and Macronutrient Availability. PLoS ONE 2018, 13, e0193766. [Google Scholar] [CrossRef]
- Thome, K.; Meade, B.; Rosen, S.; Beghin, J.C. Assessing Food Security in Ethiopia. In World Agricultural Resources and Food Security (Frontiers of Economics and Globalization, Vol. 17); Schmitz, A., Kennedy, P.L., Schmitz, T.G., Eds.; Emerald Publishing Limited: Bingley, UK, 2017; pp. 207–219. [Google Scholar]
- Collins, S.M.; Owuor, P.M.; Miller, J.D.; Boateng, G.O.; Wekesa, P.; Onono, M.; Young, S.L. I Know How Stressful It Is to Lack Water! Exploring the Lived Experiences of Household Water Insecurity Among Pregnant and Postpartum Women in Western Kenya. Glob. Public Health 2019, 14, 649–662. [Google Scholar] [CrossRef]
- Smith, V.; Glauber, J. Trade, Policy, and Food Security. Agric. Econ. 2020, 51, 159–171. [Google Scholar] [CrossRef]
- Erokhin, V. Establishing Food Security and Alternatives to International Trade in Emerging Economies; IGI Global: Hershey, PA, USA, 2018. [Google Scholar] [CrossRef]
- Chavas, J.-P.; Hummels, D.; Wright, B.D. The Economics of Food Price Volatility; University of Chicago Press: Chicago, IL, USA, 2014. [Google Scholar]
- Erokhin, V.; Gao, T. Handbook of Research on Globalized Agricultural Trade and New Challenges for Food Security; IGI Global: Hershey, PA, USA, 2020. [Google Scholar] [CrossRef]
- Monterrosa, E.; Drewnowski, A.; de Pee, S.; Frongillo, E.; Vandevijvere, S. The Role of Culture, Economics, and Food Environment in Shaping Choices for Sustainable Diets. In Sustainable Healthy Diets–Guiding Principles; Food and Agriculture Organization of the United Nations: Rome, Italy; World Health Organization: Geneva, Switzerland; FAO: Rome, Italy, 2019; pp. 25–27. [Google Scholar]
- Drewnowski, A.; Popkin, B.M. The Nutrition Transition: New Trends in the Global Diet. Nutr. Rev. 1997, 55, 31–43. [Google Scholar] [CrossRef] [PubMed]
- Haddad, L.; Hawkes, C.; Waage, J.; Webb, P.; Godfra, C.; Toulmin, C. Food Systems and Diets: Facing the Challenges of the 21st Century; Global Panel on Agriculture and Food Systems for Nutrition: London, UK, 2016. [Google Scholar]
- Yeung, M.; Kerr, W.; Coomber, B.; Lantz, M.; McConnell, A. The Importance of Trade for Food Security. In Declining International Cooperation on Pesticide Regulation; Yeung, M., Kerr, W., Coomber, B., Lantz, M., McConnell, A., Eds.; Palgrave Macmillan: Cham, Switzerland, 2017; pp. 11–18. [Google Scholar] [CrossRef]
- Verter, N. Food Security and Trade in Food Products in Nigeria. Eur. J. Sustain. Dev. 2019, 8, 527. [Google Scholar] [CrossRef]
- Hachem, F.; Vanham, D.; Moreno, L. Territorial Diets. In Sustainable Healthy Diets–Guiding Principles; Food and Agriculture Organization of the United Nations: Rome, Italy; World Health Organization: Geneva, Switzerland; FAO: Rome, Italy, 2019; pp. 29–31. [Google Scholar]
- World Health Organization. Healthy Diet. Available online: https://www.who.int/news-room/fact-sheets/detail/healthy-diet (accessed on 26 April 2021).
- Jaffee, S.M.; Henson, S.; Unnevehr, L.J.; Delia, G.; Cassou, E. The Safe Food Imperative: Accelerating Progress in Low and Middle-Income Countries; World Bank: Washington, DC, USA, 2019. [Google Scholar]
- Wood, S.A.; Smith, M.R.; Fanzo, J.; Remans, R.; DeFries, R.S. Trade and the Equitability of Global Food Nutrient Distribution. Nat. Sustain. 2018, 1, 34–37. [Google Scholar] [CrossRef]
- Micha, R.; Coates, J.; Leclercq, C.; Charrondiere, U.R.; Mozaffarian, D. Global Dietary Surveillance: Data Gaps and Challenges. Food Nutr. Bull. 2018, 39, 175–205. [Google Scholar] [CrossRef] [PubMed]
- Imamura, F.; Micha, R.; Khatibzadeh, S.; Fahimi, S.; Shi, P.; Powles, J.; Mozaffarian, D. Dietary Quality Among Men and Women in 187 Countries in 1990 and 2010: A Systematic Assessment. Lancet Glob. Health 2015, 3, e132–e142. [Google Scholar] [CrossRef]
- Food and Agriculture Organization of the United Nations. Data. Available online: http://www.fao.org/faostat/en/#data (accessed on 13 April 2021).
- United Nations Conference on Trade and Development. Data Center. Available online: https://unctadstat.unctad.org/EN/ (accessed on 13 April 2021).
- World Trade Organization. Statistics on Merchandise Trade. Available online: https://www.wto.org/english/res_e/statis_e/merch_trade_stat_e.htm (accessed on 21 April 2021).
- Food and Agriculture Organization of the United Nations. FAO/WHO GIFT–Global Individual Food Consumption Data Tool. Available online: www.fao.org/gift-individual-food-consumption/en (accessed on 14 April 2021).
- Zainodin, H.J.; Khuneswari, G.; Noraini, A.; Haider, F.A.A. Selected Model Systematic Sequence via Variance Inflationary Factor. Int. J. Appl. Phys. Math. 2015, 5, 105–114. [Google Scholar] [CrossRef]
- Bowerman, B.L.; O’Connell, R.T. Linear Statistical Models: An Applied Approach; PWS-Kent Publishing Company: Boston, USA, 1990. [Google Scholar]
- Dan, L.; Vallant, R. Variance Inflation Factors in the Analysis of Complex Survey Data. Surv. Methodol. 2012, 38, 53–62. [Google Scholar]
- Gao, T.; Erokhin, V. Capturing a Complexity of Nutritional, Environmental, and Economic Impacts on Selected Health Parameters in the Russian High North. Sustainability 2020, 12, 2151. [Google Scholar] [CrossRef]
- Montgomery, D.; Peck, E.; Vining, G. Introduction to Linear Regression Analysis; Wiley: New York, NY, USA, 2012. [Google Scholar]
- Kutner, M.; Nachtsheim, C.; Neter, J.; Li, W. Applied Linear Statistical Models; McGraw-Hill/Irwin: New York, NY, USA, 2005. [Google Scholar]
- Snee, R.D. Some Aspects of Nonorthogonal Data Analysis, Part I. Developing Prediction Equations. J. Qual. Technol. 1973, 5, 67–79. [Google Scholar] [CrossRef]
- Levine, D.M.; Stephan, D.F.; Szabat, K.A. Statistics for Managers. Using Microsoft Excel; Pearson: London, UK, 2017. [Google Scholar]
- Johnsson, T. A Procedure for Stepwise Regression Analysis. Stat. Pap. 1992, 33, 21–29. [Google Scholar] [CrossRef]
- Zhou, X.; Jiang, T. Metamodel Selection Based on Stepwise Regression. Struct. Multidiscip. Optim. 2016, 54, 641–657. [Google Scholar] [CrossRef]
- Evans, R.D. Two Experiments with Stepwise Regression. J. Econ. Finance 1991, 15, 35–42. [Google Scholar]
- Qi, Y.; Liu, G.; Zhang, W. A Matlab Program for Stepwise Regression. Netw. Pharmacol. 2016, 1, 36–41. [Google Scholar]
- Gupta, S.S. On Some Multiple Decision (Selection and Ranking) Rules. Technometrics 1965, 7, 225–245. [Google Scholar] [CrossRef]
- Hosmer, D.; Jovanovic, B.; Lemeshow, S. Best Subsets Logistic Regression. Biometrics 1989, 45, 1265–1270. [Google Scholar] [CrossRef]
- Sullivan, D.W.; Wilson, J.R. Restricted Subset Selection Procedures for Simulation. Oper. Res. 1989, 37, 52–71. [Google Scholar] [CrossRef]
- Tamura, R.; Kobayashi, K.; Takano, Y.; Miyashiro, R.; Nakata, K.; Matsui, T. Best Subset Selection for Eliminating Multicollinearity. J. Oper. Res. Soc. Jpn. 2017, 60, 321–336. [Google Scholar] [CrossRef][Green Version]
- Erokhin, V. Measuring Food and Nutrition Security in Circumpolar Communities. Macro Manag. Public Policies 2019, 2, 18–28. [Google Scholar] [CrossRef]
- Lambert, J.; Gong, L.; Elliott, C.; Thompson, K.; Stromberg, A. rFSA: An R Package for Finding Best Subsets and Interactions. R J. 2018, 10, 295–308. [Google Scholar] [CrossRef]
- Chen, L.-Y.; Lee, S. Best Subset Binary Prediction. J. Econom. 2018, 206, 39–56. [Google Scholar] [CrossRef]
- Erokhin, V. Health-Related Effects of Food and Nutrition Security: An Evidence of the Northern Communities in Russia. West. Balk. J. Agric. Econ. Rural Dev. 2019, 1, 11–28. [Google Scholar] [CrossRef]
- Rencher, A.; Pun, F.C. Inflation of R2 in Best Subset Regression. Technometrics 1980, 22, 49–53. [Google Scholar] [CrossRef]
- Ermakov, V.; Barbaumov, V.; Kriventsova, N.; Lebedev, A.; Matveev, V.; Rudyk, B.; Silaeva, E.; Smagina, O. Handbook on Mathematics for Economists; Plekhanov Russian University of Economics: Moscow, Russia, 2007. [Google Scholar]
- Nikolov, N.; Stoimenova, E. Mallows’ Models for Imperfect Ranking in Ranked Set Sampling. AStA Adv. Stat. Anal. 2019. [Google Scholar] [CrossRef]
- Alshqaq, S.; Abuzaid, A. On the Robustness of Mallows’ Cp Criterion. Commun. Stat. Simul. Comput. 2021. [Google Scholar] [CrossRef]
- Hansen, B.E. Least Squares Model Averaging. Econometrica 2007, 75, 1175–1189. [Google Scholar] [CrossRef]
- Irurozki, E.; Calvo, B.; Lozano, J. Mallows and Generalized Mallows Model for Matchings. Bernoulli 2019, 25, 1160–1188. [Google Scholar] [CrossRef]
- Liao, J.; Zou, G. Corrected Mallows Criterion for Model Averaging. Comput. Stat. Data Anal. 2020, 144, 106902. [Google Scholar] [CrossRef]
- Feng, Y.; Liu, Q.; Okui, R. On the Sparsity of Mallows Model Averaging Estimator. Econ. Lett. 2020, 187, 108916. [Google Scholar] [CrossRef]
- Aydin, D.; Yilmaz, E. Truncation Level Selection in Nonparametric Regression Using Pade Approximation. Commun. Stat. Simul. Comput. 2021, 50, 744–763. [Google Scholar] [CrossRef]
- World Bank. World Bank Country and Lending Groups. Available online: https://datahelpdesk.worldbank.org/knowledgebase/articles/906519-world-bank-country-and-lending-groups (accessed on 14 April 2021).
- Erokhin, V.; Li, D.; Du, P. Sustainability-Related Implications of Competitive Advantages in Agricultural Value Chains: Evidence from Central Asia–China Trade and Investment. Sustainability 2020, 12, 1117. [Google Scholar] [CrossRef]
- Katzer, N. Obsessed by Efficiency and Productivity in Agriculture? Krit. Explor. Russ. Eurasian Hist. 2021, 22, 210–218. [Google Scholar] [CrossRef]
- Constantin, M.; Radulescu, I.D.; Andrei, J.V.; Chivu, L.; Erokhin, V.; Gao, T. A Perspective on Agricultural Labor Productivity and Greenhouse Gas Emissions in Context of the Common Agricultural Policy Exigencies. Econ. Agric. 2021, 68, 53–67. [Google Scholar] [CrossRef]
- Erokhin, V. Factors Influencing Food Markets in Developing Countries: An Approach to Assess Sustainability of the Food Supply in Russia. Sustainability 2017, 9, 1313. [Google Scholar] [CrossRef]
- Johnson, D.G. World Agriculture, Commodity Policy, and Price Variability. Am. J. Agric. Econ. 1975, 57, 823–828. [Google Scholar] [CrossRef]
- Ivanic, M.; Martin, W. Implications of Higher Global Food Prices for Poverty in Low-Income Countries. Agric. Econ. 2008, 39, 405–416. [Google Scholar] [CrossRef]
- Abbott, P. Export Restrictions as Stabilization Responses to Food Crisis. Am. J. Agric. Econ. 2011, 94, 428–434. [Google Scholar] [CrossRef]
- Anderson, K.; Nelgen, S. Trade Barrier Volatility and Agricultural Price Stabilization. World Dev. 2012, 40, 36–48. [Google Scholar] [CrossRef]
- Ma, L.; Feng, S.; Reidsma, P.; Qu, F.; Heerink, N. Identifying Entry Points to Improve Fertilizer Use Efficiency in Taihu Basin, China. Land Use Policy 2014, 37, 52–59. [Google Scholar] [CrossRef]
- Smith, L.E.D.; Siciliano, G. A Comprehensive Review of Constraints to Improved Management of Fertilizers in China and Mitigation of Diffuse Water Pollution from Agriculture. Agric. Ecosyst. Environ. 2015, 209, 15–25. [Google Scholar] [CrossRef]
- Galeana-Pizana, M.; Couturier, S.; Figueroa, D.; Jimenez, A.D. Is Rural Food Security Primarily Associated with Smallholder Agriculture or with Commercial Agriculture?: An Approach to the Case of Mexico Using Structural Equation Modeling. Agric. Syst. 2021, 190, 103091. [Google Scholar] [CrossRef]
- Van Wesenbeeck, C.F.A.; Keyzer, M.A.; Van Veen, W.C.M.; Qiu, H. Can China’s Overuse of Fertilizer Be Reduced without Threatening Food Security and Farm Incomes? Agric. Syst. 2021, 190, 103093. [Google Scholar] [CrossRef]
- Ju, X.; Kou, C.; Zhang, F.; Christie, P. Nitrogen Balance and Groundwater Nitrate Contamination: Comparison among Three Intensive Cropping Systems on the North China Plain. Environ. Pollut. 2006, 143, 117–125. [Google Scholar] [CrossRef]
- Chen, N.; Widjajanto, D.W.; Zheng, Y. Soil Problems in China and Its Lessons for Other Developing Countries. IOP Conf. Ser. Earth Environ. Sci. 2017, 102, 012001. [Google Scholar] [CrossRef]
- Kahrl, F.; Li, Y.; Su, Y.; Tennigkeit, T.; Wilkes, A.; Xu, J. Greenhouse Gas Emissions from Nitrogen Fertilizer Use in China. Environ. Sci. Policy 2010, 13, 688–694. [Google Scholar] [CrossRef]
- Li, B.; Huang, S.; Wei, M.; Zhang, H.; Shen, A.; Xu, J.; Ruan, X. Dynamics of Soil and Grain Micronutrients as Affected by Long-Term Fertilization in an Aquic Inceptisol. Pedosphere 2010, 20, 725–735. [Google Scholar] [CrossRef]
- Mihajlov, A.; Puda, A. Climate-Responsible Diet; Environmental Ambassadors for Sustainable Development: Belgrade, Serbia, 2020. [Google Scholar]
- Piras, S.; Pancotto, F.; Righi, S.; Vittuari, M.; Setti, M. Community Social Capital and Status: The Social Dilemma of Food Waste. Ecol. Econ. 2021, 183, 106954. [Google Scholar] [CrossRef]
- Eini-Zinab, H.; Sobhani, S.R.; Rezazadeh, A. Designing a Healthy, Low-Cost and Environmentally Sustainable Food Basket: An Optimisation Study. Public Health Nutr. 2021, 24, 1952–1961. [Google Scholar] [CrossRef]
- Ecker, O.; Hatzenbuehler, P. Food Consumption-Production Response to Agricultural Policy and Macroeconomic Change in Nigeria. Appl. Econ. Perspect. Policy 2021. [Google Scholar] [CrossRef]
- Vermeulen, S.; Campbell, B.; Ingram, J. Climate Change and Food Systems. Annu. Rev. Environ. Resour. 2012, 37, 195–222. [Google Scholar] [CrossRef]
- Myers, S.; Smith, M.; Guth, S.; Golden, C.; Vaitla, B.; Mueller, N.; Dangour, A.; Huybers, P. Climate Change and Global Food Systems: Potential Impacts on Food Security and Undernutrition. Annu. Rev. Public Health 2017, 38, 259–277. [Google Scholar] [CrossRef] [PubMed]
- Hanson, K.L.; Connor, L.M. Food Insecurity and Dietary Quality in US Adults and Children: A Systematic Review. Am. J. Clin. Nutr. 2014, 100, 684–692. [Google Scholar] [CrossRef] [PubMed]
- Johnson, C.M.; Sharkey, J.R.; Lackey, M.J.; Adair, L.S.; Aiello, A.E.; Bowen, S.K.; Fang, W.; Flax, V.L.; Ammerman, A.S. Relationship of Food Insecurity to Women’s Dietary Outcomes: A Systematic Review. Nutr. Rev. 2018, 76, 910–928. [Google Scholar] [CrossRef] [PubMed]
- Leung, C.W.; Epel, E.S.; Ritchie, L.D.; Crawford, P.B.; Laraia, B.A. Food Insecurity Is Inversely Associated with Diet Quality of Lower-Income Adults. J. Acad. Nutr. Diet. 2014, 114, 1943–1953. [Google Scholar] [CrossRef] [PubMed]
- Green, R.; Cornelsen, L.; Dangour, A.D.; Turner, R.; Shankar, B.; Mazzocchi, M.; Smith, R.D. The Effect of Rising Food Prices on Food Consumption: Systematic Review with Meta-Regression. BMJ 2013, 346, f3703. [Google Scholar] [CrossRef]
- Mundo-Rosas, V.; de la Cruz-Góngora, V.; Jiménez-Aguilar, A.; Shamah-Levy, T. Dietary Diversity and Nutrient Intake in Children 24 to 59 Months Old and Their Association with Food Insecurity. Salud Publica De Mex. 2014, 56 (Suppl. S1), S39–S46. [Google Scholar] [CrossRef]
- Ballard, T.; Kepple, A.; Cafiero, C. The Food Insecurity Experience Scale: Development of a Global Standard for Monitoring Hunger Worldwide; FAO: Rome, Italy, 2013. [Google Scholar]
- Vega-Macedo, M.; Shamah-Levy, T.; Peinador-Roldán, R.; Méndez-Gómez Humarán, I.; Melgar-Quiñónez, H. Food Insecurity and Variety of Food in Mexican Households with Children Under Five Years. Salud Publica De Mex. 2014, 56 (Suppl. S1), S21–S30. [Google Scholar] [CrossRef][Green Version]
- Stewart, H.; Hyman, J.; Dong, D.; Carlson, A. The More That Households Prioritise Healthy Eating, the Better They Can Afford to Consume a Sufficient Quantity and Variety of Fruits and Vegetables. Public Health Nutr. 2021, 24, 1841–1850. [Google Scholar] [CrossRef]
- Food and Agriculture Organization of the United Nations; World Health Organization. Fruit and Vegetables for Health; FAO: Rome, Italy, 2004. [Google Scholar]
- World Health Organization. Diet, Nutrition and the Prevention of Chronic Diseases; WHO: Geneva, Switzerland, 2003. [Google Scholar]
- Hall, J.; Moore, S.; Harper, S.; Lynch, J. Global Variability in Fruit and Vegetable Consumption. Am. J. Prev. Med. 2009, 36, 402–409. [Google Scholar] [CrossRef]
- Afshin, A.; Sur, P.J.; Fay, K.; Cornaby, L.; Ferrara, G.; Salama, J.; Mullany, E.; Abate, K.H.; Abbafati, C.; Abebe, Z.; et al. Health Effects of Dietary Risks in 195 Countries, 1990-2017: A Systematic Analysis for the Global Burden of Disease Study 2017. Lancet 2019, 393, 1958–1972. [Google Scholar] [CrossRef]
- Ryckman, T.; Beal, T.; Nordhagen, S.; Murira, Z.; Torlesse, H. Affordability of Nutritious Foods for Complementary Feeding in South Asia. Nutr. Rev. 2021, 79, 52–68. [Google Scholar] [CrossRef]
- Herforth, A.; Ahmed, S. The Food Environment, Its Effects on Dietary Consumption, and Potential for Measurement within Agriculture-Nutrition Interventions. Food Secur. 2015, 7, 505–520. [Google Scholar] [CrossRef]
- Dizon, F.; Herforth, A.; Wang, Z. The Cost of a Nutritious Diet in Afghanistan, Bangladesh, Pakistan, and Sri Lanka. Glob. Food Secur. 2019, 21, 38–51. [Google Scholar] [CrossRef]
- Beydoun, M.A.; Powell, L.M.; Chen, X.; Wang, Y. Food Prices Are Associated with Dietary Quality, Fast Food Consumption, and Body Mass Index Among U.S. Children and Adolescents. J. Nutr. 2011, 141, 304–311. [Google Scholar] [CrossRef]
- Grossman, M.; Tekin, E.; Wada, R. Food Prices and Body Fatness Among Youths. Econ. Hum. Biol. 2014, 12, 4–19. [Google Scholar] [CrossRef]
- Headey, D.D.; Alderman, H.H. The Relative Caloric Prices of Healthy and Unhealthy Foods Differ Systematically Across Income Levels and Continents. J. Nutr. 2019, 149, 2020–2033. [Google Scholar] [CrossRef] [PubMed]
- Ryckman, T.; Beal, T.; Nordhagen, S.; Chimanya, K.; Matji, J. Affordability of Nutritious Foods for Complementary Feeding in Eastern and Southern Africa. Nutr. Rev. 2021, 79, 35–51. [Google Scholar] [CrossRef]
- Morris, S.S.; Garg, A.; Black, R.E. Nutrient Gaps and Affordability of Complementary Foods in Eastern and Southern Africa and South Asia. Nutr. Rev. 2021, 79, 1–3. [Google Scholar] [CrossRef] [PubMed]
- World Cancer Research Fund; American Institute for Cancer Research. Diet, Nutrition, Physical Activity and Cancer: A Global Perspective; World Cancer Research Fund: London, UK, 2018. [Google Scholar]
- Bakalis, S.; Valdramidis, V.; Argyropoulos, D.; Ahrne, L.; Chen, J.; Cullen, P.; Cummins, E.; Datta, A.; Emmanouilidis, C.; Foster, T.; et al. Perspectives from CO+RE: How COVID-19 Changed Our Food Systems and Food Security Paradigms. Curr. Res. Food Sci. 2020, 3, 166–172. [Google Scholar] [CrossRef] [PubMed]
- Garcia, S.P.; Haddix, A.; Barnett, K. Incremental Health Care Costs Associated with Food Insecurity and Chronic Conditions among Older Adults. Prev. Chronic Dis. 2018, 15, 1–11. [Google Scholar] [CrossRef] [PubMed]
- Berkowitz, S.A.; Basu, S.; Meigs, J.B.; Seligman, H.K. Food Insecurity and Health Care Expenditures in the United States, 2011–2013. Health Serv. Res. 2018, 53, 1600–1620. [Google Scholar] [CrossRef] [PubMed]
- Gundersen, C.; Ziliak, J.P. Food Insecurity and Health Outcomes. Health Aff. 2015, 34, 1830–1839. [Google Scholar] [CrossRef] [PubMed]
- Dorce, L.C.; da Silva, M.C.; Mauad, J.R.C.; Domingues, C.H.D.; Borges, J.A.R. Extending the Theory of Planned Behavior to Understand Consumer Purchase Behavior for Organic Vegetables in Brazil: The Role of Perceived Health Benefits, Perceived Sustainability Benefits and Perceived Price. Food Qual. Prefer. 2021, 91, 104191. [Google Scholar] [CrossRef]
- Panait, M.; Erokhin, V.; Andrei, J.V.; Gao, T. Implication of TNCs in Agri-Food Sector–Challenges, Constraints and Limits–Profit or CSR? Strateg. Manag. 2020, 20, 33–43. [Google Scholar] [CrossRef]
- Chandra, H.; Aditya, K.; Gupta, S.; Guha, S.; Verma, B. Food and Nutrition in the Indo-Gangetic Plain Region-A Disaggregate Level Analysis. Curr. Sci. 2020, 119, 1783–1788. [Google Scholar] [CrossRef]
- Kern, D.M.; Auchincloss, A.H.; Robinson, L.F.; Stehr, M.F.; Pham-Kanter, G. Healthy and Unhealthy Food Prices across Neighborhoods and Their Association with Neighborhood Socioeconomic Status and Proportion Black/Hispanic. J. Urban Health 2017, 94, 494–505. [Google Scholar] [CrossRef]
- Bai, Y.; Alemu, R.; Block, S.A.; Headey, D.; Masters, W.A. Cost and Affordability of Nutritious Diets at Retail Prices: Evidence from 177 Countries. Food Policy 2021, 99, 101983. [Google Scholar] [CrossRef]
- Van Hoyweghen, K.; Fabry, A.; Feyaerts, H.; Wade, I.; Maertens, M. Resilience of Global and Local Value Chains to the Covid-19 Pandemic: Survey Evidence from Vegetable Value Chains in Senegal. Agric. Econ. 2021, 52, 423–440. [Google Scholar] [CrossRef]
- Shahzad, M.; Qing, P.; Rizwan, M.; Razzaq, A.; Faisal, M. COVID-19 Pandemic, Determinants of Food Insecurity, and Household Mitigation Measures: A Case Study of Punjab, Pakistan. Healthcare 2021, 9, 621. [Google Scholar] [CrossRef]
- Ceballos, F.; Hernandez, M.; Paz, C. Short-Term Impacts of COVID-19 on Food Security and Nutrition in Rural Guatemala: Phone-Based Farm Household Survey Evidence. Agric. Econ. 2021, 52, 477–494. [Google Scholar] [CrossRef] [PubMed]
- Muhammad, A.; D’Souza, A.; Meade, B.; Micha, R.; Mozaffarian, D. How Income and Food Prices Influence Global Dietary Intakes by Age and Sex: Evidence from 164 Countries. BMJ Glob. Health 2017, 2, e000184. [Google Scholar] [CrossRef] [PubMed]
- Allee, A.; Lynd, L.; Vaze, V. Cross-National Analysis of Food Security Drivers: Comparing Results Based on the Food Insecurity Experience Scale and Global Food Security Index. Food Secur. 2021. [Google Scholar] [CrossRef]
- Erokhin, V. Self-Sufficiency versus Security: How Trade Protectionism Challenges the Sustainability of the Food Supply in Russia. Sustainability 2017, 9, 1939. [Google Scholar] [CrossRef]
- Popkin, B.M. The Nutrition Transition in Low-Income Countries: An Emerging Crisis. Nutr. Rev. 1994, 52, 285–298. [Google Scholar] [CrossRef]
- Bonaccio, M.; Di Castelnuovo, A.; Bonanni, A.; Costanzo, S.; Persichillo, M.; Cerletti, C.; Donati, M.B.; de Gaetano, G.; Iacoviello, L. Socioeconomic Status and Impact of the Economic Crisis on Dietary Habits in Italy: Results from the INHES Study. J. Public Health 2018, 40, 703–712. [Google Scholar] [CrossRef]
- Popkin, B.M.; Adair, L.S.; Ng, S.W. Global Nutrition Transition and the Pandemic of Obesity in Developing Countries. Nutr. Rev. 2012, 70, 3–21. [Google Scholar] [CrossRef] [PubMed]
- Annim, S.K.; Frempong, R.B. Effects of Access to Credit and Income on Dietary Diversity in Ghana. Food Secur. 2018, 10, 1649–1663. [Google Scholar] [CrossRef]
- Lewis, M.; McNaughton, S.; Rychetnik, L.; Lee, A. A Systematic Scoping Review of the Habitual Dietary Costs in Low Socioeconomic Groups Compared to High Socioeconomic Groups in Australia. Nutr. J. 2020, 19, 139. [Google Scholar] [CrossRef] [PubMed]
- Cui, K.; Shoemaker, S.P. A Look at Food Security in China. NPJ Sci. Food 2018, 2, 4. [Google Scholar] [CrossRef]
- Fu, J.; Lyu, D.; Sun, J. China’s Grain Trade Research Based on DEA Model of National Food Security Perspective: Soybean as an Example. Tech. Gaz. 2021, 28, 609–615. [Google Scholar] [CrossRef]
- Liu, Y.; Zhuo, L.; Varis, O.; Fang, K.; Liu, G.; Wu, P. Enhancing Water and Land Efficiency in Agricultural Production and Trade Between Central Asia and China. Sci. Total Environ. 2021, 780, 146584. [Google Scholar] [CrossRef] [PubMed]
- Hodges, J.; Kimball, A.M. The Global Diet: Trade and Novel Infections. Glob. Health 2005, 1, 4. [Google Scholar] [CrossRef]
- Fanzo, J.; Davis, C. Transformations Across Diets and Food Systems. In Global Food Systems, Diets, and Nutrition; Fanzo, J., Davis, C., Eds.; Palgrave Macmillan: Cham, Switzerland, 2021; pp. 71–84. [Google Scholar] [CrossRef]
- De Raymond, A.B.; Alpha, A.; Ben-Ari, T.; Daviron, B.; Nesme, T.; Tetart, G. Systemic Risk and Food Security. Emerging Trends and Future Avenues for Research. Glob. Food Secur. Agric. Policy Econ. Environ. 2021, 29, 100547. [Google Scholar] [CrossRef]
- Hendrix, C.S. Wrong Tools, Wrong Time: Food Export Bans in the Time of COVID-19. Available online: https://www.piie.com/blogs/realtime-economic-issues-watch/wrong-tools-wrong-time-foodexport-bans-time-covid-19 (accessed on 1 July 2021).
- Frankenberg, E.; Thomas, D. Human Capital and Shocks: Evidence on Education, Health, and Nutrition. In The Economics of Poverty Traps; Barrett, C.B., Carter, M.R., Chavas, J.-P., Eds.; National Bureau of Economic Research: Cambridge, MA, USA, 2019; pp. 23–56. [Google Scholar] [CrossRef]
- Martin, W.; Anderson, K. Export Restrictions and Price Insulation During Commodity Price Booms; The World Bank: Washington, DC, USA, 2011. [Google Scholar]
- Deuss, A. Impact of Agricultural Export Restrictions on Prices in Importing Countries; OECD Publishing: Paris, France, 2017. [Google Scholar]
- Puma, M.; Bose, S.; Chon, S.Y.; Cook, B. Assessing the Evolving Fragility of the Global Food System. Environ. Res. Lett. 2015, 10, 024007. [Google Scholar] [CrossRef]
- Nath, R.; Luan, Y.; Yang, W.; Yang, C.; Chen, W.; Li, Q.; Cui, X. Changes in Arable Land Demand for Food in India and China: A Potential Threat to Food Security. Sustainability 2015, 7, 5371–5397. [Google Scholar] [CrossRef]
- Filiberto, D.M.; Gaunt, J.L. Practicality of Biochar Additions to Enhance Soil and Crop Productivity. Agriculture 2013, 3, 715–725. [Google Scholar] [CrossRef]
- Hijbeek, R.; Van Loon, M.P.; Ouaret, W.; Boekelo, B.; Van Ittersum, M.K. Liming Agricultural Soils in Western Kenya: Can Long-Term Economic and Environmental Benefits Pay off Short Term Investments? Agric. Syst. 2021, 190, 103095. [Google Scholar] [CrossRef]
- Brennan, A.; Browne, S. Food Waste and Nutrition Quality in the Context of Public Health: A Scoping Review. Int. J. Environ. Res. Public Health 2021, 18, 5379. [Google Scholar] [CrossRef]
- Santeramo, F.G.; Lamonaca, E. Food Loss–Food Waste–Food Security: A New Research Agenda. Sustainability 2021, 13, 4642. [Google Scholar] [CrossRef]

Publisher’s Note: MDPI stays neutral with regard to jurisdictional claims in published maps and institutional affiliations. |
© 2021 by the authors. Licensee MDPI, Basel, Switzerland. This article is an open access article distributed under the terms and conditions of the Creative Commons Attribution (CC BY) license (https://creativecommons.org/licenses/by/4.0/).