
Analysis of Hydrothermal Systems Beneath Tayukeng through Long-Term Geochemical Signals of Hydrothermal Fluids in Tatun Volcano Group, Taiwan


Abstract
:1. Introduction
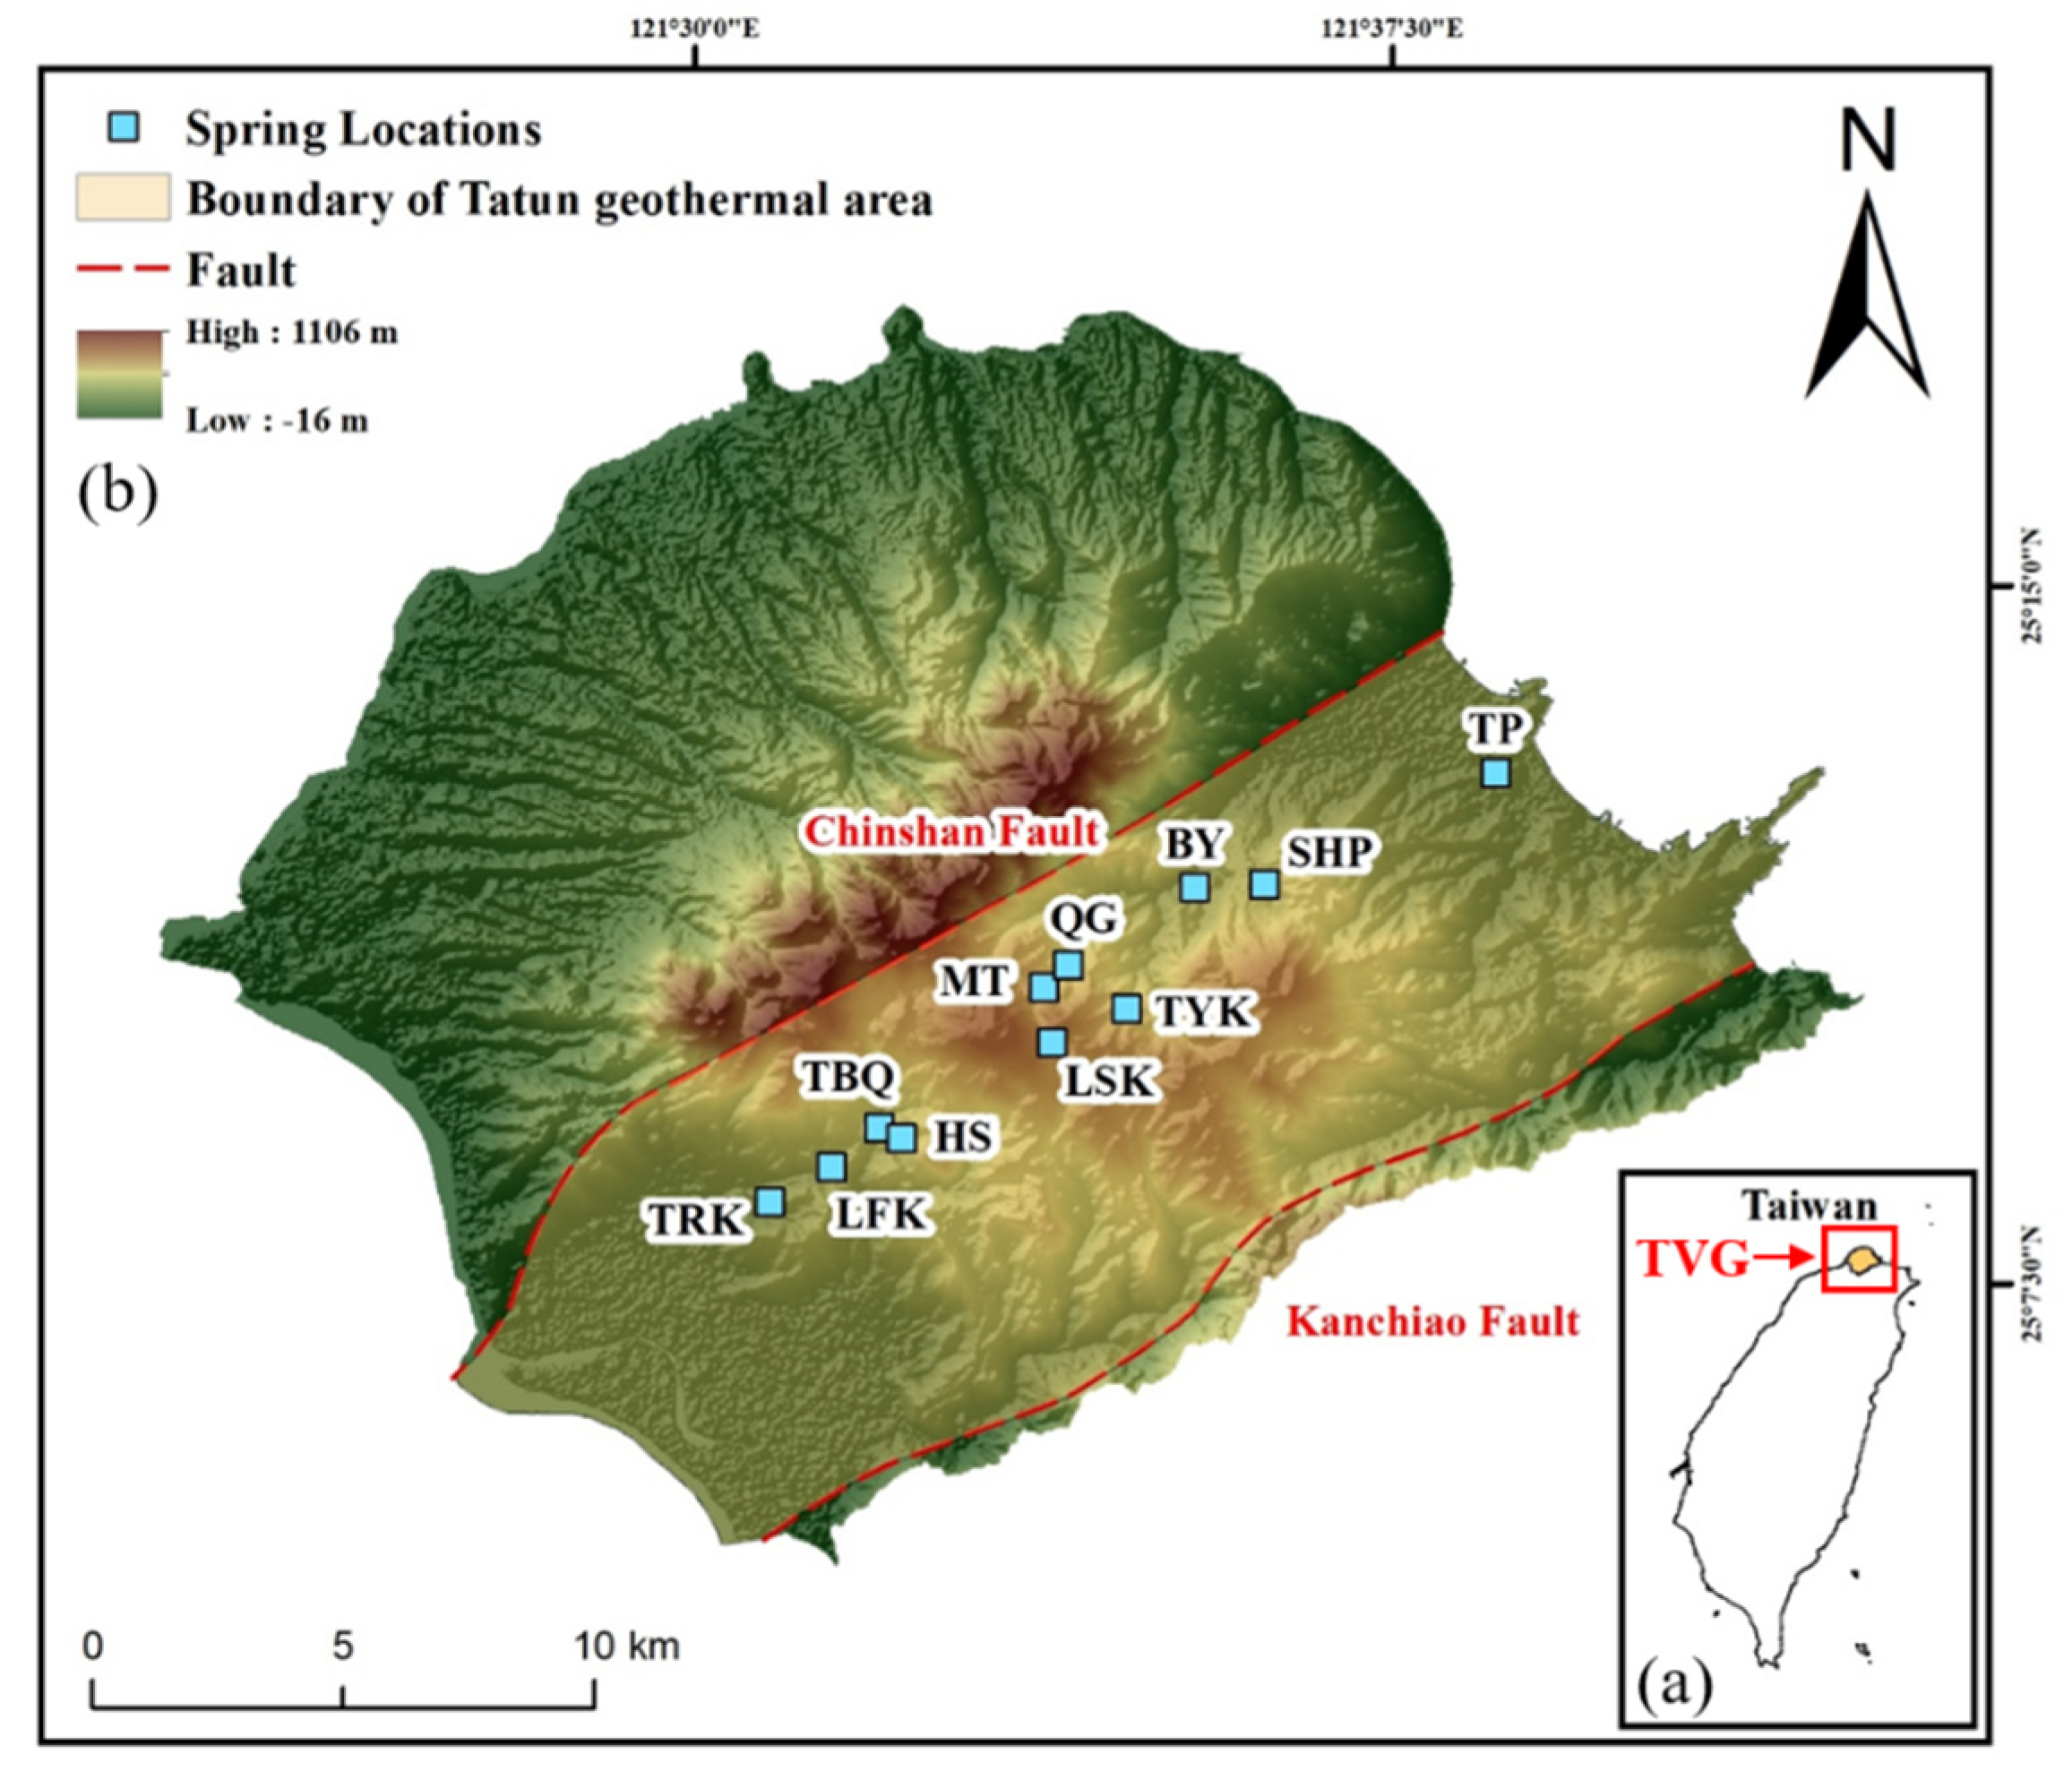
2. Study Area
3. Methodology
3.1. Data Source
3.2. Method of Data Analysis
3.3. Geothermometer
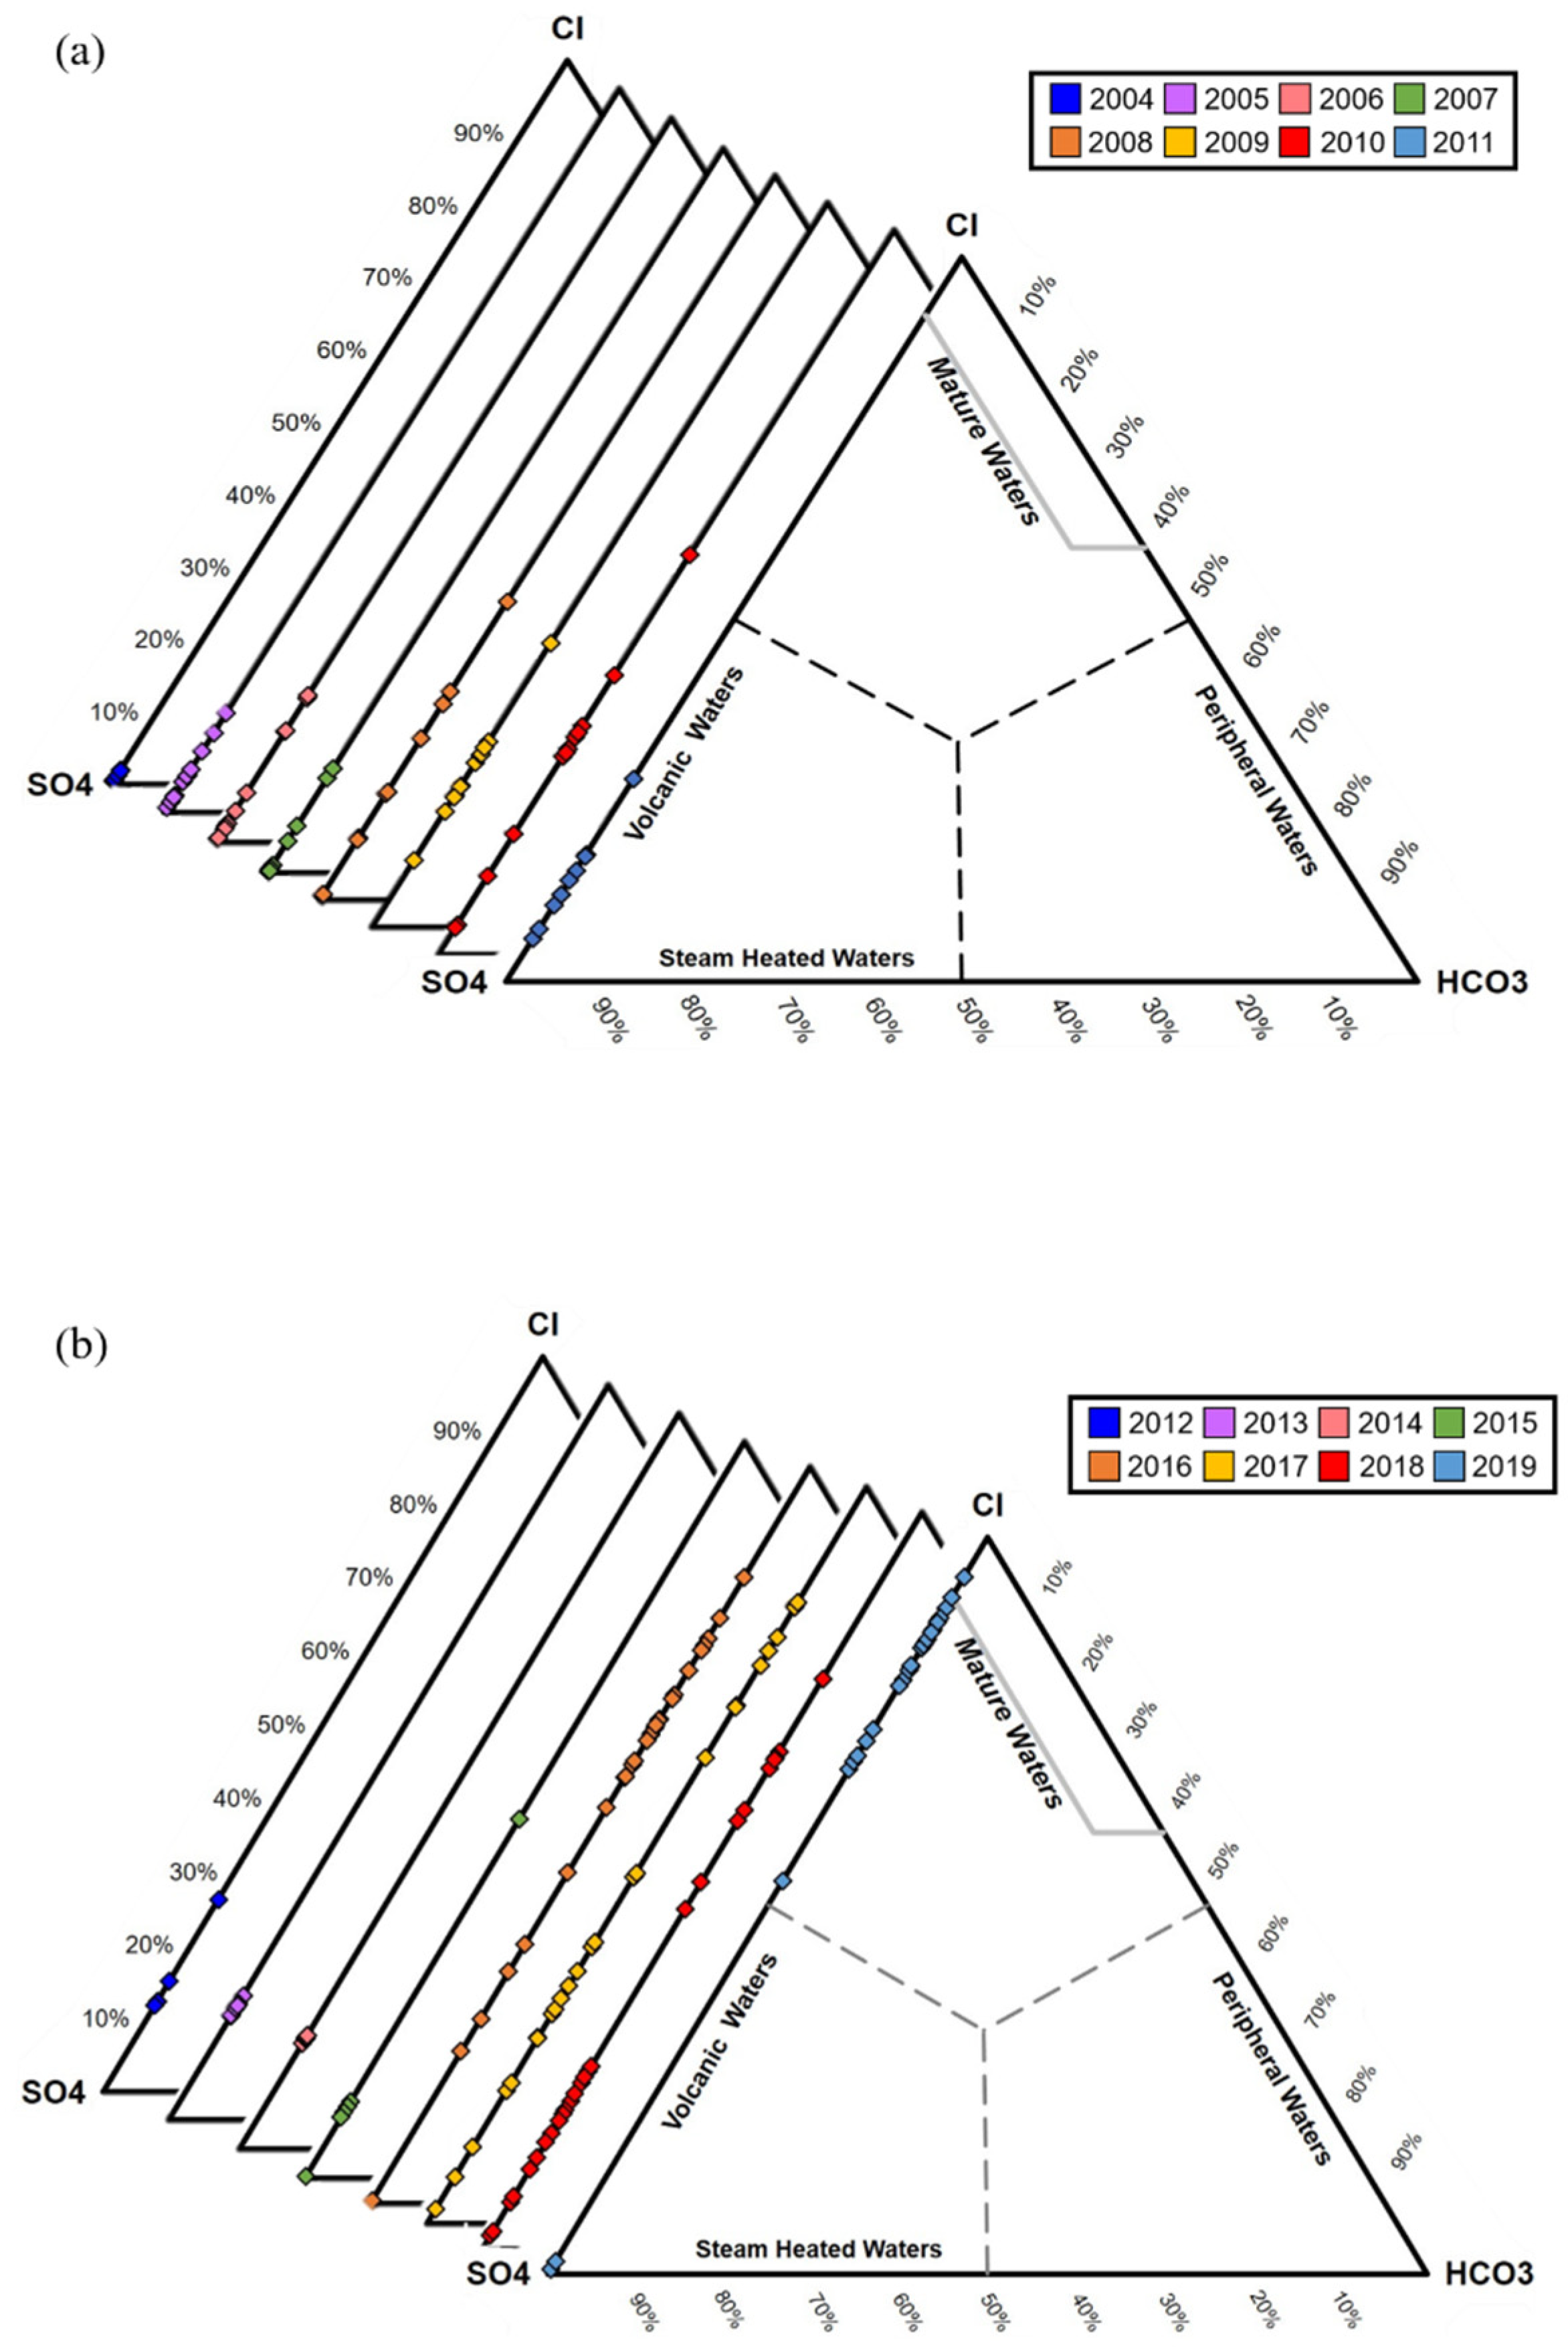
3.4. Hydrochemical Analysis
4. Results and Discussion
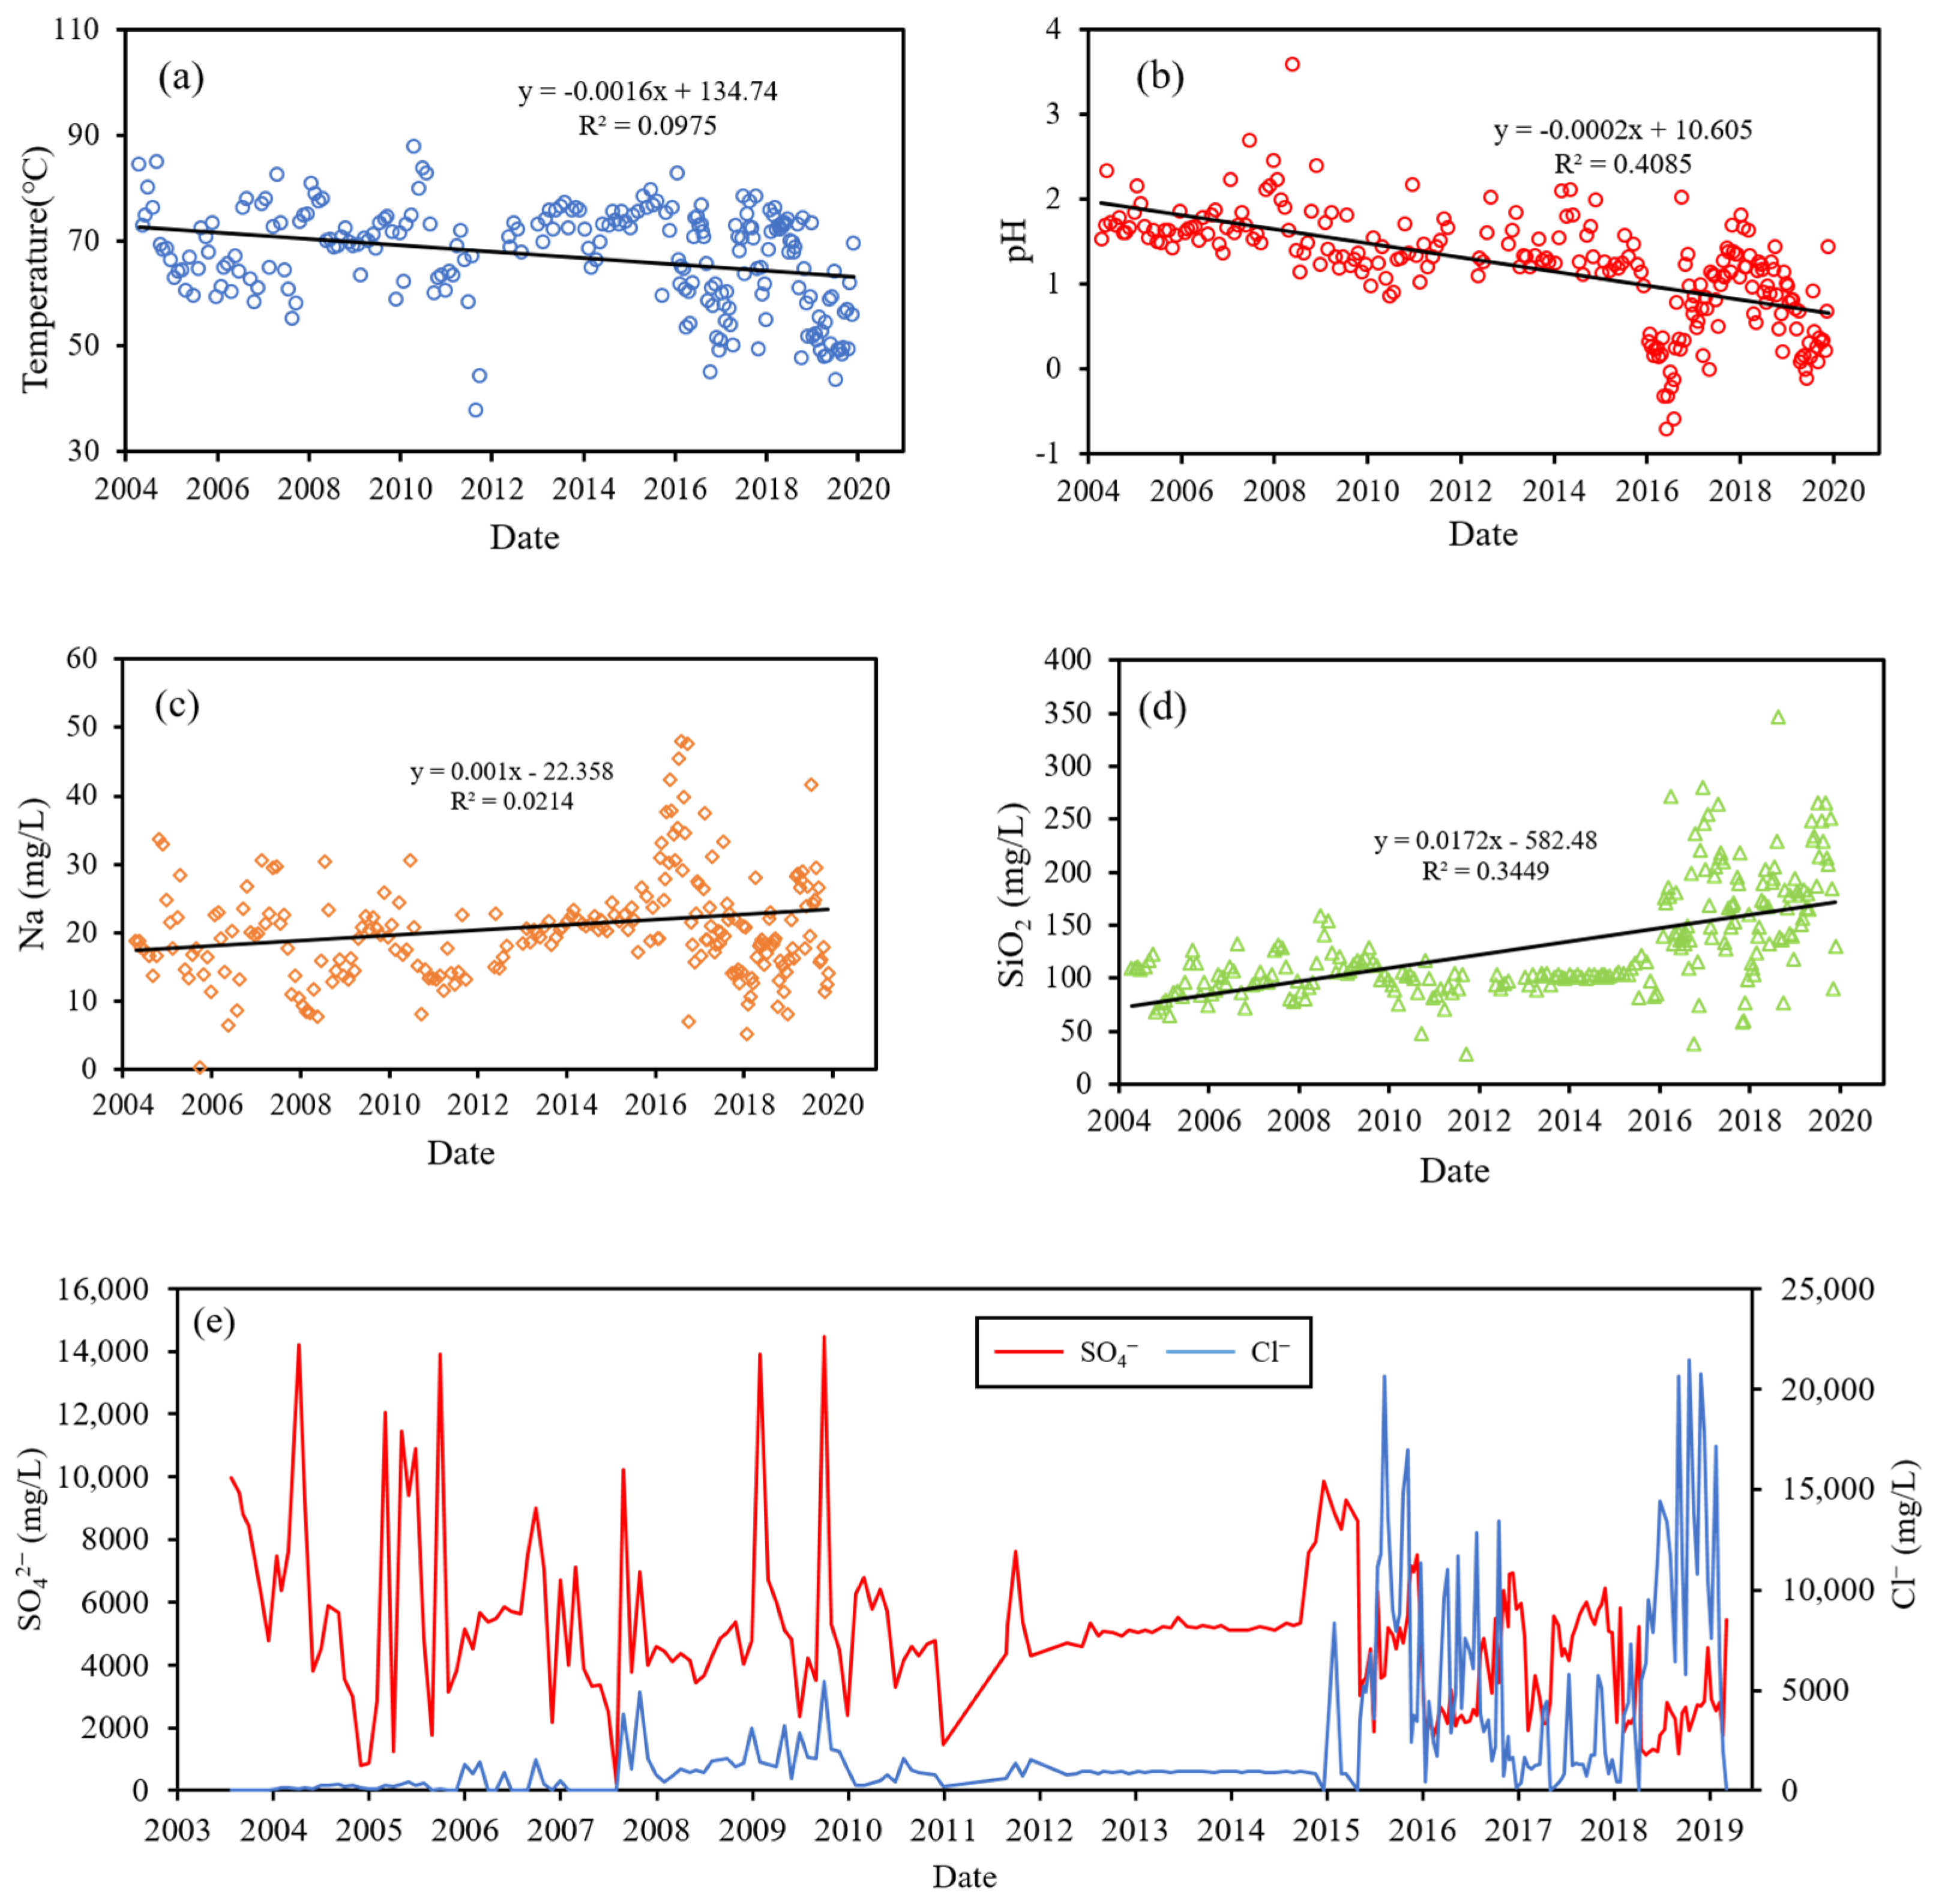
4.1. Chemical Variation of TYK Thermal Water
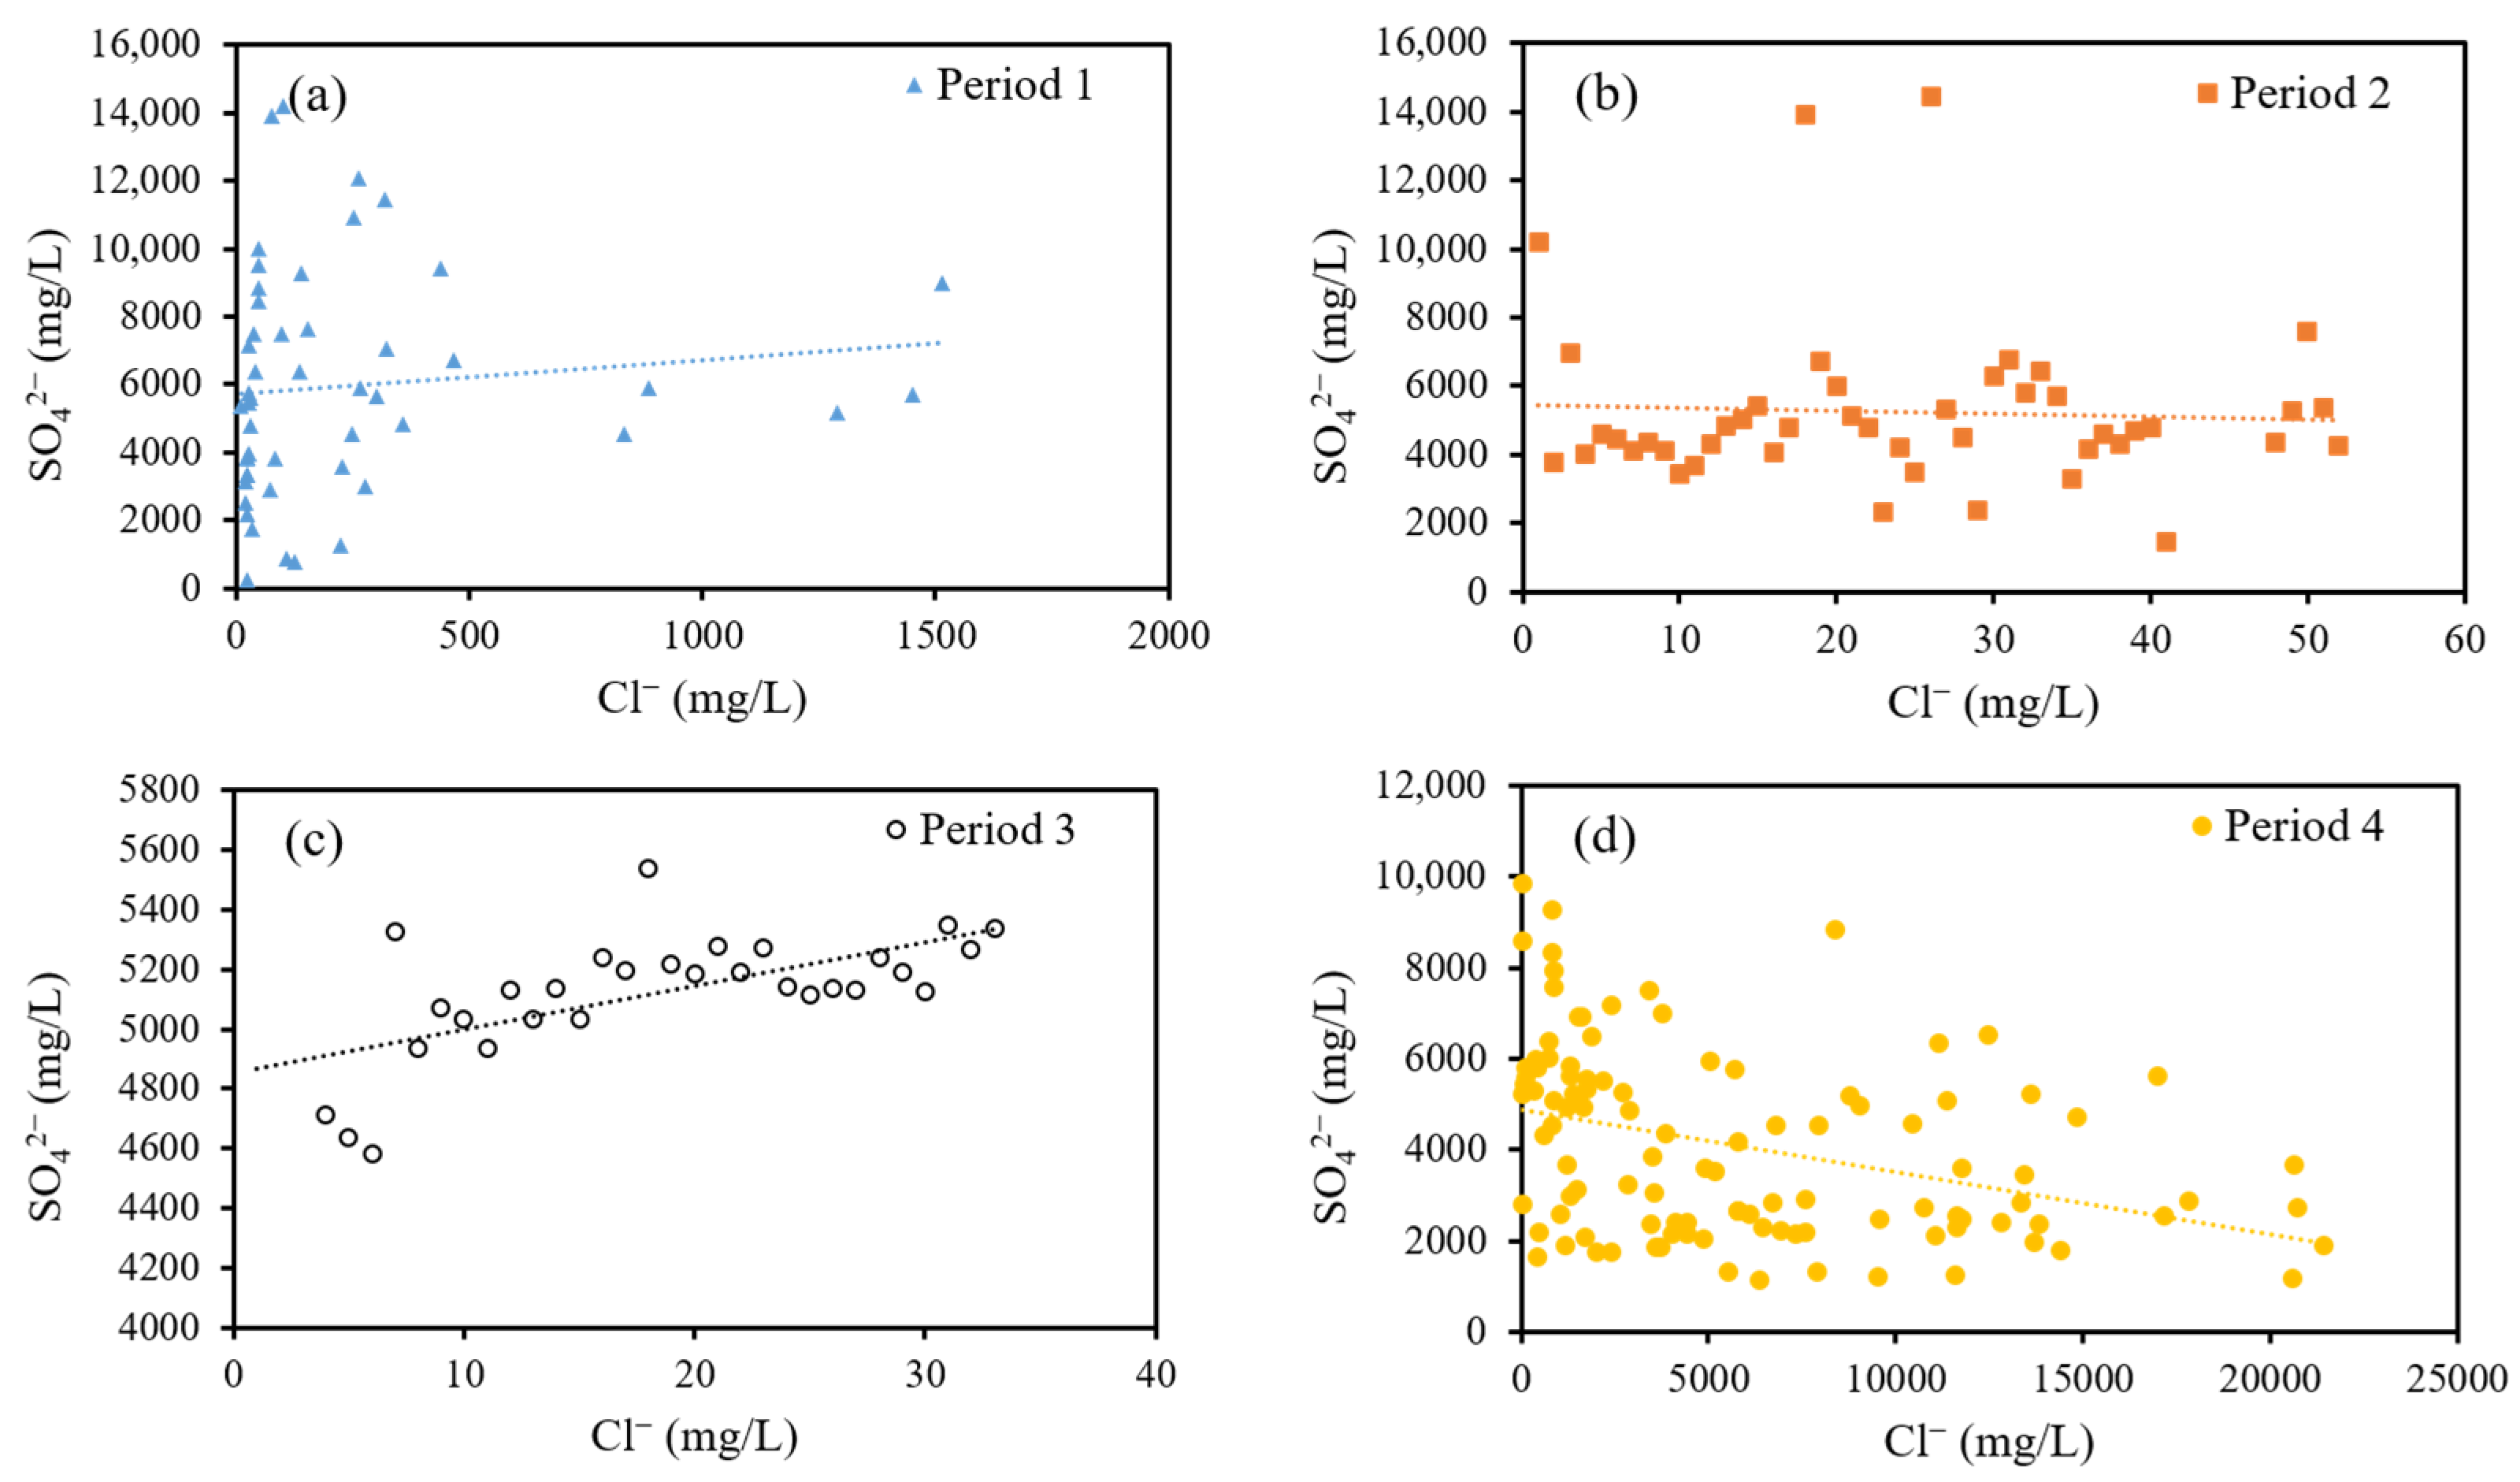
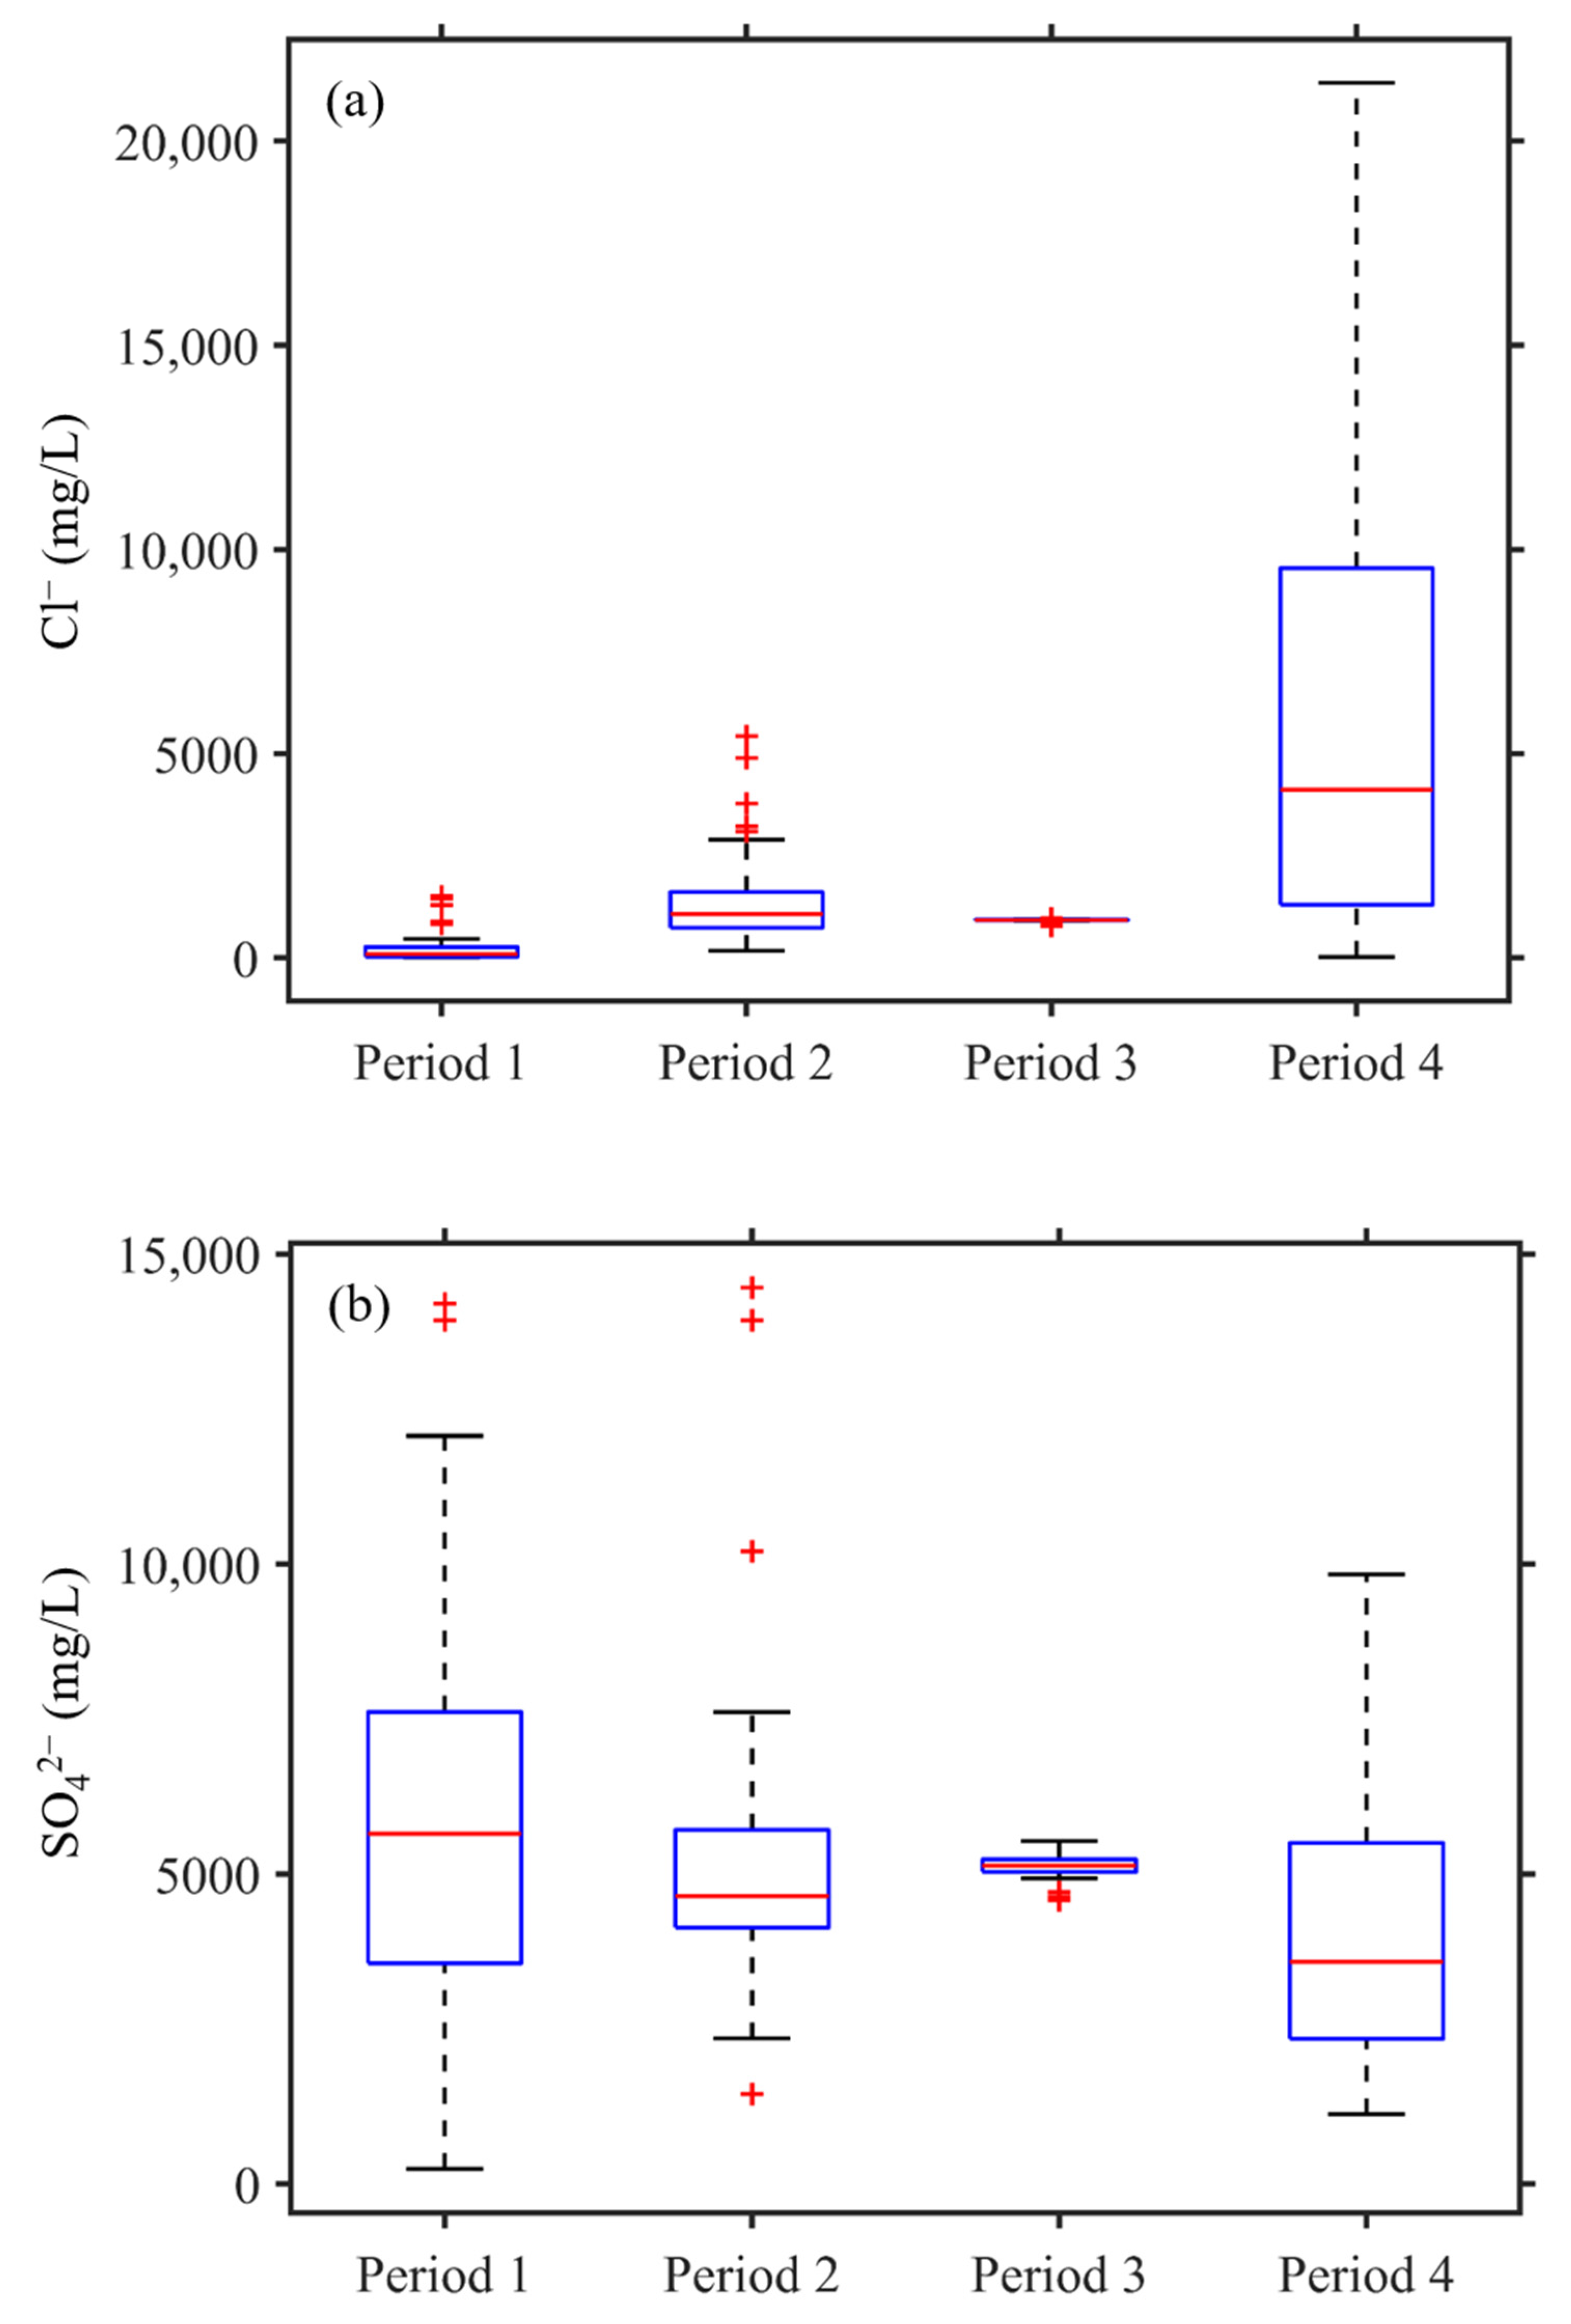
4.2. Variation of Cl− and SO42−
4.3. Supply of Deep Cl−-Rich Aquifer
4.4. Application of Silica Geothermometry
5. Conclusions
Author Contributions
Funding
Data Availability Statement
Conflicts of Interest
References
- Yoshiike, Y. Variation in the chemical composition of Obuki Spring, Tamagawa hot springs (1951–2000). Geochem. J. 2003, 37, 649–662. [Google Scholar] [CrossRef] [Green Version]
- Villemant, B.; Komorowski, J.-C.; Dessert, C.; Michel, A.; Crispi, O.; Hammouya, G.; Beauducel, F.; De Chabalier, J.-B. Evidence for a new shallow magma intrusion at La Soufrière of Guadeloupe (Lesser Antilles): Insights from long-term geochemical monitoring of halogen-rich hydrothermal fluids. J. Volcanol. Geotherm. Res. 2014, 285, 247–277. [Google Scholar] [CrossRef] [Green Version]
- Takahashi, R.; Shibata, T.; Murayama, Y.; Ogino, T.; Okazaki, N. Temporal changes in thermal waters related to volcanic activity of Tokachidake Volcano, Japan: Implications for forecasting future eruptions. Bull. Volcanol. 2015, 77, 2. [Google Scholar] [CrossRef]
- Bergfeld, D.; Evans, W.C.; Spicer, K.R.; Hunt, A.G.; Kelly, P.J. Evidence for degassing of fresh magma during the 2004–2008 eruption of Mount St. Helens: Subtle signals from the hydrothermal system. J. Volcanol. Geotherm. Res. 2017, 343, 109–121. [Google Scholar] [CrossRef]
- Joseph, E.P.; Frey, H.M.; Manon, M.R.; Onyeali, M.-M.C.; DeFranco, K.; Metzger, T.; Aragosa, C. Update on the fluid geochemistry monitoring time series for geothermal systems in Dominica, Lesser Antilles island arc: 2009–2017. J. Volcanol. Geotherm. Res. 2019, 376, 86–103. [Google Scholar] [CrossRef]
- Rouwet, D.; Amador, R.A.M.; Sandri, L.; Ramírez-Umaña, C.; González, G.; Pecoraino, G.; Capaccioni, B. 39 Years of Geochemical Monitoring of Laguna Caliente Crater Lake, Poás: Patterns from the Past as Keys for the Future. In Poás Volcano; Springer: Heidelberg, Germany, 2019; pp. 213–233. [Google Scholar]
- Seki, K.; Ohba, T.; Aoyama, S.; Ueno, Y.; Sumino, H.; Kanda, W.; Yaguchi, M.; Tanbo, T. Variations in thermal state revealed by the geochemistry of fumarolic gases and hot-spring waters of the Tateyama volcanic hydrothermal system, Japan. Bull. Volcanol. 2019, 81, 8. [Google Scholar] [CrossRef]
- Takahashi, R.; Okazaki, N.; Tamura, M.; Ogino, T.; Murayama, Y. The interaction of volcanic gas and deep magmatic fluid with shallow aquifers at Tokachidake volcano, Japan. J. Volcanol. Geotherm. Res. 2019, 388, 106678. [Google Scholar] [CrossRef]
- Eichelberger, J.; Kiryukhin, A.; Mollo, S.; Tsuchiya, N.; Villeneuve, M. Exploring and Modeling the Magma–Hydrothermal Regime. Geosciences 2020, 10, 234. [Google Scholar] [CrossRef]
- Taran, Y.; Kalacheva, E. Acid sulfate-chloride volcanic waters; Formation and potential for monitoring of volcanic activity. J. Volcanol. Geotherm. Res. 2020, 405, 107036. [Google Scholar] [CrossRef]
- Witt, M.; Fischer, T.; Pyle, D.; Yang, T.; Zellmer, G. Fumarole compositions and mercury emissions from the Tatun Volcanic Field, Taiwan: Results from multi-component gas analyser, portable mercury spectrometer and direct sampling techniques. J. Volcanol. Geotherm. Res. 2008, 178, 636–643. [Google Scholar] [CrossRef]
- Pu, H.-C.; Cheng-Horng, L.; Huang, Y.-C.; Li-Chin, C.; Lee, H.-F.; Leu, P.-L.; Hsiao, N.-C.; Chang, C.-H.; Yeh, Y.-H. The volcanic earthquake swarm of October 20, 2009 in the Tatun area of northern Taiwan. Terr. Atmos. Ocean. Sci. 2014, 25, 625. [Google Scholar] [CrossRef] [Green Version]
- Dobson, P.; Gasperikova, E.; Spycher, N.; Lindsey, N.J.; Guo, T.R.; Chen, W.S.; Liu, C.H.; Wang, C.-J.; Chen, S.-N.; Fowler, A.P. Conceptual model of the Tatun geothermal system, Taiwan. Geothermics 2018, 74, 273–297. [Google Scholar] [CrossRef] [Green Version]
- Yang, T.; Sano, Y.; Song, S. 3He/4He ratios of fumaroles and bubbling gases of hot springs in Tatun Volcano Group, North Taiwan. IL Nuovo Cim. C 1999, 22, 281–286. [Google Scholar]
- Pu, H.; Lin, C.; Lai, Y.; Shih, M.; Chang, L.; Lee, H.; Lee, P.; Hong, G.; Li, Y.; Chang, W. Active Volcanism Revealed from a Seismicity conduit in the Long-resting tatun Volcano Group of northern taiwan. Sci. Rep. 2020, 10, 1–11. [Google Scholar] [CrossRef] [PubMed] [Green Version]
- Murase, M.; Lin, C.-H.; Kimata, F.; Mori, H.; Pu, H.-C. Volcano-hydrothermal activity detected by precise levelling surveys at the Tatun volcano group in Northern Taiwan during 2006–2013. J. Volcanol. Geotherm. Res. 2014, 286, 30–40. [Google Scholar] [CrossRef]
- Mouyen, M.; Chao, B.F.; Hwang, C.; Hsieh, W.-C. Gravity monitoring of Tatun Volcanic Group activities and inference for underground fluid circulations. J. Volcanol. Geotherm. Res. 2016, 328, 45–58. [Google Scholar] [CrossRef]
- Liang, H.; Li, X.; Chen, R.-F. Mapping Surface Deformation Over Tatun Volcano Group, Northern Taiwan Using Multitemporal InSAR. IEEE J. Sel. Top. Appl. Earth Obs. Remote Sens. 2021, 14, 2087–2095. [Google Scholar] [CrossRef]
- Konstantinou, K.I.; Lin, C.-H.; Liang, W.-T. Seismicity characteristics of a potentially active Quaternary volcano: The Tatun Volcano Group, northern Taiwan. J. Volcanol. Geotherm. Res. 2007, 160, 300–318. [Google Scholar] [CrossRef]
- Inguaggiato, S.; Diliberto, I.S.; Federico, C.; Paonita, A.; Vita, F. Review of the evolution of geochemical monitoring, networks and methodologies applied to the volcanoes of the Aeolian Arc (Italy). Earth Sci. Rev. 2018, 176, 241–276. [Google Scholar] [CrossRef]
- Lee, H.-F.; Yang, T.F.; Lan, T.F.; Chen, C.-H.; Song, S.-R.; Tsao, S. Temporal variations of gas compositions of fumaroles in the Tatun Volcano Group, northern Taiwan. J. Volcanol. Geotherm. Res. 2008, 178, 624–635. [Google Scholar] [CrossRef]
- Chen, C.H.; Wu, Y. Volcanic geology of the Tatun geothermal area, northern Taiwan. Proc. Geol. Soc. China 1971, 14, 5–20. [Google Scholar]
- Chen, C.H.; Lin, S.B. Distribution and Significance of Volcanic Materals in Sediments of the Taipei Basin. J. Geol. Soc. 2000, 43, 287–310. [Google Scholar]
- Wang, W.H.; Chen, C.H. The volcanology and fission track age dating of pyroclastic deposits in Tatun Volcanico group, Northern Taiwan. Acta Geol. Taiwanica 1990, 28, 1–30. [Google Scholar]
- Belousov, A.; Belousova, M.; Chen, C.-H.; Zellmer, G.F. Deposits, character and timing of recent eruptions and gravitational collapses in Tatun Volcanic Group, Northern Taiwan: Hazard-related issues. J. Volcanol. Geotherm. Res. 2010, 191, 205–221. [Google Scholar] [CrossRef] [Green Version]
- Tatun Volcanic Area Spring Quality Analysis Data. Available online: https://data.gov.tw/dataset/16794 (accessed on 16 September 2020).
- Central Geological Survey, MOEA; Institute of Earth Sciences, A.S. Observation of Volacnic Activity in Northern Taiwan—Observation of Dense Linear Geophone Array in Volcanic Area of Northern Taiwan (4/4); Ministry of Economic Affairs: Taipei, Taiwan, 2015.
- Ba, J.; Su, C.; Pan, X.; Chen, Q. Hydrogeochemistry and enviornmental isotope compositions and their evolution in geothermal groundwater in Yizhang, Hunan province, China. Environ. Eng. Manag. J. 2019, 18, 3. [Google Scholar]
- Morales, I.; Villanueva-Estrada, R.E.; Rodríguez, R.; Armienta, M.A. Geological, hydrogeological, and geothermal factors associated to the origin of arsenic, fluoride, and groundwater temperature in a volcanic environment “El Bajío Guanajuatense”, Mexico. Environ. Eearth Sci. 2015, 74, 5403–5415. [Google Scholar] [CrossRef]
- Xu, T.; Hou, Z.; Jia, X.; Spycher, N.; Jiang, Z.; Feng, B.; Na, J.; Yuan, Y. Classical and integrated multicomponent geothermometry at the Tengchong geothermal field, Southwestern China. Environ. Earth Sci. 2016, 75, 1502. [Google Scholar] [CrossRef] [Green Version]
- Blasco, M.; Gimeno, M.J.; Auqué, L.F. Low temperature geothermal systems in carbonate-evaporitic rocks: Mineral equilibria assumptions and geothermometrical calculations. Insights from the Arnedillo thermal waters (Spain). Sci. Total Environ. 2018, 615, 526–539. [Google Scholar] [CrossRef]
- Martínez-Florentino, A.; Esteller, M.; Domínguez-Mariani, E.; Expósito, J.; Paredes, J. Hydrogeochemistry, isotopes and geothermometry of Ixtapan de la Sal–Tonatico hot springs, Mexico. Environ. Earth Sci. 2019, 78, 600. [Google Scholar] [CrossRef]
- Chen, C.H. The springs and geothermal in Taiwan. Ti-Chih 1989, 9, 327–340. [Google Scholar]
- Hsu, H.-H.; Yeh, H.-F. Factors Controlling of Thermal Water Hydrogeochemical Characteristics in Tatun Volcano Group, Taiwan. Water 2020, 12, 2473. [Google Scholar] [CrossRef]
- Fournier, R.; Potter, R. Revised and expanded silica (quartz) geothermometer. Bull. Geotherm. Resour. Counc. 1982, 11, 10. [Google Scholar]
- Powell, T.; Cumming, W. Spreadsheets for geothermal water and gas geochemistry. In Proceedings of the Thirty-Fifth Workshop on Geothermal Reservoir Engineering Stanford University, Stanford, CA, USA, 1–3 February 2010; pp. 1–3. [Google Scholar]
- Shah, M.; Sircar, A.; Shaikh, N.; Patel, K.; Sharma, D.; Vaidya, D. Comprehensive geochemical/hydrochemical and geo-thermometry analysis of Unai geothermal field, Gujarat, India. Acta Geochim. 2019, 38, 145–158. [Google Scholar] [CrossRef]
- Giggenbach, W.F. Geothermal solute equilibria. derivation of Na-K-Mg-Ca geoindicators. Geochim. Cosmochim. Acta 1988, 52, 2749–2765. [Google Scholar] [CrossRef]
- Rouwet, D.; Taran, Y.; Inguaggiato, S.; Varley, N.; Santiago, J.S. Hydrochemical dynamics of the “lake–spring” system in the crater of El Chichón volcano (Chiapas, Mexico). J. Volcanol. Geotherm. Res. 2008, 178, 237–248. [Google Scholar] [CrossRef]
- Stimac, J.A.; Goff, F.; Counce, D.; Larocque, A.C.; Hilton, D.R.; Morgenstern, U. The crater lake and hydrothermal system of Mount Pinatubo, Philippines: Evolution in the decade after eruption. Bull. Volcanol. 2004, 66, 149–167. [Google Scholar] [CrossRef]
- Liu, C.-M.; Song, S.-R.; Chen, Y.-L.; Tsao, S. Characteristics and Origins of Hot Springs in the Tatun Volcano Group in Northern Taiwan. Terr. Atmos. Ocean. Sci. 2011, 22. [Google Scholar] [CrossRef] [Green Version]
- Shin, J.; Hwang, S. A borehole-based approach for seawater intrusion in heterogeneous coastal aquifers, eastern part of Jeju Island, Korea. Water 2020, 12, 609. [Google Scholar] [CrossRef] [Green Version]
- Liu, K.K. Hydrogen and Oxygen Isotopic Compositions of Meteoric Waters from the Tatun Shan Area, Northern Taiwan. Bull. Inst. Earth Sci. 1984, 159–175. [Google Scholar]
- Lin, C.-H. Probable dynamic triggering of phreatic eruption in the Tatun volcano group of Taiwan. J. Asian Earth Sci. 2017, 149, 78–85. [Google Scholar] [CrossRef]

| 2004/4–2008/5 | 2008/5–2012/9 | 2012/9–2015/6 | 2015/6–2019/12 | |
|---|---|---|---|---|
| Correlation coefficient | 0.11 | 0.469 | 0.589 | −0.369 |
| Number of samples | 50 | 46 | 30 | 109 |
| Cl− | Period 1 | Period 2 | Period 3 | Period 4 |
|---|---|---|---|---|
| Minimum | 10.74 | 171.90 | 781.37 | 23.10 |
| Maximum | 1512.50 | 5430.50 | 977.16 | 21,427.00 |
| Range | 1501.76 | 5258.60 | 195.79 | 21,403.90 |
| IQR | 240.65 | 879.00 | 12.33 | 8243.50 |
| Mean | 234.21 | 1406.56 | 916.86 | 5919.47 |
| Median | 90.79 | 1076.75 | 928.05 | 4118.00 |
| Variance | 126,956.50 | 1265,263.94 | 1592.47 | 3.047 × 10⁷ |
| Std | 356.20 | 1124.83 | 39.90 | 5520.09 |
| SO42− | Period 1 | Period 2 | Period 3 | Period 4 |
|---|---|---|---|---|
| Minimum | 242.35 | 1452.60 | 4581.37 | 1126.00 |
| Maximum | 14,197.00 | 14,457.50 | 5535.00 | 9839.00 |
| Range | 13,954.65 | 13,004.90 | 953.63 | 8713.00 |
| IQR | 4313.28 | 1601.38 | 211.25 | 3188.50 |
| Mean | 5937.97 | 5233.19 | 5123.39 | 4064.69 |
| Median | 5653.66 | 4647.37 | 5138.50 | 3588.00 |
| Variance | 1.086 × 10⁷ | 5824,309.15 | 42,138.68 | 4,228,843.15 |
| Std | 3295.28 | 2413.36 | 205.27 | 2056.41 |
| TDS | pH | Ca | Mg | Na | K | Fe | Al | Cl | SO4 | Si | T | |
|---|---|---|---|---|---|---|---|---|---|---|---|---|
| TDS | 1 | −0.71 | 0.497 | −0.51 | 0.586 | 0.226 | −0.39 | 0.408 | 0.828 | −0.211 | 0.306 | −0.36 |
| pH | 1 | −0.481 | −0.42 | −0.513 | −0.035 | 0.152 | −0.383 | −0.676 | 0.13 | −0.407 | 0.183 | |
| Ca | 1 | 0.56 | 0.193 | 0.079 | −0.249 | 0.286 | 0.509 | −0.374 | 0.462 | −0.498 | ||
| Mg | 1 | 0.025 | 0.004 | 0.104 | 0.221 | 0.012 | 0.045 | 0.263 | −0.142 | |||
| Na | 1 | 0.198 | −0.15 | 0.489 | 0.487 | 0.119 | 0.074 | 0.05 | ||||
| K | 1 | 0.178 | 0.615 | 0.181 | 0.285 | 0.136 | 0.243 | |||||
| Fe | 1 | 0.001 | −0.501 | 0.425 | −0.01 | 0.539 | ||||||
| Al | 1 | 0.306 | 0.277 | 0.254 | 0.111 | |||||||
| Cl | 1 | −0.369 | 0.432 | −0.539 | ||||||||
| SO4 | 1 | −0.184 | 0.732 | |||||||||
| Si | 1 | −0.29 | ||||||||||
| T | 1 |
| Period 1 | Period 2 | Period 3 | Period 4 | |
|---|---|---|---|---|
| Tsur(°C) | 69.59 | 68.66 | 73.75 | 63.45 |
| Tqz(°C) | 135 | 137 | 138 | 165 |
Publisher’s Note: MDPI stays neutral with regard to jurisdictional claims in published maps and institutional affiliations. |
© 2021 by the authors. Licensee MDPI, Basel, Switzerland. This article is an open access article distributed under the terms and conditions of the Creative Commons Attribution (CC BY) license (https://creativecommons.org/licenses/by/4.0/).
Share and Cite
Yeh, H.-F.; Hsu, H.-H. Analysis of Hydrothermal Systems Beneath Tayukeng through Long-Term Geochemical Signals of Hydrothermal Fluids in Tatun Volcano Group, Taiwan. Int. J. Environ. Res. Public Health 2021, 18, 7411. https://doi.org/10.3390/ijerph18147411
Yeh H-F, Hsu H-H. Analysis of Hydrothermal Systems Beneath Tayukeng through Long-Term Geochemical Signals of Hydrothermal Fluids in Tatun Volcano Group, Taiwan. International Journal of Environmental Research and Public Health. 2021; 18(14):7411. https://doi.org/10.3390/ijerph18147411
Chicago/Turabian StyleYeh, Hsin-Fu, and Hung-Hsiang Hsu. 2021. "Analysis of Hydrothermal Systems Beneath Tayukeng through Long-Term Geochemical Signals of Hydrothermal Fluids in Tatun Volcano Group, Taiwan" International Journal of Environmental Research and Public Health 18, no. 14: 7411. https://doi.org/10.3390/ijerph18147411
APA StyleYeh, H.-F., & Hsu, H.-H. (2021). Analysis of Hydrothermal Systems Beneath Tayukeng through Long-Term Geochemical Signals of Hydrothermal Fluids in Tatun Volcano Group, Taiwan. International Journal of Environmental Research and Public Health, 18(14), 7411. https://doi.org/10.3390/ijerph18147411