
The Environmental and Social Determinants of Health Matter in a Pandemic: Predictors of COVID-19 Case and Death Rates in New York City

 ,
,  , ,
, ,
Abstract
:1. Introduction
1.1. Social Determinants of Health and COVID-19 Exposure
1.2. The Role of the Living and Working Conditions in COVID-19 Cases and Death Rates
1.3. A Crisis within a Crisis: Environmental Injustice and the COVID-19 Pandemic
2. Materials and Methods
2.1. Data
2.2. Statistical and Graphical Analysis
3. Results
3.1. Maps of COVID-19 Case and Death Rates
3.2. Correlation Matrix of All Explanatory Variables and Response Variables
3.3. Multiple Regression, Non-Stratified and Stratified by NYC Borough with COVID-19 Case Rate
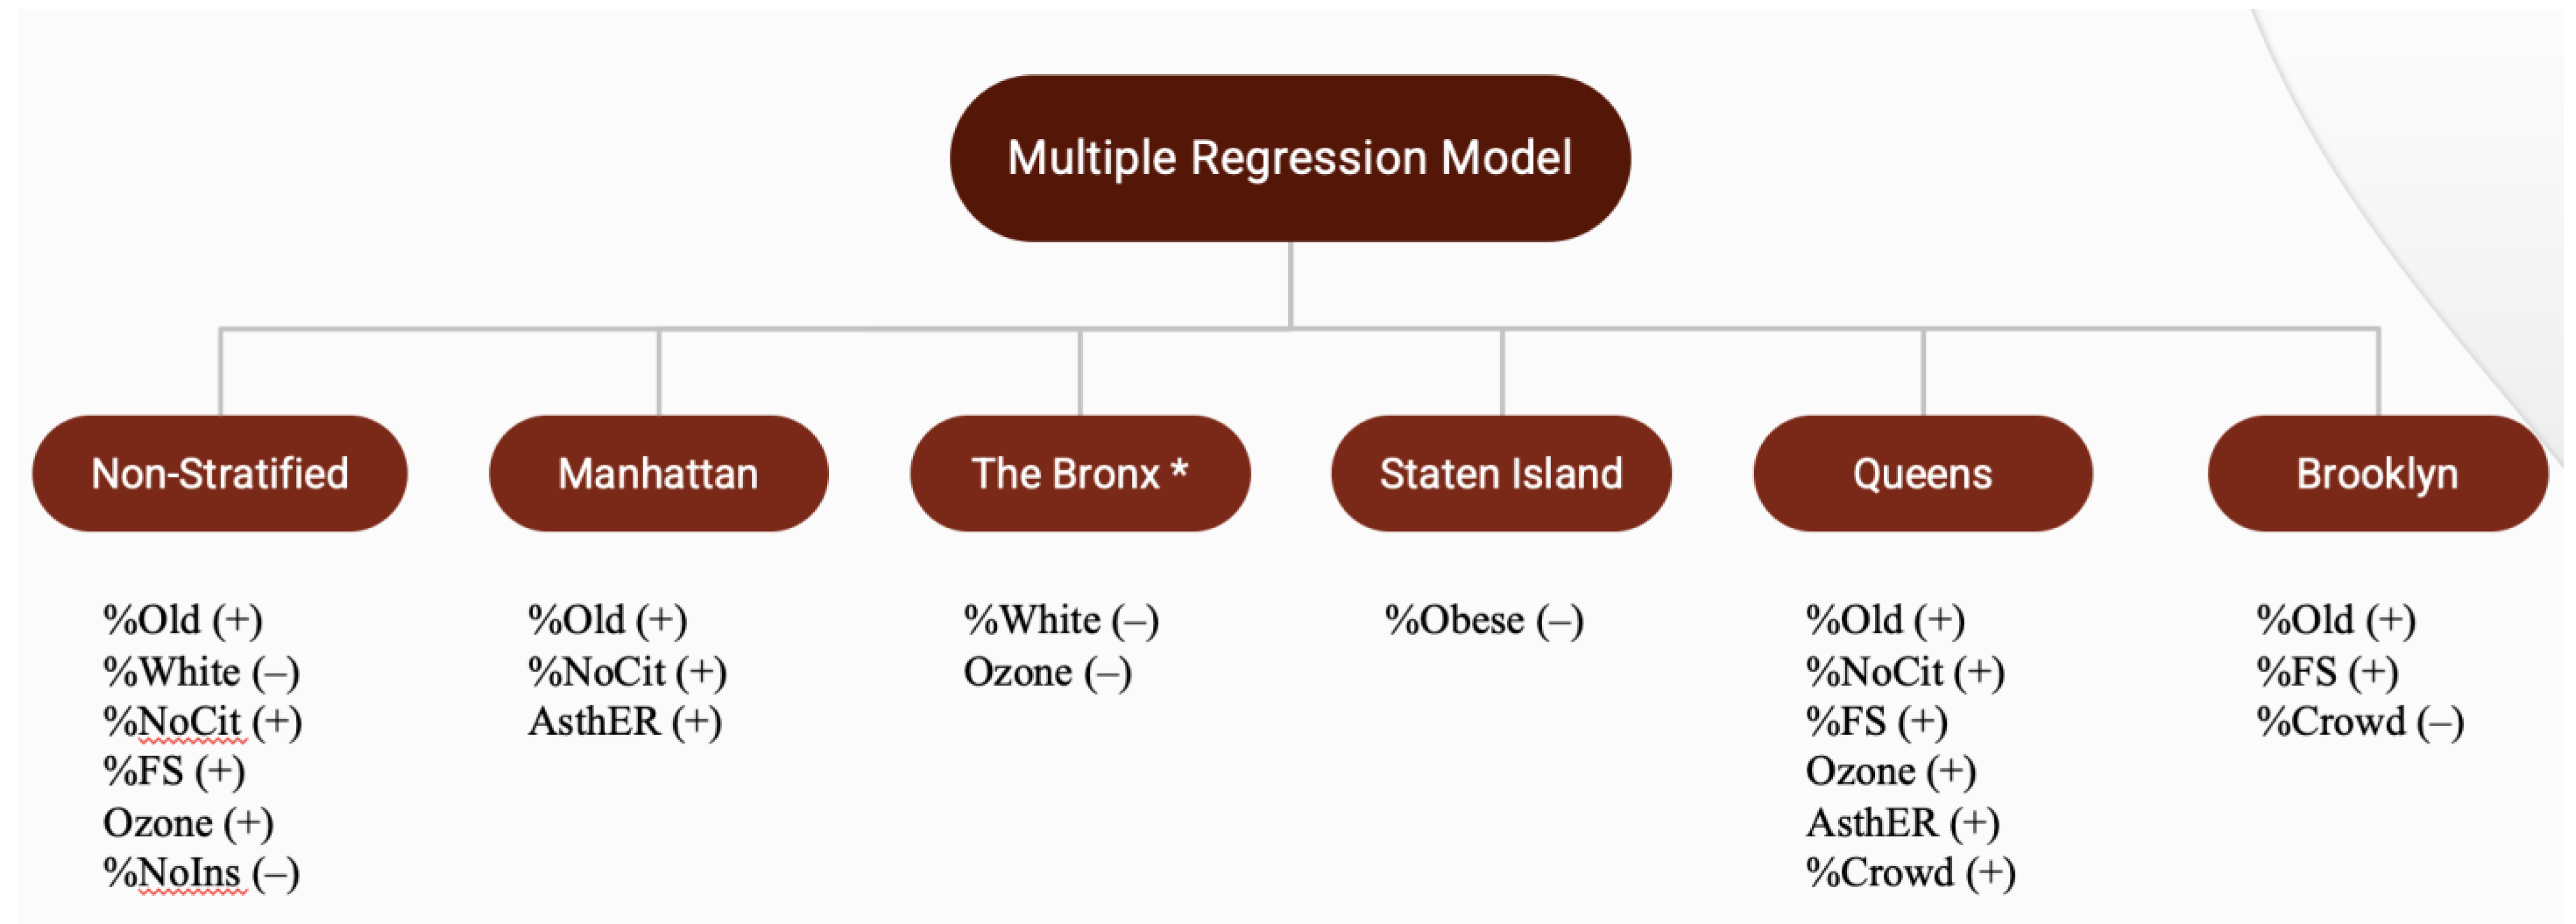
3.4. Multiple Regression, Non-Stratified and Stratified by NYC Borough with COVID-19 Death Rate
4. Discussion
4.1. Limitations
4.2. Future Research Directions and Policy and Intervention Implications
5. Conclusions
Author Contributions
Funding
Institutional Review Board Statement
Informed Consent Statement
Data Availability Statement
Conflicts of Interest
References
- Centers for Disease Control and Prevention. COVID-19 Data from the National Center for Health Statistics. 2021. Available online: https://www.cdc.gov/nchs/covid19/ (accessed on 30 June 2021).
- Ritchie, H.; Ortiz-Ospina, E.; Beltekian, D.; Mathieu, E.; Hasell, J.; Macdonald, B.; Giattino, C.; Appel, C.; Rodés-Guirao, L.; Roser, M. Coronavirus (COVID-19) Deaths. 2021. Available online: https://ourworldindata.org/covid-deaths (accessed on 30 June 2021).
- Ritchie, H.; Ortiz-Ospina, E.; Beltekian, D.; Mathieu, E.; Hasell, J.; Macdonald, B.; Giattino, C.; Appel, C.; Rodés-Guirao, L.; Roser, M. Coronavirus (COVID-19) Cases. 2021. Available online: https://ourworldindata.org/covid-cases?country= (accessed on 27 July 2021).
- KFF. Racial Equity and Health Data Dashboard. 2021. Available online: https://www.kff.org/racial-equity-and-health-policy/dashboard/racial-equity-and-health-data-dashboard/ (accessed on 30 June 2021).
- Webb Hooper, M.; Nápoles, A.M.; Pérez-Stable, E.J. COVID-19 and Racial/Ethnic Disparities. JAMA 2020, 323, 2466. [Google Scholar] [CrossRef] [PubMed]
- Yancy, C.W. COVID-19 and African Americans. JAMA 2020, 323, 1891. [Google Scholar] [CrossRef] [PubMed] [Green Version]
- Centers for Disease Control and Prevention. Risk for COVID-19 Infection, Hospitalization, and Death by Race/Ethnicity. 2021. Available online: https://www.cdc.gov/coronavirus/2019-ncov/covid-data/investigations-discovery/hospitalization-death-by-race-ethnicity.html (accessed on 30 June 2021).
- Solar, O.; Irwin, A. A Conceptual Framework for Action on the Social Determinants of Health. Social Determinants of Health Discussion Paper 2: Policy and Practice; World Health Organization: Geneva, Switzerland, 2010; Available online: https://www.who.int/sdhconference/resources/ConceptualframeworkforactiononSDH_eng.pdf (accessed on 9 July 2021).
- Joseph, G.; McKinley, J. Coronavirus in N.Y.: Manhattan Woman Is First Confirmed Case in State. The New York Times. 1 March 2020, p. 2. Available online: https://www.nytimes.com/2020/03/01/nyregion/new-york-coronvirus-confirmed.html (accessed on 6 March 2021).
- McEvers, K. New York City, U.S. Epicenter, Braces for Peak. Consider This from NPR. 2020. Available online: https://www.npr.org/2020/03/24/820610818/new-york-city-u-s-epicenter-braces-for-peak (accessed on 6 March 2021).
- NBC New York. No Time to Be Lax: Cuomo Extends New York Shutdown, NJ Deaths Tops 1,000. Available online: https://www.nbcnewyork.com/news/local/our-9-11-moment-new-york-braces-as-nations-top-doctor-warns-saddest-week-ahead/2361336/ (accessed on 27 July 2021).
- NYC Health. COVID-19 Data: Totals. 2021. Available online: https://www1.nyc.gov/site/doh/covid/covid-19-data-totals.page (accessed on 27 July 2021).
- Burström, B.; Wenjing, T. Social Determinants of Health and Inequalities in COVID-19. Eur. J. Public Health 2020, 30, 617–618. [Google Scholar] [CrossRef] [PubMed]
- Abrams, E.M.; Szefler, S.J. COVID-19 and the Impact of Social Determinants of Health. Lancet Respir. Med. 2020, 8, 659–661. [Google Scholar] [CrossRef]
- Vardavas, C.I.; Nikitara, K. COVID-19 and Smoking: A Systemic Review of the Evidence. Tob. Induc. Dis. 2020, 18, 20. [Google Scholar] [CrossRef] [PubMed]
- Sun, Z.; Yang, B.; Zhang, R.; Cheng, X. Influencing Factors of Understanding COVID-19 Risks and Coping Behaviors among the Elderly Population. Int. J. Environ. Res. Public Health 2020, 17, 5889. [Google Scholar] [CrossRef] [PubMed]
- Harris, J. The Subway Seeded the Massive Coronavirus Epidemic in New York City; NBER Working Paper Series: Cambridge, MA, USA, 2020; Available online: https://www.nber.org/system/files/working_papers/w27021/w27021.pdf (accessed on 15 June 2021).
- U.S. Bureau of Labor Statistics. Statistics by Race and Ethnicity. 2021. Available online: https://www.bls.gov/opub/reports/race-and-ethnicity/2018/pdf/home.pdf (accessed on 15 June 2021).
- Mahdavinia, M.; Foster, K.J.; Jauregui, E.; Moore, D.; Adnan, D.; Andy-Nweye, A.B.; Khan, S.; Bishehsari, F. Asthma Prolongs Intubation in COVID-19. J. Allergy Clin. Immunol. Pract. 2020, 8, 2388–2391. [Google Scholar] [CrossRef] [PubMed]
- Ramakrishnan, R.; Al Heilay, S.; Hamid, Q. Implications of Pre-existing Asthma on COVID-19 Pathogenesis. Am. J. Physiol. Lung Cell. Mol. Physiol. 2021, 5, 880–891. [Google Scholar] [CrossRef] [PubMed]
- Centers for Disease Control and Prevention. Most Recent National Asthma Data. 2021. Available online: https://www.cdc.gov/asthma/most_recent_national_asthma_data.htm (accessed on 24 June 2021).
- Taylor, D.E.; Toxic Communities. Quoted in University of Michigan: Center for Sustainable Systems Environmental Justice Factsheet. New York University Press: New York, NY, USA. 2014. Available online: http://css.umich.edu/factsheets/environmental-justice-factsheet#:~:text=Environmental%20Justice_CSS17-16_e2020.pdf (accessed on 24 June 2021).
- Graham, G. Why Your ZIP Code Matters More Than Your Genetic Code: Promoting Healthy Outcomes from Mother to Child. Breastfeed. Med. 2016, 11, 8. [Google Scholar] [CrossRef] [PubMed]
- Centers for Disease Control and Prevention. U.S. Small-area Life Expectancy Estimates Project—USALEEP. 2020. Available online: https://www.cdc.gov/nchs/nvss/usaleep/usaleep.html (accessed on 28 June 2021).
- Bullard, R.D. Environmental Justice in the 21st Century: Race Still Matters. Phylon 2001, 49, 151. [Google Scholar] [CrossRef]
- Centers for Disease Control and Prevention. Health Disparities and Inequities Report. 2013. Available online: https://www.cdc.gov/mmwr/pdf/other/su6203.pdf (accessed on 24 June 2021).
- Astell-Burt, T.; Maynard, M.; Lenguerrand, E.; Whitrow, M.; Molaodi, O.; Harding, S. Effect of Air Pollution and Racism on Ethnic Differences in Respiratory Health Among Adolescents Living in an Urban Environment. Health Place 2013, 23, 171–178. [Google Scholar] [CrossRef] [PubMed]
- Frontera, A.; Cianfanelli, L.; Vlachos, K.; Landoni, G.; Cremona, G. Severe Air Pollution Links to Higher Mortality in COVID-19 Patients: The ‘Double-Hit’ Hypothesis. J. Infect. 2020, 81, 255–259. [Google Scholar] [CrossRef] [PubMed]
- Liang, D.; Shi, L.; Zhao, J.; Liu, P.; Sarnat, J.A.; Gao, S.; Schwartz, J.; Liu, Y.; Ebelt, S.T.; Scovronick, N.; et al. Urban Air Pollution May Enhance COVID-19 Case-Fatality and Mortality Rates in the United States. Innovation 2020, 1, 100047. [Google Scholar] [CrossRef]
- Travaglio, M.; Yu, Y.; Popovic, R.; Sulley, L.; Leal, N.S.; Martins, L.M. Links Between Air Pollution and COVID-19 in England. Environ. Pollut. 2020, 268, 115859. [Google Scholar] [CrossRef] [PubMed]
- Zhu, Y.; Xie, J.; Huang, F.; Cao, L. Association between Short-Term Exposure to Air Pollution and COVID-19 Infection: Evidence from China. Sci. Total. Environ. 2020, 727, 138704. [Google Scholar] [CrossRef] [PubMed]
- Maantay, J. Asthma and air pollution in the Bronx: Methodological and data considerations in using GIS for environmental justice and health research. Health Place 2020, 13, 32–56. [Google Scholar] [CrossRef] [PubMed]
- NYC Health. COVID-19 Data: Latest Data. 2021. Available online: https://www1.nyc.gov/site/doh/covid/covid-19-data.page (accessed on 25 June 2021).
- Statistical Atlas. Overview of New York, New York (City). 2018. Available online: https://statisticalatlas.com/place/New-York/New-York/Overview (accessed on 14 June 2021).
- NYC: COVID-19 Citywide Information Portal. Testing Locations. 2021. Available online: https://www1.nyc.gov/site/coronavirus/get-tested/covid-19-testing.page (accessed on 15 June 2021).
- U.S. Census Bureau. Quickfacts: New York city, New York; Kings County (Brooklyn Borough), New York; New York County (Manhattan Borough), New York; Queens County (Queens Borough), New York. 2019. Available online: https://www.census.gov/quickfacts/fact/table/newyorkcitynewyork,kingscountybrooklynboroughnewyork,newyorkcountymanhattanboroughnewyork,queenscountyqueensboroughnewyork/PST045219 (accessed on 14 June 2021).
- USDA. Economic Research Service. Food Environment Atlas. 2019. Available online: https://www.ers.usda.gov/foodatlas/ (accessed on 18 June 2021).
- Centers for Disease Control and Prevention. COVID-19 Data Tracker. 2021. Available online: https://covid.cdc.gov/covid-data-tracker/#datatracker-home (accessed on 13 June 2021).
- RStudio Team. RStudio: Integrated Development for R. PBC. Available online: http://www.rstudio.com/ (accessed on 2 June 2020).
- NYC Health. Environment and Health Data Portal: Ozone (O3) 2009-13. Available online: https://a816-dohbesp.nyc.gov/IndicatorPublic/VisualizationData.aspx?id=2027,719b87,122,Disparities,Mean,years=Summer%202009;Summer%202013;Summer%202016,dataLink=Neighborhood%20Poverty (accessed on 2 July 2021).


| Rate Ratios Compared to White, Non-Hispanic Persons | American Indian or Alaska Native, Non-Hispanic Persons | Asian, Non-Hispanic Persons | Black or African American, Non-Hispanic Persons | Hispanic or Latino Persons |
| Cases 1 | 1.6x | 0.7x | 1.1x | 2.0x |
| Hospitalization 2 | 3.3x | 1.0x | 2.9x | 2.8x |
| Death 3 | 2.4x | 1.0x | 2.0x | 2.3x |
| Variable Name | Variable Label | Description |
|---|---|---|
| CaseR | COVID-19 case rate | Number of New York City COVID-19 cases per 100,000 residents, downloaded on 2 July 2020 |
| DeathR | COVID-19 death rate | Number of New York City COVID-19 deaths per 100,000 residents, downloaded on 2 July 2020 |
| %Old | Percent 65+ | Percent of residents aged 65 and older, measured in the 2010 Census Data and the 2012–2016 American Community Survey |
| %White | Percent White | Percent of residents who are White, measured in the 2010 Census Data and the 2012–2016 American Community Survey |
| %NoCit | Percent non-US citizen | Percent of residents who are not US citizens, measured in the 2010 Census Data and the 2012–2016 American Community Survey |
| Income | Median household income | Median household income of residents, measured in the 2010 Census Data and the 2012–2016 American Community Survey |
| %FS | Percent on food stamps | Percent of residents on food stamps, measured in the 2010 Census Data and the 2012–2016 American Community Survey |
| %NoHS | Percent without high school diploma | Percent of residents with no high school diploma, measured in the 2010 Census Data and the 2012–2016 American Community Survey |
| AsthER | Adult asthma ER visits | Number of adult asthma emergency room (ER) visits (age-adjusted per 10,000 residents), measured in 2016 |
| FPM | Fine particulate matter level | Fine particulate matter level (mcg/m3), measured in 2018 |
| Ozone | Ozone level | Level of ozone (ppb), measured in 2018 |
| %Obese | Percent obese | Proportion of residents who are obese, measured in 2017 |
| %Crowd | Percent overcrowding | Proportion of homes with >1 person per room, measured from 2013 to 2017 |
| %Pov | Percent in poverty | Proportion of residents in poverty, measured from 2013 to 2017 |
| Grocery | Number of grocery stores | Number of grocery stores (per 1000 residents) measured in 2014 |
| %Dis | Percent disability | Proportion of residents under 65 years old who have a disability, measured from 2014–2018 |
| %NoIns | Percent without insurance | Proportion of residents under 65 years old with no health insurance, measured from 2014–2018 |
| Mobility | Mobility index | Mobility index of how far the median user in each county moves per day, measured on 30 June 2020 |
| %DecT | Percent decrease transit | Proportion reduction in travel to transit stations, measured on 30 June 2020 |
| Minimum | Maximum | Median | Mean | Std. Deviation | |
|---|---|---|---|---|---|
| CaseR | 623.800 | 4528 | 2454.100 | 2366.400 | 894.898 |
| DeathR | 0 | 708.900 | 197.300 | 206.000 | 110.145 |
| %Old | 0 | 0.293 | 0.124 | 0.132 | 0.048 |
| %White | 0.008 | 0.947 | 0.362 | 0.366 | 0.267 |
| %NoCit | 0.003 | 0.397 | 0.149 | 0.159 | 0.074 |
| Income | 21,600 | 250,001 | 60,500 | 67,152 | 33,516.460 |
| %FS | 0 | 0.546 | 0.151 | 0.183 | 0.133 |
| %NoHS | 0.004 | 0.488 | 0.157 | 0.172 | 0.105 |
| AsthER | 16.700 | 317.400 | 65.800 | 95.570 | 77.703 |
| FPM | 6.100 | 10.300 | 7.100 | 7.430 | 0.979 |
| Ozone | 24 | 35.200 | 30.300 | 29.850 | 2.263 |
| %Obese | 0.011 | 0.449 | 0.240 | 0.246 | 0.086 |
| %Crowd | 0.021 | 0.990 | 0.079 | 0.122 | 0.169 |
| %Pov | 0.062 | 0.414 | 0.150 | 0.178 | 0.088 |
| Grocery | 0.490 | 0.930 | 0.820 | 0.781 | 0.124 |
| %Dis | 0.056 | 0.111 | 0.061 | 0.067 | 0.018 |
| %NoIns | 0.053 | 0.101 | 0.078 | 0.081 | 0.017 |
| Mobility | 2.700 | 3.600 | 3.300 | 3.184 | 0.297 |
| %DecT | 0.330 | 0.630 | 0.520 | 0.498 | 0.098 |
| %Old | %White | %NoCit | Income | %FS | %NoHS | AsthER | FPM | Ozone | %Obese | %Crowd | %Pov | Grocery | %Dis | %NoIns | Mobility | %DecT | CaseR | DeathR | |
| %Old | 1 | 0.317 | -0.405 | 0.018 | −0.288 | −0.303 | −0.338 | −0.213 | 0.192 | −0.208 | 0.042 | −0.0370 | −0.121 | −0.080 | 0.086 | 0.074 | 0.042 | 0.129 | 0.0270 |
| %White | <0.001 * | 1 | −0.450 | 0.652 | −0.686 | −0.732 | −0.553 | 0.309 | −0.377 | −0.548 | −0.074 | −0.490 | −0.109 | −0.294 | −0.388 | −0.243 | 0.325 | −0.532 | −0.498 |
| %NoCit | <0.001 * | <0.001 * | 1 | −0.244 | 0.296 | 0.532 | 0.017 | 0.161 | −0.047 | 0.031 | 0.074 | 0.241 | 0.096 | 0.026 | 0.233 | −0.029 | 0.037 | 0.088 | 0.159 |
| Income | 0.81 | <0.001 * | 0.001 * | 1 | −0.756 | −0.768 | −0.499 | 0.427 | −0.505 | −0.586 | −0.267 | −0.631 | −0.129 | −0.30 | −0.295 | −0.374 | 0.504 | −0.544 | −0.503 |
| %FS | <0.001 * | <0.001 * | <0.001 * | <0.001 * | 1 | 0.860 | 0.698 | −0.197 | 0.283 | 0.647 | 0.293 | 0.817 | 0.357 | 0.503 | 0.058 | 0.125 | −0.511 | 0.422 | 0.443 |
| %NoHS | <0.001 * | <0.001 * | <0.001 * | <0.001 * | <0.001 * | 1 | 0.516 | −0.268 | 0.372 | 0.563 | 0.186 | 0.728 | 0.209 | 0.388 | 0.270 | 0.256 | 0.464 | 0.480 | 0.459 |
| AsthER | <0.001 * | <0.001 * | 0.83 | <0.001 * | <0.001 * | <0.001 * | 1 | −0.031 | 0.104 | 0.661 | 0.150 | 0.826 | 0.352 | 0.545 | −0.075 | −0.054 | −0.376 | 0.240 | 0.235 |
| FPM | 0.004 * | <0.001 * | 0.03 * | <0.001 * | 0.009 * | 0.009 * | 0.68 | 1 | −0.881 | −0.487 | −0.144 | −0.047 | 0.356 | −0.01 | −0.444 | −0.721 | 0.455 | −0.600 | −0.464 |
| Ozone | 0.011 * | <0.001 * | 0.53 | <0.001 * | <0.001 * | <0.001 * | 0.17 | <0.001 * | 1 | 0.550 | 0.222 | 0.141 | −0.171 | 0.077 | 0.687 | 0.747 | −0.535 | 0.643 | 0.561 |
| %Obese | 0.005 * | <0.001 * | 0.68 | <0.001 * | <0.001 * | <0.001 * | <0.001 * | <0.001 * | <0.001 * | 1 | 0.253 | 0.634 | 0.021 | 0.455 | 0.264 | 0.484 | −0.640 | 0.518 | 0.370 |
| %Crowd | 0.58 | 0.33 | 0.33 | <0.001 * | <0.001 * | <0.001 * | 0.047 * | 0.055* * | 0.003 * | <0.001 * | 1 | 0.268 | 0.342 | 0.005 | 0.037 | 0.059 | −0.228 | 0.052 | 0.167 |
| %Pov | <0.001 * | <0.001 * | 0.001 * | <0.001 * | <0.001 * | <0.001 * | <0.001 * | 0.54 | 0.06* * | <0.001 * | <0.001 * | 1 | 0.417 | 0.539 | −0.026 | 0.024 | −0.475 | 0.245 | 0.220 |
| Grocery | 0.11 | 0.15 | 0.21 | 0.088* * | <0.001 * | <0.001 * | <0.001 * | <0.001 * | 0.02 * | 0.78 | <0.001 * | <0.001 * | 1 | 0.328 | −0.157 | −0.498 | −0.169 | −0.233 | 0.0002 |
| %Dis | 0.29 | <0.001 * | 0.73 | <0.001 * | <0.001 * | <0.001 * | <0.001 * | 0.91 | 0.31 | <0.001 * | 0.63 | <0.001 * | <0.001 * | 1 | 0.010 | 0.102 | −0.697 | 0.358 | 0.168 |
| %NoIns | 0.25 | <0.001 * | 0.002 * | <0.001 * | 0.446 | <0.001 * | 0.32 | <0.001 * | <0.001 * | <0.001 * | 0.63 | 0.73 | 0.04 * | 0.89 | 1 | 0.621 | −0.292 | 0.416 | 0.354 |
| Mobility | 0.33 | 0.001 * | 0.71 | <0.001 * | 0.098* * | <0.001 * | 0.48 | <0.001 * | <0.001 * | <0.001 * | 0.43 | 0.75 | <0.001 * | 0.18 | <0.001 * | 1 | −0.665 | 0.599 | 0.339 |
| %DecT | 0.57 | <0.001 * | 0.62 | <0.001 * | <0.001 * | <0.001 * | <0.001 * | <0.001 * | <0.001 * | <0.001 * | 0.002 * | <0.001 * | 0.02 * | <0.001 * | <0.001 * | <0.001 * | 1 | −0.545 | −0.328 |
| CaseR | 0.09* * | <0.001 * | 0.24 | <0.001 * | <0.001 * | <0.001 * | 0.001 * | <0.001 * | <0.001 * | <0.001 * | 0.49 | 0.001 * | 0.002 * | <0.001 * | <0.001 * | <0.001 * | <0.001 * | 1 | 0.7422 |
| DeathR | <0.001 * | <0.001 * | 0.04 * | <0.001 * | <0.001 * | <0.001 * | 0.002 * | <0.001 * | <0.001 * | <0.001 * | 0.03 * | 0.003 * | 0.998 | 0.025 * | <0.001 * | <0.001 * | <0.001 * | <0.001 * | 1 |
| Non-Stratified | Stratified | |||||||||||||||||
|---|---|---|---|---|---|---|---|---|---|---|---|---|---|---|---|---|---|---|
| Overall | Manhattan | Staten Island | Bronx | Queens | Brooklyn | |||||||||||||
| B | SE | Sig | B | SE | Sig | B | SE | Sig | B | SE | Sig | B | SE | Sig | B | SE | Sig | |
| Constant | −576 | 1446 | 0.69 | 490.8 | 1421 | 0.73 | 9831 | 6839 | 0.22 | 7995 | 6874 | 0.26 | −4039 | 2278 | 0.08 | −8811 | 2263 | <0.001 |
| %Old | 3204 | 1070 | 0.003 | 3017 | 1440 | 0.04 | −1148 | 4420 | 0.81 | 1697 | 5270 | 0.75 | 1702 | 2393 | 0.48 | 728.4 | 2300 | 0.75 |
| %White | −1315 | 272.7 | <0.001 | −519 | 1063 | 0.63 | 63.47 | 1934 | 0.98 | −2215 | 891 | 0.02 | −1715 | 431 | <0.001 | 439.9 | 572 | 0.45 |
| %NoCit | 564.8 | 784.0 | 0.47 | 4200 | 1414 | 0.01 | 2210 | 4846 | 0.67 | 323.1 | 2837 | 0.91 | −2279 | 1285 | 0.08 | −6423 | 1352 | 0.64 |
| %FS | 517.3 | 597.1 | 0.39 | 1041 | 1899 | 0.59 | 3955 | 6040 | 0.55 | −4520 | 1834 | 0.03 | −185 | 1623 | 0.91 | 4282 | 822 | <0.001 |
| Ozone | 176.4 | 37.26 | <0.001 | −8.34 | 61.2 | 0.89 | −232 | 259 | 0.42 | −124 | 217 | 0.58 | 221.8 | 78.1 | 0.01 | 300.2 | 70.2 | <0.001 |
| AsthER | −0.72 | 1.050 | 0.49 | 2.124 | 1.67 | 0.21 | −2.23 | 6.83 | 0.76 | 1.161 | 4.07 | 0.78 | 8.428 | 4.02 | 0.04 | −4.24 | 2.18 | 0.06 |
| %Obese | −791 | 937.8 | 0.40 | 1423 | 1516 | 0.35 | −1669 | 1701 | 0.38 | 611.5 | 5164 | 0.91 | −4475 | 1625 | 0.01 | 5041 | 2521 | 0.06 |
| %Crowd | 13.85 | 291.8 | 0.96 | −2073 | 3954 | 0.60 | + | 2017 | 3982 | 0.62 | 12,665 | 2247 | <0.001 | −987 | 312 | 0.004 | ||
| Grocery | −2318 | 424.8 | <0.001 | + | + | + | + | + | ||||||||||
| %Dis | 12,976 | 4259 | 0.003 | + | + | + | + | + | ||||||||||
| %NoIns | −7807 | 3908 | 0.05 | + | + | + | + | + | ||||||||||
| %DecT | −1220 | 871 | 0.16 | + | + | + | + | + | ||||||||||
| Non-Stratified | Stratified | |||||||||||||||||
|---|---|---|---|---|---|---|---|---|---|---|---|---|---|---|---|---|---|---|
| Overall | Manhattan | Staten Island | Bronx | Queens | Brooklyn | |||||||||||||
| B | SE | Sig | B | SE | Sig | B | SE | Sig | B | SE | Sig | B | SE | Sig | B | SE | Sig | |
| Constant | −488 | 204 | 0.02 | −281 | 222.1 | 0.21 | 120.7 | 1364 | 0.93 | 2611 | 1289 | 0.06 | −839.1 | 351.7 | 0.02 | −328 | 295.0 | 0.28 |
| %Old | 1006 | 151 | <0.001 | 714 | 225.0 | 0.003 | 311.6 | 882 | 0.74 | 1619 | 988 | 0.12 | 1152 | 369.4 | 0.003 | 1993 | 299.9 | <0.001 |
| %White | −119 | 38 | 0.002 | 40.5 | 166.1 | 0.81 | 137.9 | 386 | 0.74 | −522 | 167 | 0.01 | −66.42 | 66.56 | 0.32 | −71.8 | 74.61 | 0.34 |
| %NoCit | 313 | 111 | 0.005 | 649 | 221.0 | 0.006 | 196.8 | 967 | 0.85 | 229 | 532 | 0.67 | 410.3 | 198.4 | 0.04 | 62.46 | 176.3 | 0.73 |
| %FS | 174 | 84.3 | 0.04 | 226 | 296.8 | 0.45 | 1925 | 1205 | 0.19 | −416 | 344 | 0.24 | 501.9 | 250.5 | 0.05 | 359.8 | 107.1 | 0.002 |
| Ozone | 22.9 | 5.26 | <0.001 | 4.17 | 9.566 | 0.67 | −2.18 | 51.7 | 0.97 | −85 | 40.8 | 0.06 | 24.36 | 12.05 | 0.05 | 5.993 | 9.145 | 0.52 |
| AsthER | 0.20 | 0.15 | 0.19 | 0.55 | 0.261 | 0.04 | −0.74 | 1.36 | 0.61 | −0.7 | 0.76 | 0.36 | 1.236 | 0.621 | 0.05 | 0.054 | 0.284 | 0.85 |
| %Obese | −178 | 132 | 0.18 | 22.7 | 236.9 | 0.92 | −833 | 339 | 0.07 | 1283 | 968 | 0.20 | −369.1 | 250.9 | 0.15 | 256.7 | 328.6 | 0.44 |
| %Crowd | −15 | 41.2 | 0.71 | 106 | 618.0 | 0.87 | + | −705 | 746 | 0.36 | 583.2 | 346.9 | 0.099 | −102 | 40.65 | 0.02 | ||
| Grocery | −39 | 60.0 | 0.51 | + | + | + | + | + | ||||||||||
| %Dis | −232 | 601 | 0.70 | + | + | + | + | + | ||||||||||
| %NoIns | −920 | 552 | 0.097 | + | + | + | + | + | ||||||||||
| %DecT | −22 | 123 | 0.86 | + | + | + | + | + | ||||||||||
Publisher’s Note: MDPI stays neutral with regard to jurisdictional claims in published maps and institutional affiliations. |
© 2021 by the authors. Licensee MDPI, Basel, Switzerland. This article is an open access article distributed under the terms and conditions of the Creative Commons Attribution (CC BY) license (https://creativecommons.org/licenses/by/4.0/).
Share and Cite
De Jesus, M.; Ramachandra, S.S.; Jafflin, Z.; Maliti, I.; Daughtery, A.; Shapiro, B.; Howell, W.C.; Jackson, M.C. The Environmental and Social Determinants of Health Matter in a Pandemic: Predictors of COVID-19 Case and Death Rates in New York City. Int. J. Environ. Res. Public Health 2021, 18, 8416. https://doi.org/10.3390/ijerph18168416
De Jesus M, Ramachandra SS, Jafflin Z, Maliti I, Daughtery A, Shapiro B, Howell WC, Jackson MC. The Environmental and Social Determinants of Health Matter in a Pandemic: Predictors of COVID-19 Case and Death Rates in New York City. International Journal of Environmental Research and Public Health. 2021; 18(16):8416. https://doi.org/10.3390/ijerph18168416
Chicago/Turabian StyleDe Jesus, Maria, Shalini S. Ramachandra, Zoe Jafflin, Imani Maliti, Aquilah Daughtery, Benjamin Shapiro, William C. Howell, and Monica C. Jackson. 2021. "The Environmental and Social Determinants of Health Matter in a Pandemic: Predictors of COVID-19 Case and Death Rates in New York City" International Journal of Environmental Research and Public Health 18, no. 16: 8416. https://doi.org/10.3390/ijerph18168416
APA StyleDe Jesus, M., Ramachandra, S. S., Jafflin, Z., Maliti, I., Daughtery, A., Shapiro, B., Howell, W. C., & Jackson, M. C. (2021). The Environmental and Social Determinants of Health Matter in a Pandemic: Predictors of COVID-19 Case and Death Rates in New York City. International Journal of Environmental Research and Public Health, 18(16), 8416. https://doi.org/10.3390/ijerph18168416