Cardiorespiratory Fitness in Occupational Groups—Trends over 20 Years and Future Forecasts

 , ,
, ,
Abstract
:1. Introduction
2. Methods
2.1. Assessment of Estimated VO2max
2.2. Occupational Groups
2.3. Other Measurements
2.4. Statistics
3. Results
4. Discussion
4.1. Earlier Research
4.2. Absolute and Relative CRF—The Role of weight Gain
4.3. Sex- and Age-Related Annual Changes in CRF
4.4. Prevalence of Low CRF
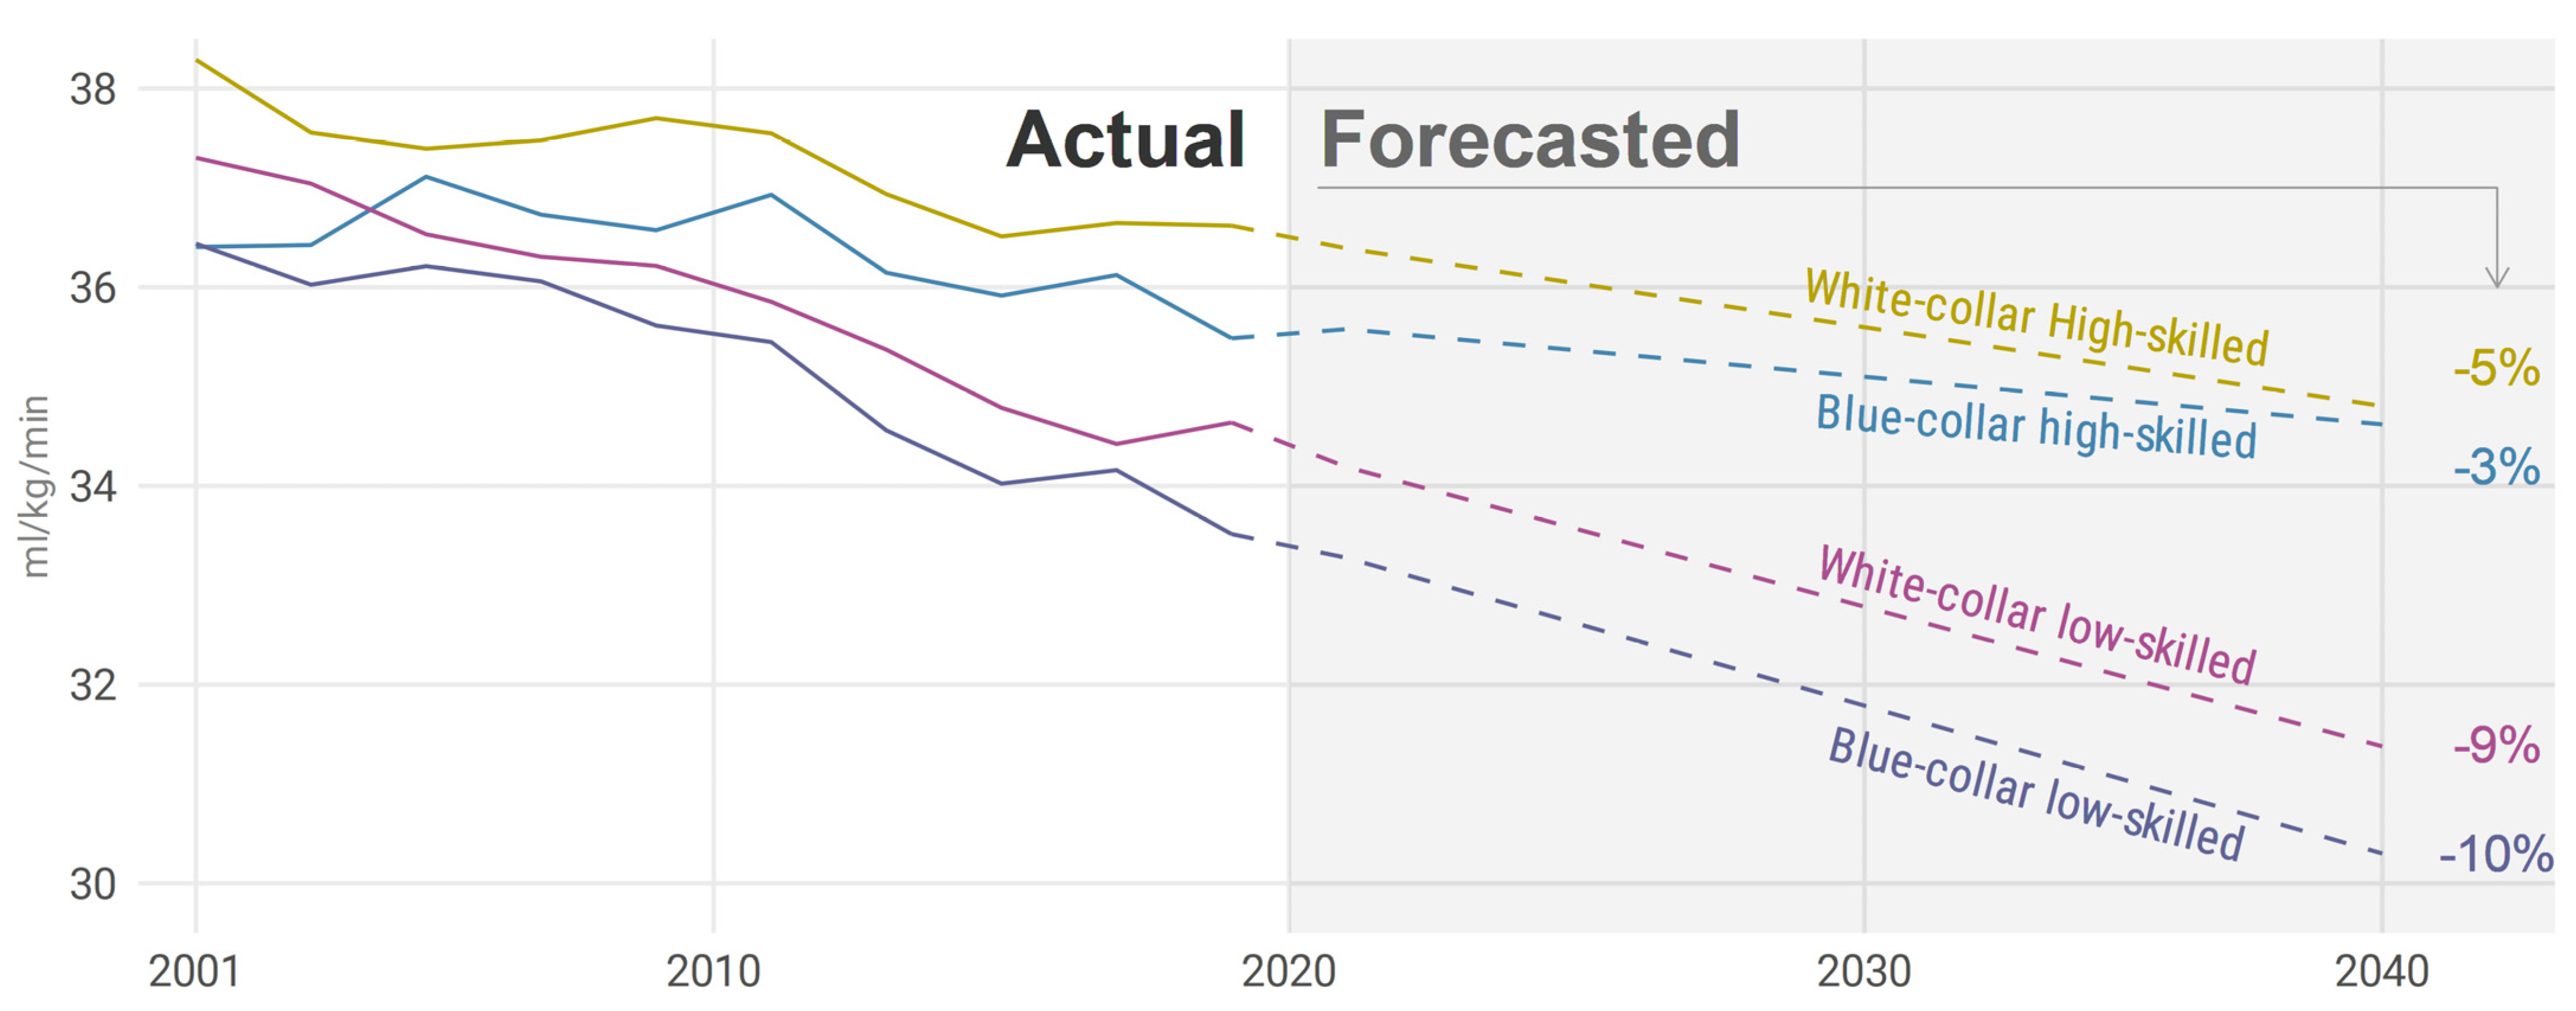
4.5. Future Projections
4.6. Future Agenda
4.7. Strengths and Limitations
5. Conclusions
Author Contributions
Funding
Institutional Review Board Statement
Informed Consent Statement
Data Availability Statement
Conflicts of Interest
Appendix A


| Occupation | Mean (95% CI) | p-Value | Adjusted p-Value |
|---|---|---|---|
| (1) Managers | 0.000 (−0.017 to 0.018) | 0.962 | 1.000 |
| (2.1) Science and engineering | −0.037 (−0.056 to −0.019) | 0.000 | 0.000 |
| (2.2) Health care | 0.046 (0.014 to 0.077) | 0.005 | 0.180 |
| (2.3) Education | −0.093 (−0.117 to −0.068) | 0.000 | 0.000 |
| (2.4) Other professionals | −0.051 (−0.065 to −0.037) | 0.000 | 0.000 |
| (3) Associate professionals | −0.036 (−0.046 to −0.027) | 0.000 | 0.000 |
| (4) Administrative and customer service | −0.105 (−0.119 to −0.091) | 0.000 | 0.000 |
| (5) Service, care, and shop sales | −0.059 (−0.073 to −0.045) | 0.000 | 0.000 |
| (7) Building and manufacturing | −0.117 (−0.130 to −0.105) | 0.000 | 0.000 |
| (8) Mechanical manufacturing | −0.115 (−0.131 to −0.098) | 0.000 | 0.000 |
| (8.3) Transport | −0.162 (−0.190 to −0.134) | 0.000 | 0.000 |
| (9) Elementary occupations | −0.103 (−0.127 to −0.079) | 0.000 | 0.000 |
| Occupation | Sex | Mean (95% CI) | p-Value | Adjusted p-Value |
|---|---|---|---|---|
| (1) Managers | Female | 0.027 (−0.004 to 0.058) | 0.090 | 1.000 |
| (1) Managers | Male | −0.012 (−0.033 to 0.009) | 0.282 | 1.000 |
| (2.1) Science and engineering | Female | −0.036 (−0.071 to −0.001) | 0.044 | 1.000 |
| (2.1) Science and engineering | Male | −0.038 (−0.060 to −0.016) | 0.001 | 0.036 |
| (2.2) Health care | Female | 0.065 (0.028 to 0.103) | 0.001 | 0.036 |
| (2.2) Health care | Male | −0.003 (−0.061 to 0.055) | 0.928 | 1.000 |
| (2.3) Education | Female | −0.089 (−0.118 to −0.061) | 0.000 | 0.000 |
| (2.3) Education | Male | −0.102 (−0.149 to −0.056) | 0.000 | 0.000 |
| (2.4) Other professionals | Female | −0.018 (−0.036 to 0.001) | 0.069 | 1.000 |
| (2.4) Other professionals | Male | −0.089 (−0.109 to −0.069) | 0.000 | 0.000 |
| (3) Associate professionals | Female | 0.004 (−0.010 to 0.017) | 0.605 | 1.000 |
| (3) Associate professionals | Male | −0.070 (−0.083 to −0.058) | 0.000 | 0.000 |
| (4) Administrative and customer service | Female | −0.065 (−0.082 to −0.047) | 0.000 | 0.000 |
| (4) Administrative and customer service | Male | −0.170 (−0.192 to −0.147) | 0.000 | 0.000 |
| (5) Service, care, and shop sales | Female | −0.054 (−0.070 to −0.037) | 0.000 | 0.000 |
| (5) Service, care, and shop sales | Male | −0.074 (−0.102 to −0.046) | 0.000 | 0.000 |
| (7) Building and manufacturing | Female | −0.057 (−0.110 to −0.005) | 0.033 | 1.000 |
| (7) Building and manufacturing | Male | −0.120 (−0.133 to −0.108) | 0.000 | 0.000 |
| (8) Mechanical manufacturing | Female | −0.080 (−0.117 to −0.042) | 0.000 | 0.000 |
| (8) Mechanical manufacturing | Male | −0.123 (−0.141 to −0.105) | 0.000 | 0.000 |
| (8.3) Transport | Female | 0.029 (−0.073 to 0.131) | 0.580 | 1.000 |
| (8.3) Transport | Male | −0.176 (−0.205 to −0.148) | 0.000 | 0.000 |
| (9) Elementary occupations | Female | −0.093 (−0.123 to −0.062) | 0.000 | 0.000 |
| (9) Elementary occupations | Male | −0.118 (−0.154 to −0.081) | 0.000 | 0.000 |
| Occupation | Age-Group (yrs) | Mean (95% CI) | p-Value | Adjusted p-Value |
|---|---|---|---|---|
| (1) Managers | 18–34 | −0.076 (−0.132 to −0.020) | 0.008 | 0.288 |
| (1) Managers | 35–49 | −0.051 (−0.075 to −0.026) | 0.000 | 0.000 |
| (1) Managers | 50–65 | 0.085 (0.057 to 0.113) | 0.000 | 0.000 |
| (2.1) Science and engineering | 18–34 | −0.081 (−0.114 to −0.048) | 0.000 | 0.000 |
| (2.1) Science and engineering | 35–49 | −0.049 (−0.077 to −0.022) | 0.001 | 0.036 |
| (2.1) Science and engineering | 50–65 | 0.047 (0.009 to 0.086) | 0.017 | 0.612 |
| (2.2) Health care | 18–34 | −0.058 (−0.124 to 0.008) | 0.086 | 1.000 |
| (2.2) Health care | 35–49 | 0.041 (−0.007 to 0.089) | 0.094 | 1.000 |
| (2.2) Health care | 50–65 | 0.117 (0.064 to 0.170) | 0.000 | 0.000 |
| (2.3) Education | 18–34 | −0.262 (−0.318 to −0.207) | 0.000 | 0.000 |
| (2.3) Education | 35–49 | −0.094 (−0.132 to −0.056) | 0.000 | 0.000 |
| (2.3) Education | 50–65 | −0.011 (−0.050 to 0.028) | 0.577 | 1.000 |
| (2.4) Other professionals | 18–34 | −0.175 (−0.203 to −0.148) | 0.000 | 0.000 |
| (2.4) Other professionals | 35–49 | −0.057 (−0.078 to −0.036) | 0.000 | 0.000 |
| (2.4) Other professionals | 50–65 | 0.059 (0.034 to 0.084) | 0.000 | 0.000 |
| (3) Associate professionals | 18–34 | −0.084 (−0.103 to −0.066) | 0.000 | 0.000 |
| (3) Associate professionals | 35–49 | −0.065 (−0.079 to −0.051) | 0.000 | 0.000 |
| (3) Associate professionals | 50–65 | 0.043 (0.027 to 0.060) | 0.000 | 0.000 |
| (4) Administrative and customer service | 18–34 | −0.199 (−0.223 to −0.175) | 0.000 | 0.000 |
| (4) Administrative and customer service | 35–49 | −0.110 (−0.132 to −0.087) | 0.000 | 0.000 |
| (4) Administrative and customer service | 50–65 | 0.009 (−0.017 to 0.035) | 0.493 | 1.000 |
| (5) Service, care, and shop sales | 18–34 | −0.094 (−0.120 to −0.068) | 0.000 | 0.000 |
| (5) Service, care, and shop sales | 35–49 | −0.070 (−0.093 to −0.048) | 0.000 | 0.000 |
| (5) Service, care, and shop sales | 50–65 | −0.018 (−0.041 to 0.006) | 0.144 | 1.000 |
| (7) Building and manufacturing | 18–34 | −0.136 (−0.157 to −0.114) | 0.000 | 0.000 |
| (7) Building and manufacturing | 35–49 | −0.135 (−0.155 to −0.115) | 0.000 | 0.000 |
| (7) Building and manufacturing | 50–65 | −0.072 (−0.095 to −0.048) | 0.000 | 0.000 |
| (8) Mechanical manufacturing | 18–34 | −0.153 (−0.181 to −0.125) | 0.000 | 0.000 |
| (8) Mechanical manufacturing | 35–49 | −0.117 (−0.143 to −0.092) | 0.000 | 0.000 |
| (8) Mechanical manufacturing | 50–65 | −0.064 (−0.095 to −0.032) | 0.000 | 0.000 |
| (8.3) Transport | 18–34 | −0.288 (−0.338 to −0.238) | 0.000 | 0.000 |
| (8.3) Transport | 35–49 | −0.110 (−0.155 to −0.066) | 0.000 | 0.000 |
| (8.3) Transport | 50–65 | −0.107 (−0.157 to −0.057) | 0.000 | 0.000 |
| (9) Elementary occupations | 18–34 | −0.165 (−0.211 to −0.120) | 0.000 | 0.000 |
| (9) Elementary occupations | 35–49 | −0.084 (−0.123 to −0.045) | 0.000 | 0.000 |
| (9) Elementary occupations | 50–65 | −0.077 (−0.116 to −0.038) | 0.000 | 0.000 |
| Occupation | Sex | Mean (95% CI) | p-Value | Adjusted p-Value |
|---|---|---|---|---|
| (1) Managers | Female—Male | 0.039 (0.001 to 0.076) | 0.044 | 1.000 |
| (2.1) Science and engineering | Female—Male | 0.002 (−0.039 to 0.043) | 0.908 | 1.000 |
| (2.2) Health care | Female—Male | 0.068 (−0.001 to 0.137) | 0.053 | 1.000 |
| (2.3) Education | Female—Male | 0.013 (−0.041 to 0.068) | 0.639 | 1.000 |
| (2.4) Other professionals | Female—Male | 0.071 (0.044 to 0.099) | 0.000 | 0.000 |
| (3) Associate professionals | Female—Male | 0.074 (0.055 to 0.092) | 0.000 | 0.000 |
| (4) Administrative and customer service | Female—Male | 0.105 (0.077 to 0.133) | 0.000 | 0.000 |
| (5) Service, care, and shop sales | Female—Male | 0.020 (−0.012 to 0.052) | 0.215 | 1.000 |
| (7) Building and manufacturing | Female—Male | 0.063 (0.009 to 0.117) | 0.023 | 0.552 |
| (8) Mechanical manufacturing | Female—Male | 0.043 (0.002 to 0.084) | 0.039 | 0.936 |
| (8.3) Transport | Female—Male | 0.205 (0.100 to 0.311) | 0.000 | 0.000 |
| (9) Elementary occupations | Female—Male | 0.025 (−0.022 to 0.072) | 0.295 | 1.000 |
| Occupation | Age-Group (yrs) | Mean (95% CI) | p-Value | Adjusted p-Value |
|---|---|---|---|---|
| (1) Managers | (18–34)—(35–49) | −0.025 (−0.086 to 0.036) | 0.427 | 1.000 |
| (1) Managers | (18–34)—(50–65) | −0.161 (−0.223 to −0.098) | 0.000 | 0.000 |
| (1) Managers | (35–49)—(50–65) | −0.136 (−0.173 to −0.099) | 0.000 | 0.000 |
| (2.1) Science and engineering | (18–34)—(35–49) | −0.032 (−0.075 to 0.011) | 0.145 | 1.000 |
| (2.1) Science and engineering | (18–34)—(50–65) | −0.129 (−0.179 to −0.078) | 0.000 | 0.000 |
| (2.1) Science and engineering | (35–49)—(50–65) | −0.097 (−0.145 to −0.049) | 0.000 | 0.000 |
| (2.2) Health care | (18–34)—(35–49) | −0.099 (−0.181 to −0.017) | 0.017 | 0.612 |
| (2.2) Health care | (18–34)—(50–65) | −0.175 (−0.260 to −0.090) | 0.000 | 0.000 |
| (2.2) Health care | (35–49)—(50–65) | −0.076 (−0.147 to −0.005) | 0.036 | 1.000 |
| (2.3) Education | (18–34)—(35–49) | −0.168 (−0.236 to −0.101) | 0.000 | 0.000 |
| (2.3) Education | (18–34)—(50–65) | −0.251 (−0.319 to −0.184) | 0.000 | 0.000 |
| (2.3) Education | (35–49)—(50–65) | −0.083 (−0.137 to −0.029) | 0.003 | 0.108 |
| (2.4) Other professionals | (18–34)—(35–49) | −0.118 (−0.152 to −0.084) | 0.000 | 0.000 |
| (2.4) Other professionals | (18–34)—(50–65) | −0.234 (−0.271 to −0.197) | 0.000 | 0.000 |
| (2.4) Other professionals | (35–49)—(50–65) | −0.116 (−0.148 to −0.084) | 0.000 | 0.000 |
| (3) Associate professionals | (18–34)—(35–49) | −0.020 (−0.043 to 0.003) | 0.090 | 1.000 |
| (3) Associate professionals | (18–34)—(50–65) | −0.128 (−0.152 to −0.103) | 0.000 | 0.000 |
| (3) Associate professionals | (35–49)—(50–65) | −0.108 (−0.129 to −0.086) | 0.000 | 0.000 |
| (4) Administrative and customer service | (18–34)—(35–49) | −0.090 (−0.123 to −0.057) | 0.000 | 0.000 |
| (4) Administrative and customer service | (18–34)—(50–65) | −0.208 (−0.243 to −0.173) | 0.000 | 0.000 |
| (4) Administrative and customer service | (35–49)—(50–65) | −0.118 (−0.153 to −0.084) | 0.000 | 0.000 |
| (5) Service, care, and shop sales | (18–34)—(35–49) | −0.024 (−0.057 to 0.010) | 0.172 | 1.000 |
| (5) Service, care, and shop sales | (18–34)—(50–65) | −0.076 (−0.111 to −0.041) | 0.000 | 0.000 |
| (5) Service, care, and shop sales | (35–49)—(50–65) | −0.053 (−0.085 to −0.021) | 0.001 | 0.036 |
| (7) Building and manufacturing | (18–34)—(35–49) | −0.000 (−0.029 to 0.029) | 0.980 | 1.000 |
| (7) Building and manufacturing | (18–34)—(50–65) | −0.064 (−0.096 to −0.032) | 0.000 | 0.000 |
| (7) Building and manufacturing | (35–49)—(50–65) | −0.063 (−0.095 to −0.032) | 0.000 | 0.000 |
| (8) Mechanical manufacturing | (18–34)—(35–49) | −0.036 (−0.073 to 0.002) | 0.063 | 1.000 |
| (8) Mechanical manufacturing | (18–34)—(50–65) | −0.089 (−0.131 to −0.047) | 0.000 | 0.000 |
| (8) Mechanical manufacturing | (35–49)—(50–65) | −0.054 (−0.094 to −0.013) | 0.009 | 0.324 |
| (8.3) Transport | (18–34)—(35–49) | −0.178 (−0.244 to −0.111) | 0.000 | 0.000 |
| (8.3) Transport | (18–34)—(50–65) | −0.181 (−0.252 to −0.110) | 0.000 | 0.000 |
| (8.3) Transport | (35–49)—(50–65) | −0.003 (−0.070 to 0.063) | 0.921 | 1.000 |
| (9) Elementary occupations | (18–34)—(35–49) | −0.082 (−0.141 to −0.023) | 0.007 | 0.252 |
| (9) Elementary occupations | (18–34)—(50–65) | −0.089 (−0.148 to −0.029) | 0.003 | 0.108 |
| (9) Elementary occupations | (35–49)—(50–65) | −0.007 (−0.061 to 0.048) | 0.803 | 1.000 |
References
- Ross, R.; Blair, S.N.; Arena, R.; Church, T.S.; Despres, J.P.; Franklin, B.A.; Haskell, W.L.; Kaminsky, L.A.; Levine, B.D.; Lavie, C.J.; et al. Importance of Assessing Cardiorespiratory Fitness in Clinical Practice: A Case for Fitness as a Clinical Vital Sign: A Scientific Statement From the American Heart Association. Circulation 2016, 134, e653–e699. [Google Scholar] [CrossRef] [PubMed]
- Bouchard, C.; Lesage, R.; Lortie, G.; Simoneau, J.A.; Hamel, P.; Boulay, M.R.; Pérusse, L.; Thériault, G.; Leblanc, C. Aerobic performance in brothers, dizygotic and monozygotic twins. Med. Sci. Sports Exerc. 1986, 18, 639–646. [Google Scholar] [CrossRef]
- Bouchard, C.; An, P.; Rice, T.; Skinner, J.S.; Wilmore, J.H.; Gagnon, J.; Perusse, L.; Leon, A.S.; Rao, D.C. Familial aggregation of VO(2max) response to exercise training: Results from the HERITAGE Family Study. J. Appl. Physiol. 1999, 87, 1003–1008. [Google Scholar] [CrossRef] [Green Version]
- Skinner, J.S.; Jaskolski, A.; Jaskolska, A.; Krasnoff, J.; Gagnon, J.; Leon, A.S.; Rao, D.C.; Wilmore, J.H.; Bouchard, C.; Study, H.F. Age, sex, race, initial fitness, and response to training: The HERITAGE Family Study. J. Appl. Physiol. 2001, 90, 1770–1776. [Google Scholar] [CrossRef] [Green Version]
- Zeiher, J.; Ombrellaro, K.J.; Perumal, N.; Keil, T.; Mensink, G.B.M.; Finger, J.D. Correlates and Determinants of Cardiorespiratory Fitness in Adults: A Systematic Review. Sports Med. Open 2019, 5, 39. [Google Scholar] [CrossRef] [Green Version]
- Ekblom-Bak, E.; Olsson, G.; Ekblom, O.; Ekblom, B.; Bergstrom, G.; Borjesson, M. The Daily Movement Pattern and Fulfilment of Physical Activity Recommendations in Swedish Middle-Aged Adults: The SCAPIS Pilot Study. PLoS ONE 2015, 10, e0126336. [Google Scholar] [CrossRef] [Green Version]
- Lindgren, M.; Börjesson, M.; Ekblom, Ö.; Bergström, G.; Lappas, G.; Rosengren, A. Physical activity pattern, cardiorespiratory fitness, and socioeconomic status in the SCAPIS pilot trial—A cross-sectional study. Prev. Med. Rep. 2016, 4, 44–49. [Google Scholar] [CrossRef] [Green Version]
- Psaltopoulou, T.; Hatzis, G.; Papageorgiou, N.; Androulakis, E.; Briasoulis, A.; Tousoulis, D. Socioeconomic status and risk factors for cardiovascular disease: Impact of dietary mediators. Hell. J. Cardiol. 2017, 58, 32–42. [Google Scholar] [CrossRef] [PubMed]
- Schultz, W.M.; Kelli, H.M.; Lisko, J.C.; Varghese, T.; Shen, J.; Sandesara, P.; Quyyumi, A.A.; Taylor, H.A.; Gulati, M.; Harold, J.G.; et al. Socioeconomic Status and Cardiovascular Outcomes. Circulation 2018, 137, 2166–2178. [Google Scholar] [CrossRef] [PubMed]
- Vaisanen, D.; Kallings, L.V.; Hemmingsson, E.; Ekblom-Bak, E. Lifestyle-associated health risk indicators across a wide range of occupational groups: A cross-sectional analysis in 72,855 workers. BMC Public Health 2020, 20, 1656. [Google Scholar] [CrossRef]
- Astrand, I. Degree of strain during building work as related to individual aerobic work capacity. Ergonomics 1967, 10, 293–303. [Google Scholar] [CrossRef]
- Pantzar, A.; Jonasson, L.S.; Ekblom, Ö.; Boraxbekk, C.-J.; Ekblom, M.M. Relationships Between Aerobic Fitness Levels and Cognitive Performance in Swedish Office Workers. Front. Psychol. 2018, 9, 2612. [Google Scholar] [CrossRef] [Green Version]
- Drake, E.; Ekblom, M.M.; Ekblom, Ö.; Kallings, L.V.; Blom, V. Cardiorespiratory Fitness and Device-Measured Sedentary Behaviour are Associated with Sickness Absence in Office Workers. Int. J. Environ. Res. Public. Health 2020, 17, 628. [Google Scholar] [CrossRef] [Green Version]
- Ekblom-Bak, E.; Ekblom, Ö.; Andersson, G.; Wallin, P.; Söderling, J.; Hemmingsson, E.; Ekblom, B. Decline in cardiorespiratory fitness in the Swedish working force between 1995 and 2017. Scand. J. Med. Sci. Sports 2019, 29, 232–239. [Google Scholar] [CrossRef]
- Lamoureux, N.R.; Fitzgerald, J.S.; Norton, K.I.; Sabato, T.; Tremblay, M.S.; Tomkinson, G.R. Temporal Trends in the Cardiorespiratory Fitness of 2,525,827 Adults Between 1967 and 2016: A Systematic Review. Sports Med. 2019, 49, 41–55. [Google Scholar] [CrossRef]
- Astrand, I. Aerobic work capacity in men and women with special reference to age. Acta Physiol. Scand. Suppl. 1960, 49, 1–92. [Google Scholar]
- Blair, S.N.; Kohl, H.W., 3rd; Paffenbarger, R.S., Jr.; Clark, D.G.; Cooper, K.H.; Gibbons, L.W. Physical fitness and all-cause mortality. A prospective study of healthy men and women. JAMA 1989, 262, 2395–2401. [Google Scholar] [CrossRef]
- Bjorkman, F.; Ekblom-Bak, E.; Ekblom, O.; Ekblom, B. Validity of the revised Ekblom Bak cycle ergometer test in adults. Eur. J. Appl. Physiol. 2016, 116, 1627–1638. [Google Scholar] [CrossRef] [PubMed] [Green Version]
- Standard for Svensk Yrkesklassificering. Available online: http://www.scb.se/dokumentation/klassifikationer-och-standarder/standard-for-svensk-yrkesklassificering-ssyk/ (accessed on 18 May 2020).
- Wickham, H.; Averick, M.; Bryan, J.; Chang, W.; McGowan, L.D.; François, R.; Grolemund, G.; Hayes, A.; Henry, L.; Hester, J.; et al. Welcome to the tidyverse. J. Open Source Softw. 2019, 4, 1686. [Google Scholar] [CrossRef]
- Lenth, R.; Singmann, H.; Love, J.; Buerkner, P.; Herve, M. Emmeans: Estimated Marginal Means, Aka Least-Squares Means; R Package Version; 1.5.4. Available online: https://CRAN.R-project.org/package=emmeans (accessed on 11 February 2021).
- O’Hara-Wild, M.; Hyndman, R.; Wang, E. Fable: Forecasting Models for Tidy Time Series. 2021. Available online: https://CRAN.R-project.org/package=fable (accessed on 1 January 2021).
- Lewis, J.E.; Clark, J.D.; LeBlanc, W.G.; Fleming, L.E.; Cabán-Martinez, A.J.; Arheart, K.L.; Tannenbaum, S.L.; Ocasio, M.A.; Davila, E.P.; Kachan, D.; et al. Cardiovascular Fitness Levels among American Workers. J. Occup. Environ. Med. Am. Coll. Occup. Environ. Med. 2011, 53, 1115–1121. [Google Scholar] [CrossRef] [Green Version]
- Jørgensen, M.B.; Korshøj, M.; Lagersted-Olsen, J.; Villumsen, M.; Mortensen, O.S.; Skotte, J.; Søgaard, K.; Madeleine, P.; Thomsen, B.L.; Holtermann, A. Physical activities at work and risk of musculoskeletal pain and its consequences: Protocol for a study with objective field measures among blue-collar workers. BMC Musculoskelet. Disord. 2013, 14, 213. [Google Scholar] [CrossRef] [Green Version]
- Finkelstein, E.A.; Sahasranaman, A.; John, G.; Haaland, B.A.; Bilger, M.; Sloan, R.A.; Nang, E.E.K.; Evenson, K.R. Design and baseline characteristics of participants in the TRial of Economic Incentives to Promote Physical Activity (TRIPPA): A randomized controlled trial of a six month pedometer program with financial incentives. Contemp. Clin. Trials 2015, 41, 238–247. [Google Scholar] [CrossRef] [PubMed]
- Brighenti-Zogg, S.; Mundwiler, J.; Schupbach, U.; Dieterle, T.; Wolfer, D.P.; Leuppi, J.D.; Miedinger, D. Physical Workload and Work Capacity across Occupational Groups. PLoS ONE 2016, 11, e0154073. [Google Scholar] [CrossRef] [Green Version]
- Carr, L.J.; Leonhard, C.; Tucker, S.; Fethke, N.; Benzo, R.; Gerr, F. Total Worker Health Intervention Increases Activity of Sedentary Workers. Am. J. Prev. Med. 2016, 50, 9–17. [Google Scholar] [CrossRef]
- Holtermann, A.; Marott, J.L.; Gyntelberg, F.; Søgaard, K.; Mortensen, O.S.; Prescott, E.; Schnohr, P. Self-reported occupational physical activity and cardiorespiratory fitness: Importance for cardiovascular disease and all-cause mortality. Scand. J. Work. Environ. Health 2016, 42, 291–298. [Google Scholar] [CrossRef] [Green Version]
- Knuth, A.G.; Hallal, P.C. Temporal trends in physical activity: A systematic review. J. Phys. Act. Health 2009, 6, 548–559. [Google Scholar] [CrossRef]
- Juneau, C.-E.; Potvin, L. Trends in leisure-, transport-, and work-related physical activity in Canada 1994–2005. Prev. Med. 2010, 51, 384–386. [Google Scholar] [CrossRef]
- Devonshire-Gill, K.R.; Norton, K.I. Australian Adult Physical Activity Sufficiency Trend Data: Positive, Prevalent, and Persistent Changes 2002–2012. J. Phys. Act. Health 2018, 15, 117–126. [Google Scholar] [CrossRef]
- Motl, R.W.; McAuley, E.; DiStefano, C. Is social desirability associated with self-reported physical activity? Prev. Med. 2005, 40, 735–739. [Google Scholar] [CrossRef]
- Prince, S.A.; Adamo, K.B.; Hamel, M.E.; Hardt, J.; Gorber, S.C.; Tremblay, M. A comparison of direct versus self-report measures for assessing physical activity in adults: A systematic review. Int. J. Behav. Nutr. Phys. Act. 2008, 5, 56. [Google Scholar] [CrossRef] [Green Version]
- Hagströmer, M.; Kwak, L.; Oja, P.; Sjöström, M. A 6 year longitudinal study of accelerometer-measured physical activity and sedentary time in Swedish adults. J. Sci. Med. Sport 2015, 18, 553–557. [Google Scholar] [CrossRef]
- Ng, S.W.; Popkin, B.M. Time use and physical activity: A shift away from movement across the globe. Obes. Rev. 2012, 13, 659–680. [Google Scholar] [CrossRef] [Green Version]
- Fogelholm, M. Physical activity, fitness and fatness: Relations to mortality, morbidity and disease risk factors. A systematic review. Obes. Rev. Off. J. Int. Assoc. Study Obes. 2010, 11, 202–221. [Google Scholar] [CrossRef] [PubMed]
- Lee, D.-C.; Sui, X.; Church, T.S.; Lavie, C.J.; Jackson, A.S.; Blair, S.N. Changes in fitness and fatness on the development of cardiovascular disease risk factors hypertension, metabolic syndrome, and hypercholesterolemia. J. Am. Coll. Cardiol. 2012, 59, 665–672. [Google Scholar] [CrossRef] [Green Version]
- Farrell, S.W.; Fitzgerald, S.J.; McAuley, P.A.; Barlow, C.E. Cardiorespiratory fitness, adiposity, and all-cause mortality in women. Med. Sci. Sports Exerc. 2010, 42, 2006–2012. [Google Scholar] [CrossRef]
- Tarp, J.; Grøntved, A.; Sanchez-Lastra, M.A.; Dalene, K.E.; Ding, D.; Ekelund, U. Fitness, Fatness, and Mortality in Men and Women From the UK Biobank: Prospective Cohort Study. J. Am. Heart Assoc. 2021, 10, e019605. [Google Scholar] [CrossRef]
- Guthold, R.; Stevens, G.A.; Riley, L.M.; Bull, F.C. Worldwide trends in insufficient physical activity from 2001 to 2016: A pooled analysis of 358 population-based surveys with 1·9 million participants. Lancet Glob. Health 2018, 6, e1077–e1086. [Google Scholar] [CrossRef] [Green Version]
- Jackson, A.S.; Sui, X.; Hebert, J.R.; Church, T.S.; Blair, S.N. Role of lifestyle and aging on the longitudinal change in cardiorespiratory fitness. Arch. Intern. Med. 2009, 169, 1781–1787. [Google Scholar] [CrossRef] [PubMed] [Green Version]
- Lee, D.C.; Artero, E.G.; Sui, X.; Blair, S.N. Mortality trends in the general population: The importance of cardiorespiratory fitness. J. Psychopharmacol. 2010, 24, 27–35. [Google Scholar] [CrossRef] [PubMed]
- Bachmann, J.M.; DeFina, L.F.; Franzini, L.; Gao, A.; Leonard, D.S.; Cooper, K.H.; Berry, J.D.; Willis, B.L. Cardiorespiratory Fitness in Middle Age and Health Care Costs in Later Life. J. Am. Coll. Cardiol. 2015, 66, 1876–1885. [Google Scholar] [CrossRef] [PubMed] [Green Version]
- Rosengren, A.; Subramanian, S.V.; Islam, S.; Chow, C.K.; Avezum, A.; Kazmi, K.; Sliwa, K.; Zubaid, M.; Rangarajan, S.; Yusuf, S. Education and risk for acute myocardial infarction in 52 high, middle and low-income countries: INTERHEART case-control study. Heart 2009, 95, 2014–2022. [Google Scholar] [CrossRef]
- Lidegaard, M.; Søgaard, K.; Krustrup, P.; Holtermann, A.; Korshøj, M. Effects of 12 months aerobic exercise intervention on work ability, need for recovery, productivity and rating of exertion among cleaners: A worksite RCT. Int. Arch. Occup. Environ. Health 2018, 91, 225–235. [Google Scholar] [CrossRef] [PubMed] [Green Version]
- Holtermann, A.; Mortensen, O.S.; Burr, H.; Søgaard, K.; Gyntelberg, F.; Suadicani, P. Physical demands at work, physical fitness, and 30-year ischaemic heart disease and all-cause mortality in the Copenhagen Male Study. Scand. J. Work. Environ. Health 2010, 36, 357–365. [Google Scholar] [CrossRef] [PubMed] [Green Version]
- Ekblom-Bak, E.; Ekblom, B.; Söderling, J.; Börjesson, M.; Blom, V.; Kallings, L.V.; Hemmingsson, E.; Andersson, G.; Wallin, P.; Ekblom, Ö. Sex- and age-specific associations between cardiorespiratory fitness, CVD morbidity and all-cause mortality in 266.109 adults. Prev. Med. 2019, 127, 105799. [Google Scholar] [CrossRef]
- Kodama, S.; Saito, K.; Tanaka, S.; Maki, M.; Yachi, Y.; Asumi, M.; Sugawara, A.; Totsuka, K.; Shimano, H.; Ohashi, Y.; et al. Cardiorespiratory fitness as a quantitative predictor of all-cause mortality and cardiovascular events in healthy men and women: A meta-analysis. JAMA 2009, 301, 2024–2035. [Google Scholar] [CrossRef] [PubMed] [Green Version]
- Hafner, M.; Yerushalmi, E.; Stepanek, M.; Phillips, W.; Pollard, J.; Deshpande, A.; Whitmore, M.; Millard, F.; Subel, S.; Stolk, C. van Estimating the global economic benefits of physically active populations over 30 years (2020–2050). Br. J. Sports Med. 2020, 54, 1482–1487. [Google Scholar] [CrossRef]
- Straker, L.; Mathiassen, S.E.; Holtermann, A. The “Goldilocks Principle”: Designing physical activity at work to be “just right” for promoting health. Br. J. Sports Med. 2018, 52, 818–819. [Google Scholar] [CrossRef] [Green Version]
- Holtermann, A.; Mathiassen, S.E.; Straker, L. Promoting health and physical capacity during productive work: The Goldilocks Principle. Scand. J. Work. Environ. Health 2019, 45, 90–97. [Google Scholar] [CrossRef]
- Korshøj, M.; Lidegaard, M.; Skotte, J.H.; Krustrup, P.; Krause, N.; Søgaard, K.; Holtermann, A. Does aerobic exercise improve or impair cardiorespiratory fitness and health among cleaners? A cluster randomized controlled trial. Scand. J. Work. Environ. Health 2015, 41, 140–152. [Google Scholar] [CrossRef] [Green Version]


| 2001–2005 | 2006–2010 | 2011–2015 | 2016–2020 | |
|---|---|---|---|---|
| n | 71,309 | 117,600 | 175,963 | 151,250 |
| Women | 52% | 47% | 40% | 35% |
| Men | 48% | 53% | 60% | 65% |
| 18–34 years | 26% | 24% | 25% | 29% |
| 35–49 years | 43% | 44% | 45% | 40% |
| 50–65 years | 31% | 33% | 31% | 31% |
| Education ≥16 years | 23% | 25% | 28% | 29% |
| Education 10-15 years | 66% | 65% | 64% | 65% |
| Education ≤9 years | 11% | 10% | 8% | 7% |
| White-collar high-skilled | 55% | 53% | 56% | 52% |
| White-collar low-skilled | 24% | 21% | 16% | 17% |
| Blue-collar high-skilled | 8% | 11% | 15% | 19% |
| Blue-collar low-skilled | 13% | 15% | 13% | 12% |
| (1) Managers | 4% | 6% | 7% | 9% |
| (2.1) Science and engineering | 6% | 7% | 9% | 7% |
| (2.2) Health care | 3% | 3% | 4% | 2% |
| (2.3) Education | 5% | 3% | 2% | 3% |
| (2.4) Other professionals | 11% | 10% | 10% | 11% |
| (3) Associate professionals | 27% | 24% | 24% | 21% |
| (4) Administrative and customer service | 11% | 9% | 8% | 9% |
| (5) Service, care, and shop sales | 13% | 12% | 8% | 8% |
| (7) Building and manufacturing | 8% | 11% | 15% | 19% |
| (8) Mechanical manufacturing | 7% | 9% | 8% | 7% |
| (8.3) Transport | 2% | 2% | 2% | 3% |
| (9) Elementary occupations | 4% | 4% | 3% | 3% |
| Height women (cm) | 166.4 (6.0) | 166.6 (6.0) | 166.8 (6.1) | 166.9 (6.2) |
| Height men (cm) | 180.1 (6.6) | 180.3 (6.6) | 180.4 (6.7) | 180.4 (6.7) |
| Weight women (kg) | 68.3 (11.9) | 69.2 (12.5) | 69.7 (12.8) | 70.2 (13.2) |
| Weight men (kg) | 84.0 (12.6) | 85.4 (13.2) | 86.0 (13.5) | 86.9 (14.2) |
Publisher’s Note: MDPI stays neutral with regard to jurisdictional claims in published maps and institutional affiliations. |
© 2021 by the authors. Licensee MDPI, Basel, Switzerland. This article is an open access article distributed under the terms and conditions of the Creative Commons Attribution (CC BY) license (https://creativecommons.org/licenses/by/4.0/).
Share and Cite
Väisänen, D.; Kallings, L.V.; Andersson, G.; Wallin, P.; Hemmingsson, E.; Ekblom-Bak, E. Cardiorespiratory Fitness in Occupational Groups—Trends over 20 Years and Future Forecasts. Int. J. Environ. Res. Public Health 2021, 18, 8437. https://doi.org/10.3390/ijerph18168437
Väisänen D, Kallings LV, Andersson G, Wallin P, Hemmingsson E, Ekblom-Bak E. Cardiorespiratory Fitness in Occupational Groups—Trends over 20 Years and Future Forecasts. International Journal of Environmental Research and Public Health. 2021; 18(16):8437. https://doi.org/10.3390/ijerph18168437
Chicago/Turabian StyleVäisänen, Daniel, Lena. V. Kallings, Gunnar Andersson, Peter Wallin, Erik Hemmingsson, and Elin Ekblom-Bak. 2021. "Cardiorespiratory Fitness in Occupational Groups—Trends over 20 Years and Future Forecasts" International Journal of Environmental Research and Public Health 18, no. 16: 8437. https://doi.org/10.3390/ijerph18168437
APA StyleVäisänen, D., Kallings, L. V., Andersson, G., Wallin, P., Hemmingsson, E., & Ekblom-Bak, E. (2021). Cardiorespiratory Fitness in Occupational Groups—Trends over 20 Years and Future Forecasts. International Journal of Environmental Research and Public Health, 18(16), 8437. https://doi.org/10.3390/ijerph18168437