
Analyzing Influencing Factors of Transfer Passenger Flow of Urban Rail Transit: A New Approach Based on Nested Logit Model Considering Transfer Choices

Abstract
:1. Introduction
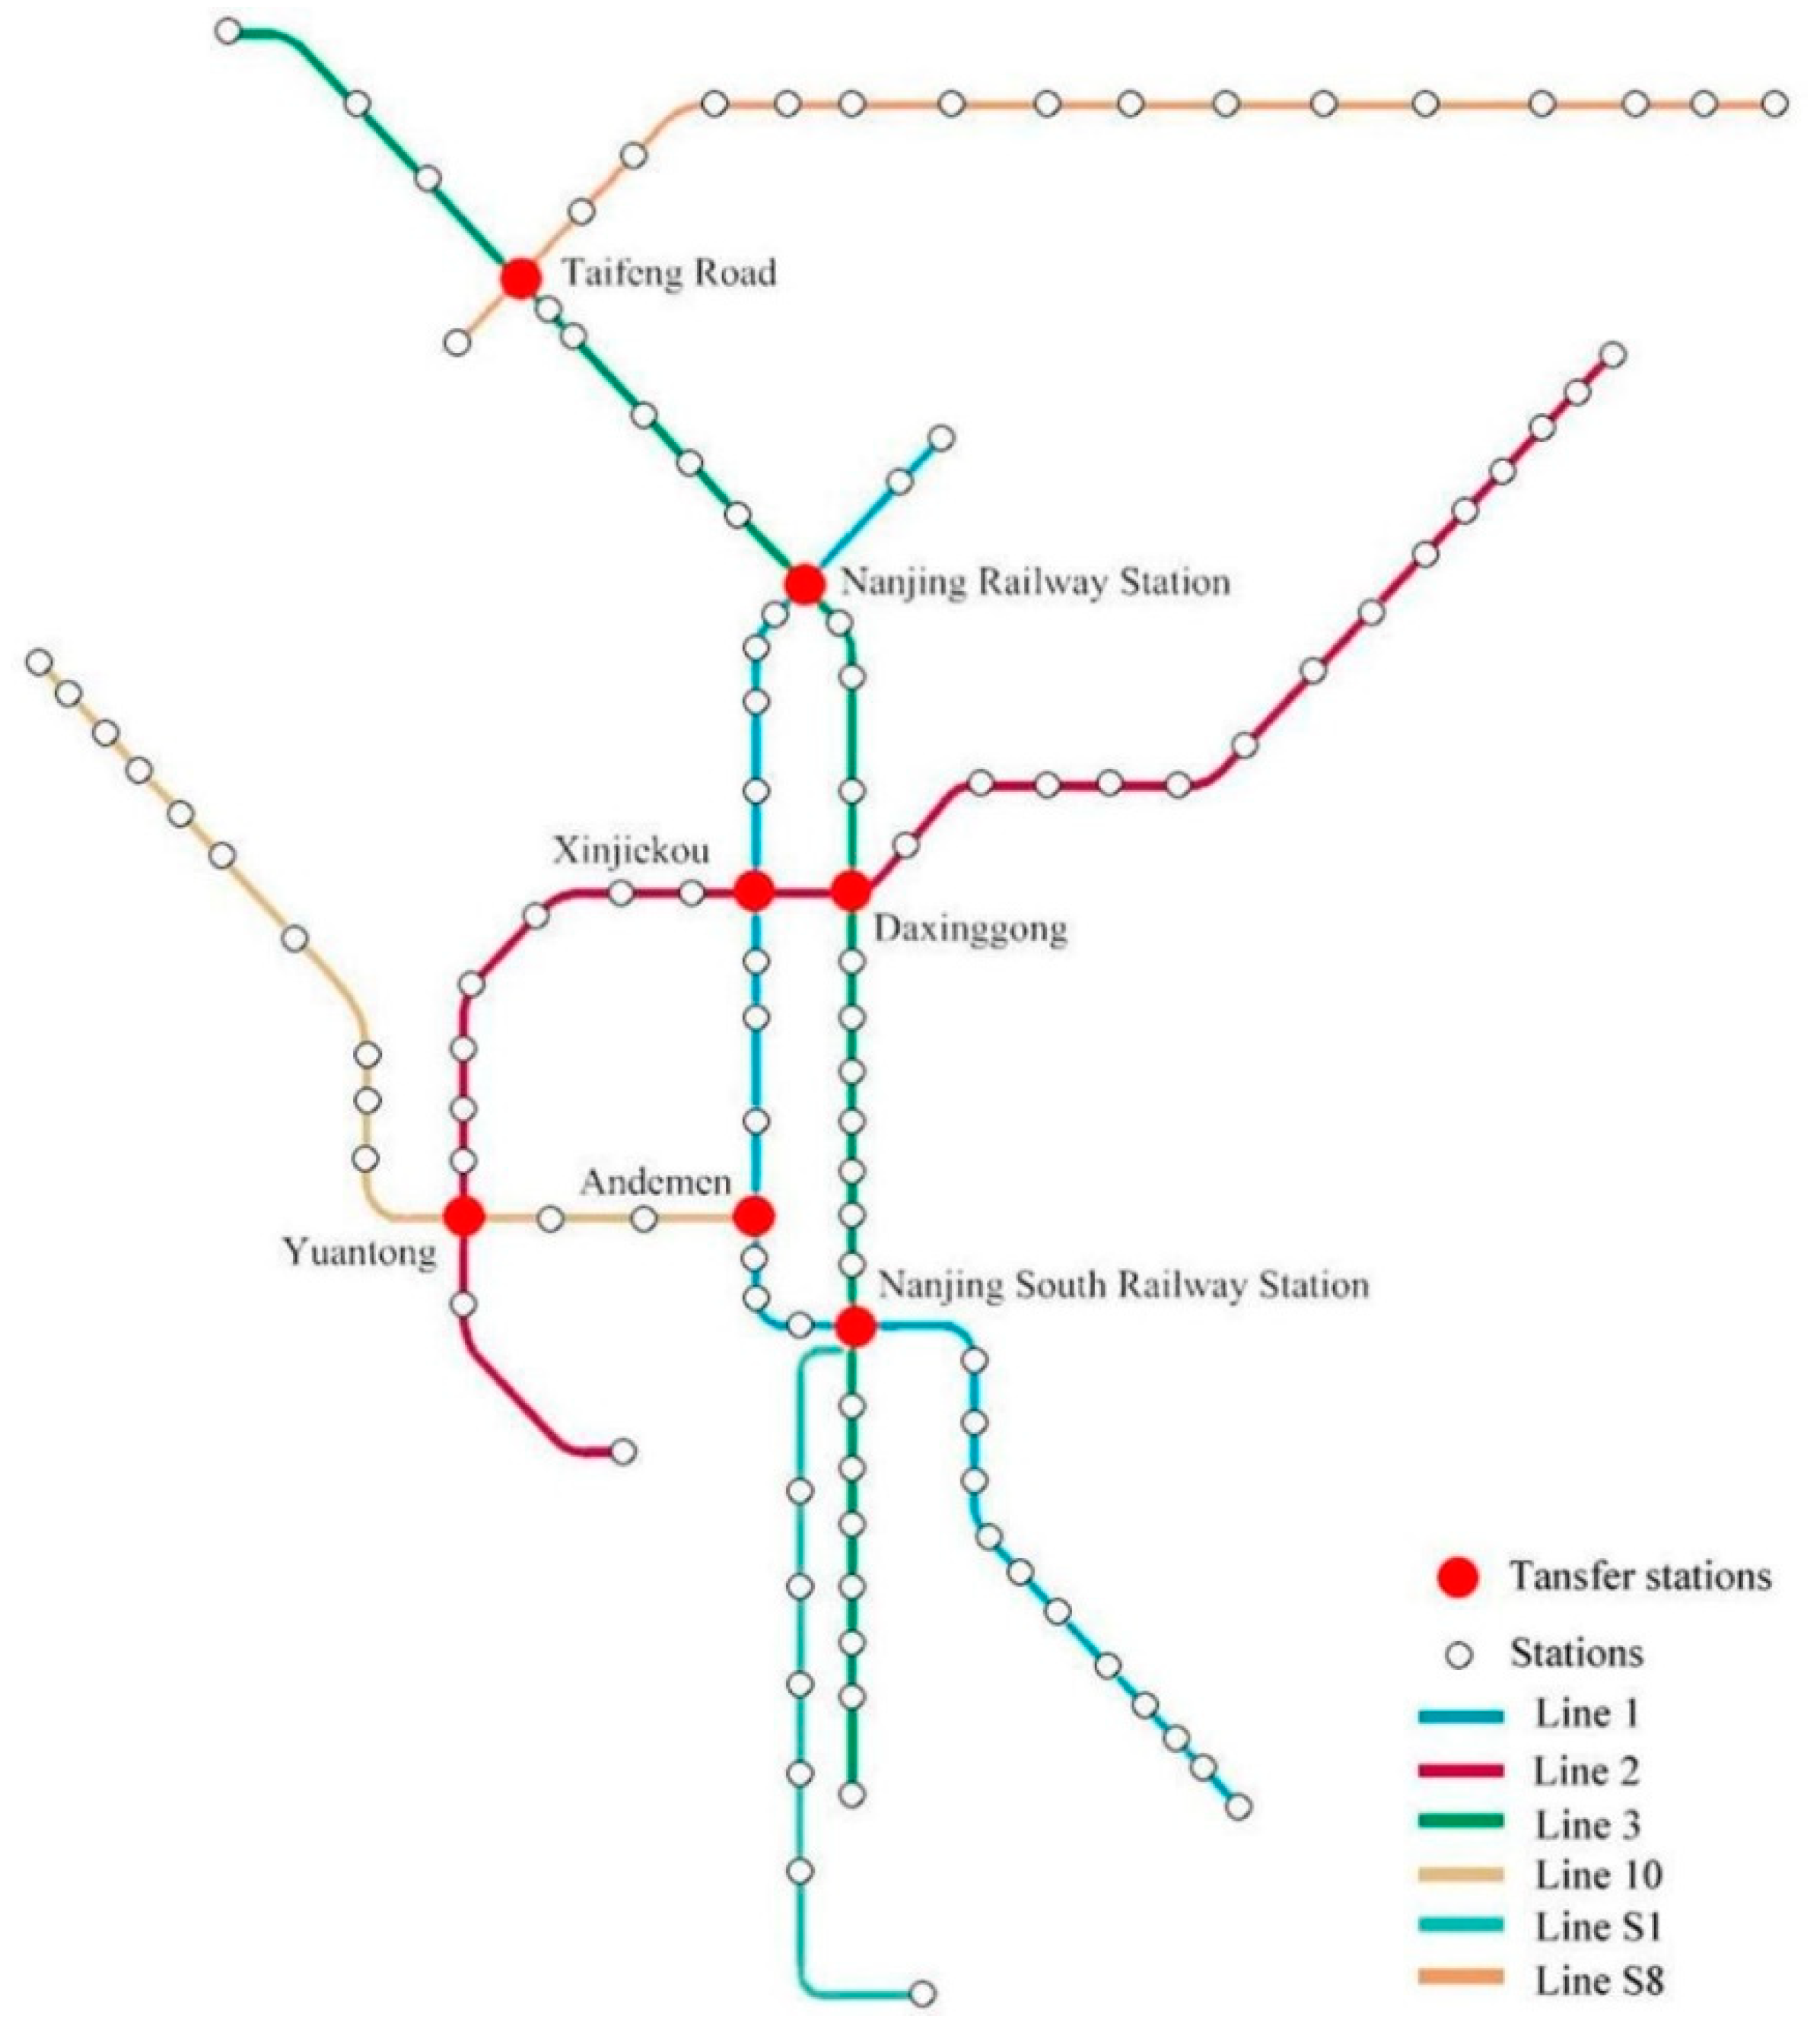
2. Data Collection
3. Methodology
3.1. Transfer Ridership Extraction
3.2. Generalized Cost Function
3.2.1. Travel Time
3.2.2. Ticketing System and Fares
3.2.3. Number of Transfers
3.2.4. Determination of Effective Routes
3.2.5. Route Choice Model
3.3. Influencing Factors of Transfer Passenger Flow
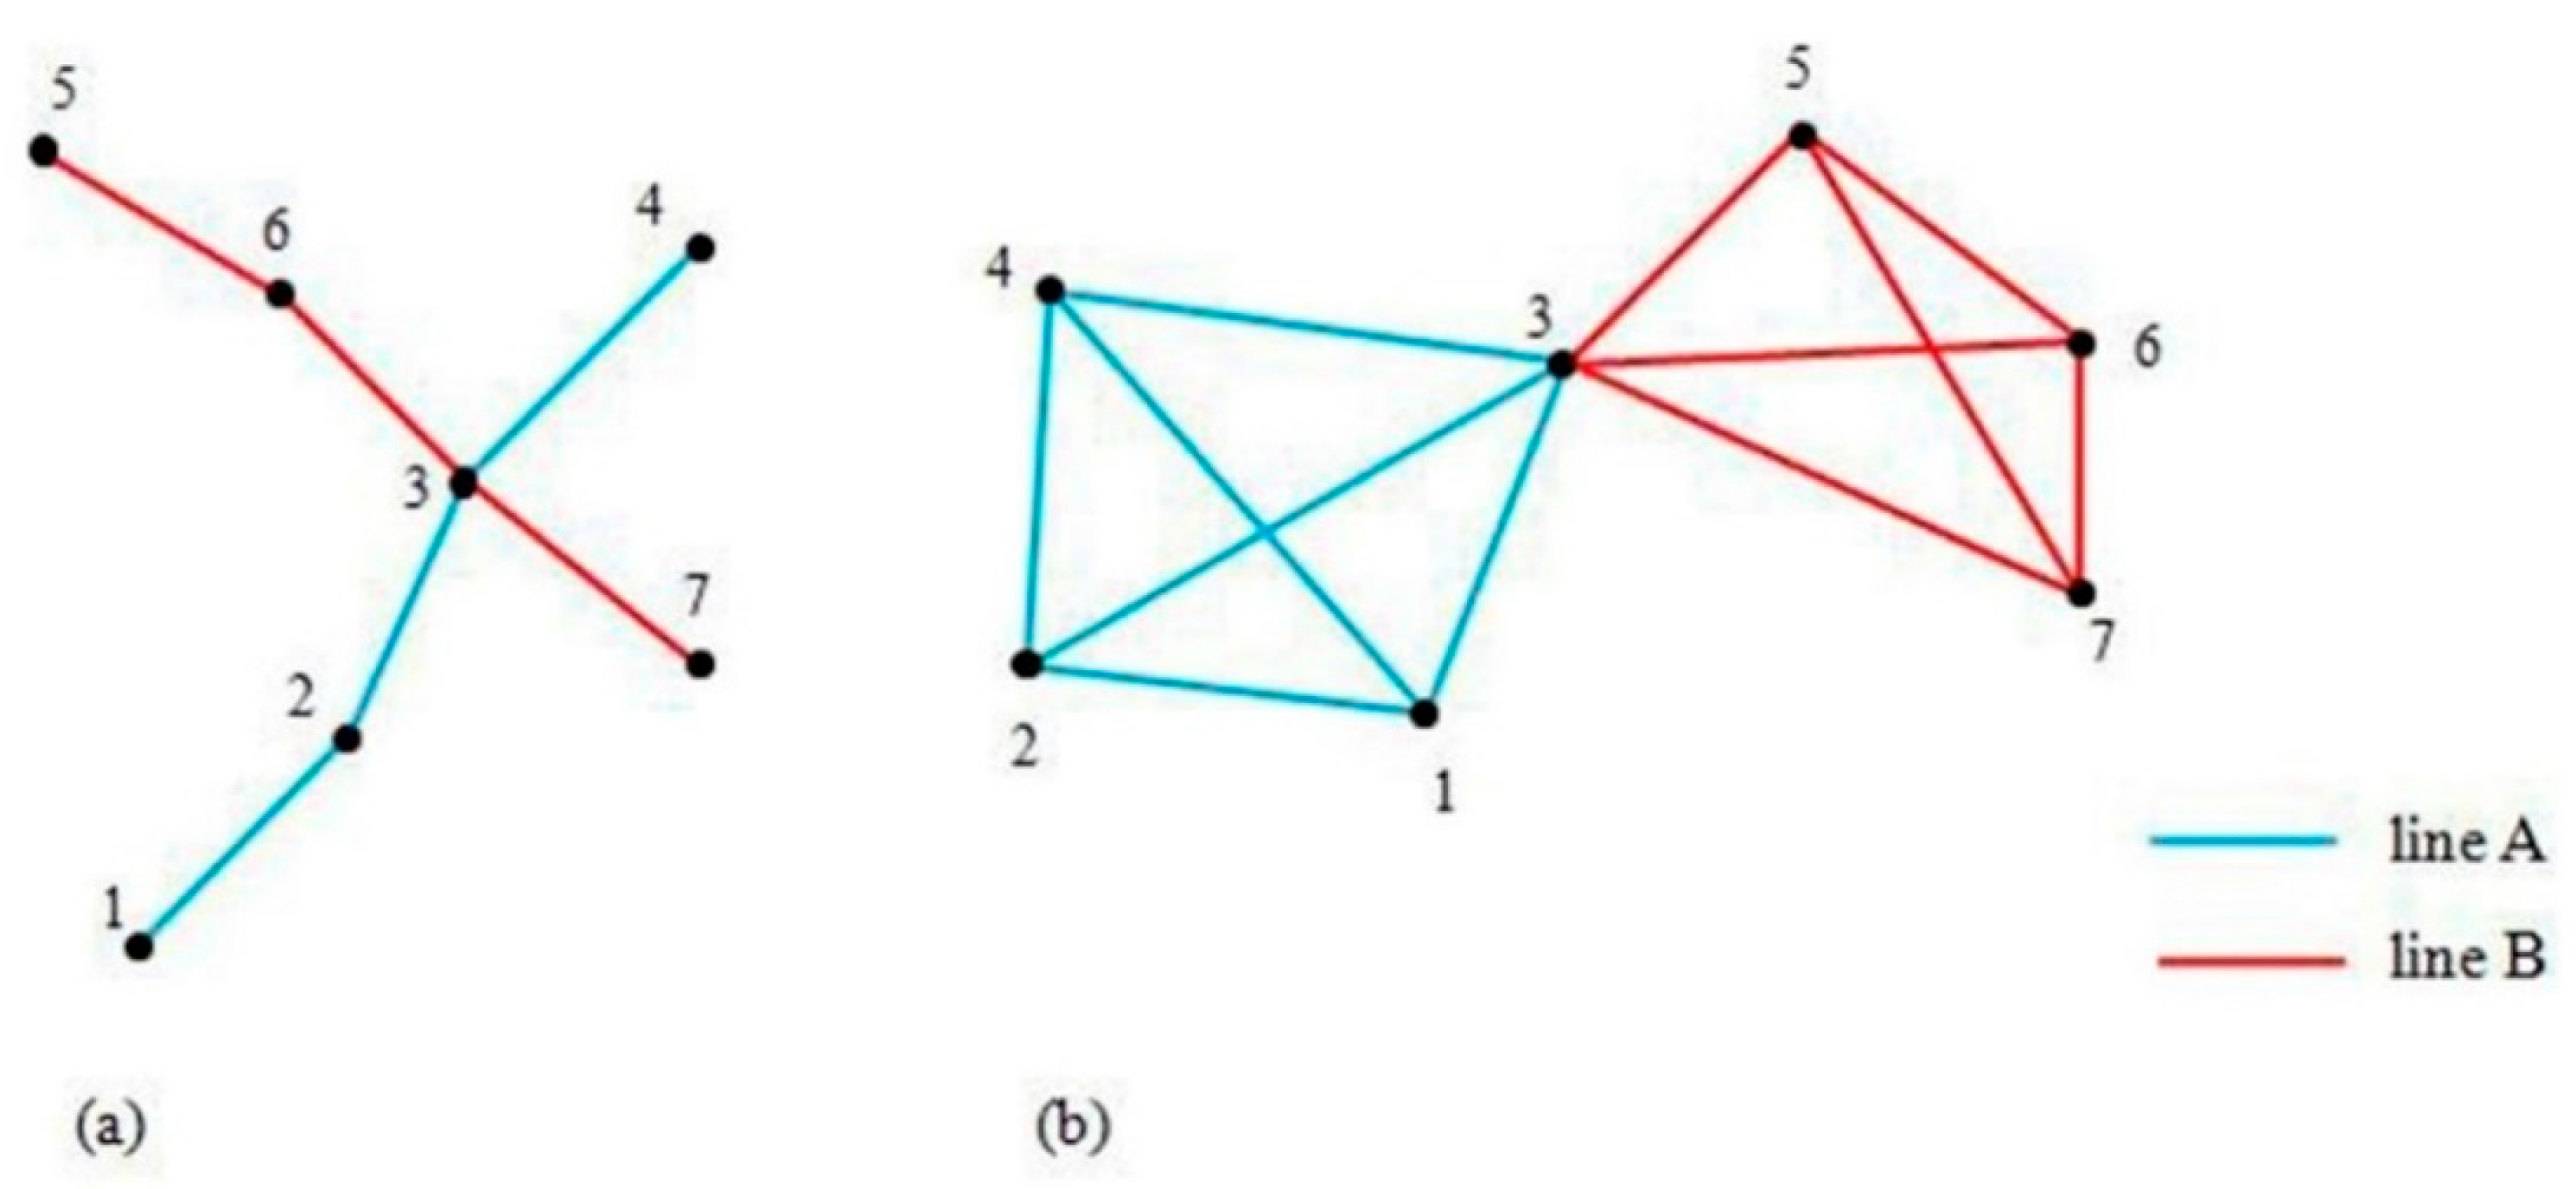
3.3.1. Characteristics of the Network Topology
3.3.2. Location Elements of Transfer Stations
4. Results and Discussions
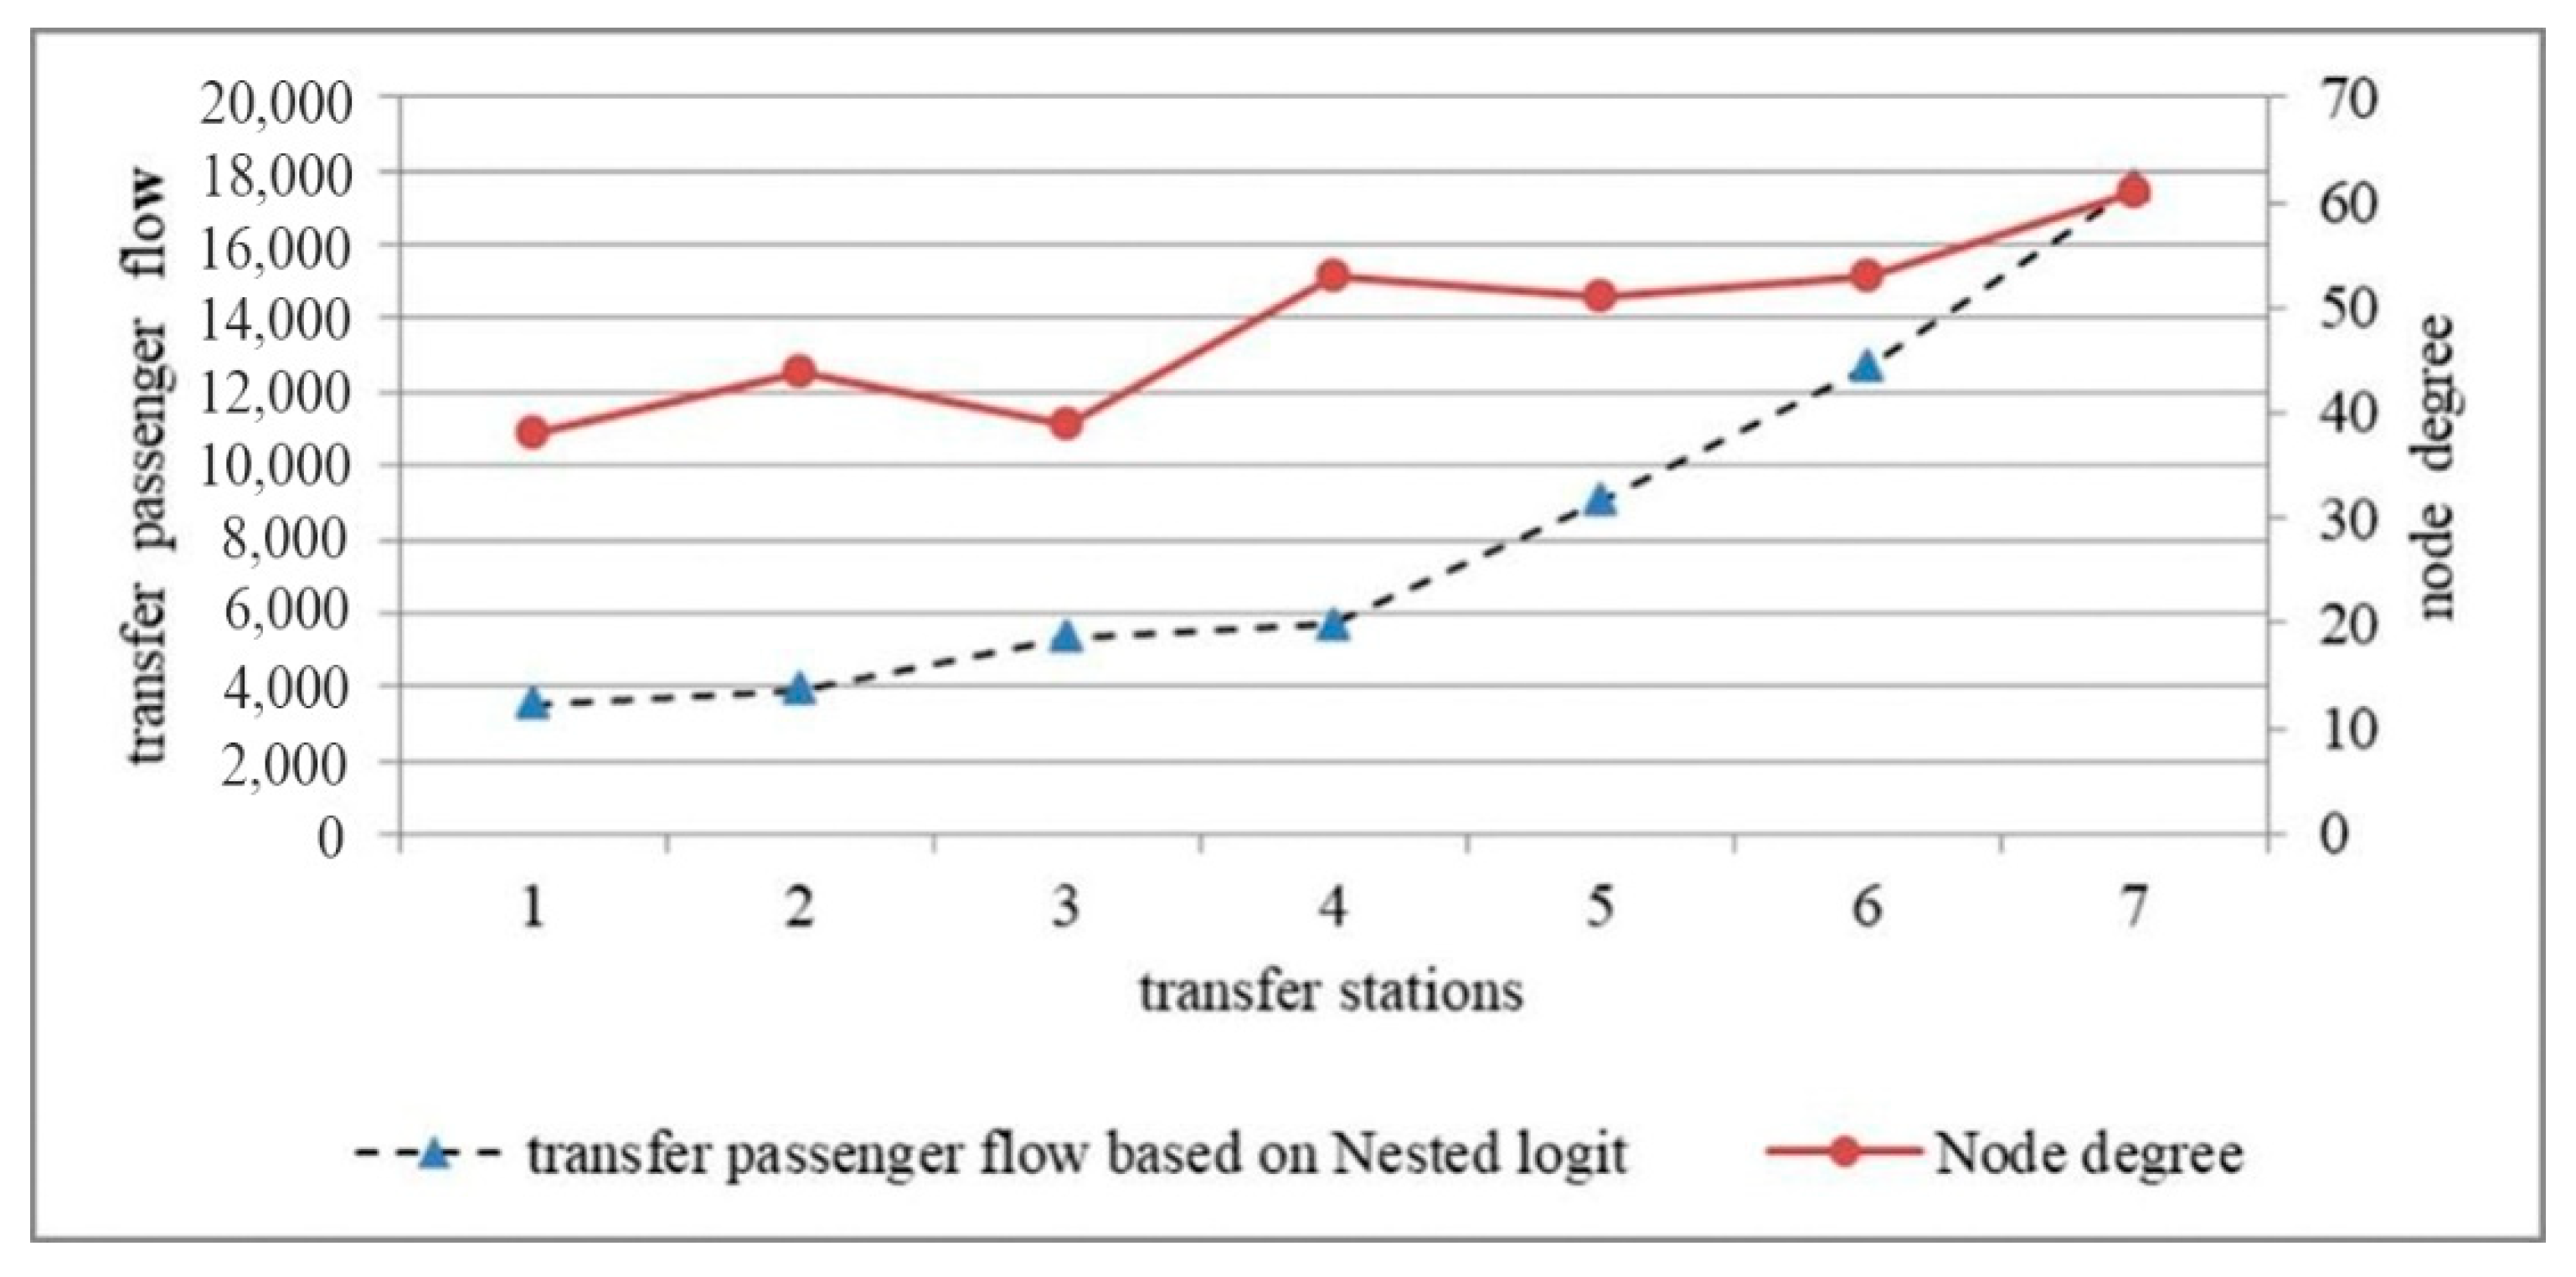
4.1. Transfer Ridership and Node Degree
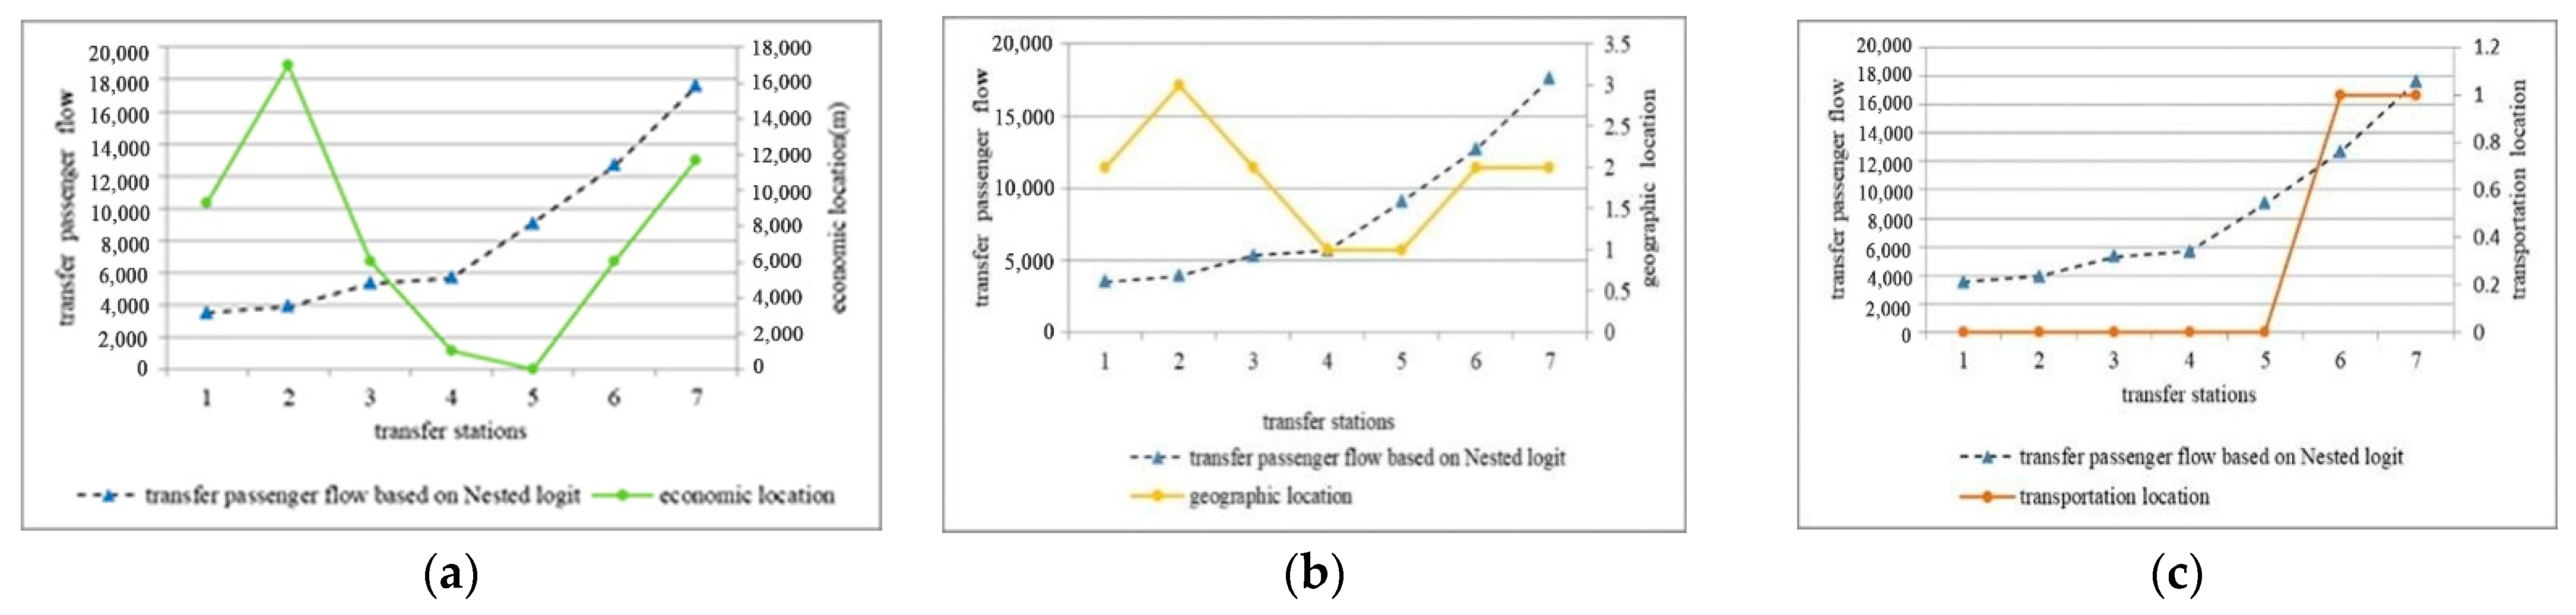
4.2. Transfer Ridership and Location Elements
5. Conclusions
Author Contributions
Funding
Institutional Review Board Statement
Informed Consent Statement
Data Availability Statement
Acknowledgments
Conflicts of Interest
References
- Pang, J.; Yang, Z.; Wang, Y. Statistical analysis of urban rail transit lines in 2016 China-Express delivery of annual report on urban rail transit IV. Urban Mass Transit 2017, 1, 1–5. [Google Scholar] [CrossRef]
- Liu, Y.Z.; Cheng, T. Understanding public transit patterns with open geodemographics to facilitate public transport planning. Transp. A 2020, 16, 76–103. [Google Scholar] [CrossRef] [Green Version]
- Cheng, G.; Zhao, S.Z.; Xu, S.B. Estimation of passenger route choices for urban rail transit system based on automatic fare collection mined data. TIMC 2019, 41, 3092–3102. [Google Scholar] [CrossRef]
- Park, J.; Kim, D.-J.; Lim, Y. Use of Smart Card Data to Define Public Transit Use in Seoul, South Korea. Transp. Res. Record. 2008, 2063, 3–9. [Google Scholar] [CrossRef]
- Jang, W. Travel Time and Transfer Analysis Using Transit Smart Card Data. Transp. Res. Record. 2010, 2144, 142–149. [Google Scholar] [CrossRef]
- Chu, K.; Chapleau, R. Augmenting Transit Trip Characterization and Travel Behavior Comprehension. Transp. Res. Record. 2010, 2183, 29–40. [Google Scholar] [CrossRef]
- Ma, X.; Wu, Y.-J.; Wang, Y.; Chen, F.; Liu, J. Mining smart card data for transit riders’ travel patterns. Transp. Res. Part C-Emerg. Technol. 2013, 36, 1–12. [Google Scholar] [CrossRef]
- Poon, M.H.; Wong, S.; Tong, C.O. A dynamic schedule-based model for congested transit networks. Transp. Res. Part B-Methodol. 2004, 38, 343–368. [Google Scholar] [CrossRef]
- Si, B.; Zhong, M.; Liu, J.; Gao, Z.; Wu, J. Development of a transfer-cost based logit assignment model for Beijing rail transit network using automated fare collection data. J. Adv. Transp. 2013, 47, 297–318. [Google Scholar] [CrossRef]
- Zhou, F.; Xu, R.-h. Model of Passenger Flow Assignmentfor Urban Rail Transit Based on Entryand Exit Time Constraints. Transp. Res. Record. 2012, 2284, 57–61. [Google Scholar] [CrossRef]
- Zhu, W.; Hu, H.; Xu, R.-H.; Hong, L. Modified stochastic user-equilibrium assignment algorithm for urban rail transit under network operation. J. Cent. South Univ. 2013, 20, 2897–2904. [Google Scholar] [CrossRef]
- Kato, H.; Kaneko, Y.; Inoue, M. Comparative analysis of transit assignment: Evidence from urban railway system in the Tokyo Metropolitan Area. Transportation 2010, 37, 775–799. [Google Scholar] [CrossRef]
- Shi, Z.B.; Zhang, N.; Liu, Y.; Xu, W. Exploring Spatiotemporal Variation in Hourly Metro Ridership at Station Level: The Influence of Built Environment and Topological Structure. Sustainability 2018, 10, 4564. [Google Scholar] [CrossRef] [Green Version]
- Li, S.Y.; Lyu, D.J.; Liu, X.P.; Tan, Z.Z.; Gao, F.; Huang, G.P.; Wu, Z.F. The varying patterns of rail transit ridership and their relationships with fine-scale built environment factors: Big data analytics from Guangzhou. Cities 2020, 99, 102580. [Google Scholar] [CrossRef]
- Wei, M.; Liu, Y.; Sigler, T.; Liu, X.Y.; Corcoran, J. The influence of weather conditions on adult transit ridership in the sub-tropics. Transp. Res. Part A-Policy Pract. 2019, 125, 106–118. [Google Scholar] [CrossRef]
- Kuby, M.; Barranda, A.; Upchurch, C. Factors Influencing Light-rail Station Boardings in the United States. Transp. Res. Part A-Policy Pract. 2004, 38, 223–247. [Google Scholar] [CrossRef]
- Singhal, A.; Kamga, C.; Yazici, M.A. Impact of weather on urban transit ridership. Transp. Res. Part A-Policy Pract. 2014, 69, 379–391. [Google Scholar] [CrossRef]
- Sohn, K.; Shim, H. Factors generating boardings at Metro stations in the Seoul metropolitan area. Cities 2010, 27, 358–368. [Google Scholar] [CrossRef]
- Gutiérrez, J.; Cardozo, O.D.; García-Palomares, J. Transit ridership forecasting at station level: An approach based on distance-decay weighted regression. J. Transp. Geogr. 2011, 19, 1081–1092. [Google Scholar] [CrossRef]
- Zhao, J.; Deng, W.; Zhu, Y. What influences Metro station ridership in China? Insights from Nanjing. Cities 2013, 35, 114–124. [Google Scholar] [CrossRef]
- Choi, J.; Lee, Y.J.; Kim, T.; Sohn, K. An analysis of Metro ridership at the station-to-station level in Seoul. Transportation 2012, 39, 705–722. [Google Scholar] [CrossRef]
- Chan, S.; Miranda-Moreno, L. A station-level ridership model for the metro network in Montreal, Quebec. CaJCE 2013, 40, 254–262. [Google Scholar] [CrossRef]
- Li, S.Y.; Lyu, D.J.; Huang, G.P.; Zhang, X.H.; Gao, F.; Chen, Y.T.; Liu, X.P. Spatially varying impacts of built environment factors on rail transit ridership at station level: A case study in Guangzhou, China. J. Transp. Geogr. 2020, 82, 102631. [Google Scholar] [CrossRef]
- Lee, S.; Yi, C.; Hong, S.-P. Urban structural hierarchy and the relationship between the ridership of the Seoul Metropolitan Subway and the land-use pattern of the station areas. Cities 2013, 35, 69–77. [Google Scholar] [CrossRef]
- Spiess, H.; Florian, M. Optimal strategies: A new assignment model for transit networks. Transp. Res. Part B-Methodol. 1989, 23, 83–102. [Google Scholar] [CrossRef]
- Seaton, K.; Hackett, L. Stations, trains and small-world networks. Phys. A 2004, 339, 635–644. [Google Scholar] [CrossRef] [Green Version]
- Sen, P.; Dasgupta, S.; Chatterjee, A.; Sreeram, P.A.; Mukherjee, G.; Manna, S.S. Small-world properties of the Indian railway network. Phys. Rev. E 2003, 67, 1–5. [Google Scholar] [CrossRef] [Green Version]
- Croce, A.I.; Musolino, G.; Rindone, C.; Vitetta, A. Route and Path Choices of Freight Vehicles: A Case Study with Floating Car Data. Sustainability 2020, 12, 8557. [Google Scholar] [CrossRef]
- Birgillito, G.; Rindone, C.; Vitetta, A. Passenger Mobility in a Discontinuous Space: Modelling Access/Egress to Maritime Barrier in a Case Study. J. Adv. Transp. 2018, 2018, 1–13. [Google Scholar] [CrossRef]


| Name of Stations | Node Degree |
|---|---|
| Taifeng Road | 44 |
| Nanjing Railway Station | 53 |
| Xinjiekou | 51 |
| Daxinggong | 53 |
| Yuantong | 38 |
| Andemen | 39 |
| Nanjing South Railway Station | 61 |
Publisher’s Note: MDPI stays neutral with regard to jurisdictional claims in published maps and institutional affiliations. |
© 2021 by the authors. Licensee MDPI, Basel, Switzerland. This article is an open access article distributed under the terms and conditions of the Creative Commons Attribution (CC BY) license (https://creativecommons.org/licenses/by/4.0/).
Share and Cite
Zhu, Z.; Zeng, J.; Gong, X.; He, Y.; Qiu, S. Analyzing Influencing Factors of Transfer Passenger Flow of Urban Rail Transit: A New Approach Based on Nested Logit Model Considering Transfer Choices. Int. J. Environ. Res. Public Health 2021, 18, 8462. https://doi.org/10.3390/ijerph18168462
Zhu Z, Zeng J, Gong X, He Y, Qiu S. Analyzing Influencing Factors of Transfer Passenger Flow of Urban Rail Transit: A New Approach Based on Nested Logit Model Considering Transfer Choices. International Journal of Environmental Research and Public Health. 2021; 18(16):8462. https://doi.org/10.3390/ijerph18168462
Chicago/Turabian StyleZhu, Zhenjun, Jun Zeng, Xiaolin Gong, Yudong He, and Shucheng Qiu. 2021. "Analyzing Influencing Factors of Transfer Passenger Flow of Urban Rail Transit: A New Approach Based on Nested Logit Model Considering Transfer Choices" International Journal of Environmental Research and Public Health 18, no. 16: 8462. https://doi.org/10.3390/ijerph18168462