
Using a Naturalistic Store Laboratory for Clinical Trials of Point-of-Sale Nutrition Policies and Interventions: A Feasibility and Validation Study

 , , ,
, , ,
Abstract
:1. Introduction
2. Materials and Methods
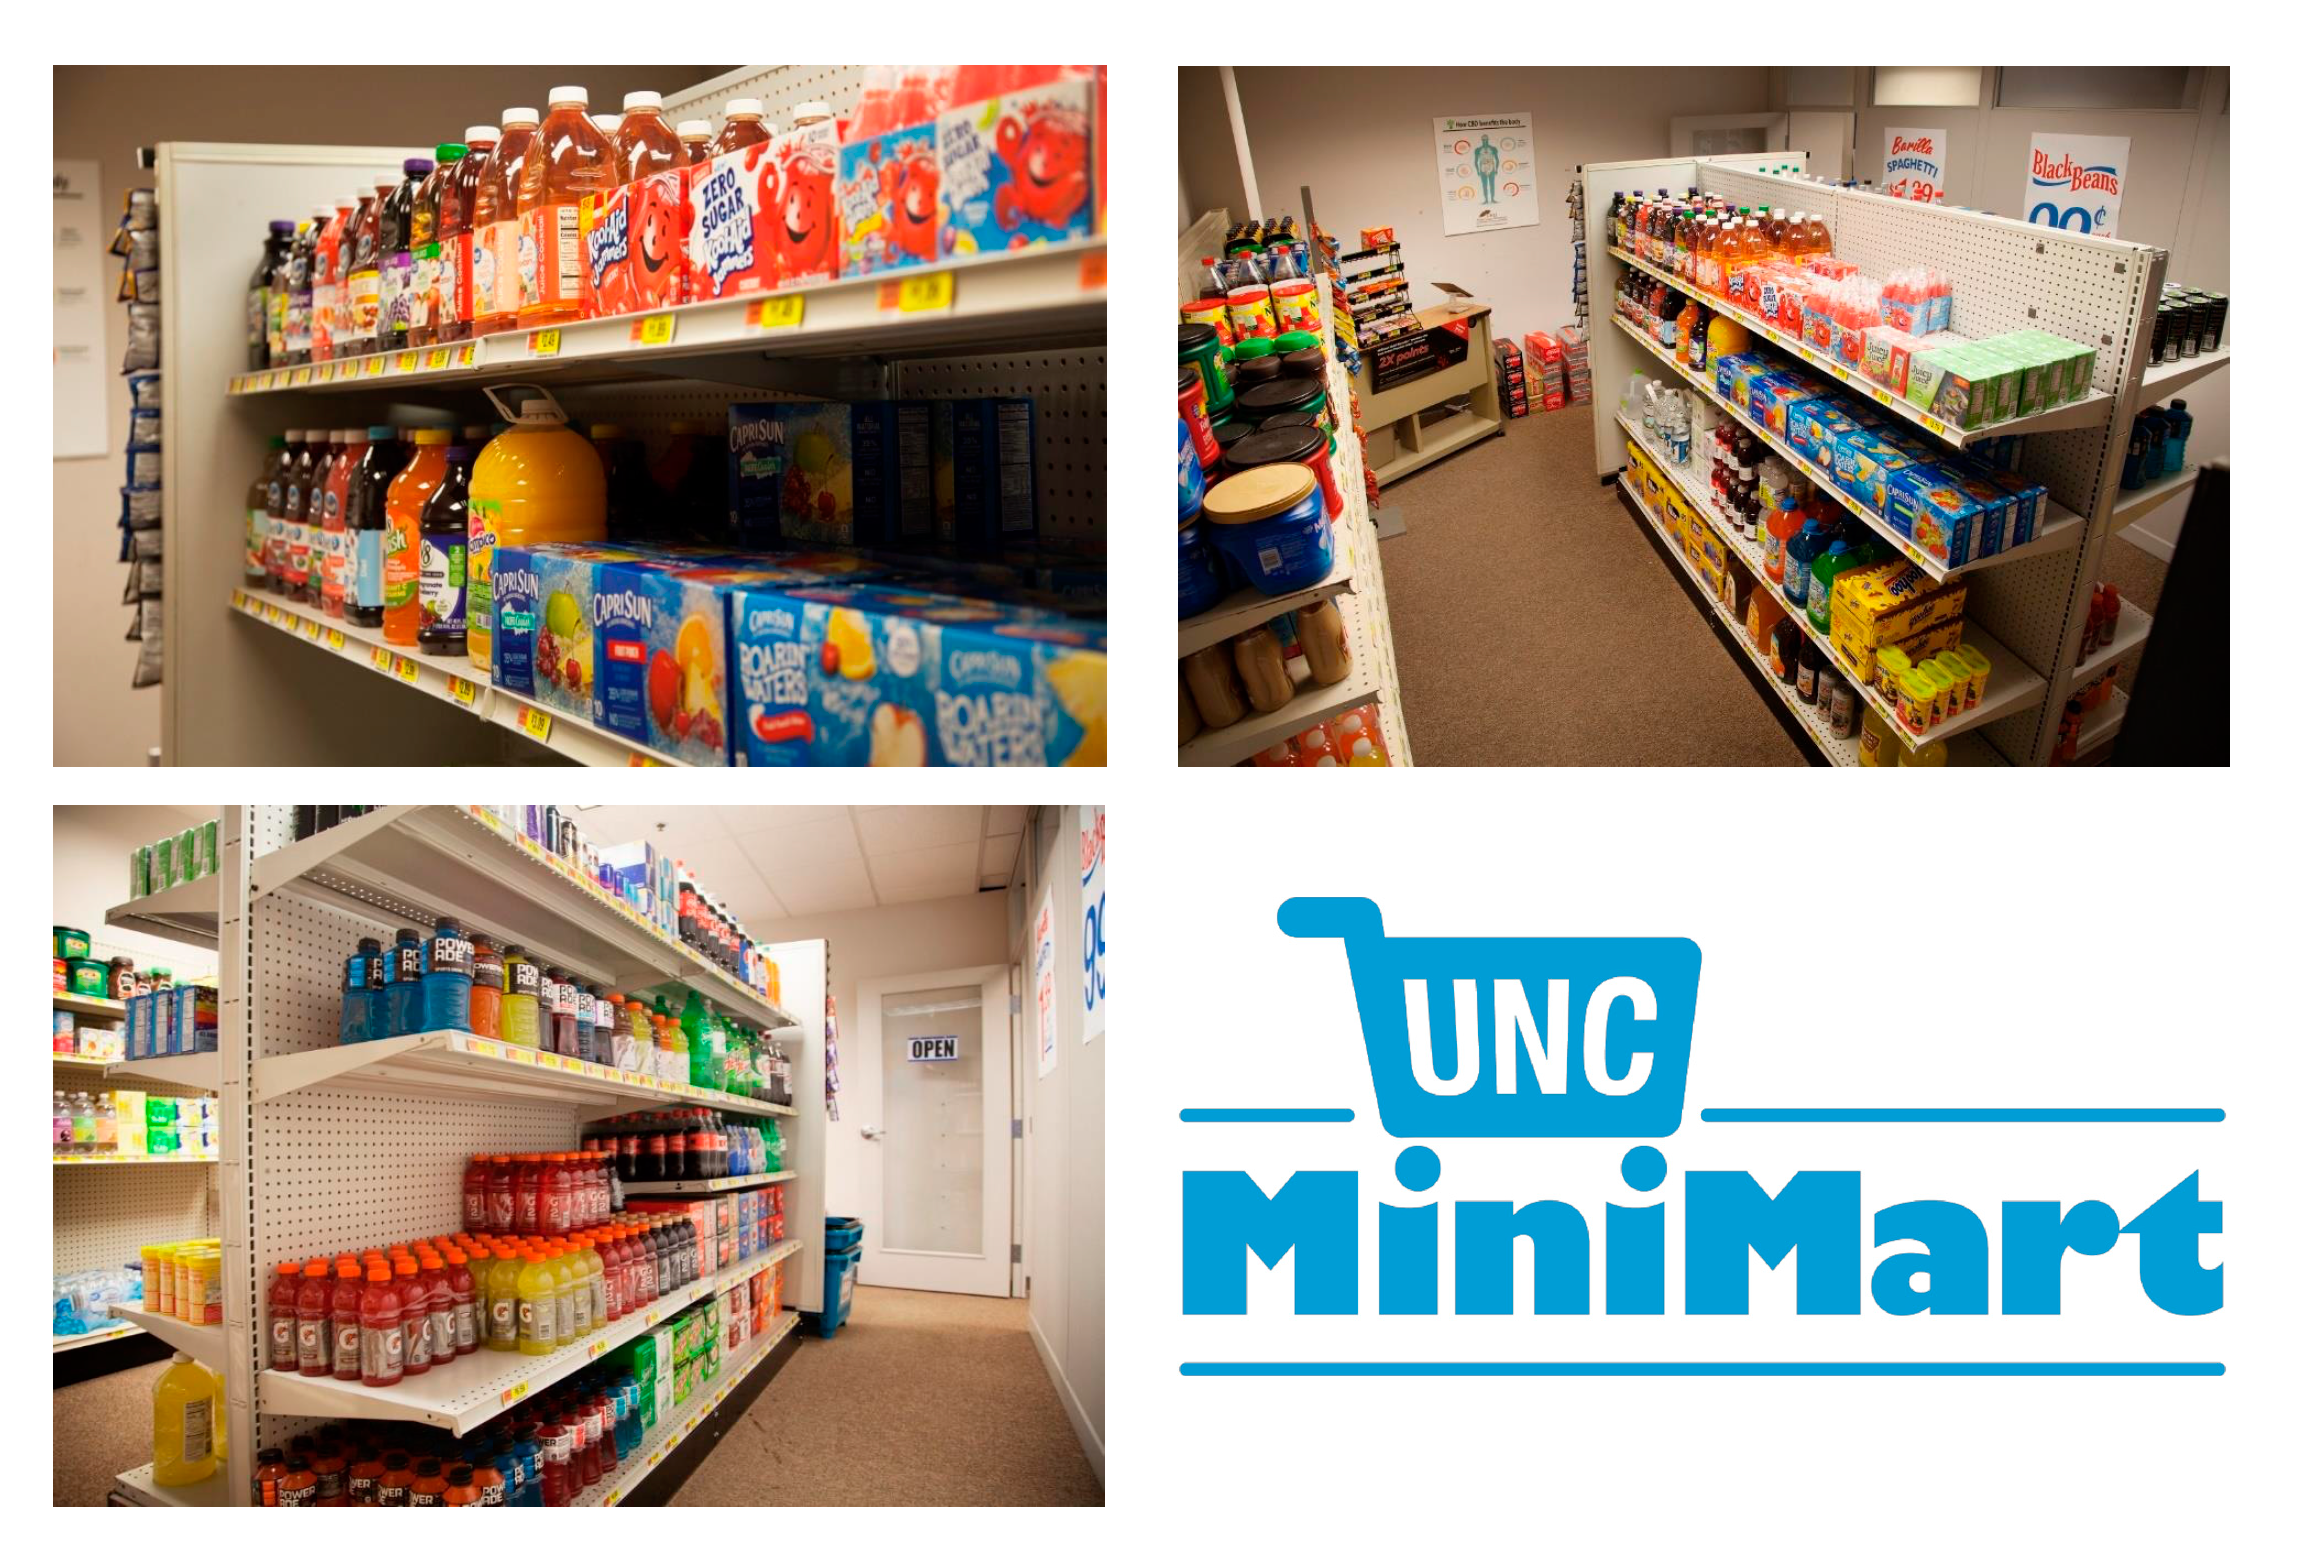
2.1. Store Development
2.2. Study Protocol
2.3. Receipt Collection
2.4. Shopping Task and Survey
2.5. Measures
2.6. Analysis
3. Results
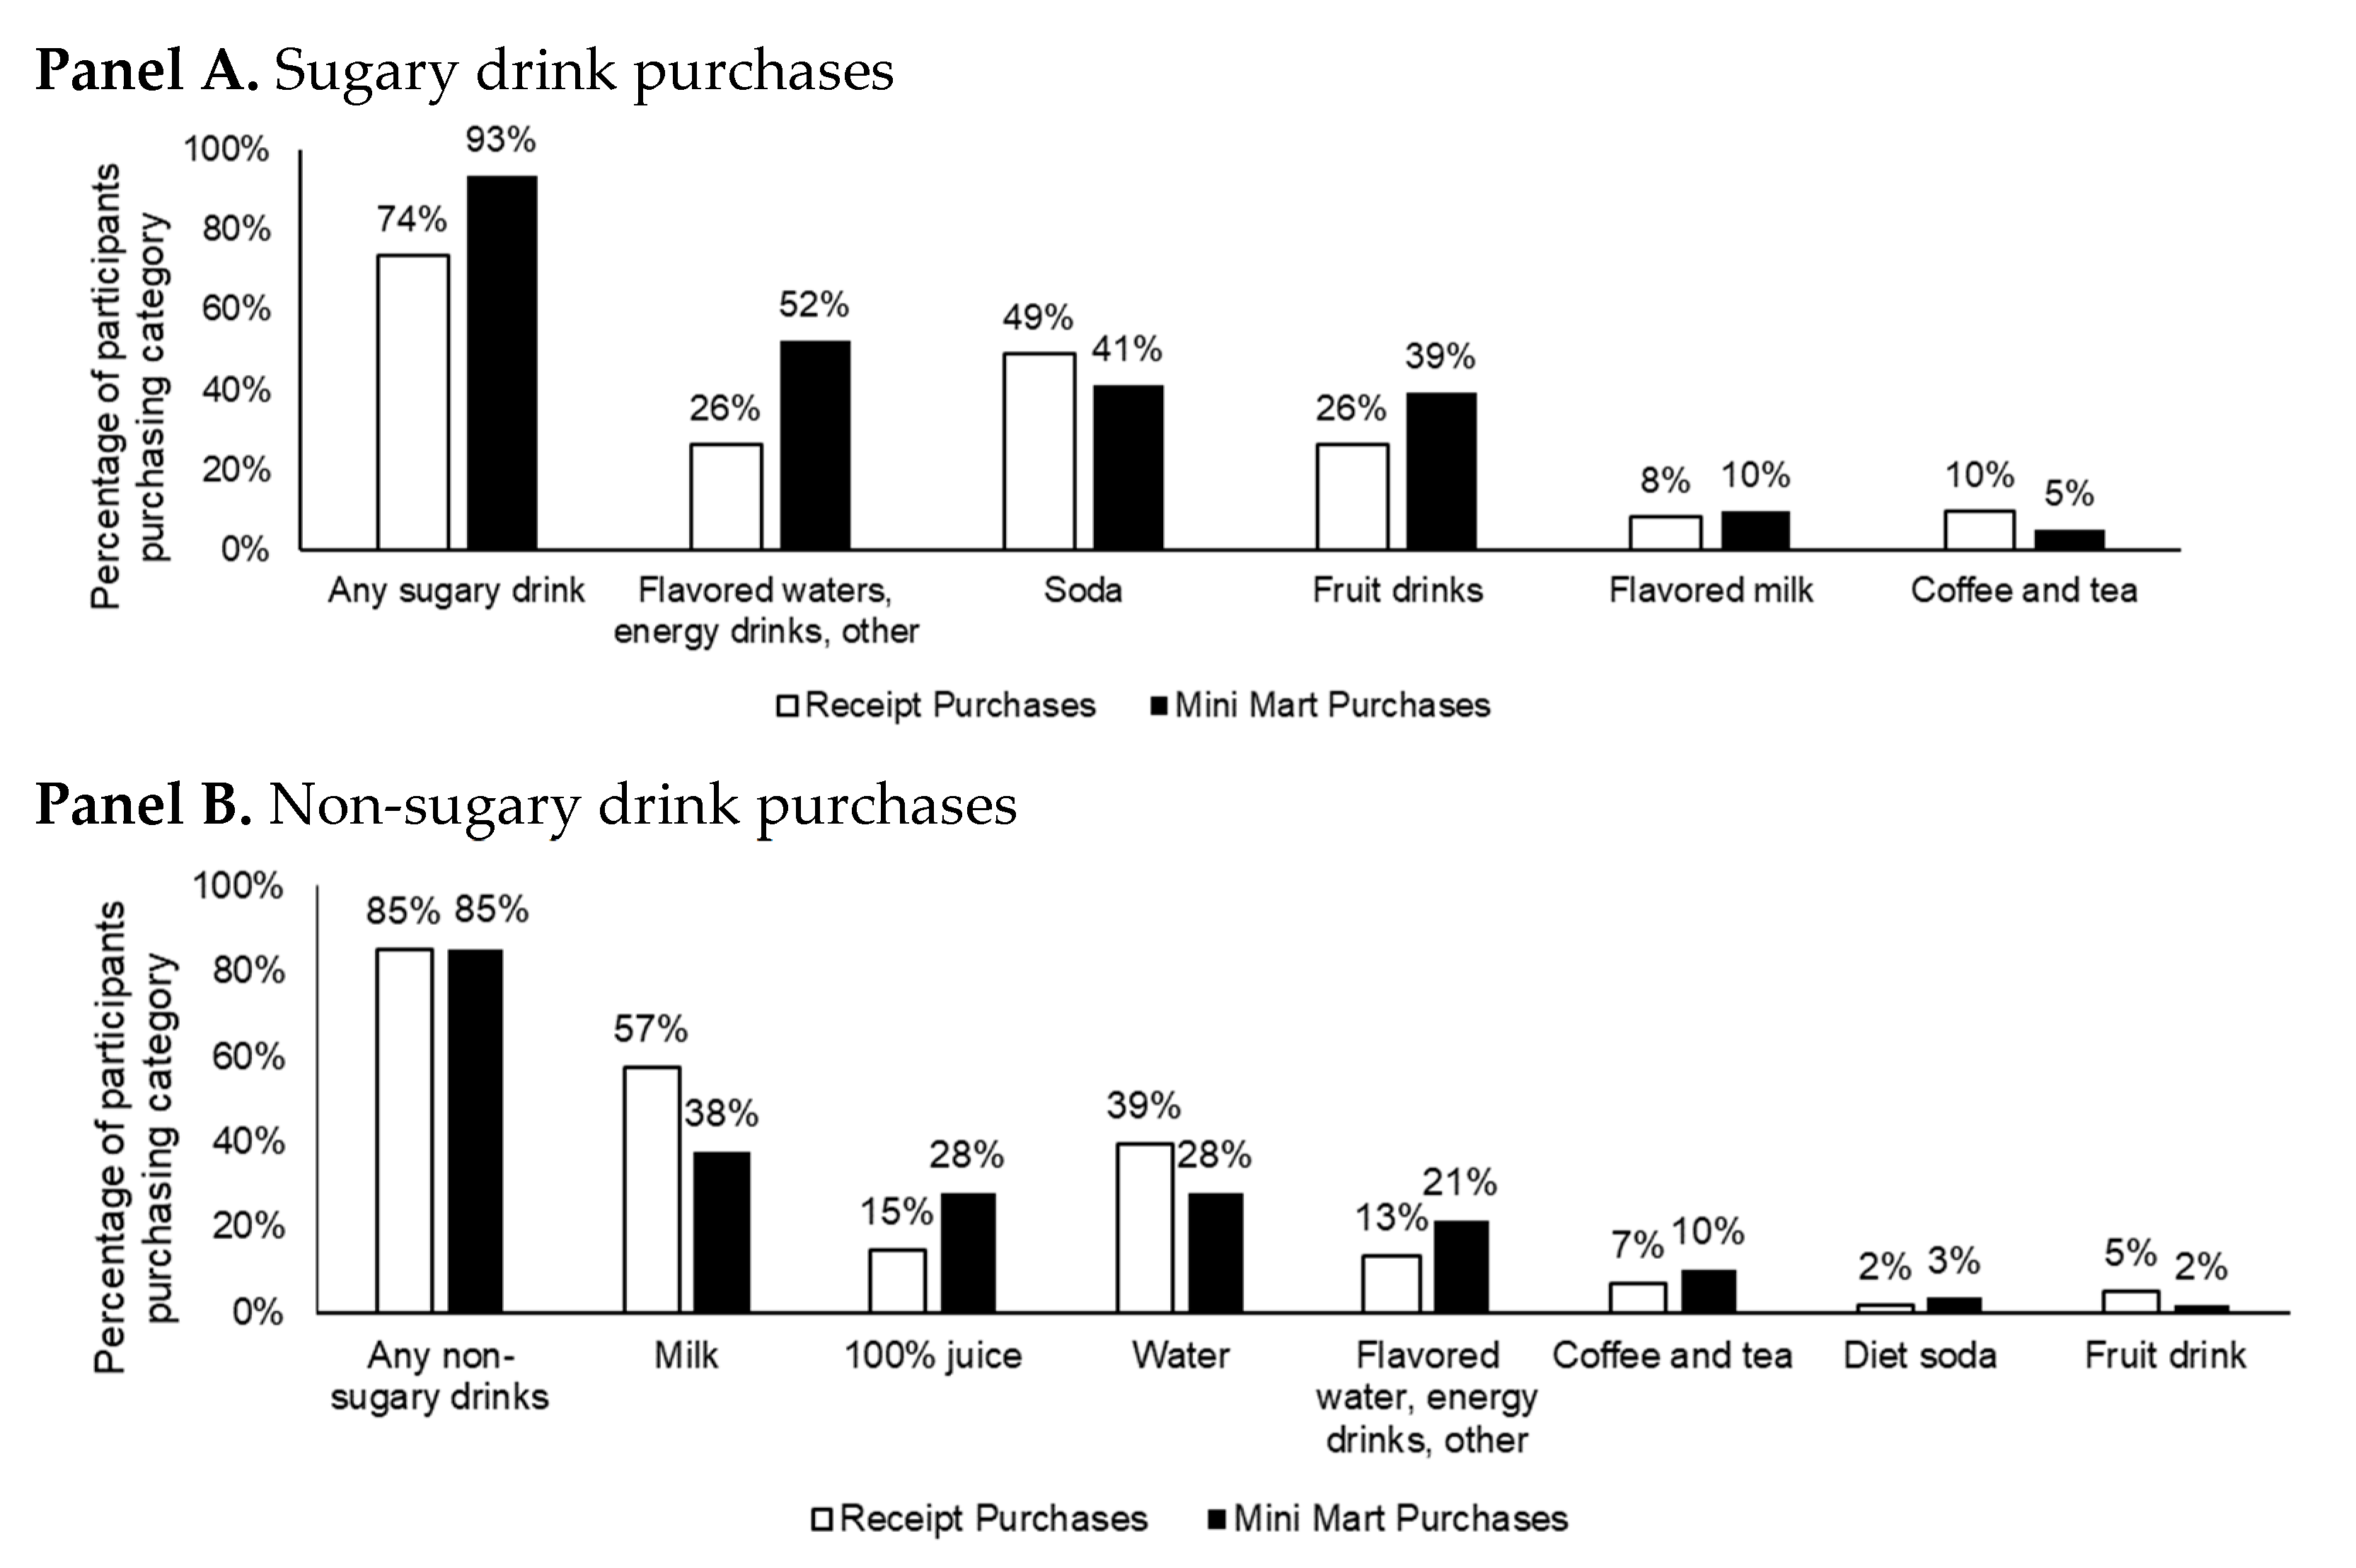
3.1. Validation
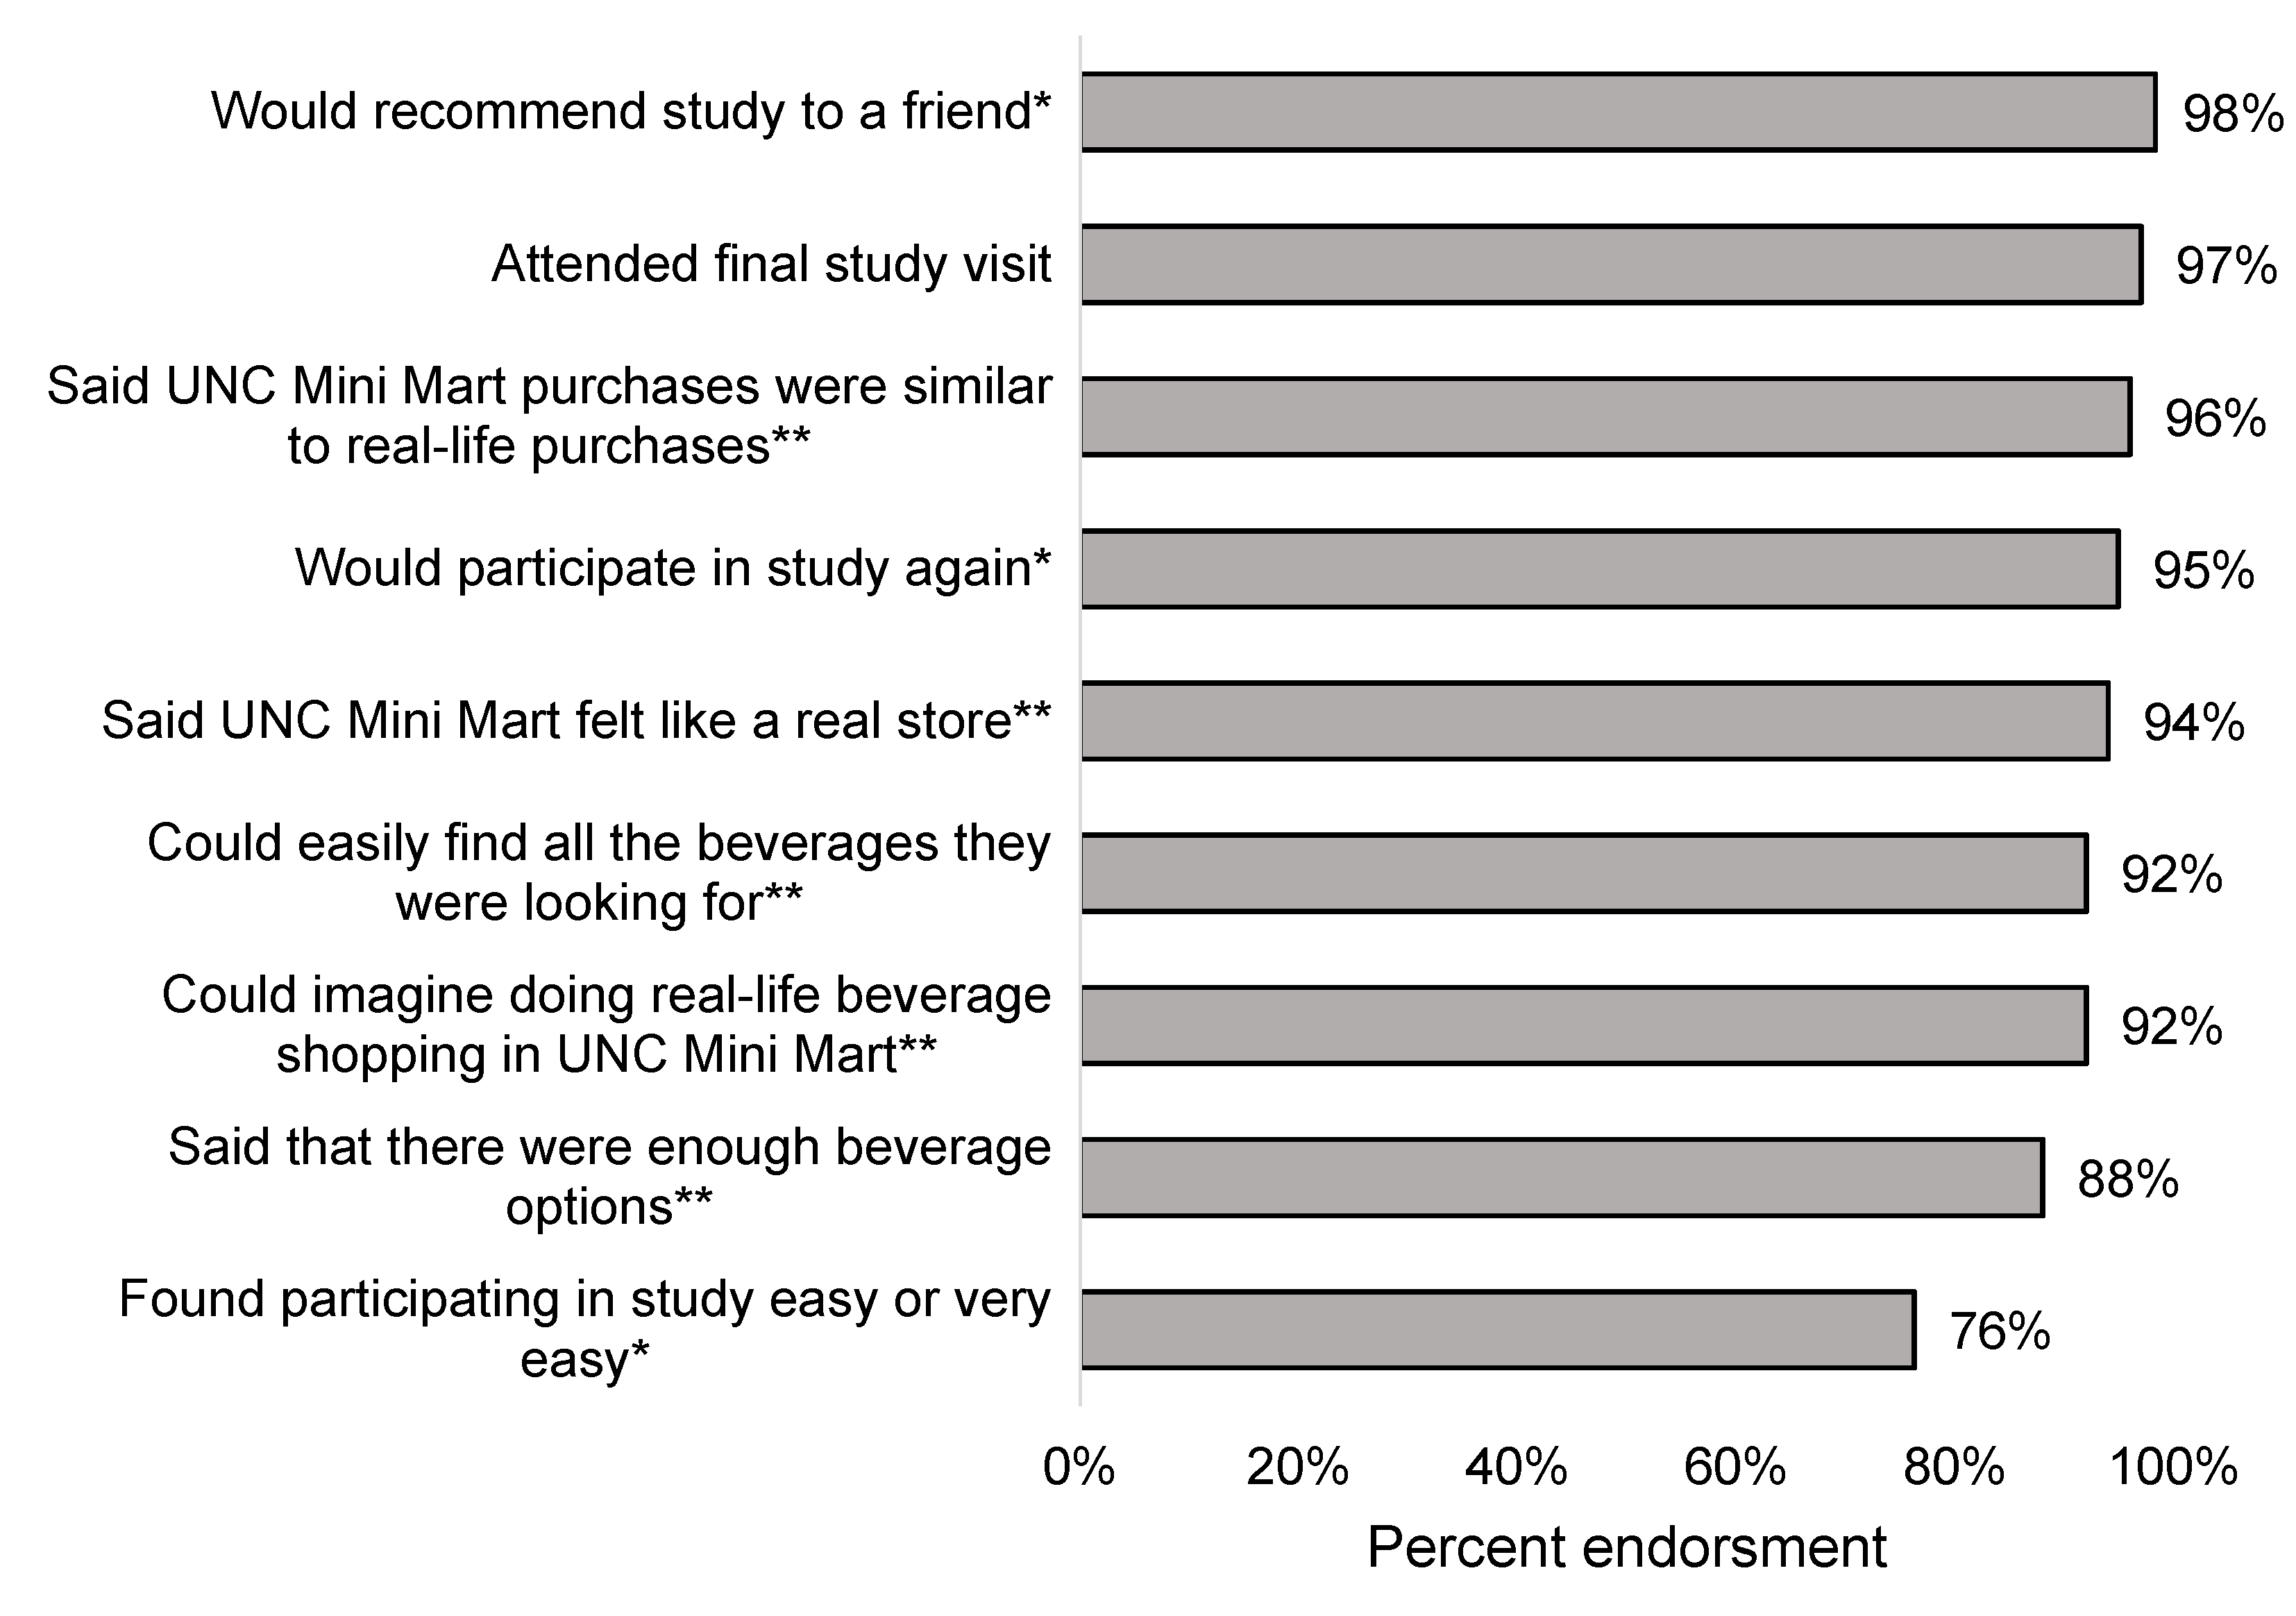
3.2. Process Measures
4. Discussion
5. Conclusions
Supplementary Materials
Author Contributions
Funding
Institutional Review Board Statement
Informed Consent Statement
Data Availability Statement
Acknowledgments
Conflicts of Interest
References
- World Health Organization. WHO Global Report: Mortality Attributable to Tobacco; World Health Organization: Geneva, Switzerland, 2012. [Google Scholar]
- Health effects of dietary risks in 195 countries, 1990–2017: A systematic analysis for the Global Burden of Disease Study 2017. Lancet 2019, 393, 1958–1972. [CrossRef] [Green Version]
- Rehm, J.; Shield, K.D. Alcohol and mortality: Global alcohol-attributable deaths from cancer, liver cirrhosis, and injury in 2010. Alcohol Res. Curr. Rev. 2014, 35, 174. [Google Scholar]
- Batis, C.; Rivera, J.A.; Popkin, B.M.; Taillie, L.S. First-Year Evaluation of Mexico’s Tax on Nonessential Energy-Dense Foods: An Observational Study. PLoS Med. 2016, 13, e1002057. [Google Scholar] [CrossRef] [Green Version]
- Colchero, M.A.; Popkin, B.M.; Rivera, J.A.; Ng, S.W. Beverage purchases from stores in Mexico under the excise tax on sugar sweetened beverages: Observational study. BMJ 2016, 352, h6704. [Google Scholar] [CrossRef] [Green Version]
- Powell, L.M.; Leider, J. The impact of Seattle’s Sweetened Beverage Tax on beverage prices and volume sold. Econ. Hum. Biol. 2020, 37, 100856. [Google Scholar] [CrossRef]
- Teng, A.M.; Jones, A.C.; Mizdrak, A.; Signal, L.; Genç, M.; Wilson, N. Impact of sugar-sweetened beverage taxes on purchases and dietary intake: Systematic review and meta-analysis. Obes. Rev. 2019, 20, 1187–1204. [Google Scholar] [CrossRef]
- Mediano Stoltze, F.; Reyes, M.; Taillie, L.S.; Correa, T.; Corvalán, C.; Carpentier, F.R.D. Prevalence of Child-Directed Marketing on Breakfast Cereal Packages before and after Chile’s Food Marketing Law: A Pre- and Post-Quantitative Content Analysis. Int. J. Environ. Res. Public Health 2019, 16, 4501. [Google Scholar] [CrossRef] [PubMed] [Green Version]
- Taillie, L.S.; Reyes, M.; Colchero, M.A.; Popkin, B.; Corvalan, C. An evaluation of Chile’s Law of Food Labeling and Advertising on sugar-sweetened beverage purchases from 2015 to 2017: A before-and-after study. PLoS Med. 2020, 17, e1003015. [Google Scholar] [CrossRef]
- Grummon, A.H.; Hall, M.G. Sugary drink warnings: A meta-analysis of experimental studies. PLoS Med. 2020, 17, e1003120. [Google Scholar] [CrossRef]
- Clarke, N.; Pechey, E.; Kosīte, D.; König, L.M.; Mantzari, E.; Blackwell, A.K.M.; Marteau, T.M.; Hollands, G.J. Impact of Health Warning Labels on Selection and Consumption of Food and Alcohol Products: Systematic Review with Meta-analysis. Health Psychol. Rev. 2020, 1–39. [Google Scholar] [CrossRef]
- An, R.; Liu, J.; Liu, R.; Barker, A.R.; Figueroa, R.B.; McBride, T.D. Impact of Sugar-Sweetened Beverage Warning Labels on Consumer Behaviors: A Systematic Review and Meta-Analysis. Am. J. Prev. Med. 2021, 60, 115–126. [Google Scholar] [CrossRef]
- Shadish, W.R.; Cook, T.D.; Campbell, D.T. Experimental and Quasi-Experimental Designs for Generalized Causal Inference; Cengage Learning: Boston, MA, USA, 2002. [Google Scholar]
- Kaur, A.; Scarborough, P.; Rayner, M. A systematic review, and meta-analyses, of the impact of health-related claims on dietary choices. Int. J. Behav. Nutr. Phys. Act. 2017, 14, 93. [Google Scholar] [CrossRef]
- Hall, M.G.; Lazard, A.J.; Grummon, A.H.; Higgins, I.C.A.; Bercholz, M.; Richter, A.P.C.; Taillie, L.S. Designing warnings for sugary drinks: A randomized experiment with Latino parents and non-Latino parents. Prev. Med. 2021, 148, 106562. [Google Scholar] [CrossRef]
- Noar, S.M.; Hall, M.G.; Francis, D.B.; Ribisl, K.M.; Pepper, J.K.; Brewer, N.T. Pictorial cigarette pack warnings: A meta-analysis of experimental studies. Tob. Control 2016, 25, 341–354. [Google Scholar] [CrossRef]
- Sheeran, P.; Webb, T.L. The intention–behavior gap. Soc. Personal. Psychol. Compass 2016, 10, 503–518. [Google Scholar] [CrossRef]
- Webb, T.L.; Sheeran, P. Does changing behavioral intentions engender behavior change? A meta-analysis of the experimental evidence. Psychol. Bull. 2006, 132, 249–268. [Google Scholar] [CrossRef] [PubMed] [Green Version]
- DeVellis, R.F. Scale Development: Theory and Applications; Sage publications: Newcastle upon Tyne, UK, 2016; Volume 26, ISBN 1-5063-4155-1. [Google Scholar]
- Grummon, A.H.; Taillie, L.S.; Golden, S.D.; Hall, M.G.; Ranney, L.M.; Brewer, N.T. Sugar-Sweetened Beverage Health Warnings and Purchases: A Randomized Controlled Trial. Am. J. Prev. Med. 2019, 57, 601–610. [Google Scholar] [CrossRef] [PubMed]
- Shadel, W.G.; Martino, S.C.; Setodji, C.M.; Scharf, D.M.; Kusuke, D.; Sicker, A.; Gong, M. Hiding the tobacco power wall reduces cigarette smoking risk in adolescents: Using an experimental convenience store to assess tobacco regulatory options at retail point-of-sale. Tob. Control 2016, 25, 679–684. [Google Scholar] [CrossRef] [PubMed] [Green Version]
- Shadel, W.G.; Martino, S.C.; Setodji, C.; Dunbar, M.; Kusuke, D.; Lanna, S.; Meyer, A. Placing antismoking graphic warning posters at retail point-of-sale locations increases some adolescents’ susceptibility to future smoking. Nicotine Tob. Res. 2019, 21, 220–226. [Google Scholar] [CrossRef] [PubMed]
- Clarke, N.; Blackwell, A.K.M.; De-Loyde, K.; Pechey, E.; Hobson, A.; Pilling, M.; Morris, R.W.; Marteau, T.M.; Hollands, G.J. Health warning labels and alcohol selection: A randomised controlled experiment in a naturalistic shopping laboratory. Addiction 2021. [Google Scholar] [CrossRef]
- Bleich, S.N.; Vercammen, K.A.; Koma, J.W.; Li, Z. Trends in beverage consumption among children and adults, 2003–2014. Obes. Silver Spring 2018, 26, 432–441. [Google Scholar] [CrossRef] [PubMed]
- Ogden, C.L.; Kit, B.K.; Carroll, M.D.; Park, S. Consumption of sugar drinks in the United States, 2005–2008. NCHS Data Brief 2011, 71, 1–8. [Google Scholar]
- Han, E.; Powell, L.M. Consumption patterns of sugar-sweetened beverages in the United States. J. Acad. Nutr. Diet 2013, 113, 43–53. [Google Scholar] [CrossRef] [PubMed] [Green Version]
- Malik, V.S.; Popkin, B.M.; Bray, G.A.; Despres, J.P.; Hu, F.B. Sugar-sweetened beverages, obesity, type 2 diabetes mellitus, and cardiovascular disease risk. Circulation 2010, 121, 1356–1364. [Google Scholar] [CrossRef]
- Hedrick, V.E.; Savla, J.; Comber, D.L.; Flack, K.D.; Estabrooks, P.A.; Nsiah-Kumi, P.A.; Ortmeier, S.; Davy, B.M. Development of a brief questionnaire to assess habitual beverage intake (BEVQ-15): Sugar-sweetened beverages and total beverage energy intake. J. Acad. Nutr. Diet. 2012, 112, 840–849. [Google Scholar] [CrossRef] [PubMed] [Green Version]
- Mendel, J.R.; Hall, M.G.; Baig, S.A.; Jeong, M.; Brewer, N.T. Placing health warnings on e-cigarettes: A standardized protocol. Int. J. Environ. Res. Public Health 2018, 15, 1578. [Google Scholar] [CrossRef] [Green Version]
- Brewer, N.T.; Hall, M.G.; Lee, J.G.; Peebles, K.; Noar, S.M.; Ribisl, K.M. Testing warning messages on smokers’ cigarette packages: A standardised protocol. Tob. Control 2015, 25, 153–159. [Google Scholar] [CrossRef]
- Burns, C.; Cook, K.; Mavoa, H. Role of expendable income and price in food choice by low income families. Appetite 2013, 71, 209–217. [Google Scholar] [CrossRef]
- Nederkoorn, C.; Havermans, R.C.; Giesen, J.C.; Jansen, A. High tax on high energy dense foods and its effects on the purchase of calories in a supermarket. An experiment. Appetite 2011, 56, 760–765. [Google Scholar] [CrossRef]
- French, S.A.; Wall, M.; Mitchell, N.R.; Shimotsu, S.T.; Welsh, E. Annotated receipts capture household food purchases from a broad range of sources. Int. J. Behav. Nutr. Phys. Act. 2009, 6, 37. [Google Scholar] [CrossRef] [Green Version]
- Desai, M. Recruitment and retention of participants in clinical studies: Critical issues and challenges. Perspect Clin. Res. 2020, 11, 51–53. [Google Scholar] [CrossRef]
- Fewtrell, M.S.; Kennedy, K.; Singhal, A.; Martin, R.M.; Ness, A.; Hadders-Algra, M.; Koletzko, B.; Lucas, A. How much loss to follow-up is acceptable in long-term randomised trials and prospective studies? Arch. Child 2008, 93, 458–461. [Google Scholar] [CrossRef] [PubMed] [Green Version]
- Brewer, N.T.; Jeong, M.; Mendel, J.R.; Hall, M.G.; Zhang, D.; Parada, H., Jr.; Boynton, M.H.; Noar, S.M.; Baig, S.A.; Morgan, J.C.; et al. Cigarette pack messages about toxic chemicals: A randomised clinical trial. Tob. Control 2019, 28, 74–80. [Google Scholar] [CrossRef] [PubMed]
- Brewer, N.T.; Hall, M.G.; Noar, S.M.; Parada Jr, H.; Stein-Seroussi, A.; Bach, L.E.; Hanley, S.; Ribisl, K.M. Effect of pictorial cigarette pack warnings on changes in smoking behavior: A randomized clinical trial. JAMA Intern. Med. 2016, 176, 905–912. [Google Scholar] [CrossRef] [PubMed]
- Kim, A.E.; Nonnemaker, J.M.; Loomis, B.R.; Shafer, P.R.; Shaikh, A.; Hill, E.; Holloway, J.W.; Farrelly, M.C. Influence of point-of-sale tobacco displays and graphic health warning signs on adults: Evidence from a virtual store experimental study. Am. J. Public Health 2014, 104, 888–895. [Google Scholar] [CrossRef] [PubMed]
- Blitstein, J.L.; Guthrie, J.F.; Rains, C. Low-Income Parents’ Use of Front-of-Package Nutrition Labels in a Virtual Supermarket. J. Nutr. Educ. Behav. 2020, 52, 850–858. [Google Scholar] [CrossRef]
- Jáuregui, A.; Vargas-Meza, J.; Nieto, C.; Contreras-Manzano, A.; Alejandro, N.Z.; Tolentino-Mayo, L.; Hall, M.G.; Barquera, S. Impact of front-of-pack nutrition labels on consumer purchasing intentions: A randomized experiment in low- and middle-income Mexican adults. BMC Public Health 2020, 20, 463. [Google Scholar] [CrossRef]
- Rummo, P.E.; Higgins, I.; Chauvenet, C.; Vesely, A.; Jaacks, L.M.; Taillie, L. A Standardized Guide to Developing an Online Grocery Store for Testing Nutrition-Related Policies and Interventions in an Online Setting. Int. J. Environ. Res. Public. Health 2021, 18, 4527. [Google Scholar] [CrossRef]
- Gugliucci, V.; Machín, L.; Curutchet, M.R.; Ares, G. Do nutritional warnings encourage healthier choices on food ordering websites? An exploratory experimental study in Uruguay. Public Health Nutr. 2021, 1–5. [Google Scholar] [CrossRef]
- Redman, R. Nearly 80% of U.S. Consumers Shopped Online for Groceries since COVID-19 Outbreak. Available online: https://www.supermarketnews.com/online-retail/nearly-80-us-consumers-shopped-online-groceries-covid-19-outbreak (accessed on 16 July 2021).
- George, S.; Duran, N.; Norris, K. A systematic review of barriers and facilitators to minority research participation among African Americans, Latinos, Asian Americans, and Pacific Islanders. Am. J. Public Health 2014, 104, e16–e31. [Google Scholar] [CrossRef]
- Svensson, K.; Ramírez, O.F.; Peres, F.; Barnett, M.; Claudio, L. Socioeconomic determinants associated with willingness to participate in medical research among a diverse population. Contemp. Clin. Trials 2012, 33, 1197–1205. [Google Scholar] [CrossRef] [PubMed] [Green Version]


| n | % | |
|---|---|---|
| Cohort | ||
| Tax | 31 | 51% |
| Warning | 30 | 49% |
| Age | ||
| 18–29 years | 11 | 18% |
| 30–39 years | 31 | 51% |
| 40–49 years | 17 | 28% |
| 50+ years | 2 | 3% |
| Mean in years (SD) | 36.3 | 7.3 |
| Gender | ||
| Man | 1 | 2% |
| Woman | 57 | 98% |
| Educational attainment | ||
| Less than high school or GED | 22 | 39% |
| High school diploma or GED | 29 | 51% |
| Four-year college degree | 5 | 9% |
| Master’s degree or greater | 1 | 2% |
| State of health | ||
| Excellent, very good, or good | 33 | 54% |
| Fair or poor | 28 | 46% |
| Preferred language to speak at home | ||
| Mostly or only English | 4 | 7% |
| Mostly or only Spanish | 42 | 72% |
| Equally Spanish and English | 12 | 21% |
| Household income, annual | ||
| USD 0–24,999 | 46 | 75% |
| USD 25,000+ | 15 | 25% |
| Number of children in household (age 0–18) | ||
| One | 13 | 21% |
| Two | 32 | 52% |
| Three or more | 16 | 26% |
| Used SNAP in the last year | 20 | 33% |
| Used WIC in the last year | 17 | 28% |
| Average weekly spending on beverages | ||
| Less than USD 5 | 3 | 5% |
| USD 5–10 | 9 | 15% |
| USD 11–15 | 11 | 18% |
| USD 16–20 | 15 | 25% |
| USD 21–25 | 13 | 21% |
| More than USD 25 | 10 | 16% |
| Body mass index (BMI, kg/m2) | ||
| Underweight (<18.5) | 2 | 3% |
| Healthy weight (18.5–24.9) | 9 | 15% |
| Overweight (25.0–29.9) | 12 | 20% |
| Obese (>29.9) | 23 | 38% |
| Missing | 15 | 25% |
| Mean BMI (SD) | 30.9 | 9.6 |
| Language of Survey | ||
| English | 11 | 18% |
| Spanish | 50 | 82% |
Publisher’s Note: MDPI stays neutral with regard to jurisdictional claims in published maps and institutional affiliations. |
© 2021 by the authors. Licensee MDPI, Basel, Switzerland. This article is an open access article distributed under the terms and conditions of the Creative Commons Attribution (CC BY) license (https://creativecommons.org/licenses/by/4.0/).
Share and Cite
Hall, M.G.; Higgins, I.C.A.; Grummon, A.H.; Lazard, A.J.; Prestemon, C.E.; Sheldon, J.M.; Taillie, L.S. Using a Naturalistic Store Laboratory for Clinical Trials of Point-of-Sale Nutrition Policies and Interventions: A Feasibility and Validation Study. Int. J. Environ. Res. Public Health 2021, 18, 8764. https://doi.org/10.3390/ijerph18168764
Hall MG, Higgins ICA, Grummon AH, Lazard AJ, Prestemon CE, Sheldon JM, Taillie LS. Using a Naturalistic Store Laboratory for Clinical Trials of Point-of-Sale Nutrition Policies and Interventions: A Feasibility and Validation Study. International Journal of Environmental Research and Public Health. 2021; 18(16):8764. https://doi.org/10.3390/ijerph18168764
Chicago/Turabian StyleHall, Marissa G., Isabella C. A. Higgins, Anna H. Grummon, Allison J. Lazard, Carmen E. Prestemon, Jennifer Mendel Sheldon, and Lindsey Smith Taillie. 2021. "Using a Naturalistic Store Laboratory for Clinical Trials of Point-of-Sale Nutrition Policies and Interventions: A Feasibility and Validation Study" International Journal of Environmental Research and Public Health 18, no. 16: 8764. https://doi.org/10.3390/ijerph18168764
APA StyleHall, M. G., Higgins, I. C. A., Grummon, A. H., Lazard, A. J., Prestemon, C. E., Sheldon, J. M., & Taillie, L. S. (2021). Using a Naturalistic Store Laboratory for Clinical Trials of Point-of-Sale Nutrition Policies and Interventions: A Feasibility and Validation Study. International Journal of Environmental Research and Public Health, 18(16), 8764. https://doi.org/10.3390/ijerph18168764