Abstract
The number of fatalities in the construction industry is highest among all industries; thus, various losses in the form of fatalities in construction represent a significant factor for safety management. If a fatality occurs, it is important to estimate the overall loss, as a significant financial loss occurs for each project participant. However, in studies of the cost of accidents involving a fatality conducted abroad, the framework cannot be applied as it is because insurance types, systems, and legal cost systems differ by country. Therefore, we developed a framework for calculating the fatality loss considering various aspects of labor, industry, and regulations in Korea. This was done in four steps: (i) data collection and criteria selection; (ii) proposed framework development; (iii) conduct of questionnaire surveys for the case study; and (iv) analysis and evaluation of the case study. As a result of the data analysis after the case study of general construction companies, the total fatality loss was estimated to be 2,198,260 USD/person. The contributions of this study are the development of a framework composed of newly discovered items that can acquire reliable data in consideration of the properties of the construction industry.
1. Introduction
The construction industry is considered to be very important to the economies of most developed and developing countries, as construction is one of the key contributors to national economic growth [1,2,3,4]. For example, according to the Bureau of Economic Analysis (2020), approximately 4.5% (USD 6760 billion) of gross production (USD 151,268) in the United States occurs in the construction industry as of 2019 [5]. Additionally, Shohet et al. [6] reported that the construction industry currently employs 6–10% of the world’s workforce.
However, in 2019, the International Labor Organization (ILO) reported that there were approximately 2.8 million industrial accidents and incidences of work-related diseases worldwide per year [7]. In addition, it has been found that the safety performance of the construction industry is low [8] and that the accident rate is higher than those in other industries [9,10]. According to the Bureau of Labor Statistics (2020), among all other high-risk sectors in 2019, the number of fatalities in the construction industry was highest at 1061 (19.9% of the total number) [5]. High-risk sectors include agriculture, manufacturing, transportation, and warehousing, and related administrative and support facilities.
According to Sunindijo and Zou [11], fatalities in the construction industry account for about 30–40% among all industries. This stems from the characteristics of what is considered a dangerous industry; specifically, the construction industry has relatively low safety performance when considering injury rates [12,13,14]. Lee et al. [15] reported that the number of fatalities continues to increase, with construction sites now considered among the most dangerous workplaces. In addition, Ho [16] reported that the construction industry exhibited higher fatality and injury rates compared to other industries due to its unique characteristics. He described its unique characteristics as including the factors of unpredictable field conditions, various human behaviors, and unsafe working procedures.
Within the global situation, the construction industry in Korea has grown rapidly over the past several decades [17,18]. In relation to this, efforts have been made to construct infrastructure and residential facilities to accommodate the rapid expansion of major cities [19]. Therefore, Korea is also experiencing the highest levels of accidents in the construction industry, which is considered one of the most dangerous occupations due to the dynamic and temporary nature of these workplaces. For example, construction workers are characterized as those who constantly change their work locations depending on the project and project stage. In addition, the complex working conditions of construction sites and the range of characteristics of the various types of ongoing construction work produce results that are not standardized, unlike the factories that characterize the manufacturing and nuclear industries [20,21].
In particular, Choi et al. [17] reported that Korea’s fatality rate is higher than those in other countries, with that number being nearly ten times higher than that of the United Kingdom (UK). Based on a report published by Choi et al. [17], our research team reviewed the fatality rate, defining it as the number of fatalities per 100,000 full-time equivalent workers by accident (as of 2017) in 35 countries for which information can be obtained among Organization for Economic Cooperation and Development (OECD) member countries. As a result, the average fatality rate for all industries in 35 countries was 1.87; for the construction industry, the rate was 6.03 (3.22 times that for industries overall). On the other hand, the average for all industries in Korea was 3.61, with the construction industry having a rate of 25.45 (7.05 times the total industry). Therefore, the average for the entire Korean industry was 1.93 times higher than that of the OECD, and the average rate in the construction industry was 4.22 times higher [22]. As such, it was judged that certain characteristics exist that make the impact of accidents involving a fatality was greater than those involving injuries, especially in Korea [22]. In addition, most countries in the world as well as Korea use the index of the number of fatalities when evaluating the safety performance of a company or country [17]. Therefore, the review conducted here focused on fatalities excluding injuries [22].
Within this backdrop, the Korean government has instigated a campaign entitled “Reduce industrial fatal accidents by half until 2022” as a national initiative. Nevertheless, according to the Korea Occupational Safety and Health Agency (KOSHA), the number of fatalities among construction workers has levelled off since 2000. In 2018, the construction industry experienced the most fatalities, accounting for 49.95% of all industrial fatalities.
In this situation, it is very important to calculate fatality losses by considering various aspects of the construction industry because if an accident involving a fatality occurs, it causes serious confusion with regard to the balance of the work environment [23]. In the event of a fatality at work, a significant financial burden is placed on national health agencies, employers (people who have to fight productivity declines, reduced profits and investment opportunities), and on the affected employees (loss of wages and poor quality of life, etc.).
Research on accident costs was pioneered by Heinrich [24]. He categorized costs into direct and indirect costs and emphasized the importance of indirect costs [25]. In addition to these traditional classification methods, several researchers have suggested different types of accident costs according to the characteristics of the expense. Riel and Imbeau [26] classified health and safety costs into the three categories of insurance-related costs, work-related costs, and perturbation-related costs. Additionally, from this perspective, such expenses can be classified into quantifiable costs, irreducible costs, and intangible costs. Rikhardsson and Impgaard [27] categorized accident costs into time, materials and components, external services, and other costs to simplify the process for management.
However, because the contents of these various studies have typically focused on methodologies used abroad, there are many limitations when applied to Korea. This is true because the characteristics of the Korean construction industry are not considered. For example, some previous studies have quantitatively calculated the fatality loss by considering the cost of insurance [12,28]. However, there are certain characteristics unique to the construction industry in Korea compared to those in other countries [29,30]. The construction industry in Korea has a type of social insurance classified as a form of health insurance, a national pension service, and employment insurance [29]. Moreover, there are other types of insurance such as an industrial accident insurance and workers’ compensation insurance [30]. Specifically, industrial accident insurance includes medical care benefits, the temporary disability compensation benefits, survivor benefits, and a funeral service expense benefit in Korea. On the other hand, most domestic-based studies did not comprehensively consider the characteristics of the construction industry, and there is no case in which the delayed reimbursement cost, which is a large loss in the case of a fatality, was considered. In this study, insurance types, systems, and legal cost systems that are differentiated from other countries were defined as Korean construction characteristics. Given these characteristics of the construction industry in Korea, a framework to calculate the fatality loss that also considers them is necessary.
On the other hand, Gavious et al. [31] emphasized the need to acquire robust and quantifiable information that can conclusively demonstrate the actual cost in order to develop a reliable way to assess the cost of a workplace accident. Rikhardsson and Impgaard [27] argued that a simple methodological basis that could be used by business owners in a short period of time was needed. In addition, Brody et al. [32] states that it is important to find a simple way to assess reliable indirect costs to ensure the quality and accuracy of observations without discouraging the company.
Therefore, this study attempts to develop a useful framework to calculate the fatality loss while also taking into account the characteristics of the Korean construction industry, focusing on construction projects and using reliable information. To do this, the research was conducted in the following steps:
- (i)
- Data collection and criteria selection;
- (ii)
- Proposed framework development;
- (iii)
- Conduct of questionnaire surveys for the case study; and
- (iv)
- Analysis and evaluation of the case study.
In particular, items that are differentiated from previous studies in the proposed framework development stage are summarized below:
- Framework optimization by applying the characteristics of the construction industry;
- Selecting reliable items that can be obtained from construction companies;
- Discovering and applying new items related to loss costs (delay reimbursement cost, etc.); and
- Developing a framework for calculating comprehensive loss costs.
2. Literature Review
As shown in Table 1, a summary of the variety of studies conducted thus far in an effort to quantify accident losses caused by industrial accidents is as follows: (i) studies that derive and calculate the accident loss for all industries including the construction industry; and (ii) studies that derive the accident loss in the construction industry and calculate the value.

Table 1.
Results of the literature review.
First, for all industries including the construction industry, researchers have concentrated on deriving and calculating the fatality loss [23,27,33,34,35,36,37,38].
Lebeau et al. [33] quantified the costs of injuries and diseases in 26 industries in Quebec, Canada, from the perspective of the employer, worker, and community, taking into account the medical costs, funeral costs, and human costs. Among the employers, workers, and communities, workers were most responsible for the costs of injuries and diseases caused by industrial accidents. The construction industry was 15th out of 26 industrial groups incurring injury and disease costs due to industrial accidents. It was suggested that the results of the study could be helpful for those deciding the direction of research to prevent industrial accidents [33]. Leigh et al. [34] quantified the cost of injuries and illnesses in the United States in consideration of items such as medical care, lost productivity, and pain and suffering, and presented a ranking by industry. As a result of that study, the taxicab industry was the industry with the highest costs of injury and illness per worker. The authors suggested that their research results could serve as the basis for policy decisions by industry group [34]. Rikhardsson and Impgaard [27] developed a model for evaluating the costs borne by companies among occupational accident costs using a systematic accident cost analysis (SACA). Their developed model indicated that two-thirds of accident costs by the company were tangible expenses, with the other third being invisible expenses. The developed model can visualize the costs incurred by the company’s OHS department [27].
Additionally, Shalini [37] measured the accident cost of work in Mauritius, a small island country, considering the loss of productivity, medical costs, and safety investment costs. Through that study, it was confirmed that the cost of work-related accidents in a small developing country is higher than that in other countries [37]. Xiang et al. [38] conducted an analysis to determine whether there was a difference in injury costs due to industrial accidents between American workers and immigrant workers using data on compensation costs for industrial accidents. The probability of receiving treatment for immigrant workers in industrial accidents was 75.6%, and the probability of U.S. workers receiving treatment was 77.3%. In addition, it was confirmed that the average medical cost per injured worker was USD 2357 for U.S. workers and USD 2351 for immigrant workers [38].
The above-mentioned studies derived accident loss items for all industrial groups including the construction industry and quantified their values. However, unlike other industrial groups, in the event of an industrial accident, the construction industry incurs various additional costs such as short-term recovery costs, institutional penalties and fines, making it necessary to calculate the accident loss in consideration of the characteristics of the construction industry.
Second, for the construction industry, researchers have concentrated on deriving and calculating the fatality loss [39,40,41,42,43,44,45,46,47,48,49,50]. Allison et al. [39] quantified the cost of accidents in the Australian construction industry from the perspectives of employers, workers, and the government, taking into account the production disturbance costs, human capital costs, and medical costs. Their study found that employers paid the highest accident cost with a short absence, while the government paid the highest accident cost with a long absence [39]. Feng et al. [41] investigated the accident costs in the construction industry and determined how much it affected the metric known as the contract sum. As a result of their study, the average direct accident cost, indirect accident cost, and total accident cost accounted for 0.165%, 0.086%, and 0.25% of the contract sum, respectively. In addition, it was confirmed that the ratio of the average indirect accident cost and the average direct accident cost was 1:1.92 through the research results [41].
Gholizadeh and Esmaeili [43] quantified the accident cost of electrical work and verified through ANOVA that there was a difference in the accident cost according to the accident type, building type, and construction cost. As a result of that study, it was verified that there is a statistical difference between the accident cost according to the accident type and the accident cost according to the building and the building type. However, the difference in accident cost according to the construction cost was not verified [43]. Schoonover et al. [47] quantified the prevention index (PI) by type of construction and the severity of accidents through the cost of accident compensation claims of U.S. construction workers. In that study, it was confirmed that the ‘Foundation, structure, and building exterior contractor’ among all construction factors represented the highest cost in terms of both the PI and accident severity [47]. Waehrer et al. [50] presented fatality and injury costs by considering the direct and indirect costs that were not limited to workers’ compensation costs. As a result of their study, the cost per case of deaths and injuries in the construction industry was found to be USD 27,000, twice the average cost of industry overall [50].
As described above, previous studies have quantified the fractional cost item, not the overall cost item, for accident losses in the construction industry. In addition, it was judged that the reliability of the supporting data was insufficient for the quantified cost items overall. In addition, because previous studies defined cost items taking into consideration of the characteristic of each country, the cost items can be used for the construction industry in each respective country, but not outside it. However, although the specific characteristics of the Korean construction industry were not considered, it is believed that these limitations would arise when applying these items as they are.
3. Materials and Methods
Figure 1 shows the framework of this study carried out via the aforementioned four-step process.
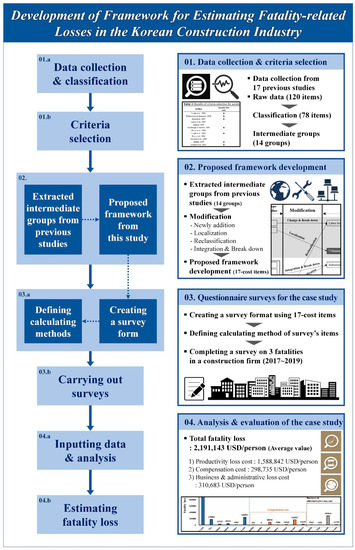
Figure 1.
Research framework.
In the first step, data related to fatality losses are collected from the literature review and then classified by content. Criteria for calculating the actual fatality loss value are selected through these classified groups.
As a second step, the intermediate groups in the previous research were derived based on the selected criteria. In order to consider the characteristics of the construction industry and calculate the fatality loss with high reliability, the proposed framework was developed by modifying the cost items of the intermediate groups in the previous research. To do this, focus group interviews were conducted with four different construction company experts in Korea. To select the four experts, an official letter related to the focus group interviews was sent to the safety-related teams of the top ten construction companies in Korea, requesting their participation. Focus group interviews were conducted with the four who accepted the invitation.
In the third step, the survey information was created based on the cost items of the proposed framework in this study. When creating the survey form, a method to quantify the fatality loss was prepared by defining the numerical relationship between the input data and the output data for each cost item. In this case, as a case study, the survey was tailored to large construction companies.
As a fourth step, after coding the survey results, the input data are analyzed through the calculation methods defined in this study. As a result of the data analysis in the case study, the average total costs related to a fatality loss (USD/person) can be estimated.
3.1. Data Collection and Criteria Selection
As the first task in the selection of the criteria used to calculate the fatality loss, previous studies dealing with accident loss were analyzed. Seventeen previous studies over the last two decades were found to be relevant to accident losses. Overall, 120 accident loss items were found initially, and 78 cost cases were organized after integrating similar cases. Here, it was possible to reduce the number to 78 items by integrating items with similar contents among the 120 data instances. To this end, the items were integrated by synthesizing keywords, categories, and meanings, and all 120 data items could be encompassed by the 78 items without excluding any data.
We grouped items that could be collected into the same category again. For example, we grouped the following eight items into one group: lost earnings, normal working time, wage cost, long-term disability, injured worker productivity losses, lost income, salary cost, and sick leave. In addition, the six items of consultants and legal support, intervention costs, legal fees, legal expenses, the cost of judicial proceedings, and costs arising from possible labor disputes were placed in the same group.
Subsequently, these intermediate groups were utilized as baseline criteria to establish the proposed framework of fatality loss. The final cost items in this study are presented in detail in Section 4.1.
3.2. Proposed Framework Development
The process of deriving the proposed framework in this study is as follows. First, the intermediate groups can be divided into three relatively broad ranges: the productivity loss cost, compensation cost, and business and administrative loss. The productivity loss cost consists of the income loss cost and the human cost, and the compensation cost includes the medical cost, medical leave wages, survivor’s benefits, the funeral cost, the compensation cost, time and productivity loss, material loss, and financial loss. In addition, the business and administrative loss cost consists of the intervention cost, penalty, fine, and administrative loss cost.
However, these intermediate groups are insufficient to calculate the fatality loss reliably, which is the goal of this study. In this case, it is uniquely necessary to calculate the criteria considering the characteristics of the Korean construction industry. Second, different countries may have different compensation systems for different accidents. Thus, institutional penalties that can affect the fatality loss in the construction industry may vary depending on the country.
Therefore, the necessity of deriving a feasible framework to obtain reliable data considering the characteristics of the Korean construction industry was raised. To realize this, focus group interviews were conducted with Korean construction safety experts. When selecting the safety experts, we considered that they should have 15 years of experience on safety-related teams at different construction companies and that they should hold the position of manager or higher. Based on this, the intermediate groups pertaining to fatality loss were revised in the following way. The items of the proposed framework considering the above are summarized below.
- Added: Social insurance (health insurance, national insurance, employment insurance), workers’ compensation insurance, delay reimbursement costs;
- Change and break down: labor loss cost (income loss cost, tax, social insurance);
- Localization: human cost, administrative loss cost;
- Reclassification: labor loss cost, industrial accident insurance; and
- Integration and breakdown: industrial accident insurance (medical care benefits, temporary disability compensation benefits, survivor benefits, funeral service expenses), others (e.g., time loss, material loss), legal fees (penalties, fines).
In conclusion, the proposed framework for estimating the fatality loss value in construction was reorganized by 17-cost items.
3.3. Conduct of Questionnaire Surveys for the Case Study
A questionnaire survey for the case study was utilized to apply the proposed framework. Table 2 summarizes the required information for the survey based on the proposed framework. The hierarchy of the required information is mainly divided into three tiers.
Table 2.
Information for survey based on the proposed framework.
The first tier contains information about the construction company, with seven questions. The second tier accounts for accident information, with nine questions, and the third tier has items about the cost of the loss resulting from the occurrence of a fatality. It consists of a total of ten questions and covers industrial accident insurance.
In order to increase the reliability of the survey, the final survey format was completed after several revisions were made through focus group interviews with several experts at a Korean construction company.
After completing the questionnaire survey format, the questionnaire survey was applied in the case studies with the proposed framework. We presented the questionnaire survey to the general contractor (hereafter the ‘company’) to obtain information on the cost items and fatalities. The companies selected were in the top ten groups based on sales in the Korean construction industry and thus offer representativeness with regard to the questionnaire survey target. The questionnaire survey response rate was calculated using the number of companies that answered the questionnaire survey. The questionnaire survey was conducted at one company, and that company responded to the questionnaire survey (response rate: 100%). A total of three fatal accidents occurred at the company over three years (2017 to 2019). The target company is considered to be representative because the fatality rate for the company among the top ten construction companies in Korea was most similar to that of the Korean construction industry regarding the number of fatalities per 100,000 full-time equivalent workers by accident.
3.4. Analysis and Evaluation of the Case Study
After collecting the results of the questionnaire, they were evaluated and the case study proceeded. Table 3 shows the calculation method for the 17 cost items pertaining to fatality loss. Each cost item was analyzed using the three aforementioned tiers. Some cost items were obtained through the survey directly. Others can be calculated using national statistical data. The other cost items were calculated by the proposed method using raw data from the survey. For the calculation method, nine cost items were obtained through the survey, one cost item was calculated using statistical data, and seven cost items were calculated using data from the survey.
Table 3.
Analysis methods of cost items on fatality loss.
First, cost items such as medical care benefits, temporary disability, compensation benefits, survivor’s benefits, funeral service expense, workers’ compensation insurance, settlement cost, others, penalty, and fine were analyzed according to the survey.
Second, the human cost was analyzed by calculations using national data. There is no previous research that quantifies the human cost incurred by accidents in the construction industry. In the Health and Safety Executive (HSE) case in the UK, the cost of the reduced quality of life of the deceased due to a traffic accident was used to calculate the human cost [51]. In South Korea, a study by the Korea Transport Institute (KOTI) quantified the cost of the reduced the quality of life of the deceased due to traffic accidents [52]. Therefore, the human cost in this study was applied by referring to the cost of the lowered quality of life as calculated by KOTI.
Third, cost items such as the income loss cost, tax, health insurance, national pension, employment insurance, the delay reimbursement cost, and the administrative loss cost were collected through the survey once more, after which they were calculated and analyzed. The income loss cost was calculated as the net present value, taking into account the wage increase rate and the real discount rate for the worker wage, which was expected to be received by the deceased worker until retirement (age 65) [33,37,39,45]. In Korea, the retirement age of workers is defined as the age of 60 or older. However, due to the development of medical technology, the ratio of workers who are older than age of 60 has been steadily increasing in Korea [53]. Additionally, various studies have defined the retirement age of workers as 65 [33,37,39,45]. Therefore, the retirement age was defined as 65 years of age. Tax was calculated as the net present value, taking into account worker income, tax rates, and progressive taxes as the amounts expected to be paid each year until the deceased worker retires [54]. Health insurance was calculated as the net present value, taking into account worker income and health insurance premium rates as the amounts expected to be paid annually until the deceased worker retires [55].
Furthermore, the national pension was calculated as the net present value, taking into account the worker income and the national pension premium rates as the amounts expected to be paid annually until the deceased worker retires [55]. Employment insurance was calculated as the net present value, taking into account worker income and employment insurance premium rates as the amounts expected to be paid annually until the deceased worker retires [55]. The delay reimbursement cost refers to the amount needed to compensate for the delay construction period due to an accident. This cost was calculated by taking into account the accident work construction cost of the stop-work period, the ratio of the labor cost, the wage premium and the manpower premium [56]. The administrative loss cost was calculated by considering the number of participants, the number of days, and worker wages as the amounts incurred to investigate accidents.
4. Results and Discussion
4.1. Results of Criteria Selection from Previous Studies
As a result of grouping 78 cost cases previously, as shown in Table 4, they could be classified into a total of 14 intermediate groups as follows: the income loss cost, human cost, medical cost, medical leave wage, survivor benefit, funeral cost, compensation cost, time and productivity loss, material loss, financial loss, intervention cost, penalty, fine, and administrative loss cost. These 14 intermediate groups were grouped based on the general cost management work breakdown structures of Korean construction projects. This was done because when developing survey items for a case study, this method can serve as a basis for increasing the reliability of the acquired data.
Table 4.
Intermediate groups for cost cases extracted from previous studies.
Table 5 shows the results of a comparative analysis between the proposed framework and those in previous studies focusing on fatality loss. The number of cost items covered in the previous studies can be ranked as follows: ten items for Feng; eight items for Linhard; and seven items for Leigh et al., Lebeau et al., and Ibarrondo-Dávila et al. [28,33,41,44,49].
Table 5.
Results of criteria selection for accident loss by reviewing previous studies.
The theme of cost items appearing in the literature review can be organized as follows: 16 studies on medical cost, 13 studies on time and productivity loss, nine studies on financial loss, eight studies on income loss cost, eight studies on administrative loss cost, seven studies on material loss, and six studies on intervention cost. The other theme associated with the aforementioned seven cost items was found to exist in four studies. The result of the focus group interviews indicated that all of the remaining seven cost items should be retained to calculate the fatality loss considering various aspects.
Therefore, 14 cost items covered in the previous studies were included to develop the framework proposed in this study. As a result, it was possible to evaluate and calculate the fatality loss comprehensively by utilizing more cost items as criteria than in previous studies [28,33,41,49].
4.2. Results of Proposed Framework Development
Figure 2 shows the process of deriving the proposed framework in this study. As mentioned in Section 3.2, the intermediate groups for fatality loss were revised as follows: ‘Added’, ‘Change and Breakdown’, ‘Localization’, ‘Reclassification’, and ‘Integration and Breakdown’.
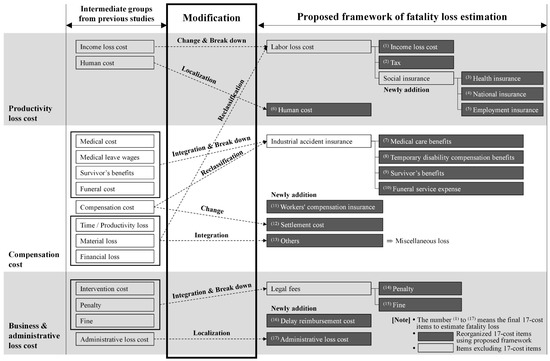
Figure 2.
The proposed framework for fatality loss estimation.
The proposed framework with greater reliability considering the characteristics of the construction industry was composed of a total of 17 cost items, as mentioned in Section 3.2. An explanation of each cost item is given in Table 6.
Table 6.
Results of framework development on fatality loss.
The 17 cost items consisted of the following: (1) income loss cost, (2) tax, (3) health insurance, (4) national insurance, (5) employment insurance, (6) human cost, (7) medical care benefits, (8) temporary disability compensation benefits, (9) survivor’s benefits, (10) funeral service expense, (11) workers’ compensation insurance, (12) settlement cost, (13) others, (14) penalty, (15) fine, (16) delay reimbursement cost, and (17) administrative loss cost.
The productivity loss cost is composed of the sum of the labor loss cost and the human cost. The labor loss cost is classified into the income loss cost, tax, and social insurance costs. Again, social insurance is classified into the health insurance, national pension, and employment insurance types. In particular, tax and social insurance are items used to calculate the loss cost from the government side and are considered to represent the differentiation of this paper because they are cost items that consider the characteristics of Korea, which have rarely been covered in previous papers.
Health insurance is a social security system that allows workers to receive medical services in order to prevent excessive burdens on households due to high medical expenses caused by an illness or injury. Citizens usually pay insurance premiums, and the National Health Insurance Corporation (NHIC), the insurer, manages them and operates the service, providing insurance benefits when necessary, so that citizens can share risks and receive necessary medical services.
The national pension is a public pension system operated directly by the government. It is operated based on insurance premiums paid when individual citizens engage in income activities. It is a pension system that provides some maintenance to people by paying pensions to the person or their family when income activities are stopped due to age, death, or a disability caused by a sudden accident or illness.
Employment insurance is a social insurance policy to ensure life stability in case workers lose their jobs. In addition to the unemployment benefit program that pays wages for a certain period of time, the employment security program and the vocational competency development program are implemented to promote re-employment and prevent unemployment through the development and improvement of vocational skills for job seekers and by providing active job placement services.
Human cost is defined as the cost of lowering the quality of life of workers occurred by fatal and injury accident. It can be divided into the cost incurred by workers and cost incurred by the workers’ family. However, because this study considered only fatal accidents, human cost in this study was defined as the costs of mental pain, sadness, or pressure of the bereaved family members of a worker who died in an accident.
The compensation cost consists of the sum of industrial accident insurance, workers’ compensation insurance, settlement costs, and others. Industrial accident insurance here consists of detailed categories of medical care benefits, temporary disability compensation benefits, survivor benefits, and funeral service expense. In particular, industrial accident insurance and workers’ compensation insurance are among the items that are differentiated from previous papers. These costs reflect the characteristics of Korea’s insurance system and account for a large proportion of the compensation costs for injured workers. Compensation costs are linked to losses by the state or employer.
Industrial accident insurance is a mandatory form of insurance that the state is responsible for to ensure the livelihoods of workers involved in an industrial accident and their families. In this system, the state collects a predetermined insurance premium from the employer and compensates industrially injured workers on behalf of the employer with these financial resources.
On the other hand, workers’ compensation insurance is a type of liability insurance instead of a mandatory type of insurance. It is insurance that compensates for damages under the legal liability that the employee must bear additionally in case a worker employed at a certain workplace suffers a sudden accident during work.
The business and administrative loss cost is defined as the sum of the business loss cost and the administrative loss cost. The business loss cost consists of the sum of legal fees and the delay reimbursement cost. Again, legal fees are divided into penalties and fines. In the event of a fatality during a project in the construction industry, construction can be halted for several weeks. In such cases, the construction period will be delayed as long as the construction interruption period. To make up for this, the employer has to rush the construction work. For rushed construction work, as night work or holiday work is generally performed, labor costs and product premiums are incurred compared to the original labor costs. These costs generally lead to losses for the employer. This cost varies depending on the properties and conditions of the project but accounts for a significant proportion of the business and administrative loss cost.
However, previous papers did not consider the delay reimbursement cost as a loss related to a fatality [27,57,58]. Therefore, the delay reimbursement cost is part of the cost of the fatality loss and thus represents the characteristics of the Korean construction industry. It is considered as a differentiated item in this article.
4.3. Results of the Estimated Fatality Loss by Case Study
A case study of three fatalities in construction that occurred at three sites in Korea was conducted with the proposed framework. The results were analyzed by acquiring evidence and raw data for each accident. Figure 3 and Table 7 show the results of the case study using the proposed framework.
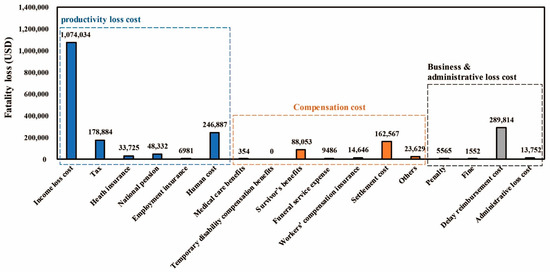
Figure 3.
Total average of the fatality loss for 17 cost items.
Table 7.
Results of a case study on fatality loss.
The subtotal of the productivity loss cost was estimated to be 1,588,842 USD/person. The average values of the income loss cost, tax, health insurance, national insurance, employment insurance, and human cost were calculated as 1,074,034 USD/person, 178,884 USD/person, 33,725 USD/person, 48,332 USD/person, 6981 USD/person, and 246,887 USD/person, respectively.
The subtotal of the compensation cost was estimated to be 298,735 USD/person. The average values of medical care benefits, survivor benefits, funeral service expense, workers’ compensation insurance, settlement cost, and others were calculated as 354 USD/person, 88,053 USD/person, 9486 USD/person, 14,646 USD/person, 162,567 USD/person, 23,629 USD/person, respectively.
The subtotal of the business and administrative loss cost was estimated to be 310,683 USD/person. The average values of penalties, fines, the delay reimbursement cost, and the administrative loss cost were calculated as 5565 USD/person, 1552 USD/person, 289,814 USD/person, and 13,752 USD/person, respectively.
In conclusion, as a result of estimating the total fatality loss for three fatalities in the construction industry, it was estimated to be 2,198,260 USD/person.
Figure 4 is a comparison of the productivity loss cost for the three fatalities above. The cost that accounts for the largest proportion is the income loss cost. Regarding the income loss cost, it was found that the deviation was large depending on the age of the deceased. As the age of the deceased is lower, the income loss cost increases. In other words, the two variables are inversely proportional to each other because the younger the person in such a case, the greater the cumulative value of the wages earned until retirement. In addition, tax, health insurance, national insurance, and employment insurance all have characteristics that are calculated as dependent variable values according to the independent variable of age, akin to the income loss cost.
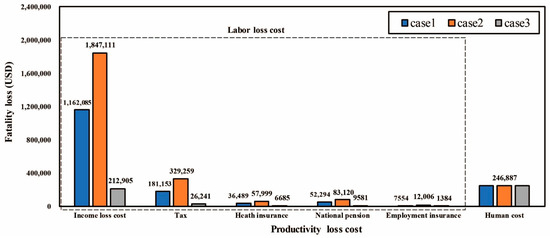
Figure 4.
Comparison of productivity loss cost.
Figure 5 presents a comparison of the compensation cost for the three fatalities. Among them, the settlement cost and survivor benefits were the largest costs. For the settlement cost, because there is no legal standard, there was a large difference in value for each construction project. In addition, regarding survivor benefits, one characteristic is that the deviation increases according to the number of survivors.
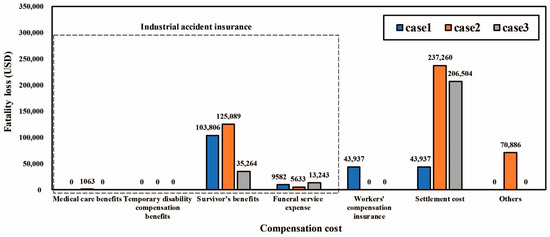
Figure 5.
Comparison of compensation cost.
Figure 6 is a comparison of the business and administrative loss cost for the three fatalities. Among them, the delay reimbursement cost was found to be the largest. This cost is the most important loss incurred in the event of a fatality in the construction industry. The delay reimbursement cost increases when the construction cost of an accident occurring during employment is high, the range of interruptions is wide, and there are many working days. Therefore, one characteristic is the large variation depending on the conditions of the construction site.
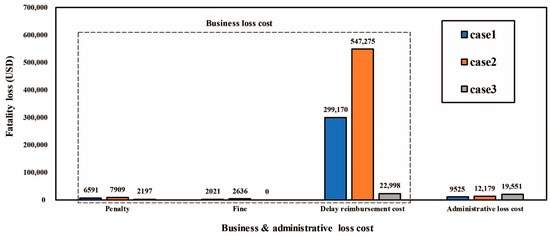
Figure 6.
Comparison of business and administrative loss cost.
5. Conclusions
The construction industry has the highest fatal accident rate compared to other industries. Additionally, when an accident involving a fatality occurs at a construction work site, a considerable financial burden is placed on the worker, employer, and government. There is, however, the lack of a feasible quantitative calculation method by which to determine the fatality loss imposed on the worker, employer, and the government while properly reflecting the characteristics of the construction industry in Korea. Therefore, it is important to calculate the fatality loss by considering various aspects of the construction industry. Thus, this study proposed a framework to calculate the fatality loss while considering the characteristics of the Korean construction industry.
To develop the proposed framework, this study undertook a comprehensive literature review of the cost items of accident loss in the construction industry and in all other industries. It was found that most of the cost items were quantified from a fragmentary perspective rather than a comprehensive perspective. In addition, it was judged that it is difficult to apply conditions based on one country, as the reliability of the supporting data and regulation become insufficient and different. Most of all, the characteristics of the construction industry were not considered. Therefore, this study organized 14 intermediate groups of cost items from earlier studies. These cost groups were then revised and added through focus group interviews and a preliminary survey to reflect the institutional aspects and the characteristics of the construction industry. Finally, the proposed framework was developed with 17 cost items. The 17 cost items were finally derived as follows: the productivity loss cost (income loss cost, tax, health insurance, national insurance, employment insurance, human cost), the compensation cost (medical care benefits, temporary disability compensation benefit, survivor’s benefits, funeral service expense, workers’ compensation insurance, settlement cost, others), and the business and administrative loss cost (penalty, fine, delay reimbursement cost, administrative loss cost).
After developing the framework, a case study was conducted on one of the nation’s largest construction companies and the obtained data were analyzed. As a result, the total fatality loss was estimated to be 2,198,260 USD/person. The subtotals of the productivity loss cost, compensation cost, and business & administrative loss cost were calculated as 1,588,842 USD/person, 298,735 USD/person, and 310,683 USD/person, respectively.
The contributions of this study are as follows. First, in terms of the research aspect, the proposed framework can be utilized to calculate a quantitative fatality loss value as opposed to the metrics used in previous research. Second, in terms of the economic aspect, the proposed framework can estimate the fatality loss considering the characteristics of the Korean construction industry. Therefore, before planning a construction project, decision makers can plan the safety investment properly to reduce the fatality loss. Third, in terms of policy aspect, when a policymaker enacts the penalty regulation that applies to the construction company considering the frequency of fatal accident and fatality loss, the results of this study can be utilized.
The limitations of this study are as follows. First, there was no previous research that quantified the human cost incurred by accidents involving fatal and injury accidents in the construction industry. In this study, the human cost related to the decline in the quality of life was used with information provided by KOTI. For this reason, when such accidents occur in the construction industry, it is difficult to calculate the human cost accurately. Second, the proposed framework was developed to calculate the fatality loss in the construction industry. However, the fatality loss could not be suggested by considering the building type and work type through the proposed framework.
Future research can present a quantitative calculation method to calculate the human cost incurred by involving fatal and injury accidents in the construction industry. Additionally, a framework can be presented to calculate the fatality loss by considering building types and work types.
Author Contributions
J.L.: Methodology, Formal analysis, Resources, Validation, Visualization, Writing-Original draft. J.J. (Jaewook Jeong): Conceptualization, Supervision, Project administration, Writing-Review & Editing. J.S.: Methodology, Resources, Visualization, Writing-Original draft. J.J. (Jaemin Jeong): Methodology, Resources, Visualization, Writing-Review & Editing. All authors have read and agreed to the published version of the manuscript.
Funding
This study was financially supported by Seoul National University of Science and Technology.
Institutional Review Board Statement
Not applicable.
Informed Consent Statement
Not applicable.
Data Availability Statement
The data presented in this study are available in the manuscript.
Conflicts of Interest
The authors declare no conflict of interest.
References
- Hughes, P.; Ferrett, E. Introduction to Health and Safety in Construction; Routledge: London, UK, 2012. [Google Scholar]
- Lee, M.; Jeong, J.; Jeong, J.; Lee, J. Exploring fatalities and injuries in construction by considering thermal comfort using uncertainty and relative importance analysis. Int. J. Environ. Res. Public Health 2021, 18, 5573. [Google Scholar] [CrossRef] [PubMed]
- van Gelder, P.; Klaassen, P.; Taebi, B.; Walhout, B.; van Ommen, R.; van de Poel, I.; Robaey, Z.; Asveld, L.; Balkenende, R.; Hollmann, F.; et al. Safe-by-design in engineering: An overview and comparative analysis of engineering disciplines. Int. J. Environ. Res. Public Health 2021, 18, 6329. [Google Scholar] [CrossRef]
- Nnaji, C.; Karakhan, A.A. Technologies for safety and health management in construction: Current use, implementation benefits and limitations, and adoption barriers. J. Build. Eng. 2020, 29, 101212. [Google Scholar] [CrossRef]
- Bureau of Labor Statistics (BLS). National Census of Fatal Occupational Injuries in 2019; BLS: Washington, DC, USA, 2020. Available online: https://www.bls.gov/news.release/pdf/cfoi.pdf (accessed on 19 March 2021).
- Shohet, I.M.; Wei, H.H.; Skibniewski, M.J.; Tak, B.; Revivi, M. Integrated communication, control, and command of construction safety and quality. J. Construct. Eng. Manag. 2019, 145, 04019051. [Google Scholar] [CrossRef]
- International labour Organization (ILO). World Day for Safety and Health at Work. 2019. Available online: https://www.ilo.org/safework/events/safeday/lang--en/index.htm (accessed on 19 March 2021).
- Abdul Nabi, M.; El-adaway, I.H. Modular construction: Determining decision-making factors and future research needs. J. Manage. Eng. 2020, 36, 04020085. [Google Scholar] [CrossRef]
- Ammad, S.; Alaloul, W.S.; Saad, S.; Qureshi, A.H. Personal protective equipment (PPE) usage in construction projects: A scientometric approach. J. Build. Eng. 2020, 102086. [Google Scholar] [CrossRef]
- Assaad, R.; El-adaway, I.H. Impact of dynamic workforce and workplace variables on the productivity of the construction industry: New gross construction productivity indicator. J. Manag. Eng. 2021, 37, 04020092. [Google Scholar] [CrossRef]
- Sunindijo, R.Y.; Zou, P.X. Political skill for developing construction safety climate. J. Construct. Eng. Manag. 2012, 138, 605–661. [Google Scholar] [CrossRef]
- Gholizadeh, P.; Onuchukwu, I.S.; Esmaeili, B. Trends in catastrophic occupational incidents among electrical contractors, 2007–2013. Int. J. Environ. Res. Public Health 2021, 18, 5126. [Google Scholar] [CrossRef]
- Jeong, J.; Jeong, J. Novel approach of the integrated work & risk breakdown structure for identifying the hierarchy of fatal incident in construction industry. J. Build. Eng. 2021, 41, 102406. [Google Scholar] [CrossRef]
- Lingard, H.; Rowlinson, S. Occupational Health and Safety in Construction Management; Routledge: London, UK, 2005. [Google Scholar]
- Lee, W.; Lin, K.Y.; Seto, E.; Migliaccio, G.C. Wearable sensors for monitoring on-duty and off-duty worker physiological status and activities in construction. Automat. Constr. 2017, 83, 341–353. [Google Scholar] [CrossRef]
- Ho, D.C.P.; Ahmed, S.M.; Kwan, J.C.; Ming, F.Y.W. Site safety management in Hong Kong. J. Manag. Eng. 2000, 16, 34–42. [Google Scholar] [CrossRef]
- Choi, S.D.; Guo, L.; Kim, J.; Xiong, S. Comparison of fatal occupational injuries in construction industry in the United States, South Korea, and China. Int. J. Ind. Ergon. 2019, 71, 64–74. [Google Scholar] [CrossRef]
- Han, M.J.N.; Kim, M.J.; Kim, I.H. Exploring the user performance of Korean women in smart homes with a focus on user adoption. J. Build. Eng. 2021, 39, 102303. [Google Scholar] [CrossRef]
- Yang, K.; Kim, K.; Go, S. Towards effective safety cost budgeting for apartment construction: A case study of occupational safety and health expenses in South Korea. Sustainability 2021, 13, 1335. [Google Scholar] [CrossRef]
- Fang, D.; Wu, H. Development of a safety culture interaction (SCI) model for construction projects. Saf. Sci. 2013, 57, 138–149. [Google Scholar] [CrossRef]
- Wanberg, J.; Harper, C.; Hallowell, M.R.; Rajendran, S. Relationship between construction safety and quality performance. J. Construct. Eng. Manag. 2013, 139, 04013003. [Google Scholar] [CrossRef]
- Construction & Economy Research Institute of Korea (CERIK). A Comparative Analysis of Industrial Accident in Construction Industry in OECD Countries. 2020. Available online: http://www.cerik.re.kr/report/research/detail/2421 (accessed on 19 March 2021).
- Jallon, R.; Imbeau, D.; de Marcellis-Warin, N. Development of an indirect-cost calculation model suitable for workplace use. J. Saf. Res. 2011, 42, 149–164. [Google Scholar] [CrossRef]
- Heinrich, H.W. Industrial Accident Prevention. A Scientific Approach; McGraw Hill: New York, NY, USA, 1941. [Google Scholar]
- Ajayi, S.O.; Adegbenro, O.O.; Alaka, H.A.; Oyegoke, A.S.; Manu, P.A. Addressing behavioural safety concerns on qatari mega projects. J. Build. Eng. 2021, 41, 102398. [Google Scholar] [CrossRef]
- Riel, P.F.; Imbeau, D. Justifying investments in industrial ergonomics. Int. J. Ind. Ergon. 1996, 18, 349–361. [Google Scholar] [CrossRef]
- Rikhardsson, P.M.; Impgaard, M. Corporate cost of occupational accidents: An activity-based analysis. Accid. Anal. Prev. 2004, 36, 173–182. [Google Scholar] [CrossRef]
- Linhard, J.B. Understanding the return on health, safety and environmental investments. J. Saf. Res. 2005, 36, 257–260. [Google Scholar] [CrossRef]
- Kim, D.Y. A basic study on investigation of current craftmen status in construction site. Archit. Inst. Korea 2014, 30, 81–88. [Google Scholar]
- Lee, M.; Jeong, M.; Kim, K.; Choi, E.; Park, S. Review the possibility of replacing the converted accident ratio with the industrial accident compensation insurance balance ratio. J. Korean Soc. Saf. 2010, 25, 137–145. [Google Scholar]
- Gavious, A.; Mizrahi, S.; Shani, Y.; Minchuk, Y. The costs of industrial accidents for the organization: Developing methods and tools for evaluation and cost–benefit analysis of investment in safety. J. Loss Prev. Process. Ind. 2009, 22, 434–438. [Google Scholar] [CrossRef]
- Brody, B.; Létourneau, Y.; Poirier, A. Les Coûts Indirects des Accidents du Travail; Research report presented to IRSST: Montréal, QC, Canada, 1990. [Google Scholar]
- Lebeau, M.; Duguay, P.; Boucher, A. Costs of occupational injuries and diseases in Québec. J. Saf. Res. 2014, 50, 89–98. [Google Scholar] [CrossRef]
- Leigh, J.P.; Waehrer, G.; Miller, T.R.; Keenan, C. Costs of occupational injury and illness across industries. Scand. J. Work Environ. Health 2004, 30, 199–205. [Google Scholar] [CrossRef]
- Mroz, T.M.; Carlini, A.R.; Archer, K.R.; Wegener, S.T.; Hoolachan, J.I.; Stiers, W.; Shore, R.A.; Castillo, R.C. Frequency and cost of claims by injury type from a state workers’ compensation fund from 1998 through 2008. Arch. Phys. Med. Rehabil. 2014, 95, 1048–1054. [Google Scholar] [CrossRef]
- Sears, J.M.; Edmonds, A.T.; Coe, N.B. Coverage gaps and cost-shifting for work-related injury and illness: Who bears the financial burden? Med. Care Res. Rev. 2020, 77, 223–235. [Google Scholar] [CrossRef]
- Shalini, R.T. Economic cost of occupational accidents: Evidence from a small island economy. Saf. Sci. 2009, 47, 973–979. [Google Scholar] [CrossRef]
- Xiang, H.; Shi, J.; Lu, B.; Wheeler, K.; Zhao, W.; Wilkins, J.R.; Smith, G.A. Medical expenditures associated with nonfatal occupational injuries among immigrant and US-born workers. BMC. Public Health 2012, 12, 678. [Google Scholar] [CrossRef] [PubMed]
- Allison, R.W.; Hon, C.K.; Xia, B. Construction accidents in Australia: Evaluating the true costs. Saf. Sci. 2019, 120, 886–896. [Google Scholar] [CrossRef]
- Cressler, T.E.; Moore, J.R. Tracking safety performance in construction: A focused approach to the measurement of fatal and non-fatal injuries, 2003–2012. Saf. Sci. 2016, 88, 44–53. [Google Scholar] [CrossRef][Green Version]
- Feng, Y.; Zhang, S.; Wu, P. Factors influencing workplace accident costs of building projects. Saf. Sci. 2015, 72, 97–104. [Google Scholar] [CrossRef]
- Feng, Y. Mathematical models for determining the minimum level of voluntary safety investments for building projects. J. Construct. Eng. Manag. 2015, 141, 04015015. [Google Scholar] [CrossRef]
- Gholizadeh, P.; Esmaeili, B. Cost of occupational incidents for electrical contractors: Comparison using robust-factorial analysis of variance. J. Construct. Eng. Manag. 2020, 146, 04020073. [Google Scholar] [CrossRef]
- Ibarrondo-Dávila, M.P.; López-Alonso, M.; Rubio-Gámez, M.C. Managerial accounting for safety management. The case of a Spanish construction company. Saf. Sci. 2015, 79, 116–125. [Google Scholar] [CrossRef]
- Larsson, T.J.; Field, B. The distribution of occupational injury risks in the Victorian construction industry. Saf. Sci. 2002, 40, 439–456. [Google Scholar] [CrossRef]
- Liao, C.W.; Chiang, T.L. The examination of workers’ compensation for occupational fatalities in the construction industry. Saf. Sci. 2015, 72, 363–370. [Google Scholar] [CrossRef]
- Schoonover, T.; Bonauto, D.; Silverstein, B.; Adams, D.; Clark, R. Prioritizing prevention opportunities in the Washington state construction industry, 2003–2007. J. Saf. Res. 2010, 41, 197–202. [Google Scholar] [CrossRef]
- Shohet, I.M.; Luzi, M.; Tarshish, M. Optimal allocation of resources in construction safety: Analytical-empirical model. Saf. Sci. 2018, 104, 231–238. [Google Scholar] [CrossRef]
- Leigh, J.P.; Waehrer, G.; Miller, T.R.; McCurdy, S.A. Costs differences across demographic groups and types of occupational injuries and illnesses. Am. J. Ind. Med. 2006, 49, 845–853. [Google Scholar] [CrossRef] [PubMed]
- Waehrer, G.M.; Dong, X.S.; Miller, T.; Haile, E.; Men, Y. Costs of occupational injuries in construction in the United States. Accid. Anal. Prev. 2007, 39, 1258–1266. [Google Scholar] [CrossRef]
- Costs to Britain of Workplace Fatalities and Self-Reported Injuries and Ill Health, 2018/19 Contents. Available online: https://www.hse.gov.uk (accessed on 19 March 2021).
- Estimation of Transport Accident Costs in 2013. Available online: https://www.koti.re.kr (accessed on 19 March 2021).
- Lee, J.C.; Lee, C.S. Accident characteristics of aged construction workers. J. Archit. Inst. Korea Struct. Constr. 2008, 24, 201–208. [Google Scholar]
- National Tax Service (NTS). Available online: https://www.nts.go.kr/nts/main.do (accessed on 7 August 2021).
- National Pension Service (NPS). Available online: https://www.nps.or.kr/jsppage/main.jsp (accessed on 7 August 2021).
- Estimating Standards 2021. Available online: https://www.kict.re.kr (accessed on 19 March 2021).
- Leigh, J.P.; Markowitz, S.; Fahs, M.; Landrigan, P.J. Costs of Occupational Injuries and Illnesses; University of Michigan Press: Ann Arbor, MI, USA, 2000. [Google Scholar]
- Bergström, M. The potential-method—An economic evaluation tool. J. Saf. Res. 2005, 36, 237–240. [Google Scholar] [CrossRef] [PubMed]
- Lahiri, S.; Gold, J.; Levenstein, C. Net-cost model for workplace interventions. J. Saf. Res. 2005, 36, 241–255. [Google Scholar] [CrossRef]
- Oxenburgh, M.; Marlow, P. The productivity assessment tool: Computer-based cost benefit analysis model for the economic assessment of occupational health and safety interventions in the workplace. J. Saf. Res. 2005, 36, 209–214. [Google Scholar] [CrossRef] [PubMed]
- Hinze, J.; Devenport, J.N.; Giang, G. Analysis of construction worker injuries that do not result in lost time. J. Construct. Eng. Manag. 2006, 132, 321–326. [Google Scholar] [CrossRef]
- Paez, O.; Uahinui, T.; Genaidy, A.; Karwowski, W.; Sun, L.; Daraiseh, N. Estimating uninsured costs of work-related accidents, part II: An incidence-based model. Theor. Issues Ergon. Sci. 2006, 7, 247–260. [Google Scholar] [CrossRef]


Publisher’s Note: MDPI stays neutral with regard to jurisdictional claims in published maps and institutional affiliations. |
© 2021 by the authors. Licensee MDPI, Basel, Switzerland. This article is an open access article distributed under the terms and conditions of the Creative Commons Attribution (CC BY) license (https://creativecommons.org/licenses/by/4.0/).