Spatiotemporal Change and the Natural–Human Driving Processes of a Megacity’s Coastal Blue Carbon Storage
Abstract
:1. Introduction
2. Materials and Methods
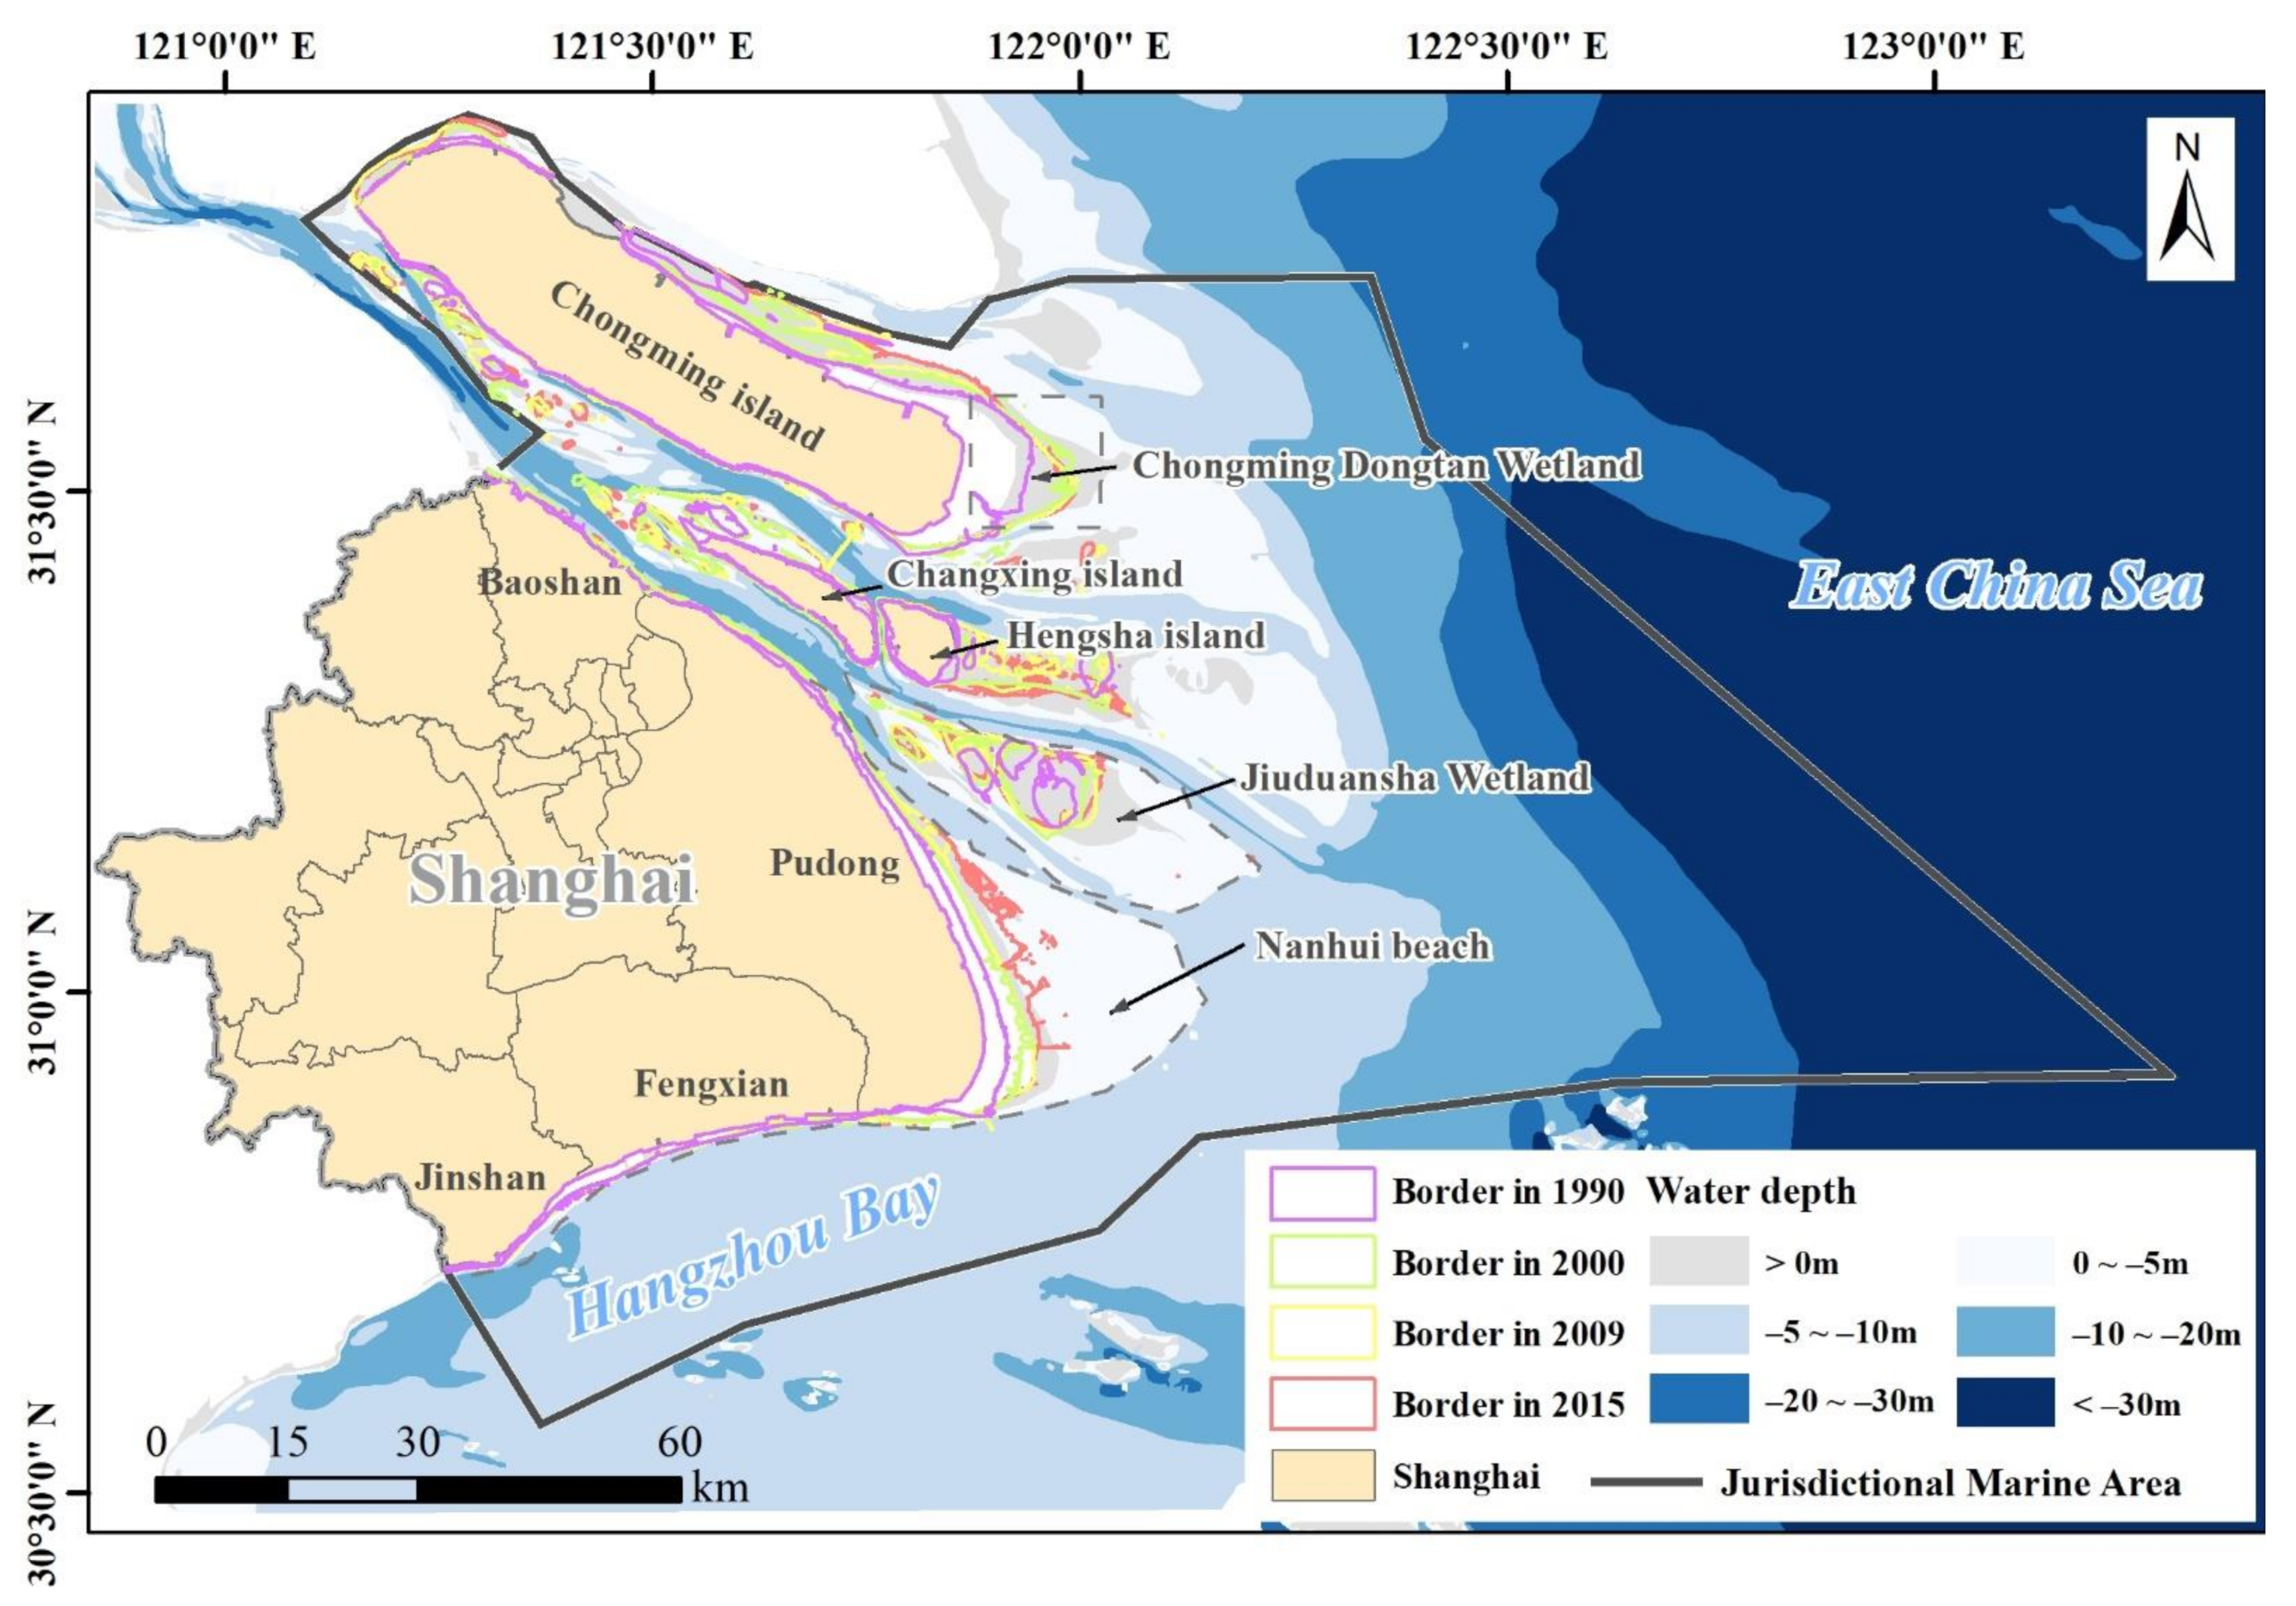
2.1. Study Area
2.2. Database and LULC Classification
2.3. LULC Transition Matrix and Classifiction of the Land Use/Land Cover Driving Processes
2.4. Calculation of Carbon Storage and Sequestration
2.5. Hierarchical Clustering
- (1)
- We calculated the accumulated amount of coastal blue carbon storage (CSCS) of each driving process in each year (1990, 2000, 2009 and 2015), and then all the values of the CBCS were transformed into a 33 × 4 matrix (the amount of CBCS of the 33 driving processes in 1990, 2000, 2009 and 2015 was calculated in the matrix);
- (2)
- We normalized the values of the 33 CBCS samples under specific driving processes in each period by Z score transformation, in which the Z score was calculated as (X − μ)/σ (X is the input value of CBCS, μ is the average value of 33 CBCS samples and σ is the standard deviation of the CBCS values);
- (3)
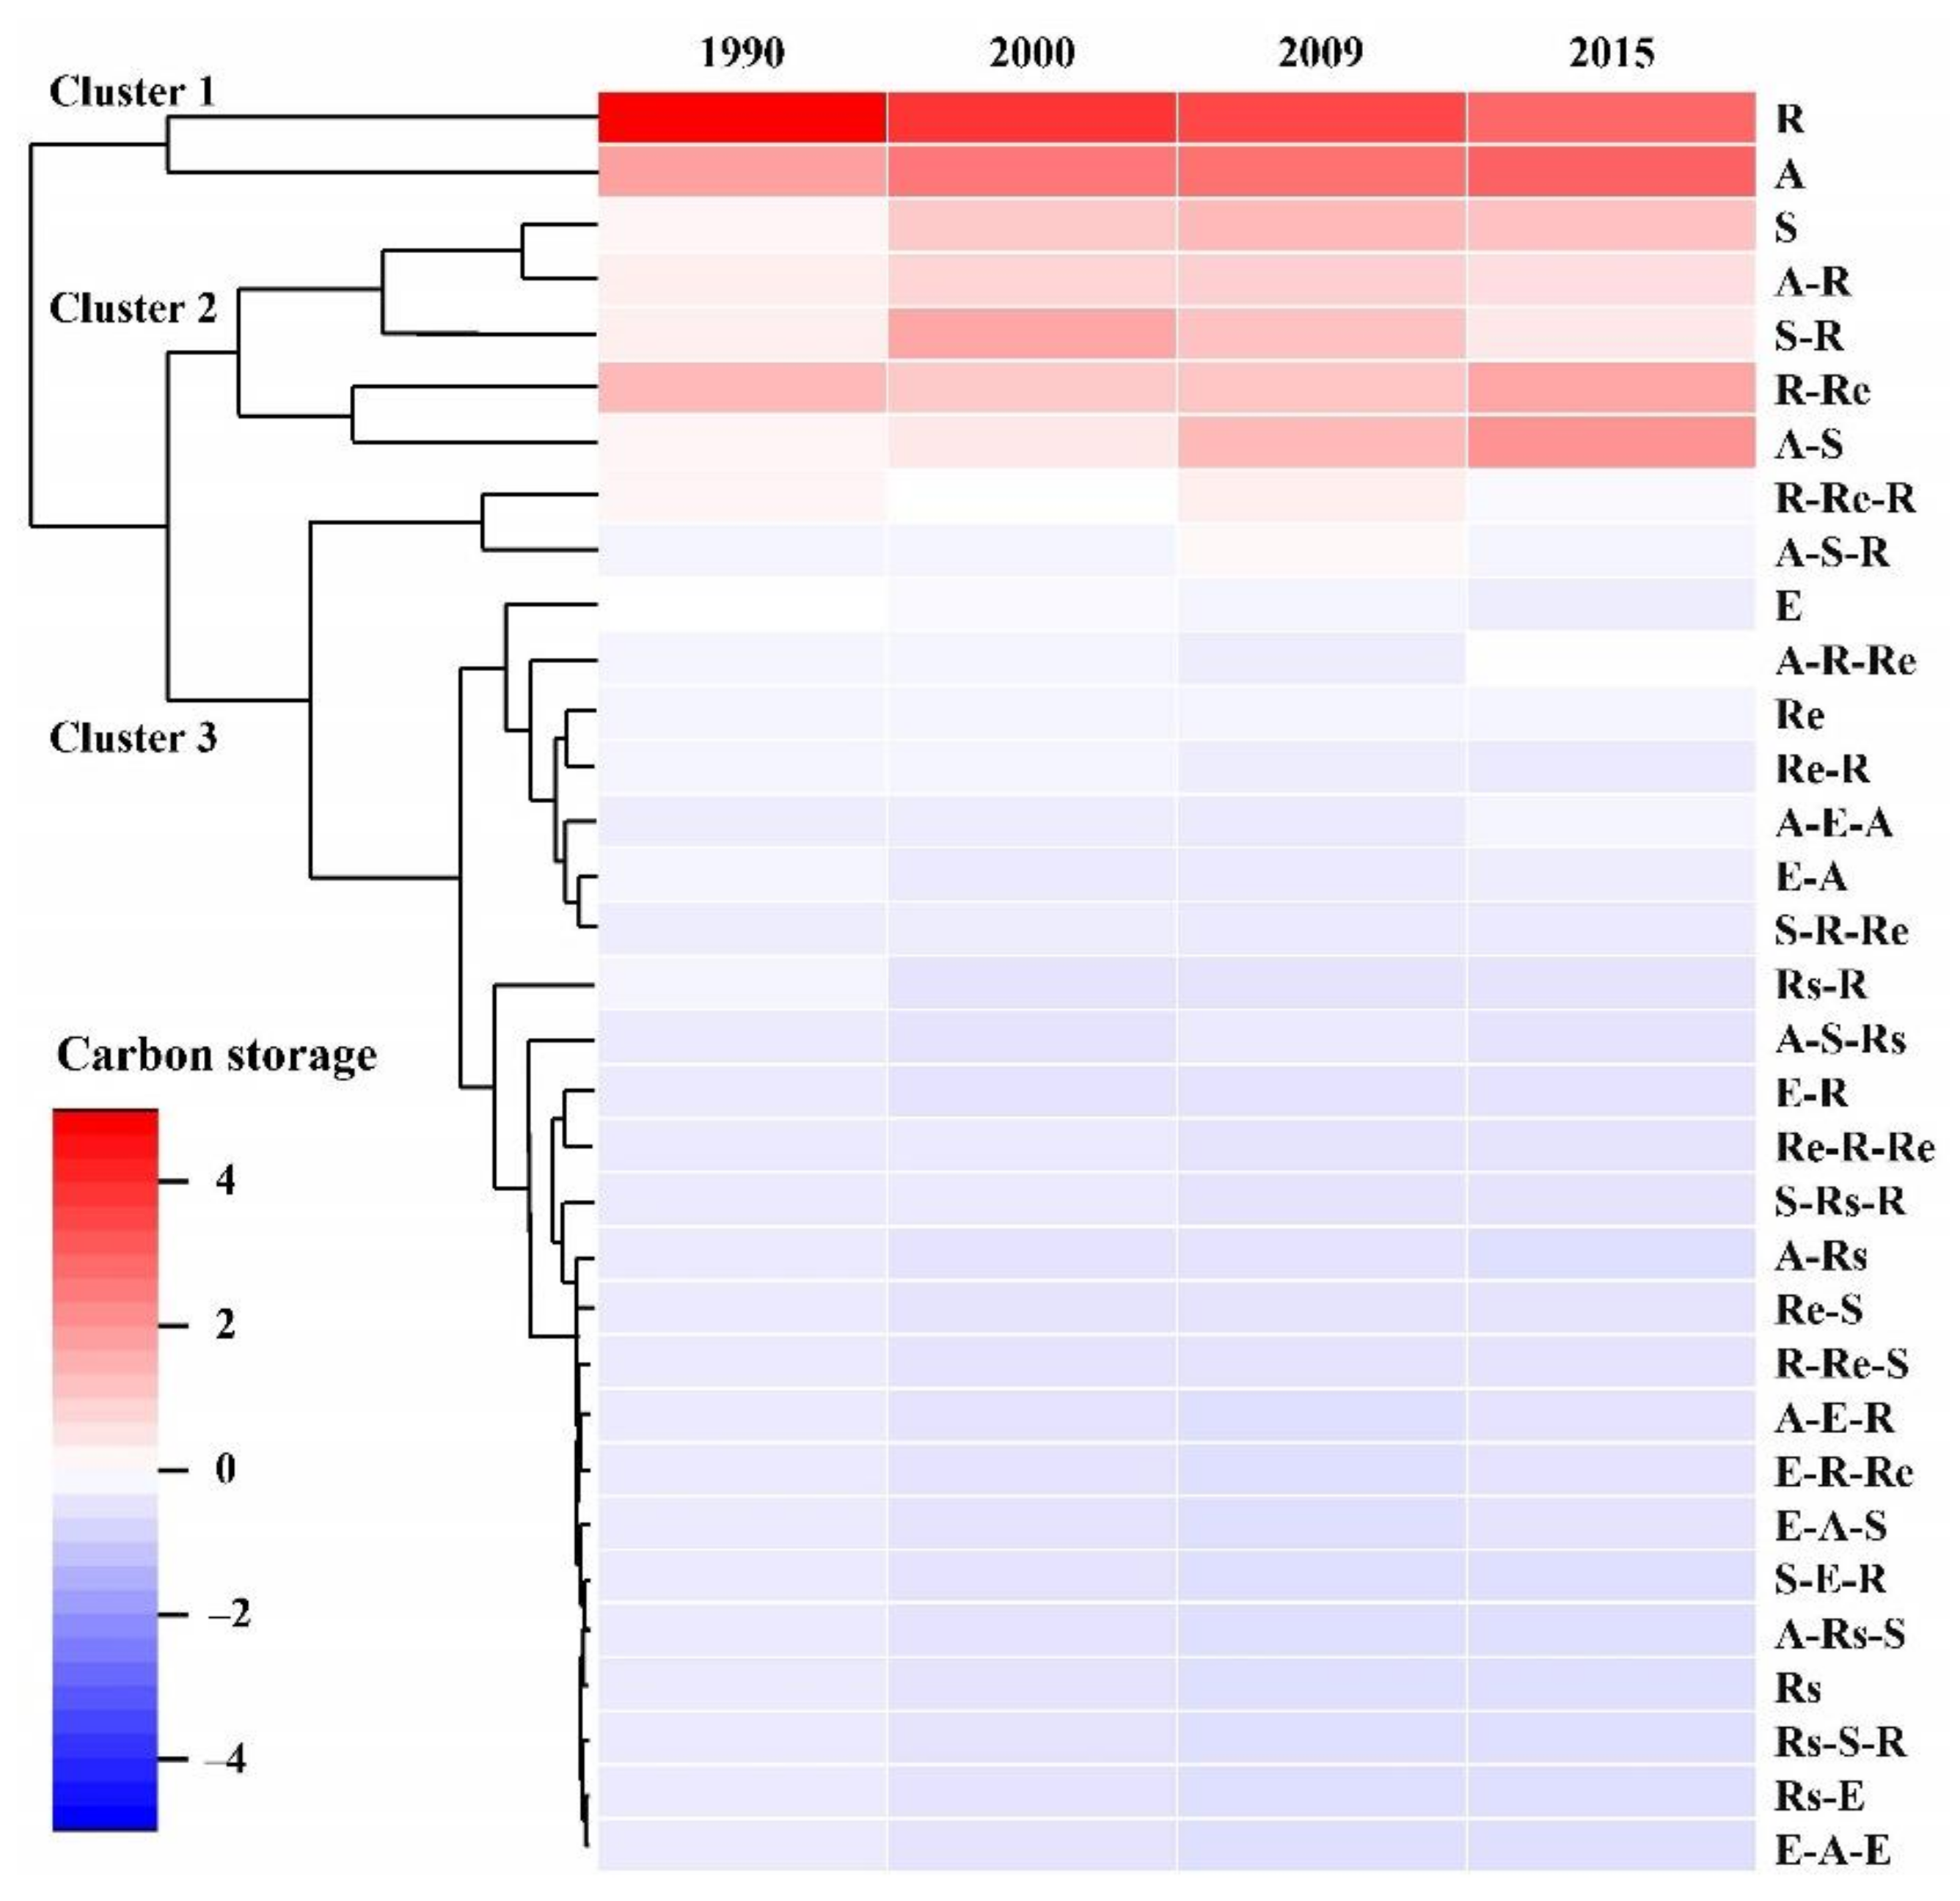
- All the normalized values of CBCS were used to generate the CHM of the CBCS dynamics in the heatmap function in the R ‘pheatmap’ package. The hierarchical clustering algorithm was used in the R ‘pheatmap’ package to measure the similarities of CBCS within the heat map by calculating the Euclidean distance [8].
3. Results
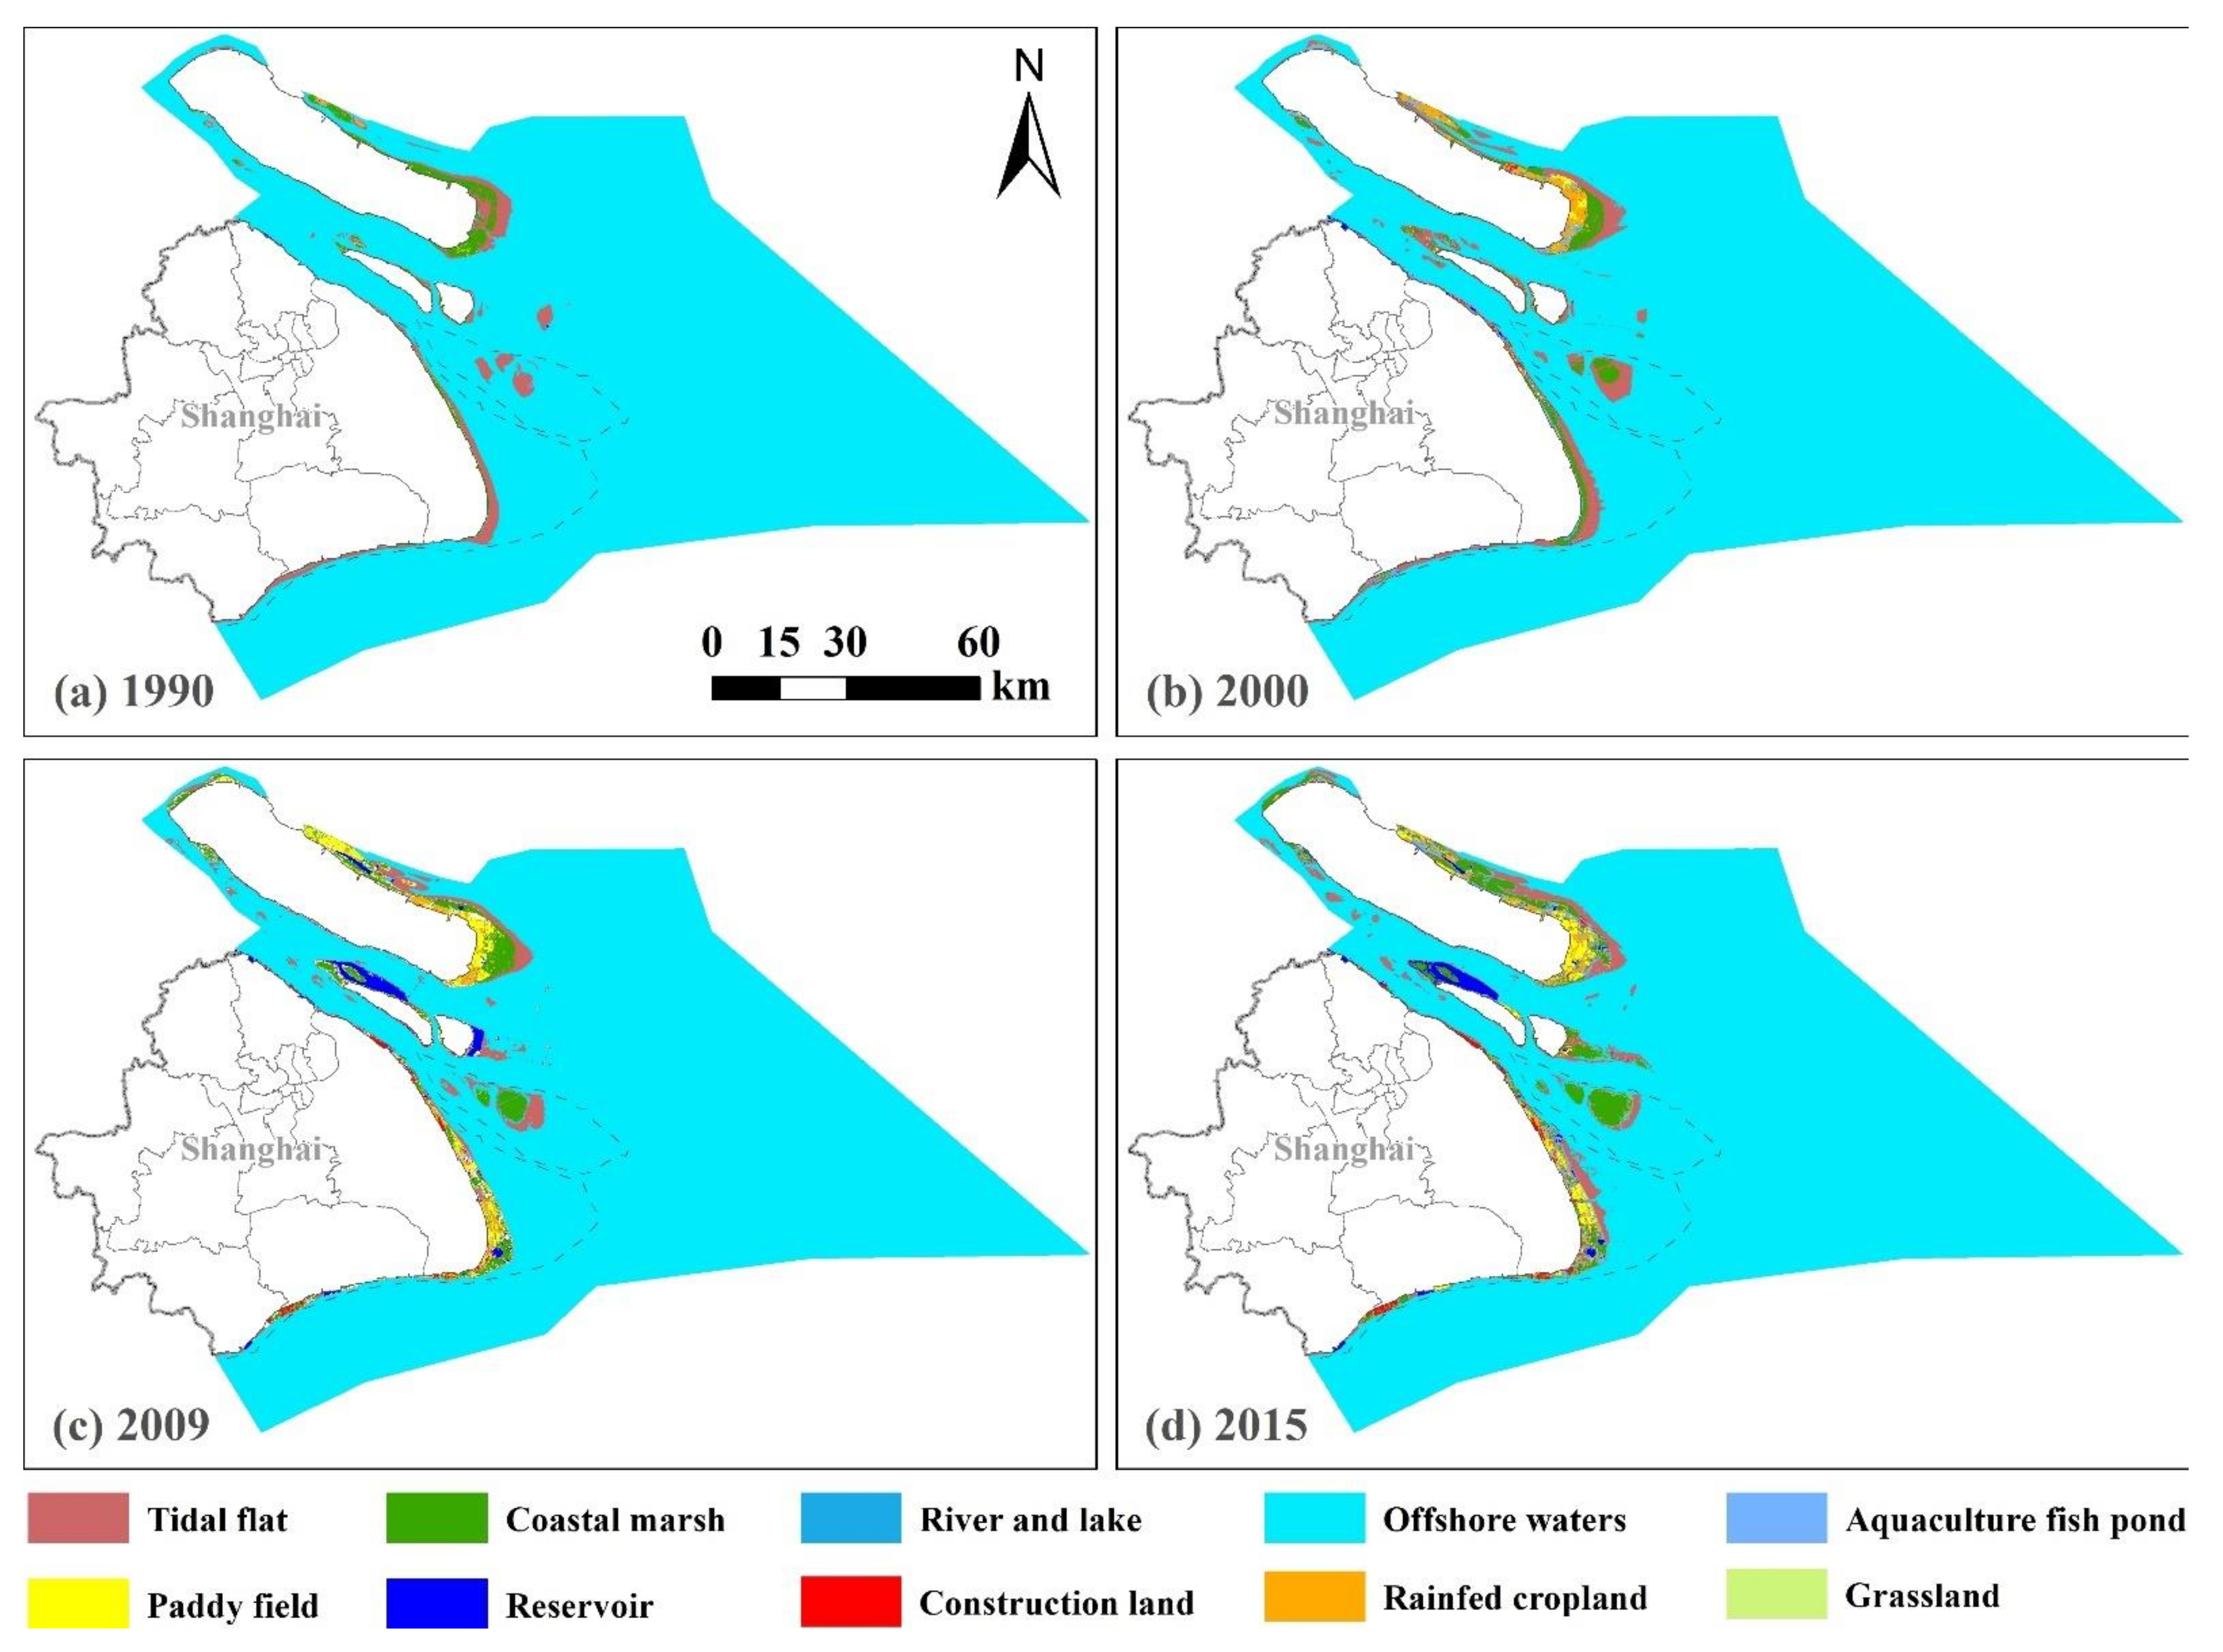
3.1. LULC Changes in Shanghai Coastal Area
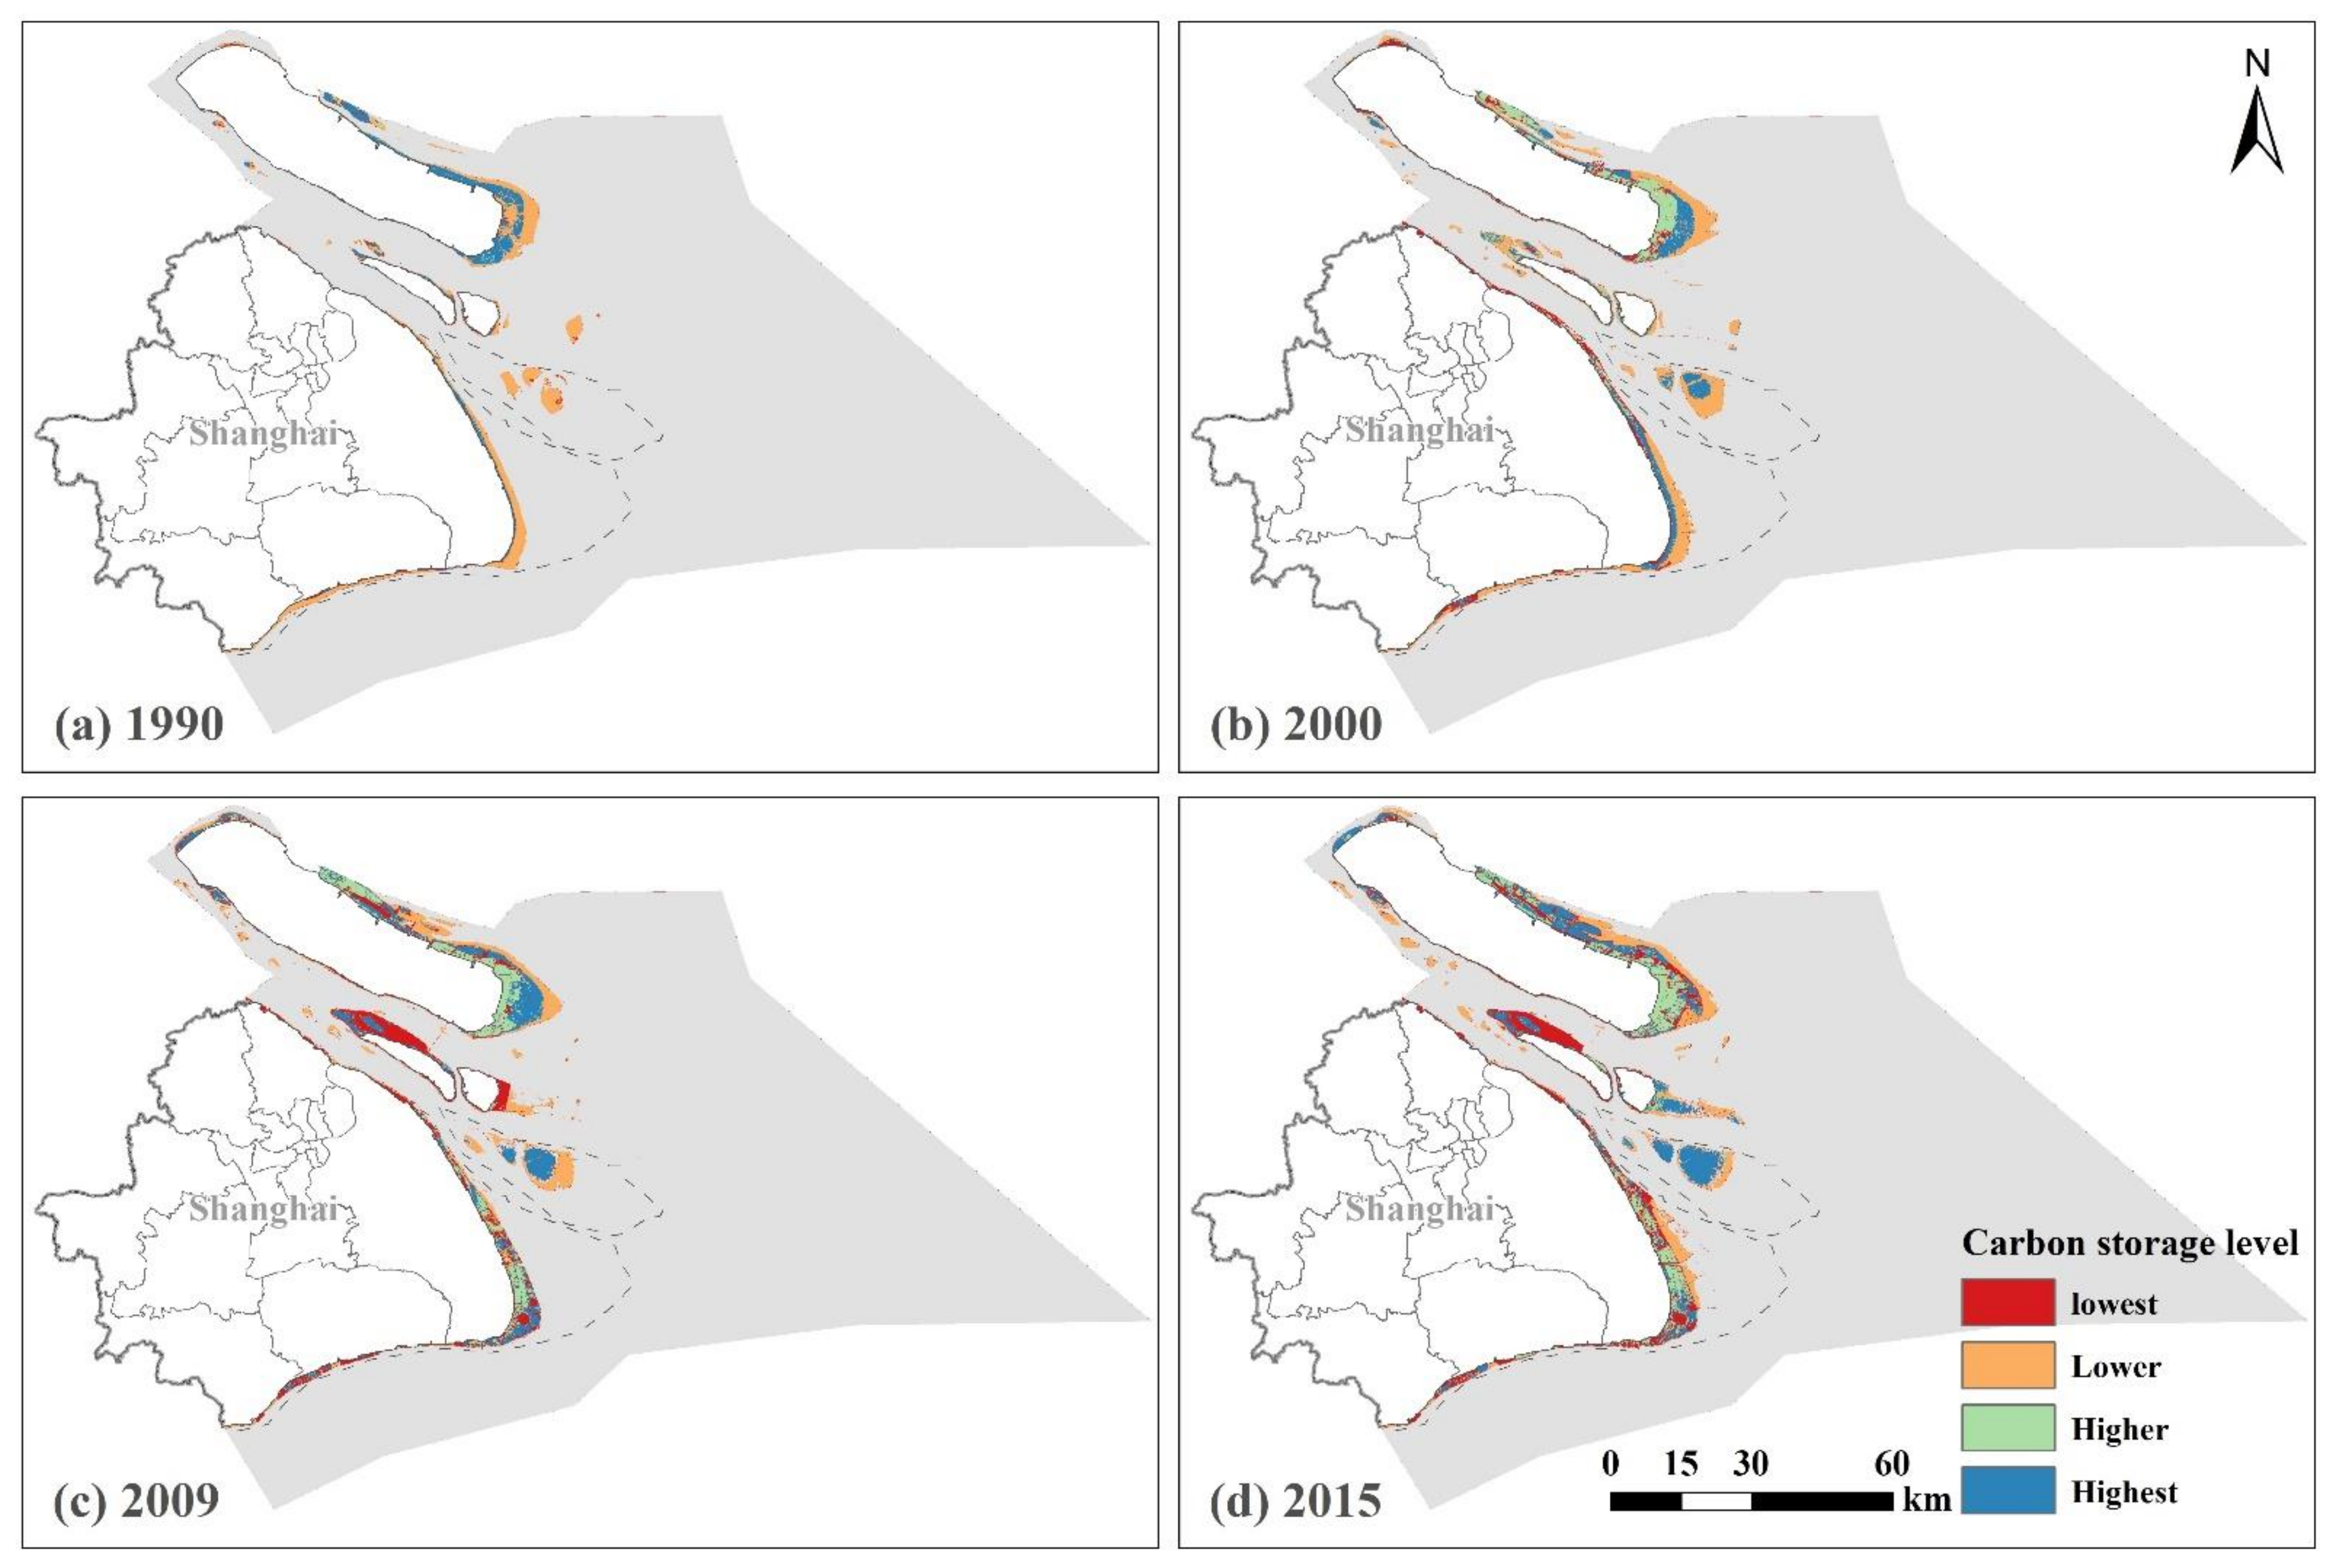
3.2. Spatiotemporal Change in CBCS in the Shanghai Coastal Area
3.3. Driving Processes of CBCS in the Shanghai Coastal Area
3.3.1. Influence of Different Driving Processes on the Change of Blue Carbon Storage
3.3.2. The Clustering of Driving Processes of Blue Carbon Storage
4. Discussion
4.1. Spatiotemporal Change and Driving Processes of CBCS
4.2. Contributions and Limitations
5. Conclusions
Author Contributions
Funding
Institutional Review Board Statement
Informed Consent Statement
Data Availability Statement
Acknowledgments
Conflicts of Interest
References
- Han, J.; Meng, X.; Zhou, X.; Yi, B.; Liu, M.; Xiang, W.-N. A long-term analysis of urbanization process, landscape change, and carbon sources and sinks: A case study in China’s Yangtze River Delta region. J. Clean. Prod. 2017, 141, 1040–1050. [Google Scholar] [CrossRef]
- Yanez Soria, K.; Ribeiro Palacios, M.; Morales Gomez, C.A. Governance and policy limitations for sustainable urban land planning. The case of Mexico. J. Environ. Manag. 2020, 259, 109575. [Google Scholar] [CrossRef]
- Lovelock, C.E. Blue carbon from the past forecasts the future. Science 2020, 368, 1050–1052. [Google Scholar] [CrossRef] [PubMed]
- Vaidyanathan, G. ‘Blue carbon’ plan takes shape. Nature 2011. [Google Scholar] [CrossRef]
- Banerjee, K.; Mitra, A.; Villasante, S. Carbon Cycling in Mangrove Ecosystem of Western Bay of Bengal (India). Sustainability 2021, 13, 6740. [Google Scholar] [CrossRef]
- McLeod, E.; Chmura, G.L.; Bouillon, S.; Salm, R.; Bjork, M.; Duarte, C.M.; Lovelock, C.E.; Schlesinger, W.H.; Silliman, B.R. A blueprint for blue carbon: Toward an improved understanding of the role of vegetated coastal habitats in sequestering CO2. Front. Ecol. Environ. 2011, 9, 552–560. [Google Scholar] [CrossRef] [Green Version]
- Tang, J.; Ye, S.; Chen, X.; Yang, H.; Sun, X.; Wang, F.; Wen, Q.; Chen, S. Coastal blue carbon: Concept, study method, and the application to ecological restoration. Sci. China Earth Sci. 2018, 61, 637–646. [Google Scholar] [CrossRef]
- Ma, T.; Li, X.; Bai, J.; Ding, S.; Zhou, F.; Cui, B. Four decades’ dynamics of coastal blue carbon storage driven by land use/land cover transformation under natural and anthropogenic processes in the Yellow River Delta, China. Sci. Total Environ. 2019, 655, 741–750. [Google Scholar] [CrossRef]
- Chu, X.; Zhan, J.; Li, Z.; Zhang, F.; Qi, W. Assessment on forest carbon sequestration in the Three-North Shelterbelt Program region, China. J. Clean. Prod. 2019, 215, 382–389. [Google Scholar] [CrossRef]
- Hernandez-Guzman, R.; Ruiz-Luna, A.; Gonzalez, C. Assessing and modeling the impact of land use and changes in land cover related to carbon storage in a western basin in Mexico. Remote Sens. Appl. Soc. Environ. 2019, 13, 318–327. [Google Scholar] [CrossRef]
- Maanan, M.; Karim, M.; Kacem, H.A.; Ajrhough, S.; Rueff, H.; Snoussi, M.; Rhinane, H. Modelling the potential impacts of land use/cover change on terrestrial carbon stocks in north-west Morocco. Int. J. Sustain. Dev. World Ecol. 2019, 26, 560–570. [Google Scholar] [CrossRef]
- Dai, X.; Ma, J.; Zhang, H.; Xu, W. Evaluation of ecosystem health for the coastal wetlands at the Yangtze Estuary, Shanghai. Wetl. Ecol. Manag. 2013, 21, 433–445. [Google Scholar] [CrossRef]
- Li, Y.; Qiu, J.; Li, Z.; Li, Y. Assessment of Blue Carbon Storage Loss in Coastal Wetlands under Rapid Reclamation. Sustainability 2018, 10, 2818. [Google Scholar] [CrossRef] [Green Version]
- Macreadie, P.I.; Ollivier, Q.R.; Kelleway, J.J.; Serrano, O.; Carnell, P.E.; Lewis, C.J.E.; Atwood, T.B.; Sanderman, J.; Baldock, J.; Connolly, R.M.; et al. Carbon sequestration by Australian tidal marshes. Sci. Rep. 2017, 7, 1–19. [Google Scholar] [CrossRef] [Green Version]
- Moritsch, M.M.; Young, M.; Carnell, P.; Macreadie, P.I.; Lovelock, C.; Nicholson, E.; Raimondi, P.T.; Wedding, L.M.; Ierodiaconou, D. Estimating blue carbon sequestration under coastal management scenarios. Sci. Total Environ. 2021, 777, 145962. [Google Scholar] [CrossRef] [PubMed]
- Zhang, T.; Chen, H.; Cao, H.; Ge, Z.; Zhang, L. Combined influence of sedimentation and vegetation on the soil carbon stocks of a coastal wetland in the Changjiang estuary. Chin. J. Oceanol. Limnol. 2017, 35, 833–843. [Google Scholar] [CrossRef]
- Zhang, T.; Ge, Z.; Zhang, L.; Chen, H.; Yan, G. Influence of saltmarsh vegetation and sedimentation on the distribution of soil carbon and nitrogen in the Chongming Dongtan wetlands. Acta Sci. Circumstantiae 2015, 35, 836–843. [Google Scholar]
- Yang, S.L.; Luo, X.; Temmerman, S.; Kirwan, M.; Bourna, T.; Xu, K.; Zhang, S.; Fan, J.; Shi, B.; Yang, H.; et al. Role of delta-front erosion in sustaining salt marshes under sea-level rise and fluvial sediment decline. Limnol. Oceanogr. 2020, 65, 1990–2009. [Google Scholar] [CrossRef] [Green Version]
- Fan, B.; Li, Y.; Pavao-Zuckerman, M. The dynamics of land-sea-scape carbon flow can reveal anthropogenic destruction and restoration of coastal carbon sequestration. Landsc. Ecol. 2020, 36, 1933–1949. [Google Scholar] [CrossRef]
- Shi, L.-J.; Zheng, L.-B.; Mei, X.-Y.; Yu, L.-Z.; Jia, Z.-C. Characteristics of soil organic carbon and total nitrogen under different land use types in Shanghai. Ying Yong Sheng Tai Xue Bao J. Appl. Ecol. 2010, 21, 2279–2287. [Google Scholar]
- Zhang, F.; Xu, N.; Wang, C.; Wu, F.; Chu, X. Effects of land use and land cover change on carbon sequestration and adaptive management in Shanghai, China. Phys. Chem. Earth 2020, 120, 102948. [Google Scholar] [CrossRef]
- Chen, L.; Ren, C.; Zhang, B.; Li, L.; Wang, Z.; Song, K. Spatiotemporal Dynamics of Coastal Wetlands and Reclamation in the Yangtze Estuary During Past 50 Years (1960s–2015). Chin. Geogr. Sci. 2018, 28, 386–399. [Google Scholar] [CrossRef] [Green Version]
- Ma, T.; Li, X.; Bai, J.; Cui, B. Impacts of Coastal Reclamation on Natural Wetlands in Large River Deltas in China. Chin. Geogr. Sci. 2019, 29, 640–651. [Google Scholar] [CrossRef] [Green Version]
- Pavani, B.F.; Sousa Junior, W.C.; Inouye, C.E.N.; Vieira, S.A.; Mello, A.Y.I. Estimating and valuing the carbon release in scenarios of land-use and climate changes in a Brazilian coastal area. J. Environ. Manag. 2018, 226, 416–427. [Google Scholar] [CrossRef] [PubMed]
- Kolde, R. pheatmap: Pretty Heatmaps. R package version 1.0.12. 2019. Available online: https://CRAN.R-project.org/package=pheatmap (accessed on 1 February 2019).
- Lin, S.; Li, X.; Yang, B.; Ma, Y.; Jiang, C.; Xue, L.; Wang, J.; Yan, Z. Systematic assessments of tidal wetlands loss and degradation in Shanghai, China: From the perspectives of area, composition and quality. Glob. Ecol. Conserv. 2021, 25, e01450. [Google Scholar] [CrossRef]
- Cui, B.; He, Q.; Gu, B.; Bai, J.; Liu, X. China’s Coastal Wetlands: Understanding Environmental Changes and Human Impacts for Management and Conservation. Wetlands 2016, 36, S1–S9. [Google Scholar] [CrossRef] [Green Version]
- Zhang, Y.; Chen, R.; Wang, Y. Tendency of land reclamation in coastal areas of Shanghai from 1998 to 2015. Land Use Policy 2020, 91, 104370. [Google Scholar] [CrossRef]
- She, J.; Guan, Z.; Cai, F.; Pu, L.; Tan, J.; Chen, T. Simulation of Land Use Changes in a Coastal Reclaimed Area with Dynamic Shorelines. Sustainability 2017, 9, 431. [Google Scholar] [CrossRef] [Green Version]


| First Class | Second Class | Description |
|---|---|---|
| Natural wetland | Tidal flat | A silty or sandy shoal with no vegetation cover located in the intertidal zone |
| Coastal marsh | Any of various bogs and mire areas located on the coast and in the intertidal zone | |
| River and lake | Inland permanent waters | |
| Artificial wetland | Aquaculture fish pond | Coastal zone of farming area |
| Paddy field | Arable land where rice is grown | |
| Reservoir | A man-made water storage area | |
| Other land | Construction land | Impervious water surface or man-made structure |
| Rainfed cropland | Seasonally unplanted arable land | |
| Grassland | Low vegetation or grassland | |
| Waters | Offshore waters | Permanent waters within the jurisdictional area |
| Class | Driving Process | Ecological Consequence | Initial–Final Land Use/Land Cover (LULC) Types |
|---|---|---|---|
| Natural Driving Process | Accretion (A) | Growing tidal flats by sand deposition around estuarine area | 1-2, 1-3, 5-2, 5-3 |
| Succession (S) | Natural development of estuarine ecosystem from pioneer (e.g., tidal wetlands) to the local climax ecosystem (brackish & freshwater marsh) | 2-3, 2-4, 3-4 | |
| Regressive succession (Rs) | Ecosystem degradation from climax to pioneer ecosystem in estuarine area | 3-2 | |
| Erosion (E) | Loss in tidal wetlands by seawater washing or seal level rise | 2-1, 3-1, 4-1 | |
| Human-Driven Processes | Reclamation (R) | Loss in coastal wetlands by encroachment of land reclamation | (1, 2, 3, 4, 5)-6, (1, 2, 3, 4, 5)-7, (1, 2, 3, 4, 5)-8, (1, 2, 3, 4, 5)-9, (1, 2, 3, 4, 5)-10 |
| Restoration (Re) | Increased area or enhanced ecological functioning of coastal wetland by human intervention | (6, 7, 8, 9, 10)-1, (6, 7, 8, 9, 10)-2, (6, 7, 8, 9, 10)-3, (6, 7, 8, 9, 10)-4, (6, 7, 8, 9, 10)-5 |
| Land Use/Land Cover | Ci_above | Ci_below | Ci_soil | Ci_dead | Ctot |
|---|---|---|---|---|---|
| Tidal flat | 2.8 | 1.8 | 13.8 | 0.0 | 18.4 |
| Offshore water | 2.0 | 1.0 | 11.0 | 0.0 | 14.0 |
| Coastal marsh | 26.5 | 10.5 | 26.6 | 0.4 | 32.4 |
| River and lake | 1.5 | 0.5 | 11.0 | 0.0 | 13.0 |
| Aquaculture fish pond | 0.5 | 0.0 | 12.0 | 0.0 | 12.5 |
| Paddy field | 9.0 | 4.0 | 38.6 | 0.3 | 25.5 |
| Reservoir | 1.0 | 0.5 | 11.0 | 0.0 | 12.5 |
| Construction land | 0.0 | 0.0 | 8.0 | 0.0 | 8.0 |
| Rainfed cropland | 5.0 | 4.0 | 31.7 | 0.3 | 20.5 |
| Grassland | 2.5 | 11.1 | 26.5 | 0.2 | 40.3 |
| 2015 | |||||||||||
|---|---|---|---|---|---|---|---|---|---|---|---|
| 1990 | Grassland | Offshore Waters | Rivers and Lakes | Construction Land | Paddy Fields | Reservoir | Tidal Flat | Rainfed Cropland | Coastal Marsh | Aquaculture Fish Ponds | Transfer-Out Area |
| Grassland | 0.00 | 0.08 | 0.00 | 0.22 | 0.28 | 0.06 | 0.02 | 0.36 | 0.51 | 0.35 | 1.88 |
| Offshore waters | 1.68 | 0.00 | 1.87 | 14.57 | 31.21 | 50.92 | 158.94 | 24.56 | 124.3 | 61.17 | 469.22 |
| Rivers and lakes | 0.00 | 0.01 | 0.00 | 0.03 | 0.00 | 0.00 | 0.05 | 0.01 | 0.01 | 0.02 | 0.13 |
| Construction land | 0.03 | 0.02 | 0.00 | 0.00 | 0.01 | 0.12 | 0.15 | 0.37 | 0.14 | 0.26 | 1.10 |
| Paddy fields | 0.21 | 0.12 | 0.00 | 0.33 | 0.00 | 0.06 | 0.07 | 1.33 | 0.96 | 1.54 | 4.62 |
| Reservoir | 0.01 | 0.19 | 0.02 | 0.13 | 0.04 | 0.00 | 0.02 | 0.36 | 0.10 | 0.04 | 0.91 |
| Tidal flat | 2.71 | 33.88 | 0.29 | 15.70 | 45.73 | 10.41 | 0.00 | 27.59 | 76.17 | 37.02 | 249.50 |
| Rainfed cropland | 0.78 | 0.10 | 0.01 | 1.23 | 1.94 | 0.54 | 0.72 | 0.00 | 4.26 | 2.88 | 12.46 |
| Aquaculture fish pond | 0.71 | 0.80 | 0.02 | 4.06 | 4.10 | 0.53 | 1.11 | 4.30 | 8.39 | 0.00 | 24.02 |
| Coastal marsh | 5.65 | 2.73 | 0.31 | 6.32 | 41.63 | 1.87 | 2.55 | 26.65 | 0.00 | 24.40 | 112.11 |
| Transfer-in area | 11.78 | 37.93 | 2.52 | 42.59 | 124.94 | 64.51 | 163.63 | 85.53 | 214.84 | 127.68 | — |
| 2000 | |||||||||||
| 1990 | Grassland | Offshore waters | River and Lakes | Construction land | Paddy Fields | Reservoir | Tide flat | Rainfed Cropland | Aquaculture fish pond | Coastal marshes | Transfer-Out area |
| Grassland | 0.00 | 0.07 | 0.01 | 0.13 | 0.49 | 0.02 | 0.12 | 0.27 | 0.54 | 0.33 | 1.98 |
| Offshore waters | 0.12 | 0.00 | 0.01 | 5.45 | 7.69 | 4.61 | 238.49 | 5.98 | 22.39 | 36.31 | 321.05 |
| River and lakes | 0.00 | 0.02 | 0.00 | 0.01 | 0.00 | 0.00 | 0.04 | 0.01 | 0.04 | 0.01 | 0.13 |
| Construction land | 0.02 | 0.04 | 0.00 | 0.00 | 0.15 | 0.07 | 0.16 | 0.33 | 0.27 | 0.03 | 1.07 |
| Paddy fields | 0.07 | 0.12 | 0.02 | 0.40 | 0.00 | 0.04 | 0.33 | 1.57 | 1.37 | 0.91 | 4.83 |
| Reservoir | 0.00 | 0.48 | 0.00 | 0.18 | 0.01 | 0.00 | 0.22 | 0.08 | 0.09 | 0.01 | 1.07 |
| Tide flat | 0.50 | 33.45 | 0.45 | 3.15 | 15.77 | 1.14 | 0.00 | 18.67 | 19.12 | 88.42 | 180.67 |
| Rainfed cropland | 0.17 | 0.25 | 0.02 | 0.72 | 2.49 | 0.17 | 1.50 | 0.00 | 3.55 | 3.81 | 12.68 |
| Aquaculture fish pond | 0.10 | 1.12 | 0.18 | 1.11 | 3.70 | 0.03 | 4.60 | 3.55 | 0.00 | 6.38 | 20.77 |
| Coastal marsh | 0.82 | 3.11 | 0.91 | 3.27 | 17.95 | 0.12 | 6.82 | 45.79 | 24.97 | 0.00 | 103.76 |
| Transfer-in area | 1.80 | 38.66 | 1.60 | 14.42 | 48.25 | 6.20 | 252.28 | 76.25 | 72.34 | 136.21 | — |
| 2009 | |||||||||||
| 2000 | Grassland | Offshore waters | River and Lakes | Construction land | Paddy Fields | Reservoir | Tide flat | Rainfed Cropland | Aquaculture fish pond | Coastal marshes | Transfer-Out area |
| Grassland | 0.00 | 0.00 | 0.00 | 0.08 | 0.85 | 0.00 | 0.00 | 0.37 | 0.13 | 0.29 | 1.72 |
| Offshore waters | 0.03 | 0.00 | 0.76 | 5.54 | 0.94 | 49.82 | 128.47 | 5.47 | 13.33 | 14.58 | 218.94 |
| River and lakes | 0.02 | 0.00 | 0.00 | 0.31 | 0.11 | 0.00 | 0.18 | 0.29 | 0.29 | 0.40 | 1.60 |
| Construction land | 0.06 | 0.14 | 0.00 | 0.00 | 0.32 | 0.17 | 1.11 | 5.3 | 2.86 | 0.92 | 10.88 |
| Paddy fields | 0.79 | 0.78 | 0.08 | 2.45 | 0.00 | 1.19 | 1.16 | 8.56 | 7.52 | 16.06 | 38.59 |
| Reservoir | 0.00 | 1.13 | 0.00 | 1.02 | 0.01 | 0.00 | 0.26 | 0.18 | 0.42 | 0.23 | 3.25 |
| Tide flat | 0.50 | 66.72 | 1.24 | 8.56 | 12.72 | 22.83 | 0.00 | 23.39 | 35.50 | 81.66 | 253.12 |
| Rainfed cropland | 1.19 | 0.35 | 0.07 | 2.36 | 35.86 | 0.19 | 2.62 | 0.00 | 6.12 | 9.08 | 57.84 |
| Aquaculture fish pond | 1.29 | 8.57 | 0.18 | 6.22 | 9.53 | 2.00 | 6.23 | 12.01 | 0.00 | 13.48 | 59.51 |
| Coastal marsh | 2.01 | 4.41 | 0.12 | 6.72 | 14.52 | 1.01 | 6.75 | 21.35 | 18.96 | 0.00 | 75.85 |
| Transfer-in area | 5.97 | 82.10 | 2.45 | 33.26 | 74.86 | 77.21 | 146.78 | 76.92 | 85.13 | 136.70 | — |
| 2015 | |||||||||||
| 2009 | Grassland | Offshore waters | River and Lakes | Construction land | Paddy Fields | Reservoir | Tide flat | Rainfed Cropland | Aquaculture fish pond | Coastal marshes | Transfer-Out area |
| Grassland | 0.00 | 0.00 | 0.00 | 0.21 | 2.07 | 0.01 | 0.02 | 1.42 | 0.83 | 1.06 | 5.62 |
| Offshore waters | 0.07 | 0.00 | 1.34 | 3.44 | 1.20 | 2.24 | 148.24 | 2.91 | 9.95 | 20.22 | 189.61 |
| River and lakes | 0.01 | 0.05 | 0.00 | 0.09 | 0.50 | 0.21 | 0.00 | 0.19 | 0.58 | 0.81 | 2.44 |
| Construction land | 0.14 | 0.53 | 0.02 | 0.00 | 1.00 | 0.39 | 1.98 | 4.61 | 5.09 | 1.90 | 15.66 |
| Paddy fields | 4.95 | 0.01 | 0.18 | 0.81 | 0.00 | 0.17 | 0.24 | 16.71 | 9.92 | 12.26 | 45.25 |
| Reservoir | 0.11 | 6.28 | 0.83 | 0.38 | 4.53 | 0.00 | 2.83 | 1.38 | 6.37 | 7.43 | 30.14 |
| Tide flat | 0.34 | 54.25 | 0.59 | 3.85 | 6.18 | 2.45 | 0.00 | 7.46 | 21.78 | 53.78 | 150.68 |
| Rainfed cropland | 2.72 | 0.03 | 0.01 | 5.46 | 28.19 | 0.40 | 0.80 | 0.00 | 15.14 | 19.36 | 72.11 |
| Aquaculture fish pond | 0.67 | 1.66 | 0.31 | 5.49 | 12.05 | 6.92 | 4.29 | 9.94 | 0.00 | 28.36 | 69.69 |
| Coastal marsh | 3.07 | 0.61 | 0.08 | 4.60 | 30.63 | 5.44 | 8.41 | 21.16 | 29.84 | 0.00 | 103.84 |
| Transfer-in area | 12.08 | 63.42 | 3.36 | 24.33 | 86.35 | 18.23 | 166.81 | 65.78 | 99.50 | 145.18 | — |
| Driving Process | Total (Mg) | Magnitude (Mg/ha) | Categories | Attribute |
|---|---|---|---|---|
| R | −141,945.05 | −6.24 | Mono− | Human |
| E | −32,146.32 | −8.82 | Mono− | Natural |
| Rs-R | −17,943.62 | −38.66 | Multiple− | Natural–Human |
| R-Re-R | −12,722.48 | −4.72 | Multiple− | Human |
| Rs | −2937.84 | −43.40 | Mono− | Natural |
| Rs-E | −2749.99 | −50.01 | Multiple− | Natural |
| E-R | −2599.15 | −6.70 | Multiple− | Natural–Human |
| Rs-S-R | −1519.68 | −28.13 | Multiple− | Natural–Human |
| E-A-E | −1211.05 | −13.06 | Multiple− | Natural |
| S-E-R | 1016.51 | 24.55 | Multiple+ | Natural–Human |
| A-Rs | 1104.87 | 6.60 | Multiple+ | Natural |
| A-Rs-S | 1287.70 | 49.51 | Multiple+ | Natural |
| A-S-Rs | 2252.43 | 6.60 | Multiple+ | Natural |
| A-E-R | 2741.35 | 9.85 | Multiple+ | Natural–Human |
| R-Re-S | 3009.98 | 18.04 | Multiple+ | Natural–Human |
| E-R-Re | 3153.11 | 21.71 | Multiple+ | Natural–Human |
| Re-R | 3285.47 | 2.57 | Multiple+ | Human |
| E-A-S | 4847.99 | 41.31 | Multiple+ | Natural |
| S-Rs-R | 4882.34 | 18.48 | Multiple+ | Natural–Human |
| Re-S | 6396.07 | 35.88 | Multiple+ | Natural–Human |
| Re-R-Re | 9568.51 | 33.32 | Multiple+ | Human |
| E-A | 12,143.60 | 9.82 | Multiple+ | Natural |
| S-R-Re | 22,811.57 | 37.67 | Multiple+ | Natural–Human |
| A-S-R | 32,424.10 | 16.66 | Multiple+ | Natural–Human |
| Re | 38,868.58 | 29.97 | Mono+ | Human |
| A-E-A | 46,761.63 | 26.11 | Multiple+ | Natural |
| S-R | 58,399.40 | 10.21 | Multiple+ | Natural–Human |
| A-R-Re | 82,106.25 | 41.73 | Multiple+ | Natural–Human |
| A-R | 102,806.38 | 11.72 | Multiple+ | Natural–Human |
| R-Re | 158,546.30 | 18.12 | Multiple+ | Human |
| S | 214,231.34 | 42.52 | Mono+ | Natural |
| A | 315,009.94 | 13.17 | Mono+ | Natural |
| A-S | 381,527.51 | 49.67 | Multiple+ | Natural |
Publisher’s Note: MDPI stays neutral with regard to jurisdictional claims in published maps and institutional affiliations. |
© 2021 by the authors. Licensee MDPI, Basel, Switzerland. This article is an open access article distributed under the terms and conditions of the Creative Commons Attribution (CC BY) license (https://creativecommons.org/licenses/by/4.0/).
Share and Cite
Cai, W.; Zhu, Q.; Chen, M.; Cai, Y. Spatiotemporal Change and the Natural–Human Driving Processes of a Megacity’s Coastal Blue Carbon Storage. Int. J. Environ. Res. Public Health 2021, 18, 8879. https://doi.org/10.3390/ijerph18168879
Cai W, Zhu Q, Chen M, Cai Y. Spatiotemporal Change and the Natural–Human Driving Processes of a Megacity’s Coastal Blue Carbon Storage. International Journal of Environmental Research and Public Health. 2021; 18(16):8879. https://doi.org/10.3390/ijerph18168879
Chicago/Turabian StyleCai, Wenbo, Qing Zhu, Meitian Chen, and Yongli Cai. 2021. "Spatiotemporal Change and the Natural–Human Driving Processes of a Megacity’s Coastal Blue Carbon Storage" International Journal of Environmental Research and Public Health 18, no. 16: 8879. https://doi.org/10.3390/ijerph18168879
APA StyleCai, W., Zhu, Q., Chen, M., & Cai, Y. (2021). Spatiotemporal Change and the Natural–Human Driving Processes of a Megacity’s Coastal Blue Carbon Storage. International Journal of Environmental Research and Public Health, 18(16), 8879. https://doi.org/10.3390/ijerph18168879


