
Evaluation of the Policy Effect of China’s Environmental Interview System for Effective Air Quality Governance


Abstract
:1. Introduction
2. Materials and Methods
2.1. Study Area and Data Sources
2.2. Methodology
2.2.1. Dynamic Panel Model
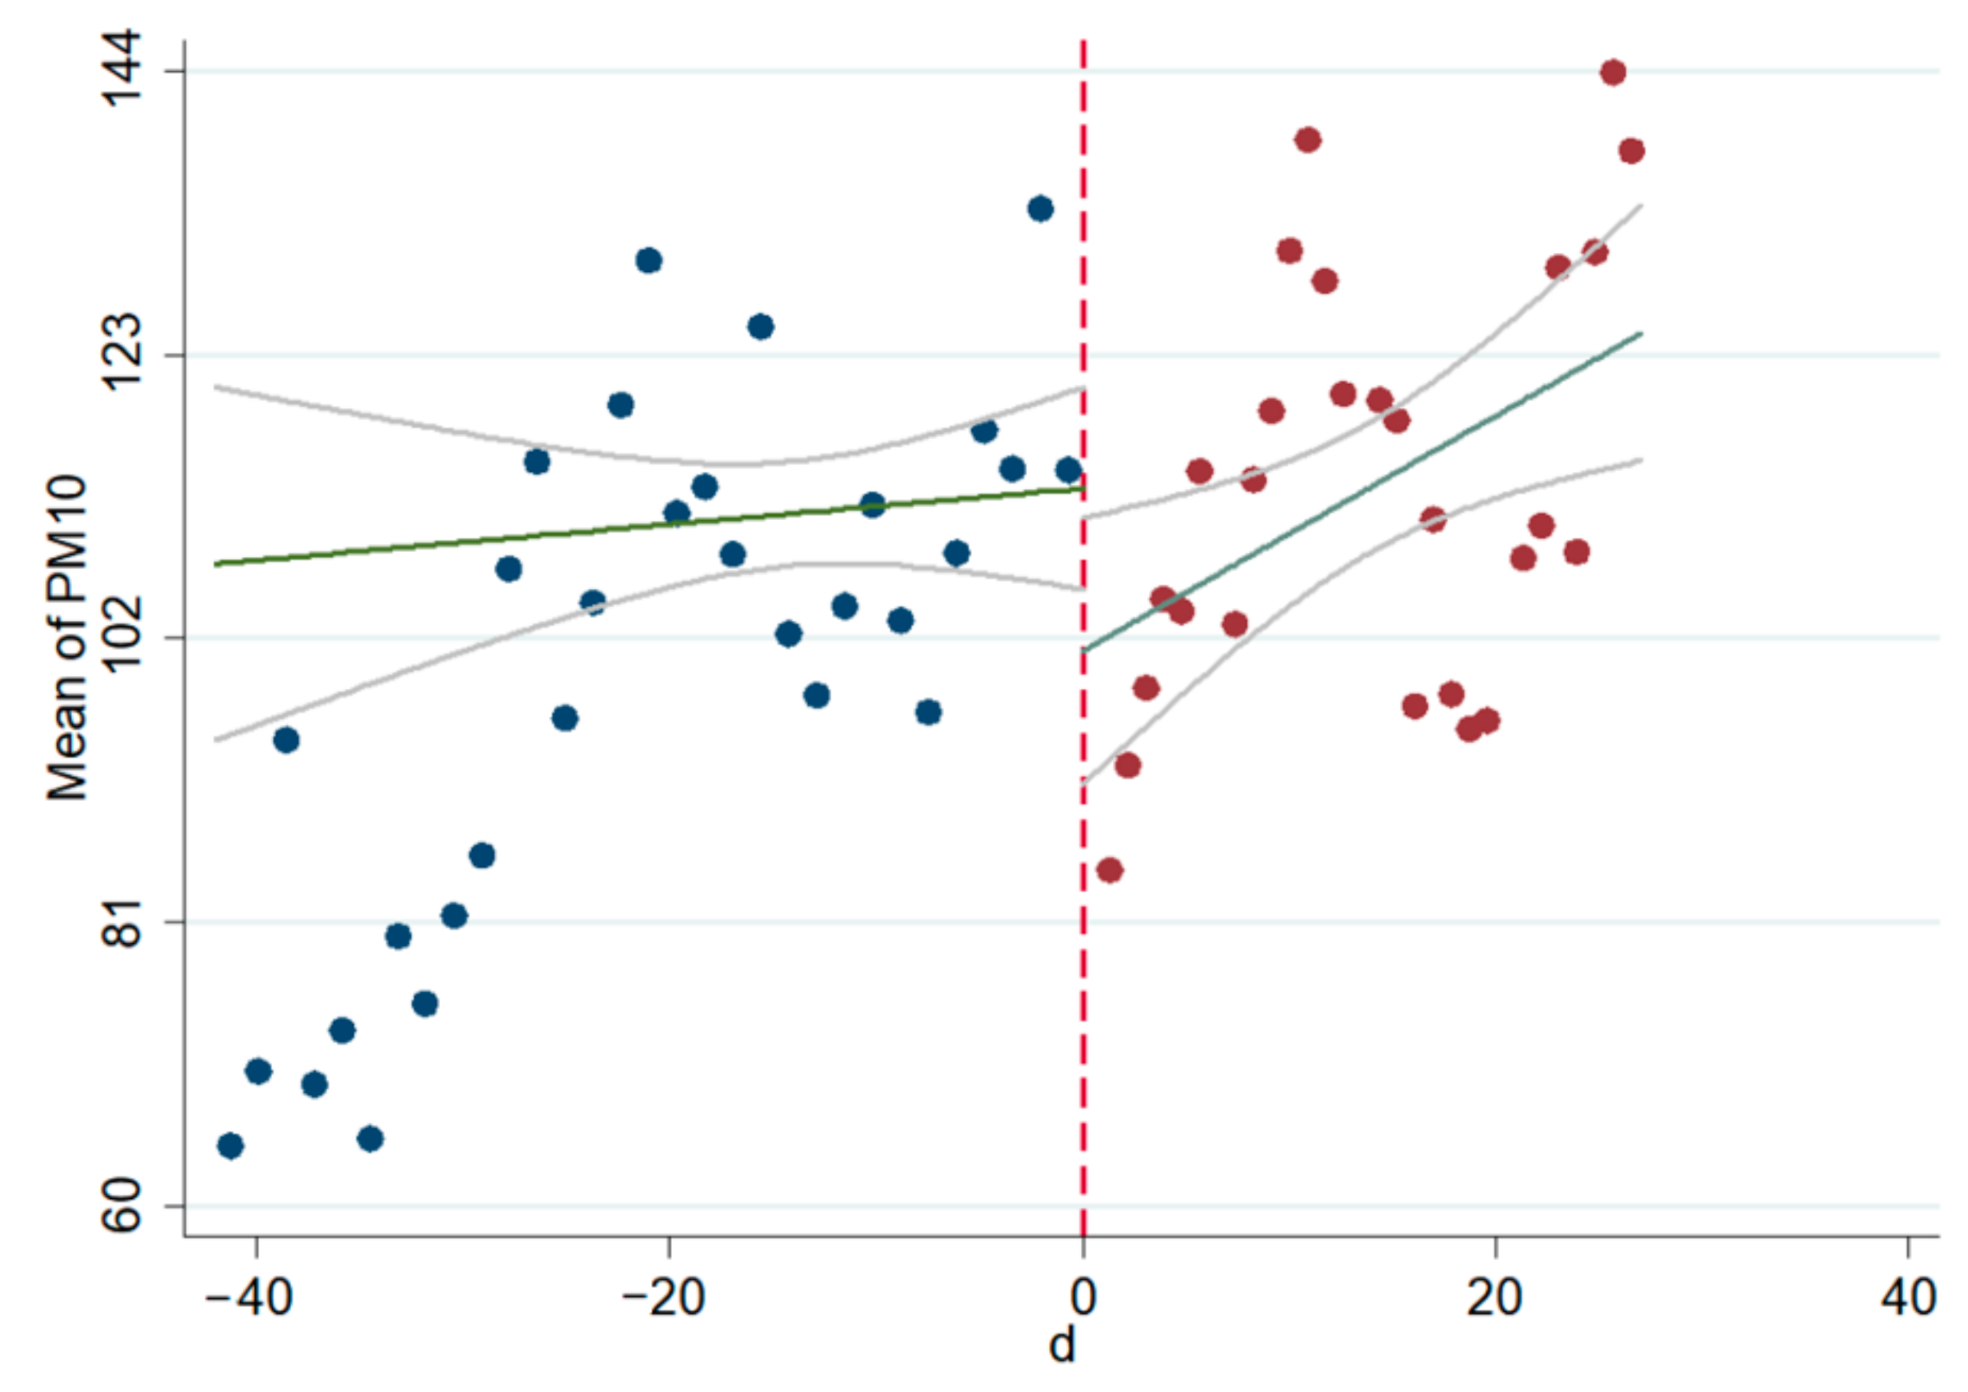
2.2.2. Regression Discontinuity Model
3. Empirical Results and Analysis
3.1. Results of the Least Squares Dummy Variable Analysis
- (1)
- For the two dummy variables of rainfall and snowfall, the LSDV regression results show that rainfall significantly improved air quality more than snowfall. In terms of the effect of rainfall, the concentrations of pollutants such as AQI, PM2.5, PM10, SO2, NO2, and O3 were observed to be significantly negative, whereas CO was not. In terms of the effect of snowfall on the concentrations of pollutants, only SO2 was observed to be significantly negative while the remaining pollutants were negative too but not significantly so because the solubility of rainwater is better than that of snow; PM2.5, PM10, SO2, NO2, and CO dissolve in rainwater easily compared to snow and, therefore, the increase in precipitation frequency and rainfall results in increased concentrations of pollutants being dissolved, thereby reducing the concentration of pollutants in the air. Interestingly, SO2 was significantly lower during snowy weather because people will avoid using private cars and taxis to ensure travel safety resulting in lower vehicular exhaust emissions than usual.
- (2)
- Maximum temperature was positively and significantly correlated with values of AQI, PM2.5, PM10, NO2, CO, and O3 values, and it was positive but not significant for SO2. This means that the higher the maximum temperature, the greater the concentration of pollutants (AQI, PM2.5, PM10, SO2, NO2, CO, and O3), and the higher the degree of pollution. Elevation can improve the efficiency of pollutant decomposition and conversion, thereby reducing the concentrations of pollutants. However, after an in-depth analysis, we found that the highest temperature of the day was often accompanied by sunlight, temperature, and time; generally, the highest temperature occurs in the middle of the day at about 14:00 h. Under these circumstances, the lighting conditions were better, and SO2 and NO2 encounter light and heat to undergo chemical reactions, which result in the formation of gaseous multi-oxides. Correspondingly, the concentration of pollutants in the air will not be reduced. In addition, as daytime is the most active time for humans, this is the time when industrial, residential, and automobile, emissions are at their peak. At the highest temperature, sufficient light accelerates the generation of pollutants and their derivatives, whereas from morning to noon, accumulation is at its peak. The higher the maximum temperature, the more the amount of SO2 and NO2 pollutants released into the air, increasing air pollution.
- (3)
- Maximum wind speed has a significantly negative correlation with all the pollutants, which means that the higher the wind speed, the lower the concentration of pollutants in the air. This is because, for a city (district, county), under certain conditions of pollutant concentration, the atmospheric diffusion capacity is related to the concentration of pollutants in the air—i.e., the greater the wind speed—the more the diffusion and transportation of pollutants.
3.2. Determination of Discontinuity Location
3.3. Analysis of Short-Term Effects
3.4. Analysis of Long-Term Effects
4. Robustness Tests
4.1. Control Group Analysis
4.2. Sensitivity Analysis of Bandwidth
4.3. Validation of Air Quality
5. Discussion
- (1)
- The environmental interview system is too complex to quantify every aspect and throw into a regression equation. Other possible explanations for the observed changes should be considered, explored, and addressed in the future.
- (2)
- The sample can be subdivided to accommodate multiple perspectives to carefully consider the factors influencing policy transmission; more angles can be used for comparative analysis.
- (3)
- The choice of cities in the control group is crucial. It needs to be comprehensively considered from the aspects of population statistics, political system, political factors, and dependent variables. More control variables can be added, and the processing of variables can be more quantitative and refined to obtain assessment results with higher accuracy [47].
6. Conclusions
- (1)
- The regression discontinuity (RD) method, for both the whole sample and subsample, shows that the implementation of the environmental protection interview system improved air quality. Concentrations PM2.5 and PM10 were significantly reduced and were consistent in terms of environmental protection performance.
- (2)
- RD analysis of the long-term sustained effect of the interview system conducted using weekly average data showed air quality improvement and reduction in the concentrations of PM2.5 and PM10. However, the effect was not significant.
- (3)
- By removing likely ranges in which data falsification can occur the control group was analyzed using bandwidth sensitivity test, and the validation RD analysis proved that the interview system can improve air quality by ruling out data falsification.
Author Contributions
Funding
Institutional Review Board Statement
Informed Consent Statement
Data Availability Statement
Acknowledgments
Conflicts of Interest
Appendix A

| Experimental Group | Control Group | (a) | (b) | |
|---|---|---|---|---|
| 1 | Shenyang | Fushun | Yes | Yes |
| 2 | Kunming | Yuxi | No | No |
| 3 | Changchun | Jilin | Yes | Yes |
| 4 | Zhumadian | Luohe | No | No |
| 5 | Baoding | Shijiazhuang | Yes | No |
| 6 | Wuxi | Changzhou | No | No |
| 7 | Ziyang | Neijiang | No | No |
| 8 | Zhangye | Jinchang | Yes | No |
| 9 | Siping | Changchun | Yes | No |
| 10 | Jingdezhen | Nanchang | No | No |
| 11 | Zibo | Ji’nan | Yes | No |
| 12 | Anyang | Hebi | Yes | Yes |
| 13 | Harbin | Daqing | Yes | Yes |
| 14 | Cangzhou | Tianjin | Yes | Yes |
| 15 | Linyi | Rizhao | Yes | Yes |
| 16 | Chengde | Langfang | Yes | Yes |
| 17 | Lvliang | Taiyuan | Yes | No |
| 18 | Ma’anshan | Wuhu | No | No |
| 19 | Xingtai | Shijiazhuang | Yes | No |
| 20 | Zhengzhou | Shijiazhuang | Yes | No |
| 21 | Nanyang | Pingdingshan | No | No |
| 22 | Baise | Hechi | No | No |
| 23 | Haixi | Hainan | Yes | Yes |
| 24 | Dezhou | Liaocheng | Yes | Yes |
| 25 | Jining | Tai’an | Yes | No |
| 26 | Shangqiu | Zhoukou | Yes | No |
| 27 | Anqing | Chizhou | No | No |
| 28 | Changzhou | Jincheng | Yes | No |
| 29 | Xianyang | Xi’an | Yes | No |
| 30 | Yangquan | Taiyuan | Yes | Yes |
| 31 | Weinan | Xi’an | Yes | Yes |
| 32 | Linfen | Yuncheng | Yes | Yes |
| 33 | Beijing | Langfang | Yes | No |
| 34 | Tianjin | Langfang | Yes | No |
| 35 | Shijiazhuang | Xingtai | Yes | No |
| 36 | Tangshan | Tianjin | Yes | No |
| 37 | Handan | Xingtai | Yes | No |
| 38 | Hengshui | Cangzhou | Yes | No |
| 39 | Yuncheng | Jincheng | Yes | No |
| 40 | Tianjin② | Langfang | Yes | No |
| 41 | Handan ② | Langfang | Yes | No |
| 42 | Baoding ② | Shijiazhuang | Yes | No |
| 43 | Xinxiang | Jiaozuo | Yes | No |
| 44 | Harbin ② | Suihua | Yes | Yes |
| 45 | Jiamusi | Qitaihe | Yes | Yes |
| 46 | Shuangyashan | Jixi | Yes | Yes |
| 47 | Hegang | Yichun | Yes | Yes |
| 48 | Linfen ② | Yuncheng | Yes | No |
References
- Zhang, Q.; Crooks, R. Toward an Environmentally Sustainable Future: Country Environmental Analysis of the People’s Republic of China; Asian Development Bank: Mandaluyong City, Philippines, 2012; Available online: https://think-asia.org/bitstream/handle/11540/880/toward-environmentally-sustainable-future-prc.pdf?sequence=1 (accessed on 25 October 2010).
- Cao, L.; Chen, Y.; Dong, S.; Hanson, A.; Huang, B.; Leadbitter, D.; Little, D.C.; Pikitch, E.K.; Qiu, Y.; Mitcheson, Y.S. Opportunity for marine fisheries reform in China. Proc. Natl. Acad. Sci. USA 2017, 114, 435–442. [Google Scholar] [CrossRef] [PubMed] [Green Version]
- Feng, Y.; Cheng, J.H.; Shen, J.; Sun, H. Spatial Effects of Air Pollution on Public Health in China. Environ. Resour. Econ. 2019, 73, 229–250. [Google Scholar] [CrossRef]
- Li, R.; Wang, Z.; Cui, L.; Fu, H.; Zhang, L.; Kong, L.; Chen, W.; Chen, J. Air pollution characteristics in China during 2015–2016: Spatiotemporal variations and key meteorological factors. Sci. Total Environ. 2019, 648, 902–915. [Google Scholar] [CrossRef] [PubMed]
- Rooney, B.; Wang, Y.; Jiang, J.H.; Zhao, B.; Zeng, Z.C.; Seinfeld, J.H. Air quality impact of the Northern California Camp Fire of November 2018. Atmos. Chem. Phys. 2020, 20, 14597–14616. [Google Scholar] [CrossRef]
- Shen, L.; Zhao, T.; Wang, H.; Liu, J.; Bai, Y.; Kong, S.; Zheng, H.; Zhu, Y.; Shu, Z. Importance of meteorology in air pollution events during the city lockdown for COVID-19 in Hubei Province, Central China. Sci. Total Environ. 2021, 754, 142227. [Google Scholar] [CrossRef]
- Vikrant, K.; Kwon, E.E.; Kim, K.H.; Sonne, C.; Kang, M.; Shon, Z.H. Air Pollution and Its Association with the Greenland Ice Sheet Melt. Sustainability 2021, 13, 65. [Google Scholar] [CrossRef]
- Sweeney, S.; Ordonez-Hurtado, R.; Pilla, F.; Russo, G.; Timoney, D.; Shorten, R. A context-aware e-bike system to reduce pollution inhalation while cycling. IEEE Trans. Intell. Transp. Syst. 2018, 20, 704–715. [Google Scholar] [CrossRef] [Green Version]
- Brewer, T.L. Black Carbon and Other Air Pollutants in Italian Ports and Coastal Areas: Problems. Solut. Implic. Policies Appl. Sci. 2020, 10, 8544. [Google Scholar] [CrossRef]
- Sicard, P.; Crippa, P.; De, M.A.; Castruccio, S.; Giani, P.; Cuesta, J.; Paoletti, E.; Feng, Z.; Anav, A. High spatial resolution WRF-Chem model over Asia: Physics and chemistry evaluation. Atmos. Environ. 2021, 244, 118004. [Google Scholar] [CrossRef]
- Wang, Z.Y.; Shi, X.Y.; Pan, C.H.; Wang, S.S. Spatial and Temporal Characteristics of Environmental Air Quality and Its Relationship with Seasonal Climatic Conditions in Eastern China during 2015–2018. Int. J. Environ. Res. Public Health 2019, 18, 4524. [Google Scholar] [CrossRef]
- Lu, K.; Guo, S.; Tan, Z.; Wang, H.; Shang, D.; Liu, Y.; Li, X.; Wu, Z.; Hu, M.; Zhang, Y. Exploring atmospheric free-radical chemistry in China: The self-cleansing capacity and the formation of secondary air pollution. Natl. Sci. Rev. 2019, 6, 579–594. [Google Scholar] [CrossRef] [Green Version]
- Klingmüller, K.; Karydis, V.A.; Bacer, S.; Stenchikov, G.L.; Lelieveld, J. Weaker cooling by aerosols due to dust–pollution interactions. Atmos. Chem. Phys. 2020, 20, 15285–15295. [Google Scholar] [CrossRef]
- Bai, W.; Fan, Y.; Wang, F.; Mu, P.; Sun, H.; Zhu, Z.; Liang, W.; Li, A. Facile synthesis of porous organic polymers (POPs) membrane via click chemistry for efficient PM2. 5 capture. Sep. Purif. Technol. 2021, 258, 118049. [Google Scholar] [CrossRef]
- Jat, R.; Gurjar, B.R.; Lowe, D. Regional pollution loading in winter months over India using high resolution WRF-Chem simulation. Atmos. Res. 2021, 249, 105326. [Google Scholar] [CrossRef]
- Peng, J.; Zhang, Y.; Xie, R.; Liu, Y. Analysis of driving factors on China’s air pollution emissions from the view of critical supply chains. J. Clean. Prod. 2018, 203, 197–209. [Google Scholar] [CrossRef]
- Zheng, Y.; Peng, J.; Xiao, J.; Su, P.; Li, S. Industrial structure transformation and provincial heterogeneity characteristics evolution of air pollution: Evidence of a threshold effect from China. Atmos. Pollut. Res. 2020, 11, 598–609. [Google Scholar] [CrossRef]
- Azimi, M.; Feng, F.; Zhou, C. Environmental policy innovation in China and examining its dynamic relations with air pollution and economic growth using SEM panel data. Environ. Sci. Pollut. Res. 2020, 27, 9987–9998. [Google Scholar] [CrossRef]
- Xie, Y.; Dai, H.; Zhang, Y.; Wu, Y.; Hanaoka, T.; Masui, T. Comparison of health and economic impacts of PM2. 5 and ozone pollution in China. Environ. Int. 2019, 130, 104881. [Google Scholar] [CrossRef] [PubMed]
- Fu, X.; Li, L.; Lei, Y.; Wu, S.; Yan, D.; Luo, X.; Luo, H. The economic loss of health effect damages from PM 2.5 pollution in the Central Plains Urban Agglomeration. Environ. Sci. Pollut. Res. 2020, 27, 25434–25449. [Google Scholar] [CrossRef] [PubMed]
- Meya, J.N. Environmental Inequality and Economic Valuation. Environ. Resour. Econ. 2020, 76, 235–270. [Google Scholar] [CrossRef]
- Chay, K.Y.; Greenstone, M. The impact of air pollution on infant mortality: Evidence from geographic variation in pollution shocks induced by a recession. Q. J. Econ. 2003, 118, 1121–1167. [Google Scholar] [CrossRef]
- Hering, L.; Poncet, S. Environmental policy and exports: Evidence from Chinese cities. J. Environ. Econ. Manag. 2014, 68, 296–318. [Google Scholar] [CrossRef]
- Antimiani, A.; Costantini, V.; Kuik, O.; Paglialunga, E. Mitigation of adverse effects on competitiveness and leakage of unilateral EU climate policy: An assessment of policy instruments. Ecol. Econ. 2016, 128, 246–259. [Google Scholar] [CrossRef]
- Zhang, B.; Chen, X.; Guo, H. Does central supervision enhance local environmental enforcement? Quasi-experimental evidence from China. J. Public Econ. 2018, 164, 70–90. [Google Scholar] [CrossRef]
- Nabernegg, S.; Bednar-Friedl, B.; Muñoz, P.; Titz, M.; Vogel, J. National policies for global emission reductions: Effectiveness of carbon emission reductions in international supply chains. Ecol. Econ. 2019, 158, 146–157. [Google Scholar] [CrossRef]
- Wang, J.; Wang, K.; Shi, X.; Wei, Y.M. Spatial heterogeneity and driving forces of environmental productivity growth in China: Would it help to switch pollutant discharge fees to environmental taxes? J. Clean. Prod. 2019, 223, 36–44. [Google Scholar] [CrossRef]
- Zhang, Y.; Li, S.; Zhang, F. Does an Emissions Trading Policy Improve Environmental Efficiency? Evidence from China. Sustainability 2020, 12, 2165. [Google Scholar] [CrossRef] [Green Version]
- Chen, S.; Shi, A.; Wang, X. Carbon emission curbing effects and influencing mechanisms of China’s Emission Trading Scheme: The mediating roles of technique effect, composition effect and allocation effect. J. Clean. Prod. 2020, 264, 121700. [Google Scholar] [CrossRef]
- Interim Measures for Interview of Ministry of Environmental Protection; Ministry of Environmental Protection: Beijing, China, 2014.
- Pranis, K. Restorative justice, social justice, and the empowerment of marginalized populations. In Restorative Community Justice: Repairing Harm and Transforming Communities; Bazemore, G., Schiff, M., Eds.; Anderson Publishing: Cincinnati, OH, USA, 2001; pp. 76–135. [Google Scholar]
- Meyercord, L. Avoiding state bankruptcy: Mediation as an alternative to resolving state tax disputes. Rev. Litig. 2010, 29, 925–950. Available online: https://heinonline.org/HOL/LandingPage?handle=hein.journals/rol29&div=29&id=&page= (accessed on 12 July 2010).
- Hanlon, M.; Heitzman, S. A review of tax research. J. Account. Econ. 2010, 50, 127–178. [Google Scholar] [CrossRef] [Green Version]
- Choi, Y.J.; Hahn, K.S. How does a corporate leniency program affect cartel stability? Empirical evidence from Korea. J. Compet. Law Econ. 2014, 10, 883–907. [Google Scholar] [CrossRef]
- Shi, Q.L.; Chen, S.Y.; Guo, F. Interviews with the Ministry of Environmental Protection and environmental governance: Taking air pollution as an example. Stat. Res. 2017, 34, 88–97. [Google Scholar]
- Wu, J.; Wang, R.; Management, S.O.; University, L. Have the Talk with Local Officials about Environmental Protection Promoted the Efficiency of Local Government Environmental Governance?—Empirical Analysis Based on Difference in Differences Method. J. Public Manag. 2019. Available online: https://en.cnki.com.cn/Article_en/CJFDTotal-GGGL201901005.htm (accessed on 16 November 2018).
- Viard, V.B.; Fu, S. The effect of Beijing’s driving restrictions on pollution and economic activity. J. Public Econ. 2015, 125, 98–115. [Google Scholar] [CrossRef] [Green Version]
- Lee, D.S.; Lemieux, T. Regression discontinuity designs in economics. J. Econ. Lit. 2010, 48, 281–355. [Google Scholar] [CrossRef] [Green Version]
- Ghanem, D.; Zhang, J. Effortless Perfection: Do Chinese cities manipulate air pollution data? J. Environ. Econ. Manag. 2014, 68, 203–225. [Google Scholar] [CrossRef]
- Tao, C.L.; Diao, G.; Cheng, B.D. The Dynamic Impact of the COVID-19 Pandemic on Air Quality: The Beijing Lessons. Int. J. Environ. Res. Public Health 2021, 18, 6478. [Google Scholar] [CrossRef]
- Jin, X.; Sumaila, U.R.; Yin, K.D. Direct and Indirect Loss Evaluation of Storm Surge Disaster Based on Static and Dynamic Input-Output Models. Sustainability 2020, 12, 7347. [Google Scholar] [CrossRef]
- Yin, K.D.; Liu, Z.; Jin, X. Interindustry volatility spillover effects in China’s stock market. Phys. A Stat. Mech. Its Appl. 2020, 539, 122936. [Google Scholar] [CrossRef]
- Zhu, J.; Jiang, D.Q.; Shen, Y.J.; Shen, Y.X. Does regional air quality affect executive turnover at listed companies in China? Econ. Model. 2021, 97, 428–436. [Google Scholar] [CrossRef]
- Mousavi, A.; Yuan, Y.T.; Masri, S.; Barta, G.; Wu, J. Impact of 4th of July Fireworks on Spatiotemporal PM2.5 Concentrations in California Based on the PurpleAir Sensor Network: Implications for Policy and Environmental Justice. Int. J. Environ. Res. Public Health 2021, 18, 5735. [Google Scholar] [CrossRef] [PubMed]
- Thach, T.; Mahirah, D.; Sauter, C.; Roberts, A.C.; Dunleavy, G.; Nazeha, N.; Rykov, Y.; Zhang, Y.C.; Christopoulos, G.I.; Soh, C.K.; et al. Associations of perceived indoor environmental quality with stress in the workplace. Indoor Air 2020, 30, 1166–1177. [Google Scholar] [CrossRef] [PubMed]
- Lenschow, A.; Becker, S.T.; Mehl, C. Scalar dynamics and implications of ambient air quality management in the EU. J. Environ. Policy Plan. 2017, 19, 520–533. [Google Scholar] [CrossRef]
- Gary, K.; Robert, O.K.; Sidney, V. Designing Social Inquiry, Scientific Inference in Qualitative Research; Princeton University Press: New Jersey, NJ, USA, 1994. [Google Scholar]
- Zhu, Y.C.; Han, S.; Zhang, Y.M.; Huang, Q. Evaluating the Effect of Government Emission Reduction Policy: Evidence from Demonstration Cities in China. Int. J. Environ. Res. Public Health 2021, 18, 4649. [Google Scholar] [CrossRef] [PubMed]
- Khan, M.; Chaudhry, M.N. Role of and challenges to environmental impact assessment proponents in Pakistan. Environ. Impact Assess. Rev. 2021, 90, 106606. [Google Scholar] [CrossRef]


| Variable Symbol | Unit | Meaning | |
|---|---|---|---|
| Dependent variables | AQI | Index | It is the air quality index while considering GB3095-2012 * ambient air quality standard (current), as the reference standard, and the concentration of pollutants (SO2, NO2, PM10, PM2.5, O3, and CO); their corresponding indices are published once every hour. |
| PM2.5 | μg/m3 | It is the fine particulate matter, aerodynamically less than or equal to 2.5 microns in diameter; it is divided into natural sources (such as dust) and anthropogenic sources (such as primary and secondary particulate matter). | |
| PM10 | μg/m3 | It is a respirable particulate matter, with an aerodynamic diameter of less than or equal to 10 microns. | |
| SO2 | μg/m3 | The concentration of sulfur dioxide. | |
| NO2 | μg/m3 | The concentration of nitrogen dioxide. | |
| CO | mg/m3 | The concentration of carbon monoxide. | |
| O3 | μg/m3 | The concentration of ozone. | |
| Independent variables | T | Dummy variable | It is also known as the driver variable, which is 0 before the interview and 1 after the interview; it indicates the policy treatment effect in RD. |
| d | Days or weeks | It indicates the number of days or weeks from the date of the interview; negative values imply pre-interview; other values imply post-interview. | |
| f(d) | It is a polynomial function with “d” as the independent variable, i.e., air quality improvement resulting from the gradual advancement of pollution prevention efforts. | ||
| Control variables | I | Dummy variable | It is 1 if there is public heating; otherwise, it is 0. |
| J | Dummy variable | It is 1 if the sample is in the heating period; otherwise, it is 0. | |
| K | Dummy variable | It is 1 if the day is a working day; otherwise, it is 0. | |
| YU | Dummy variable | It is 1 if it has rained on that day but not yet snowed; 0 if it has not yet rained. | |
| XUE | Dummy variable | It is 1 if it has snowed on that day; otherwise, it is 0. | |
| MAXT | °C | The highest temperature of the day. | |
| MINT | °C | The lowest temperature of the day. | |
| MAXW | Level | Maximum wind strength for the day. |
| The Dependent Variable | AQI | PM2.5 | PM10 | SO2 | NO2 | CO | O3 |
|---|---|---|---|---|---|---|---|
| T | −3.49 ** | −3.38 ** | −4.308 ** | −2.038 ** | −0.948 ** | −0.06 *** | 1.73 *** |
| YU | −6.93 *** | −3.03 * | −9.85 *** | −3.10 *** | −1.75 *** | −0.01 | −8.95 *** |
| XUE | −3.44 | −5.38 | −5.47 | −8.72 *** | −1.51 | −0.04 | −1.25 |
| MAXT | 1.31 *** | 0.66 ** | 2.16 *** | 0.31 | 0.43 *** | 0.01 ** | 0.84 *** |
| MINT | −1.00 *** | −0.51 * | −1.70 *** | −0.59 *** | −0.58 *** | −0.01 *** | −0.01 |
| MAXW | −7.41 *** | −9.86 *** | −6.64 *** | −6.86 *** | −4.96 *** | −0.13 *** | 1.93 *** |
| Lag of first order | 0.58 *** | 0.61 *** | 0.54 *** | 0.70 *** | 0.56 *** | 0.57 *** | 0.61 *** |
| Constant term | 55.08 *** | 54.24 *** | 53.20 *** | 36.24 *** | 31.35 *** | 0.98 *** | 4.26 * |
| (1) | Yes | Yes | Yes | Yes | Yes | Yes | Yes |
| (2) | Yes | Yes | Yes | Yes | Yes | Yes | Yes |
| (3) | Yes | Yes | Yes | Yes | Yes | Yes | Yes |
| Sample size | 5712 | 5712 | 5712 | 5712 | 5712 | 5712 | 5712 |
| Goodness of fit | 0.4866 | 0.5053 | 0.4581 | 0.7877 | 0.622 | 0.6122 | 0.7223 |
| Region | T | Significant or Not | Region | T | Significant or Not | Region | T | Significant or Not |
|---|---|---|---|---|---|---|---|---|
| Shenyang | 0 | Yes | Lvliang | 1 | Yes | Beijing | 6 | No |
| Kunming | 3 | Yes | Ma’anshan | 7 | Yes | Tianjin | 3 | Yes |
| Changchun | 2 | Yes | Xingtai | 1 | No | Shijiazhuang | 8 | Yes |
| Zhumadian | 5 | No | Zhengzhou | 0 | Yes | Tangshan | 6 | No |
| Baoding | 1 | No # | Nanyang | 7 | Yes | Handan | 8 | Yes |
| Wuxi | 6 | Yes | Baise | 0 | Yes | Hengshui | 8 | Yes |
| Ziyang | 1 | Yes | Haixi | 3 | Yes | Yuncheng | 0 | Yes |
| Zhangye | 7 | Yes | Dezhou | 1 | No | Tianjin ② | 1 | No |
| Siping | 5 | Yes | Jining | 10 | Yes | Handan ② | 5 | Yes |
| Jingdezhen | 8 | Yes | Shangqiu | 2 | No | Baoding ② | 1 | Yes |
| Zibo | 2 | Yes | Anqing | 3 | Yes | Xinxiang | 5 | Yes |
| Anyang | 6 | Yes | Changzhou | 2 | Yes | Harbin ② | 7 | No |
| Harbin | 0 | No | Xianyang | 3 | No | Jimujia | 0 | Yes |
| Cangzhou | 0 | No # | Yangquan | 0 | Yes | Shuangyashan | 0 | Yes |
| Linyi | 2 | No # | Weinan | 3 | No | Hegang | 10 | No |
| Chengde | 0 | Yes | Linfen | 0 | Yes | Linfen ② | 0 | Yes |
| Dependent Variable | AQI | PM2.5 | PM10 | SO2 | NO2 | CO | O3 |
|---|---|---|---|---|---|---|---|
| First order | −46.46 *** | −42.51 *** | −52.12 *** | −7.40 | −8.33 ** | −0.35 | −0.82 |
| 8.8291 | 8.3258 | 10.5334 | 5.9949 | 2.8363 | 0.2237 | 3.9625 | |
| Second order | −48.53 *** | −44.06 ** | −54.91 ** | −5.23 | −9.82 * | −0.20 | −0.06 |
| 14.9662 | 14.2437 | 17.7622 | 9.2229 | 4.7775 | 0.5901 | 6.1667 | |
| (1) | Yes | Yes | Yes | Yes | Yes | Yes | Yes |
| (2) | Yes | Yes | Yes | Yes | Yes | Yes | Yes |
| (3) | Yes | Yes | Yes | Yes | Yes | Yes | Yes |
| Sample size (N) | 2688 | 2688 | 2688 | 2688 | 2688 | 2688 | 2688 |
| The Dependent Variable | AQI | PM2.5 | PM10 | SO2 | NO2 | CO | O3 |
|---|---|---|---|---|---|---|---|
| Excluding airborne causes | −45.45 *** | −37.08 *** | −54.91 *** | −18.08 ** | −10.54 ** | −0.54 | −9.43 |
| N = 616 | 11.7606 | 10.6945 | 13.1813 | 6.4863 | 3.5994 | 0.3463 | 5.3983 |
| Includes airborne causes | −43.58 *** | −41.06 *** | −47.55 *** | −5.20 | −7.17 * | −0.22 | 1.04 |
| N = 2072 | 10.0222 | 9.2230 | 12.5126 | 7.0135 | 3.2058 | 0.2567 | 4.0487 |
| (1) | Yes | Yes | Yes | Yes | Yes | Yes | Yes |
| (2) | Yes | Yes | Yes | Yes | Yes | Yes | Yes |
| (3) | Yes | Yes | Yes | Yes | Yes | Yes | Yes |
| Time trend items | 1st order | 1st order | 1st order | 1st order | 1st order | 1st order | 1st order |
| The Dependent Variable | AQI | PM2.5 | PM10 | SO2 | NO2 | CO | O3 |
|---|---|---|---|---|---|---|---|
| Heating cities | −48.98 *** | −44.61 *** | −55.02 *** | −9.72 | −9.31 ** | −0.42 | 1.82 |
| N = 2184 | 10.1897 | 9.3674 | 12.6496 | 7.0766 | 3.1568 | 0.2665 | 4.0645 |
| Non-heated cities | −36.12 *** | −30.78 *** | −41.47 *** | −2.28 | −6.77 * | −0.03 | −14.71 * |
| N = 504 | 6.7566 | 6.1264 | 10.6002 | 2.9051 | 3.5847 | 0.1861 | 6.1101 |
| (2) | Yes | Yes | Yes | Yes | Yes | Yes | Yes |
| (3) | Yes | Yes | Yes | Yes | Yes | Yes | Yes |
| Time trend items | First order | First order | First order | First order | First order | First order | First order |
| The Dependent Variable | AQI | PM2.5 | PM10 | SO2 | NO2 | CO | O3 |
|---|---|---|---|---|---|---|---|
| Heating | −79.76 *** | −78.47 *** | −90.95 *** | −21.39 | −18.05 ** | −1.02 * | 6.12 |
| N = 896 | 21.3759 | 21.3534 | 25.2649 | 17.6944 | 5.8145 | 0.4556 | 4.4694 |
| Non-heated | −28.99 *** | −25.13 *** | −31.56 *** | 1.77 | −4.00 | −0.04 | −3.89 |
| N = 1792 | 5.1775 | 4.8046 | 7.0471 | 2.3667 | 2.4217 | 0.1602 | 4.1979 |
| (1) | Yes | Yes | Yes | Yes | Yes | Yes | Yes |
| (3) | Yes | Yes | Yes | Yes | Yes | Yes | Yes |
| Time trend items | 1st order | 1st order | 1st order | 1st order | 1st order | 1st order | 1st order |
| Dependent Variable | AQI | PM2.5 | PM10 | SO2 | NO2 | CO | O3 |
|---|---|---|---|---|---|---|---|
| First order | 9.9954 | 8.4567 | 7.6231 | −1.4474 | 1.9527 | 0.0732 | 2.6421 |
| 5.2740 | 5.1546 | 6.3249 | 5.9426 | 2.1686 | 0.1578 | 3.4661 | |
| Second order | 9.9568 | 8.7332 | 9.6521 | −1.8060 | 2.1293 | 0.1427 | 1.4919 |
| 7.6928 | 7.9641 | 9.1196 | 9.1845 | 3.3072 | 0.4084 | 5.2213 | |
| (1) | Yes | Yes | Yes | Yes | Yes | Yes | Yes |
| (2) | Yes | Yes | Yes | Yes | Yes | Yes | Yes |
| (3) | Yes | Yes | Yes | Yes | Yes | Yes | Yes |
| Sample size (N) | 17,472 | 17,472 | 17,472 | 17,472 | 17,472 | 17,472 | 17,472 |
| Dependent Variable | AQI | PM2.5 | PM10 | SO2 | NO2 | CO | O3 |
|---|---|---|---|---|---|---|---|
| First order | −3.4414 | 0.8399 | −1.3651 | 1.5155 | 3.9088 | 0.1210 | −1.7716 |
| 7.0512 | 6.2666 | 8.3059 | 4.1755 | 2.9094 | 0.1933 | 4.7489 | |
| Second order | −13.4233 | −5.1951 | −7.3566 | 2.6986 | 3.0253 | 0.4285 | −4.9183 |
| 10.9033 | 9.4684 | 12.7148 | 6.3938 | 4.2867 | 0.3885 | 7.2495 | |
| (1) | Yes | Yes | Yes | Yes | Yes | Yes | Yes |
| (2) | Yes | Yes | Yes | Yes | Yes | Yes | Yes |
| (3) | Yes | Yes | Yes | Yes | Yes | Yes | Yes |
| Sample size (N) | 2688 | 2688 | 2688 | 2688 | 2688 | 2688 | 2688 |
| Dependent Variable | 2 Weeks before and after the Interview | 4 Weeks before and after the Interview | 6 Weeks before and after the Interview | 8 Weeks before and after the Interview |
|---|---|---|---|---|
| AQI | −48.58505 *** | −47.10203 *** | −48.6484 *** | −48.46691 *** |
| PM2.5 | −44.81683 *** | −43.13503 *** | −45.12565 *** | −44.98694 *** |
| PM10 | −53.16457 *** | −52.46213 *** | −53.90612 *** | −53.68375 *** |
| SO2 | −53.16457 *** | −7.226675 | −6.67132 | −6.681053 |
| NO2 | −8.765467 ** | −8.307712 ** | −8.775167 ** | −8.73947 ** |
| CO | −0.35734 | −0.362782 | −0.355508 | −0.353217 |
| O3 | −1.226568 | −1.387607 | −1.043695 | −1.079751 |
| Sample size (N) | 1344 | 2688 | 4032 | 5376 |
| Dependent Variable | Excluding (95–100) | Excluding (90–100) | Excluding (80–100) | |
|---|---|---|---|---|
| AQI | First order | −50.14 *** | −52.21 *** | −61.39 *** |
| 9.5744 | 10.0546 | 12.1070 | ||
| Second order | −53.29 *** | −54.48 *** | −67.26 ** | |
| 16.2056 | 16.9812 | 21.1922 | ||
| PM2.5 | First order | −45.98 *** | −47.45 *** | −54.59 *** |
| 9.0523 | 9.4447 | 11.0715 | ||
| Second order | −49.47 *** | −50.37 ** | −61.05 ** | |
| 15.4643 | 16.0838 | 19.5383 | ||
| PM10 | First order | −56.32 *** | −58.82 *** | −70.26 *** |
| 11.5673 | 12.1509 | 14.4111 | ||
| Second order | −61.23 ** | −62.25 ** | −79.07 ** | |
| 19.5845 | 20.5753 | 25.1163 | ||
| Sample size (N) | 2566 | 2422 | 2158 | |
Publisher’s Note: MDPI stays neutral with regard to jurisdictional claims in published maps and institutional affiliations. |
© 2021 by the authors. Licensee MDPI, Basel, Switzerland. This article is an open access article distributed under the terms and conditions of the Creative Commons Attribution (CC BY) license (https://creativecommons.org/licenses/by/4.0/).
Share and Cite
Jin, X.; Sumaila, U.R.; Yin, K.; Qi, Z. Evaluation of the Policy Effect of China’s Environmental Interview System for Effective Air Quality Governance. Int. J. Environ. Res. Public Health 2021, 18, 9006. https://doi.org/10.3390/ijerph18179006
Jin X, Sumaila UR, Yin K, Qi Z. Evaluation of the Policy Effect of China’s Environmental Interview System for Effective Air Quality Governance. International Journal of Environmental Research and Public Health. 2021; 18(17):9006. https://doi.org/10.3390/ijerph18179006
Chicago/Turabian StyleJin, Xue, Ussif Rashid Sumaila, Kedong Yin, and Zhichao Qi. 2021. "Evaluation of the Policy Effect of China’s Environmental Interview System for Effective Air Quality Governance" International Journal of Environmental Research and Public Health 18, no. 17: 9006. https://doi.org/10.3390/ijerph18179006
APA StyleJin, X., Sumaila, U. R., Yin, K., & Qi, Z. (2021). Evaluation of the Policy Effect of China’s Environmental Interview System for Effective Air Quality Governance. International Journal of Environmental Research and Public Health, 18(17), 9006. https://doi.org/10.3390/ijerph18179006