
The Comparison of Fatty Acid Composition and Lipid Quality Indices of Roach, Perch, and Pike of Lake Gusinoe (Western Transbaikalia)


Abstract
:1. Introduction
2. Materials and Methods
2.1. Field Sampling
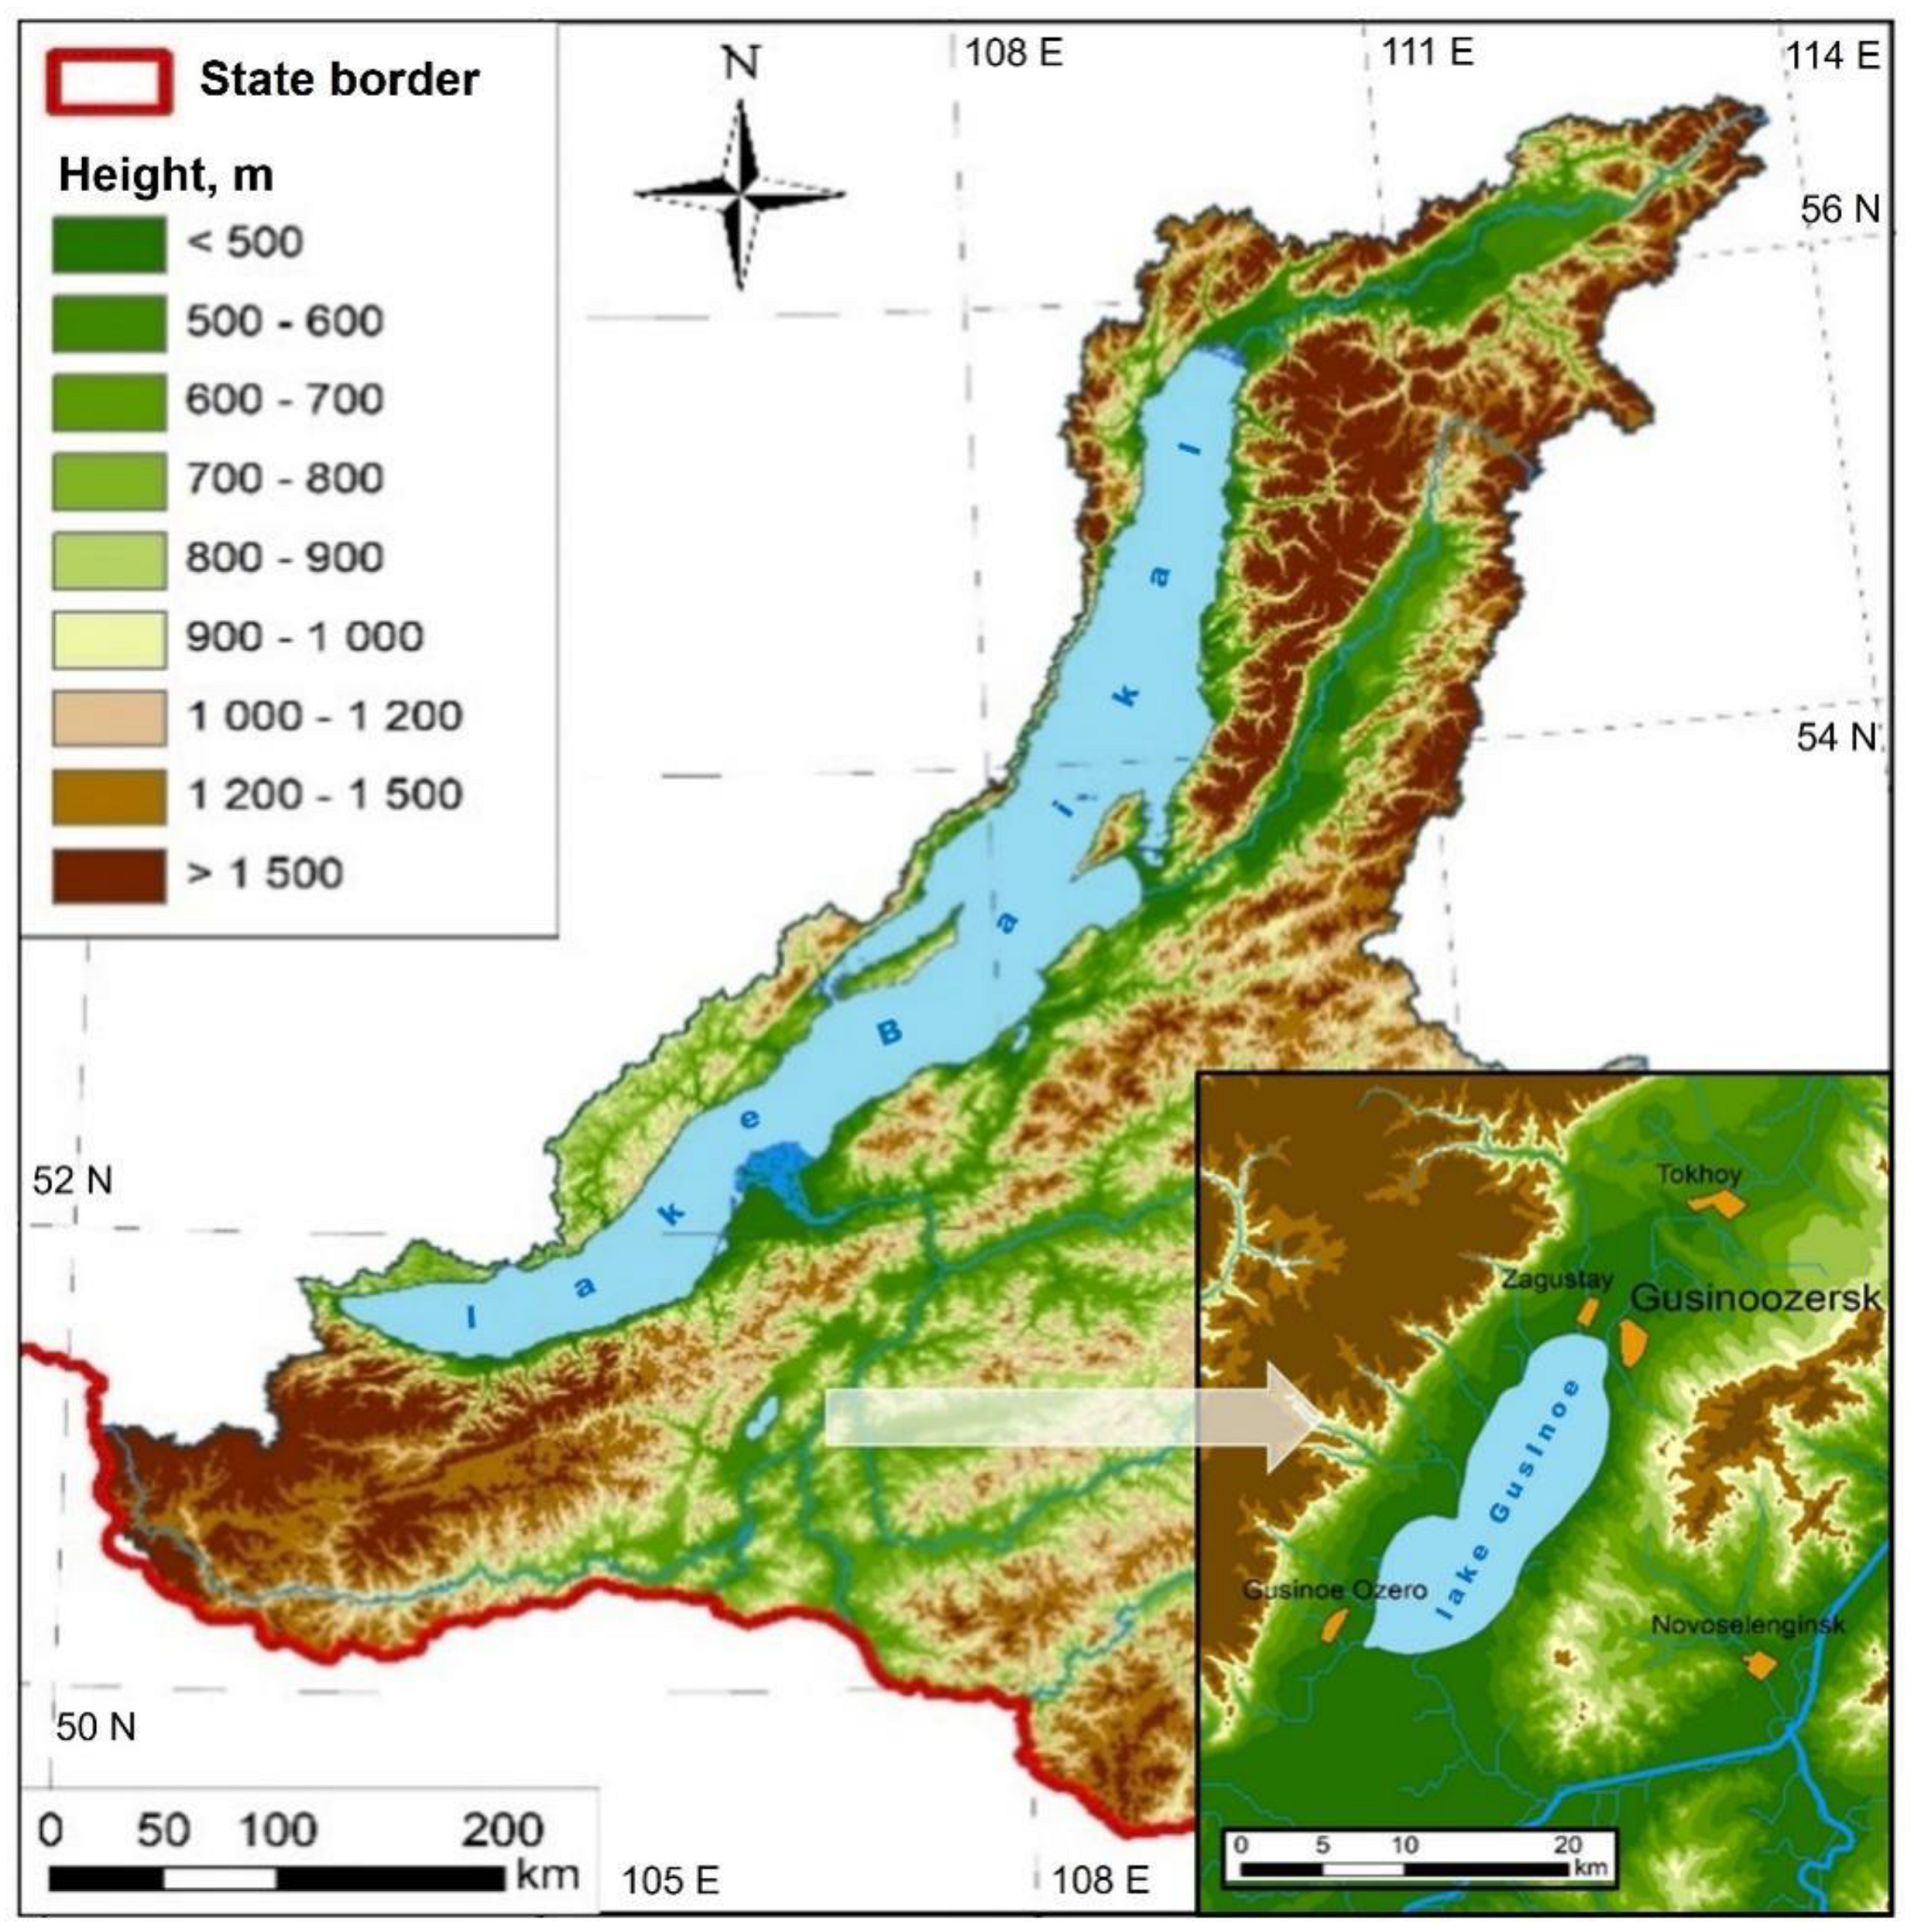
2.2. Collection Site
2.3. Sample Derivatization
2.4. Fatty Acid Analysis
2.5. The Lipid Quality Indices
2.5.1. Index of Atherogenicity
2.5.2. Index of Thrombogenicity
2.5.3. Flesh Lipid Quality
2.6. Statistical Analysis
3. Results
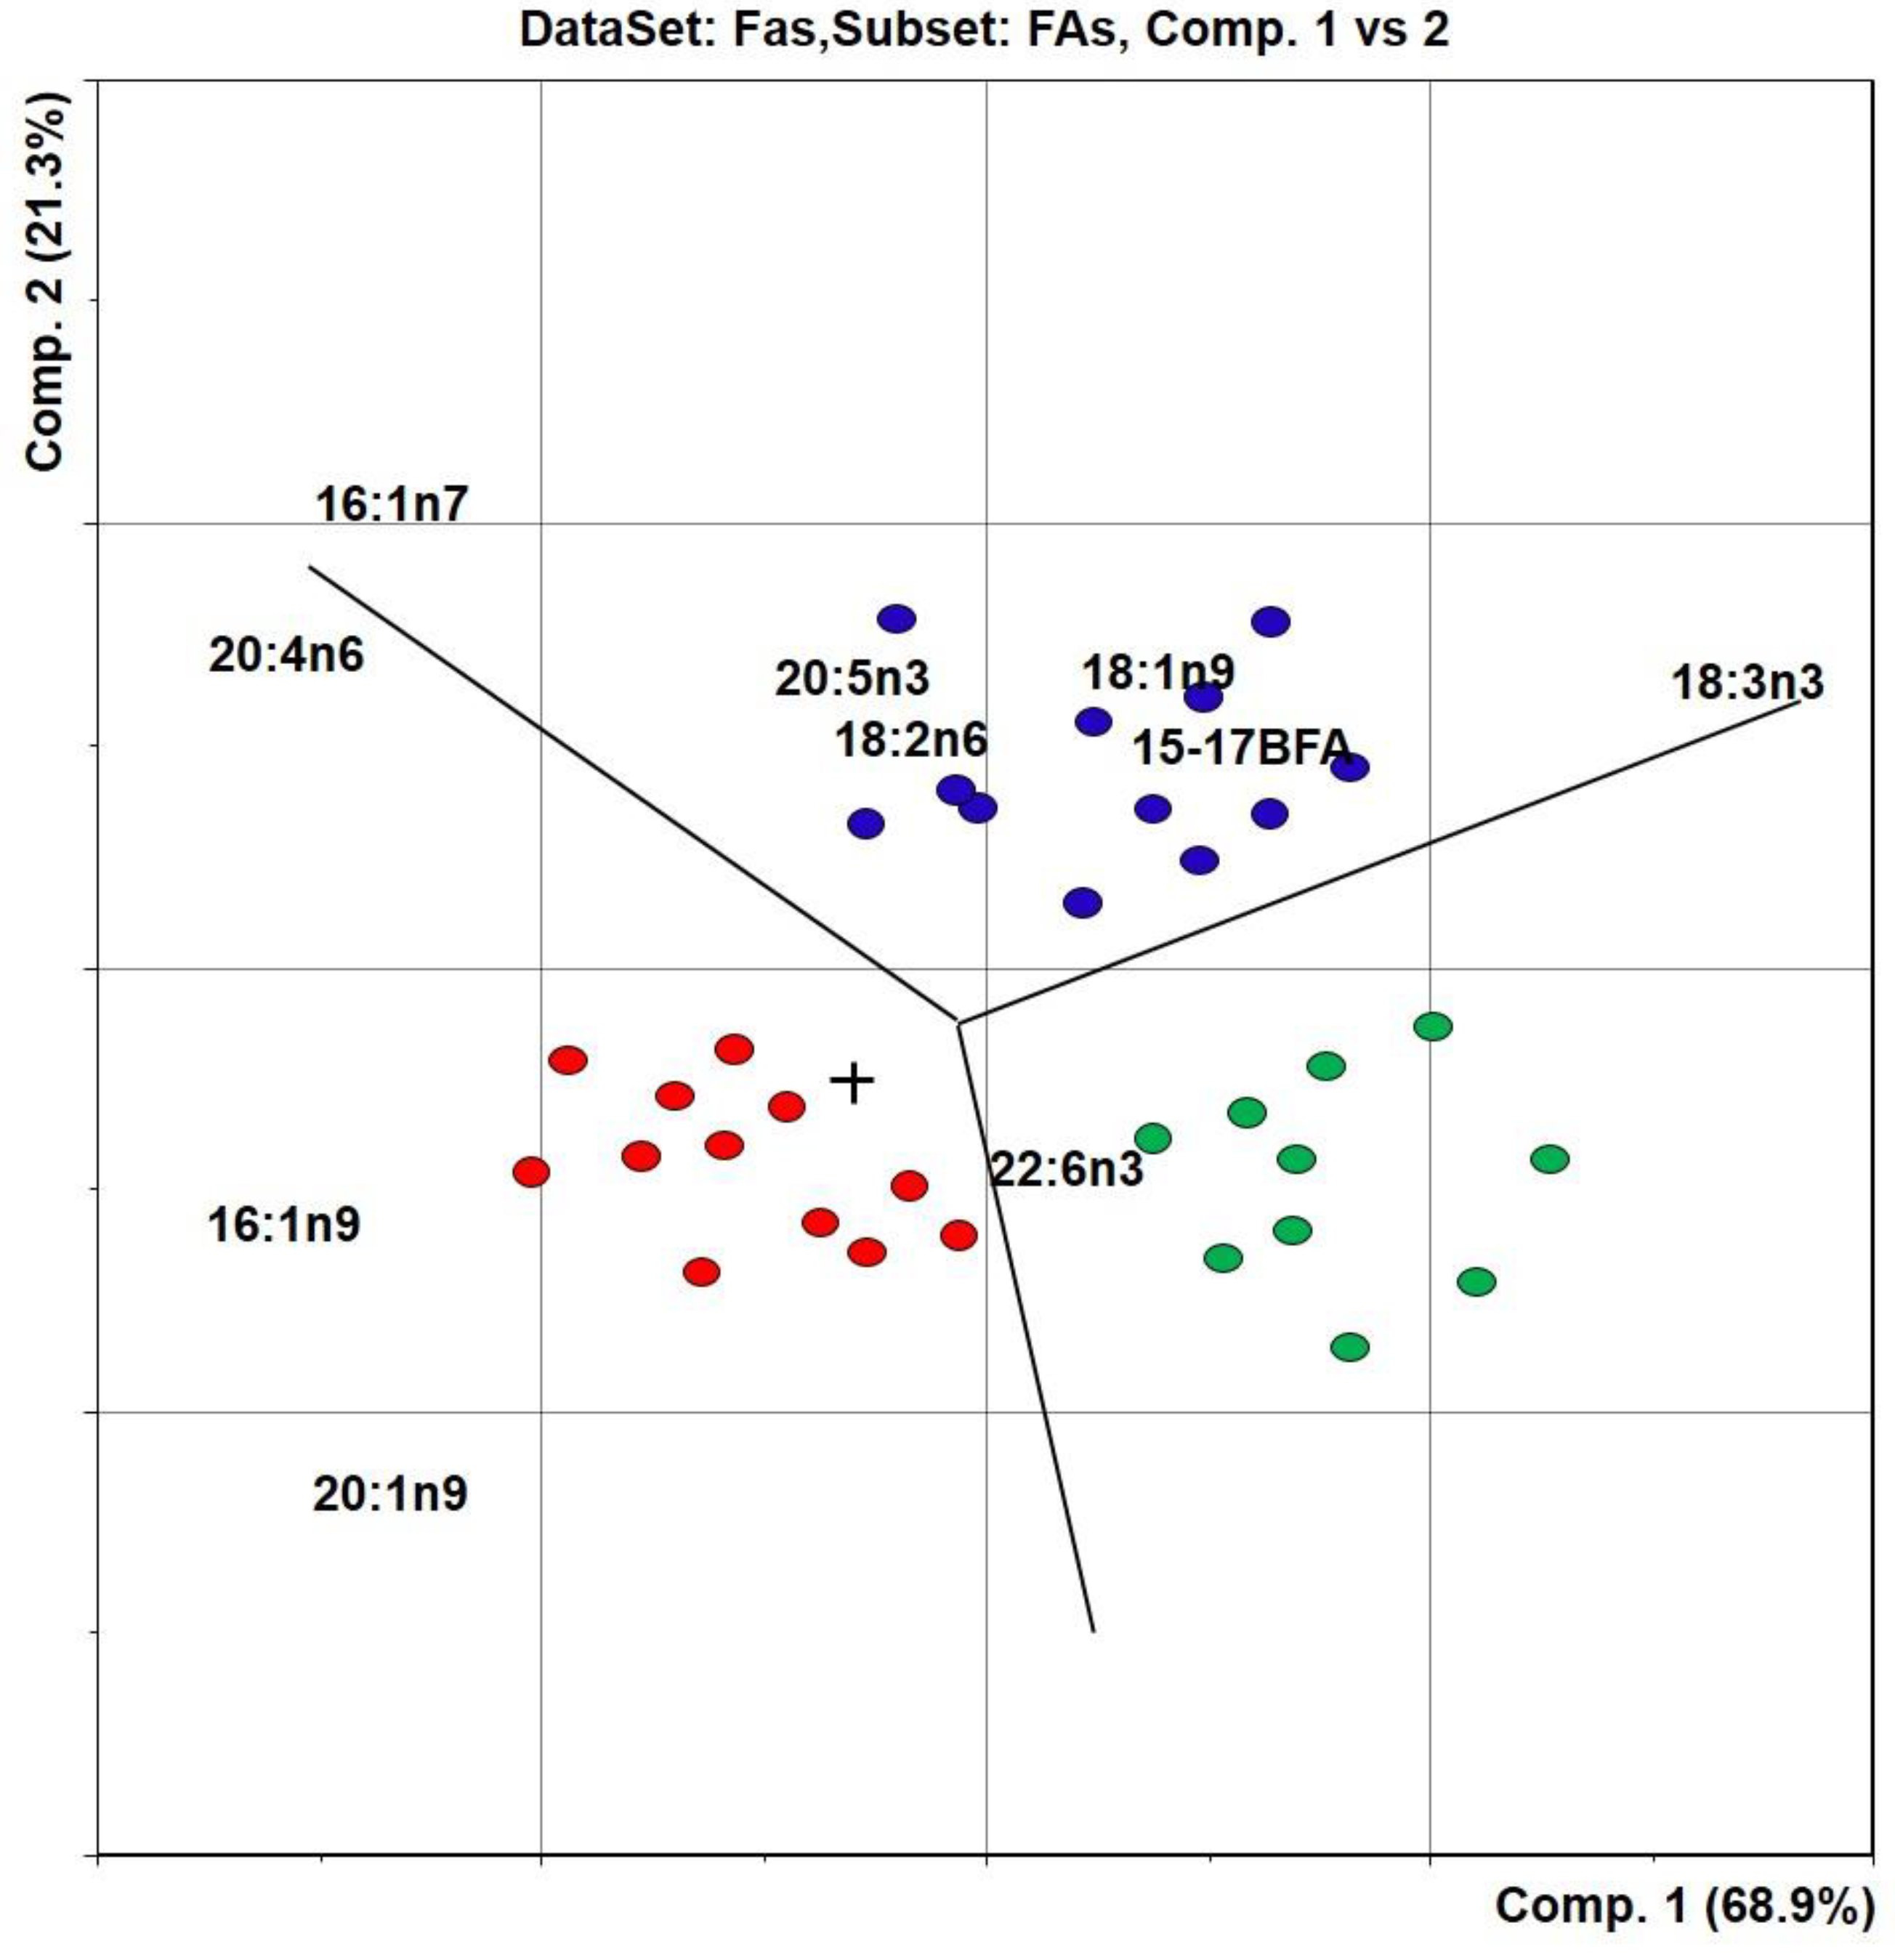
3.1. Fatty Acids
3.2. Lipid Quality Indices
4. Discussion
5. Conclusions
Author Contributions
Funding
Institutional Review Board Statement
Informed Consent Statement
Acknowledgments
Conflicts of Interest
References
- Matveev, A.N.; Yuriev, A.L.; Samusenok, V.P.; Vokin, A.L.; Samusenok, I.V. Changes in the composition of the ichthyofauna of Lake Gusinoe (cooling reservoir of the Gusinoozerskaya SDPP) and the role of alien species in it. In Silk Road. Transsib. Pairing Routes: Economy, Ecology, Collection of Materials of the International Scientific and Practical Conference and Symposium, Dedicated to the 100th Anniversary of Nature Reserve Management and the Year of Ecology in Russia; Institute of Natural Resources, Ecology and Cryology of the Siberian Branch of the RAS: Chita, Russia, 2017; pp. 94–96. (In Russian) [Google Scholar]
- Bobkov, A.I.; Pronin, N.M.; Sokolov, A.V. Gusino-Ubukunskaya group: Lake Gusinoe. In Fish of Lake Baikal and Its Basin; Publishing House of Buryat Scientific Center of SB RAS: Ulan-Ude, Russia, 2007; pp. 148–154. (In Russian) [Google Scholar]
- Pronin, N.M.; Shigaev, S.S.H. The pike parasite fauna of Lake Gusinoe. In Fauna, Morphology and Ecology of Parasites of Vertebrates of Transbaikalia; Publishing house of Buryat Branch of the Siberian Branch of the USSR Academy of Sciences: Ulan-Ude, Russia, 1977; Volume 18, pp. 45–55. (In Russian) [Google Scholar]
- Borisenko, I.M.; Pronin, N.M.; Shaybonov, B.B. Ecology of Lake Gusinoye; Publishing House of Buryat Scientific Center of SB RAS: Ulan-Ude, Russia, 1994; p. 199. [Google Scholar]
- Pisarsky, B.I.; Hardina, A.M.; Naganawa, H. Ecosystem evolution of Lake Gusinoe (Transbaikal Region, Russia). Limnology 2005, 6, 173–182. [Google Scholar] [CrossRef]
- UNOPS. State of the Environment Report: The Lake Baikal Basin. UN GEF Report 2015. p. 120. Available online: http://bic.iwlearn.org/en/documents/report (accessed on 27 August 2021).
- About Lake Baikal Status and Its Protecting Strategy in 2017; State Report; Consulting Center “Expert”: Irkutsk, Russia, 2018; p. 340. (In Russian)
- Moruzi, I.V.; Pishchenko, E.V.; Nekrasov, A.S.; Shatalin, V.A.; Babkov, A.I. Biological resources of Gusinoe lake in Selenginsky district of the republic of Buryatiya. Bull. NSAU 2016, 4, 48–55. (In Russian) [Google Scholar]
- Gomboeva, S.V. Ecological Features of the Distribution of Heavy Metals in Fish of the Baikal Region. Ph.D. Thesis, Buryat State University, Ulan-Ude, Russia, 2003; p. 150. Available online: https://www.dissercat.com/content/ekologicheskie-osobennosti-raspredeleniya-tyazhelykh-metallov-v-rybakh-baikalskogo-regiona (accessed on 27 August 2021). (In Russian).
- Shirapova, G.S.; Utyuzhnikova, N.S.; Rabina, O.A.; Vyalkov, I.A.; Morozov, S.V.; Batoev, V.B. Pollution by polyaromatic hydrocarbons in the Baikal basin: Lake Gusinoe. Chem. Sustain. Dev. 2013, 21, 189–195. [Google Scholar]
- Golovanova, I.L. Effects of heavy metals on physiological and biochemical status of fishes and aquatic invertebrates. Inland Water Biol. 2008, 1, 93–101. [Google Scholar] [CrossRef]
- Sidorov, V.O. Ecological Biochemistry of Fish. Lipids; Publishing house “Nauka”: Leningrad, Russia, 1983; p. 240. (In Russian) [Google Scholar]
- Kreps, E.M. Lipids of Cell Membranes; Publishing House “Nauka”: Leningrad, Russia, 1981; p. 339. (In Russian) [Google Scholar]
- Morris, R.J.; Culkin, F. Marine lipids: Analytical techniques and fatty acid analyses Oceanogr. Mar. Biol. Annu. Rev. 1976, 14, 391–433. [Google Scholar]
- Dydjow-Bendek, D.; Zagozdzon, P. Total Dietary Fats, Fatty Acids, and Omega-3/Omega-6 Ratio as Risk Factors of Breast Cancer in the Polish Population—A Case-Control Study. In Vivo 2020, 34, 423–431. [Google Scholar] [CrossRef]
- Simopoulos, A.P. The importance of the ratio of omega-6/omega-3 essential fatty acids. Biomed. Pharmacother. 2002, 56, 365–379. [Google Scholar] [CrossRef]
- Simopoulos, A.P. Omega-3 fatty acids in health and disease and in growth and development. Am. J. Clin. Nutr. 1991, 54, 438–463. [Google Scholar] [CrossRef] [PubMed]
- Arts, M.T.; Ackman, R.G.; Holub, B.J. “Essential fatty acids” in aquatic ecosystems: A crucial link between diet and human health and evolution. Can. J. Fish. Aquat. Sci. 2001, 58, 122–137. [Google Scholar] [CrossRef]
- Garg, M.L.; Wood, L.G.; Singh, H.; Moughan, P.J. Means of delivering recommended levels of long chain n-3 polyunsaturated fatty acids in human diets. J. Food Sci. 2006, 71, 66–71. [Google Scholar] [CrossRef]
- Lauritzen, L.; Hansen, H.S.; Jorgensen, M.H.; Michaelsen, K.F. The essentiality of long chain n-3 fatty acids in relation to development and function of the brain and retina. Prog. Lipid Res. 2001, 40, 1–94. [Google Scholar] [CrossRef]
- Silvers, K.M.; Scott, K.M. Fish consumption and self-reported physical and mental health status. Public Health Nutr. 2002, 5, 427–431. [Google Scholar] [CrossRef]
- Parrish, C.C.; Nichols, P.D.; Pethybridge, H.; Young, J.W. Direct determination of fatty acids in fish tissues: Quantifying top predator trophic connections. Oecologia 2015, 177, 85–95. [Google Scholar] [CrossRef] [PubMed]
- Meier, S.; Mjøs, S.A.; Joensen, H.; Grahl-Nielsen, O. Validation of a one-step extraction/methylation method for determination of fatty acids and cholesterol in marine tissues. J. Chromatogr. A 2006, 1104, 291–298. [Google Scholar] [CrossRef]
- Radnaeva, L.D.; Bazarsadueva, S.V.; Taraskin, V.V.; Tulokhonov, A.K. First data on lipids and microorganisms of deepwater endemic sponge Baikalospongia intermedia and sediments from hydrothermal discharge area of the Frolikha Bay (North Baikal, Siberia). J. Great Lakes Res. 2020, 46, 67–74. [Google Scholar] [CrossRef]
- Ulbricht, T.; Southgate, D. Coronary heart disease: Seven dietary factors. Lancet 1991, 338, 985–992. [Google Scholar] [CrossRef]
- Garaffo, M.A.; Vassallo-Agius, R.; Nengas, Y.; Lembo, E.; Rando, R.; Maisano, R.; Dugo, G.; Giuffrida, D. Fatty acids profile, atherogenic (IA) and thrombogenic (IT) health lipid indices, of raw roe of blue fin tuna (Thunnus thunnus L.) and their salted product “Bottarga”. Food Nutr. Sci. 2011, 2, 736–743. [Google Scholar] [CrossRef] [Green Version]
- Telahigue, K.; Hajji, T.; Rabeh, I.; El Cafsi, M. The changes of fatty acid composition in sun dried, oven dried and frozen hake (Merluccius merluccius) and sardinella (Sardinella aurita). Afr. J. Biochem. Res. 2013, 7, 158–164. [Google Scholar]
- Łuczyńska, J.; Paszczyk, B.; Nowosad, J.; Jan Łuczyński, M. Mercury, Fatty Acids Content and Lipid Quality Indexes in Muscles of Freshwater and Marine Fish on the Polish Market. Risk Assessment of Fish Consumption. Int. J. Environ. Res. Public Health 2017, 14, 1120. [Google Scholar] [CrossRef]
- Abrami, G.; Natiello, F.; Bronzi, P.; McKenzie, D.; Bolis, L.; Agradi, E. A comparison of highly unsaturated fatty acid levels in wild and farmed eels (Anguilla anguilla). Comp. Biochem. Physiol. 1992, 101, 79–81. [Google Scholar] [CrossRef]
- Senso, L.; Suárez, M.D.; Ruiz-Cara, T.; Garcia-Gallego, M. On the possible effects of harvesting season and chilled storage on the fatty acid profile of the fillet of farmed gilthead sea bream (Sparus aurata). Food Chem. 2007, 101, 298–307. [Google Scholar] [CrossRef]
- Kvalheim, O.M.; Karstang, T.V. A general-purpose program for multivariate analysis. Chemom. Intell. Lab. Syst. 1987, 2, 2355–2370. [Google Scholar] [CrossRef]
- Otto, M. Chemometrics: Statistics and Computer Application in Analytical Chemistry, 3rd ed.; John Wiley & Sons: Hoboken, NJ, USA, 2016. [Google Scholar]
- Dubale, M.S.; Shah, P. Biochemical alterations induced by cadmium in the liver on Channa punctatus. Environ. Res. 1981, 26, 110–118. [Google Scholar] [CrossRef]
- Pierron, F.; Baudrimont, M.; Bossy, A.; Bourdineaud, J.-P.; Brèthes, D.; Elie, P.; Massabuau, J.-C. Impairment of lipid storage by cadmium in the European eel (Anguilla anguilla). Aquat. Toxicol. 2007, 81, 304–311. [Google Scholar] [CrossRef]
- Gladyshev, M.I.; Sushchik, N.N.; Glushchenko, L.A.; Zadelenov, V.A.; Rudchenko, A.E.; Dgebuadze, Y.Y. Fatty acid composition of fish species with different feeding habits from an Arctic Lake. Dokl. Biochem. Biophys. 2017, 474, 220–223. [Google Scholar] [CrossRef] [PubMed] [Green Version]
- Sushchik, N.N.; Rudchenko, A.E.; Gladyshev, M.I. Effect of season and trophic level on fatty acid composition and content of four commercial fish species from Krasnoyarsk Reservoir (Siberia, Russia). Fish. Res. 2017, 187, 178–187. [Google Scholar] [CrossRef] [Green Version]
- Rudchenko, A.E. The Role of Trophic Factors in the Formation of the Fatty Acid Composition of Fish Inhabiting the Water Bodies of the Krasnoyarsk Territory. Ph.D. Thesis, Siberian Federal University Dissertation of Candidate of Biological Sciences, Krasnoyarsk, Russia, 2018; p. 154. Available online: http://research.sfu-kras.ru/sites/research.sfu-kras.ru/files/Dissertaciya_Rudchenko.pdf (accessed on 27 August 2021). (In Russian).
- Koven, W.M.; Van Anholt, R.D.; Lutzky, S.; Atia, I.B.; Nixon, O.; Ron, B.; Tandler, A. The effect of dietary arachidonic acid on growth, survival, and cortisol levels in different-age gilthead seabream larvae (Sparus aurata) exposed to handling or daily salinity change. Aquaculture 2003, 228, 307–320. [Google Scholar] [CrossRef]
- Tocher, D.R. Fatty acid requirements in ontogeny of marine and freshwater fish. Aquac. Res. 2010, 41, 717–732. [Google Scholar] [CrossRef]
- Zhigzhitzhapova, S.V.; Dylenova, E.P.; Anenkhonov, O.A.; Taraskin, V.V.; Radnaeva, L.D. Lipid Fraction Composition of Myriophyllum sibiricum. Chem. Nat. Compd. 2019, 55, 102–104. [Google Scholar] [CrossRef]
- Dagurova, O.P.; Tsydenova, B.V.; Buryukhaev, S.P.; Zaytseva, S.V.; Dambaev, V.B.; Kozyreva, L.P. Microbiological indicators of freshwater lakes of Buryatia. Bull. Buryat State Univ. 2019, 3, 61–66. [Google Scholar]
- Lukyanova, A.N.; Lukyanova, O.N.; Yefimova, L.E.; Yefimov, V.A. The anthropogenic and natural factors’ impact on water quality in cooling pools (The lake Gusinoe as a study case). Water Sect. Russ. 2020, 2, 146–162. [Google Scholar] [CrossRef]
- Goedkoop, W.; Sonesten, L.; Ahlgren, G.; Boberg, M. Fatty acids in profundal benthic invertebrates and their major food resources in Lake Erken, Sweden: Seasonal variation and trophic indications. Can. J. Fish. Aquat. Sci. 2000, 57, 2267–2279. [Google Scholar] [CrossRef]
- Taipale, S.J.; Vuorio, K.; Strandberg, U.; Kahilainen, K.K.; Järvinen, M.; Hiltunen, M.; Peltomaa, E.; Kankaala, P. Lake eutrophication and brownification downgrade availability and transfer of essential fatty acids for human consumption. Environ. Int. 2016, 96, 156–166. [Google Scholar] [CrossRef] [PubMed] [Green Version]
- Watanabe, T. Lipid nutrition in fish. Comp. Physiol. Biochem. 1982, 94, 367–374. [Google Scholar] [CrossRef]
- Henderson, R.J.; Tocher, D.R. The Lipid Composition and Biochemistry of Freshwater Fish. Prog. Lipid Res. 1987, 26, 281–347. [Google Scholar] [CrossRef]
- Simopoulos, A.P.; Leaf, A.; Salem, N. Essentiality and recommended dietary intakes for omega-6 and omega-3 fatty acids. Ann. Nutr. Metabol. 1999, 43, 127–130. [Google Scholar] [CrossRef]
- Steffens, W. Effects of variation in essential fatty acids in fish feeds on nutritive value of freshwater fish for humans. Aquaculture 1997, 151, 97–119. [Google Scholar] [CrossRef]
- Linhartová, Z.; Krejsa, J.; Zajíc, T.; Másílko, J.; Sampels, S.; Mráz, J. Proximate and fatty acid composition of 13 important freshwater fish species in central Europe. Aquacult. Int. 2018, 26, 695–711. [Google Scholar] [CrossRef]
- Yurchenko, S.; Sats, A.; Tatar, V.; Kaart, T.; Mootse, H.; Jõudu, I. Fatty acid profile of milk from Saanen and Swedish Landrace goats. Food Chem. 2018, 254, 326–332. [Google Scholar] [CrossRef]
- Fernandes, C.E.; Da Silva Vasconcelos, M.A.; de Almeida Ribeiro, M.; Sarubbo, L.A.; Andrade, S.A.C.; de Melo Filho, A.B. Nutritional and lipid profiles in marine fish species from Brazil. Food Chem. 2014, 160, 67–71. [Google Scholar] [CrossRef]
- Tonial, I.B.; Oliveira, D.; Coelho, A.R.; Matsushita, M.; Coró, F.; Souza, N.E.; Visentainer, J.V. Quantification of Essential Fatty Acids and Assessment of the Nutritional Quality Indexes of Lipids in Tilapia Alevins and Juvenile Tilapia Fish (Oreochromis niloticus). J. Food Res. 2014, 3, 105–114. [Google Scholar] [CrossRef]

| Fatty Acids * | Roach (n = 12) | Perch (n = 12) | Pike (n = 10) |
|---|---|---|---|
| 12:0 | 0.15 ± 0.02 a | 0.14 ± 0.01 a | 0.14 ± 0.02 a |
| 14:0 | 0.82 ± 0.16 a | 0.89 ± 0.14 ab | 1.04 ± 0.17 ab |
| 15:0 | 0.34 ± 0.05 b | 0.34 ± 0.05 ab | 0.42 ± 0.07 a |
| 16:0 | 20.34 ± 3.10 a | 20.53 ± 2.44 a | 20.56 ± 2.67 a |
| 15–17 BFA ** | 1.22 ± 0.24 a | 0.65 ± 0.10 ab | 0.44 ± 0.06 b |
| 17:0 | 0.54 ± 0.08 a | 0.38 ± 0.06 a | 0.32 ± 0.05 a |
| 18:0 | 6.20 ± 0.83 a | 5.04 ± 0.66 a | 6.09 ± 0.74 a |
| 16:1n9 | 1.44 ± 0.14 b | 2.67 ± 0.34 a | 1.05 ± 0.14 b |
| 16:1n7 | 3.34 ± 0.46 a | 3.49 ± 0.52 a | 1.53 ± 0.24 b |
| 18:1n9 | 8.67 ± 0.69 a | 6.88 ± 0.82 b | 7.68 ± 0.90 ab |
| 20:1n9 | 0.34 ± 0.06 b | 0.64 ± 0.10 a | 0.13 ± 0.01 c |
| 18:3n3 | 1.82 ± 0.3 a | 0.91 ± 0.11 b | 2.14 ± 0.33 a |
| 18:4n3 | 0.23 ± 0.02 a | 0.13 ± 0.01 a | 0.34 ± 0.03 a |
| 18:2n6 | 4.08 ± 0.64 a | 2.74 ± 0.51 b | 2.41 ± 0.40 b |
| 20:2n6 | 0.29 ± 0.05 ab | 0.42 ± 0.07 a | 0.12 ± 0.01 b |
| 20:4n6 | 8.10 ± 0.54 a | 7.71 ± 0.44 ab | 6.22 ± 0.55 b |
| 20:5n3 | 12.71 ± 1.68 a | 8.07 ± 1.26 b | 8.74 ± 1.14 b |
| 20:3n6 | 0.44 ± 0.07 a | 0.24 ± 0.03 b | 0.14 ± 0.01 c |
| 20:4n3 | 0.33 ± 0.05 ab | 0.29 ± 0.03 b | 0.53 ± 0.08 a |
| 22:5n3 | 1.05 ± 0.14 a | 0.89 ± 0.11 a | 0.93 ± 0.12 a |
| 22:5n6 | 0.78 ± 0.12 a | 0.91 ± 0.10 a | 0.94 ± 0.11 a |
| 22:6n3 | 22.04 ± 2.15 b | 29.65 ± 3.08 a | 32.51 ± 3.14 a |
| Σ SFA | 29.61 ± 2.08 a | 27.97 ± 3.10 a | 29.01 ± 1.98 a |
| Σ MUFA | 13.79 ± 1.78 a | 13.68 ± 1.64 a | 10.39 ± 1.25 b |
| Σ n-3 PUFA | 38.13 ± 3.16 b | 39.94 ± 3.84 b | 45.19 ± 3.95 a |
| Σ n-6 PUFA | 13.69 ± 1.81 a | 12.02 ± 1.54 a | 9.83 ± 1.06 b |
| Σ PUFA | 51.82 ± 6.72 a | 51.96 ± 5.21 a | 55.02 ± 7.25 a |
| Σ UFA | 65.61 ± 6.13 a | 65.64 ± 6.02 a | 65.41 ± 5.89 a |
| n-3/n-6 | 2.79 ± 0.24 b | 3.32 ± 0.32 b | 4.60 ± 0.72 a |
| Indices | Roach (n = 12) | Perch (n = 12) | Pike (n = 10) |
|---|---|---|---|
| AI | 0.36 ± 0.02 a | 0.37 ± 0.01 a | 0.38 ± 0.02 a |
| TI | 0.21 ± 0.01 a | 0.19 ± 0.01 a | 0.18 ± 0.01 a |
| FLQ | 34.75 ± 1.51 c | 37.72 ± 1.36 b | 41.25 ± 1.68 a |
| OFA | 21.31 ± 0.82 a | 21.56 ± 0.69 a | 21.74 ± 1.01 a |
| DFA | 71.81 ± 2.25 a | 70.68 ± 1.99 a | 71.50 ± 2.56 a |
| HH | 3.37 ± 0.11 a | 3.28 ± 0.09 b | 3.29 ± 0.08 b |
Publisher’s Note: MDPI stays neutral with regard to jurisdictional claims in published maps and institutional affiliations. |
© 2021 by the authors. Licensee MDPI, Basel, Switzerland. This article is an open access article distributed under the terms and conditions of the Creative Commons Attribution (CC BY) license (https://creativecommons.org/licenses/by/4.0/).
Share and Cite
Bazarsadueva, S.V.; Radnaeva, L.D.; Shiretorova, V.G.; Dylenova, E.P. The Comparison of Fatty Acid Composition and Lipid Quality Indices of Roach, Perch, and Pike of Lake Gusinoe (Western Transbaikalia). Int. J. Environ. Res. Public Health 2021, 18, 9032. https://doi.org/10.3390/ijerph18179032
Bazarsadueva SV, Radnaeva LD, Shiretorova VG, Dylenova EP. The Comparison of Fatty Acid Composition and Lipid Quality Indices of Roach, Perch, and Pike of Lake Gusinoe (Western Transbaikalia). International Journal of Environmental Research and Public Health. 2021; 18(17):9032. https://doi.org/10.3390/ijerph18179032
Chicago/Turabian StyleBazarsadueva, Selmeg V., Larisa D. Radnaeva, Valentina G. Shiretorova, and Elena P. Dylenova. 2021. "The Comparison of Fatty Acid Composition and Lipid Quality Indices of Roach, Perch, and Pike of Lake Gusinoe (Western Transbaikalia)" International Journal of Environmental Research and Public Health 18, no. 17: 9032. https://doi.org/10.3390/ijerph18179032