
Assessment of Sound Source Tracking Using Multiple Drones Equipped with Multiple Microphone Arrays

Abstract
1. Introduction
2. Related Work
3. Method
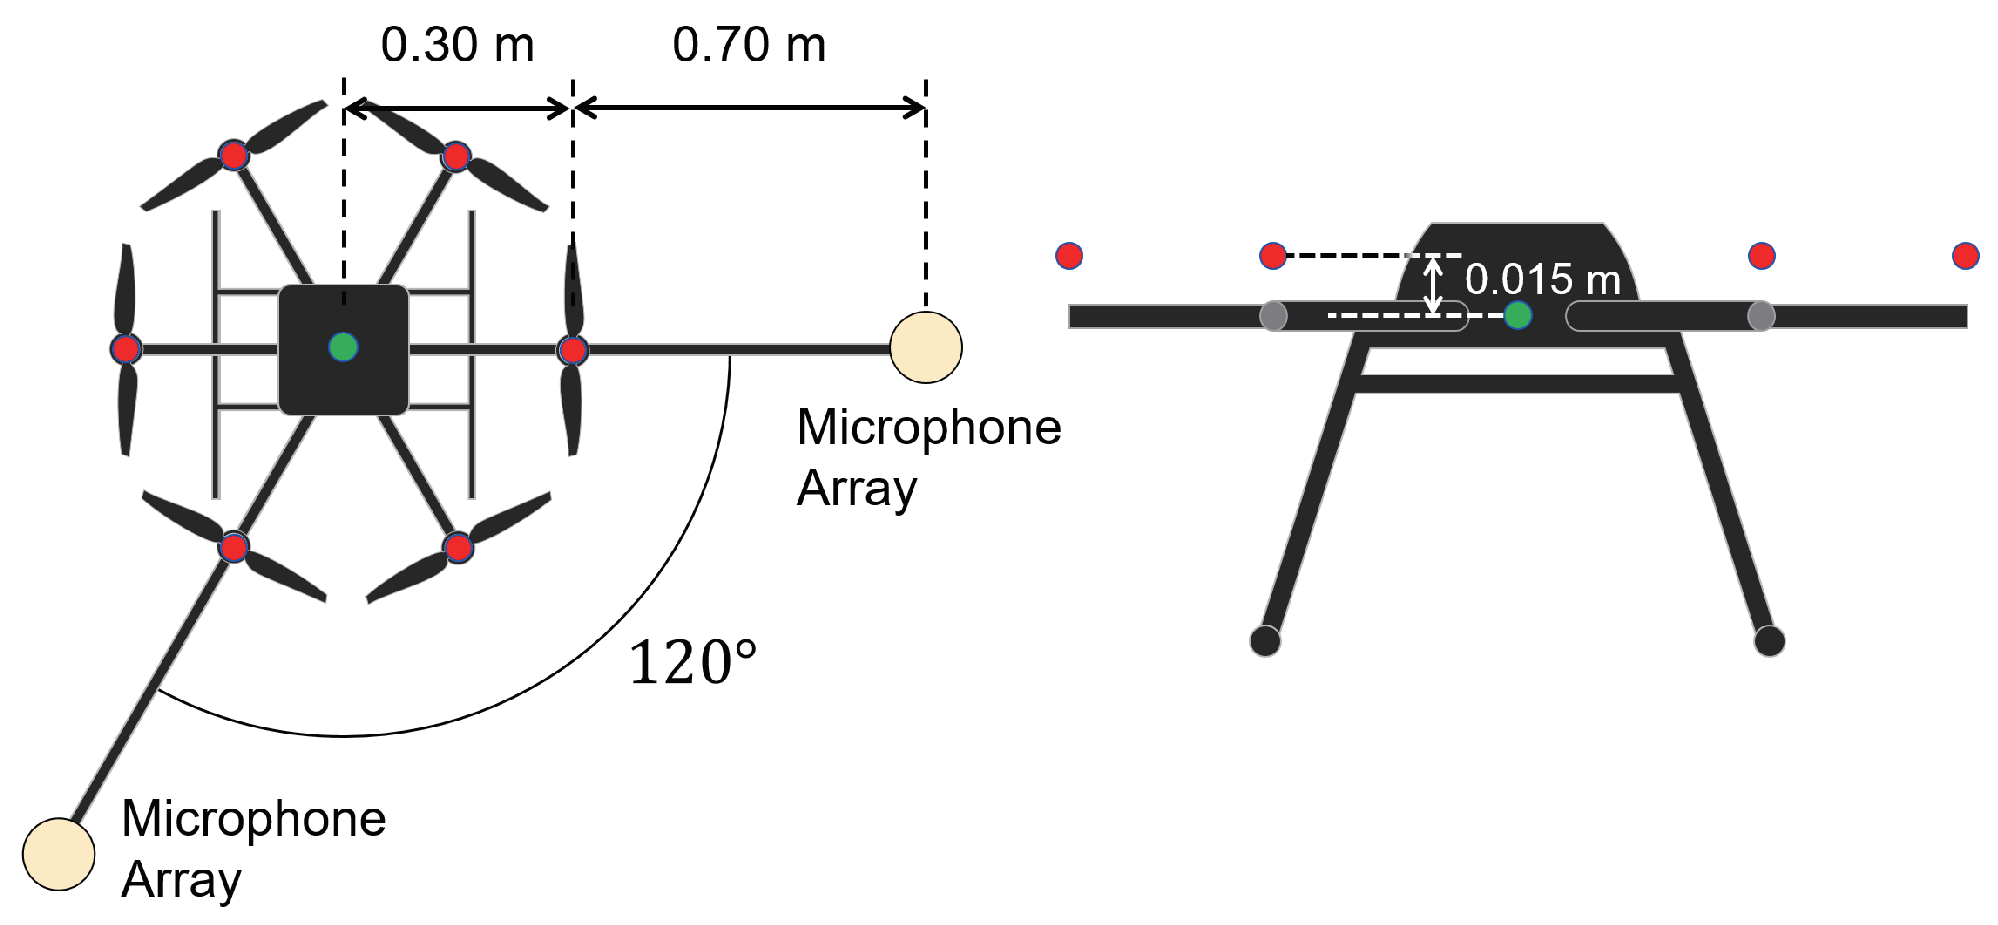
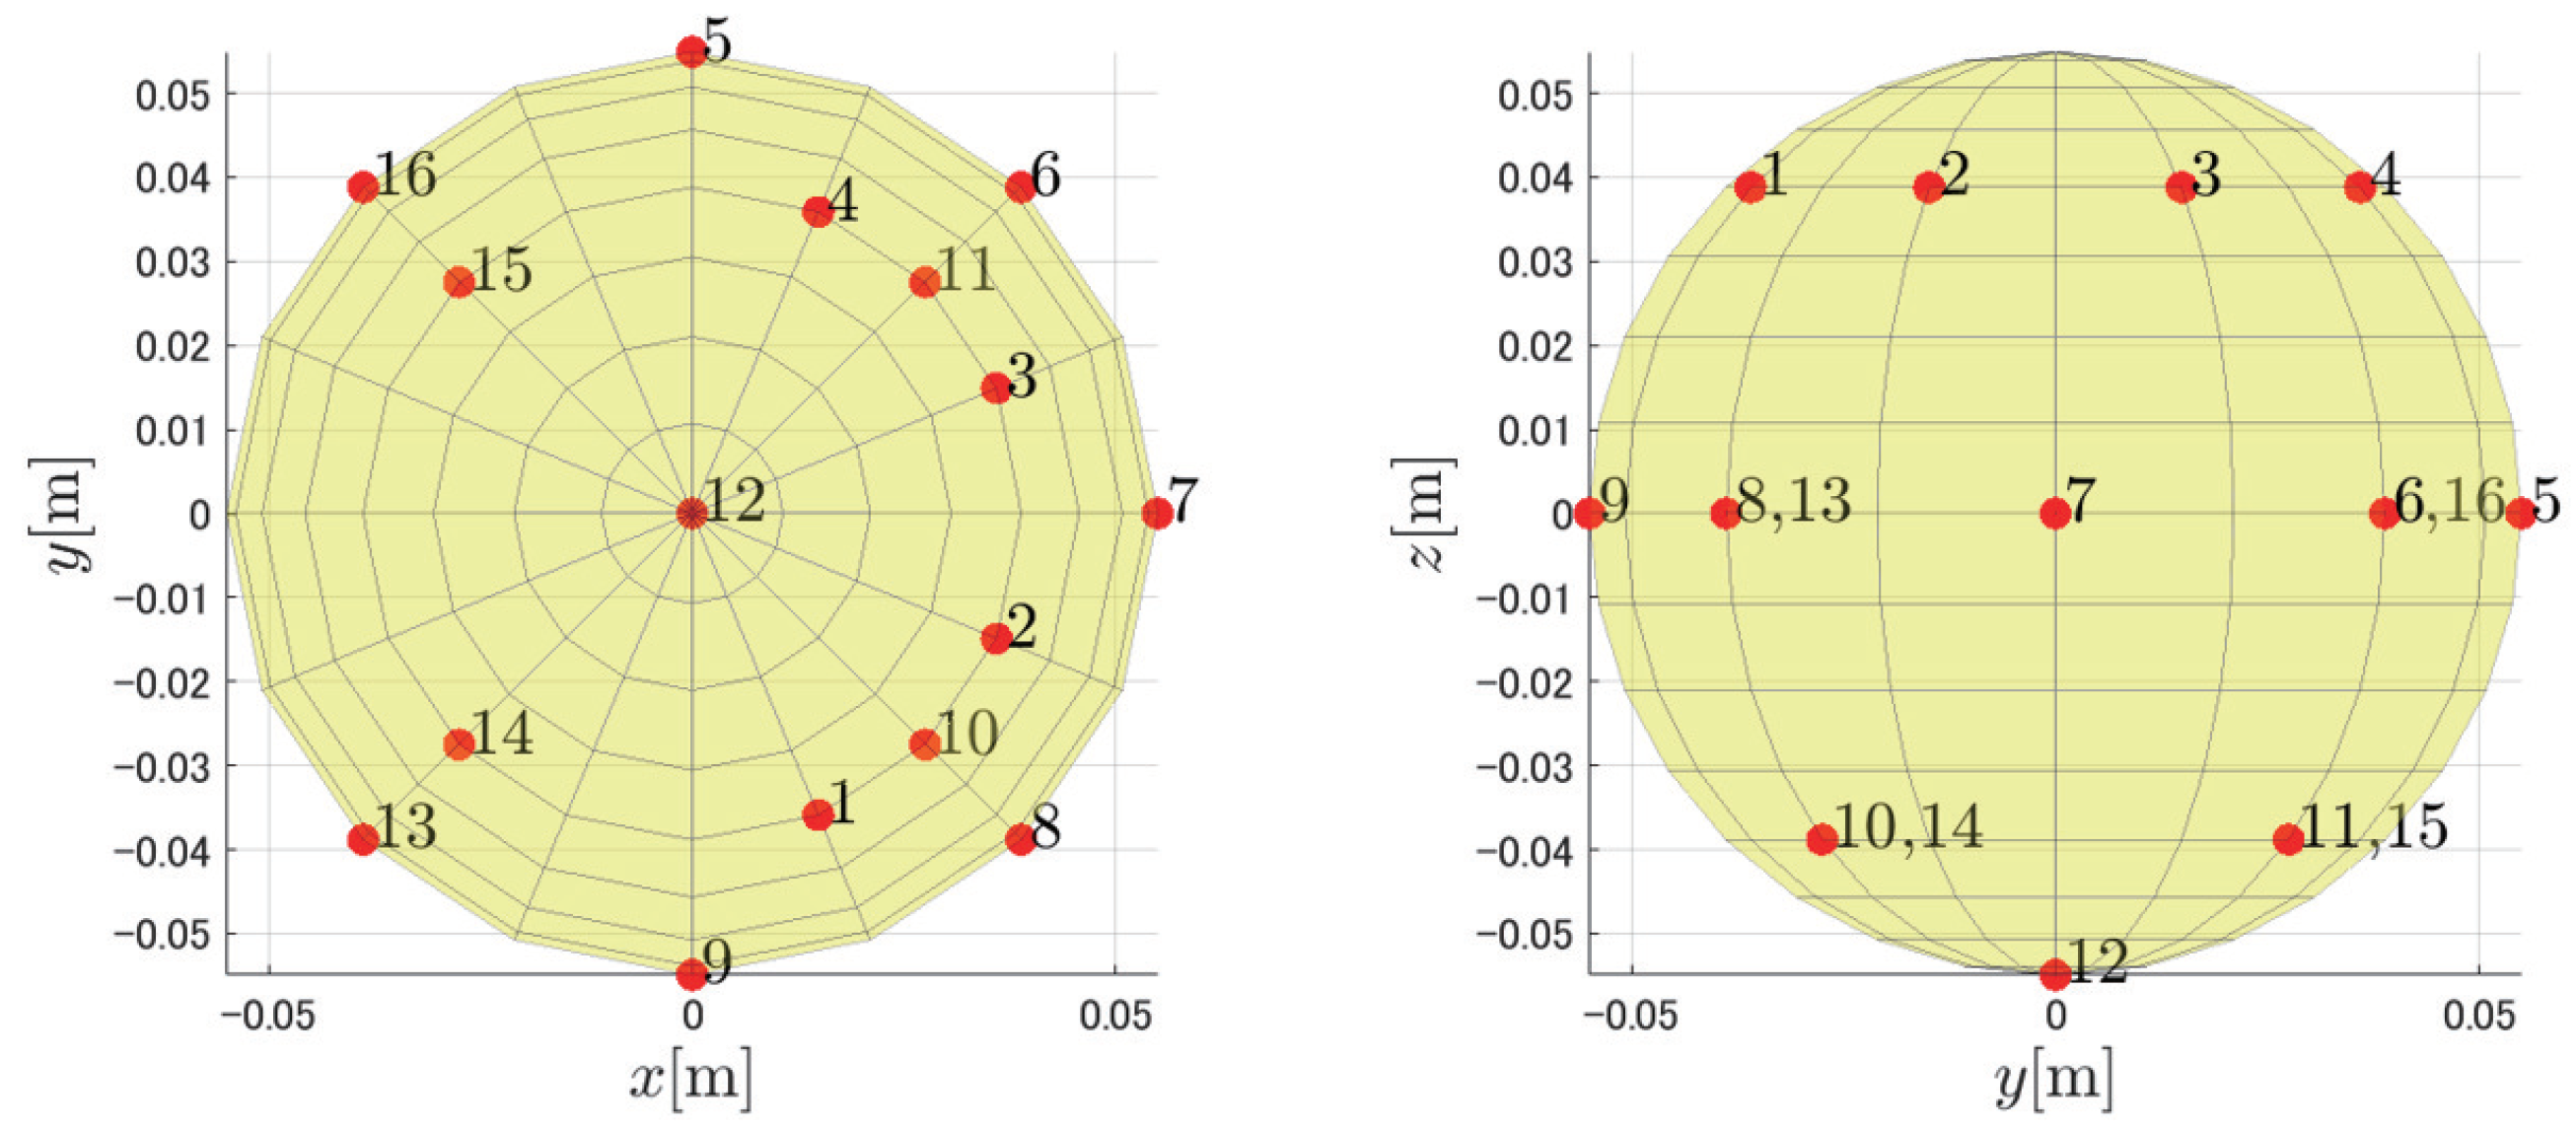
3.1. Settings
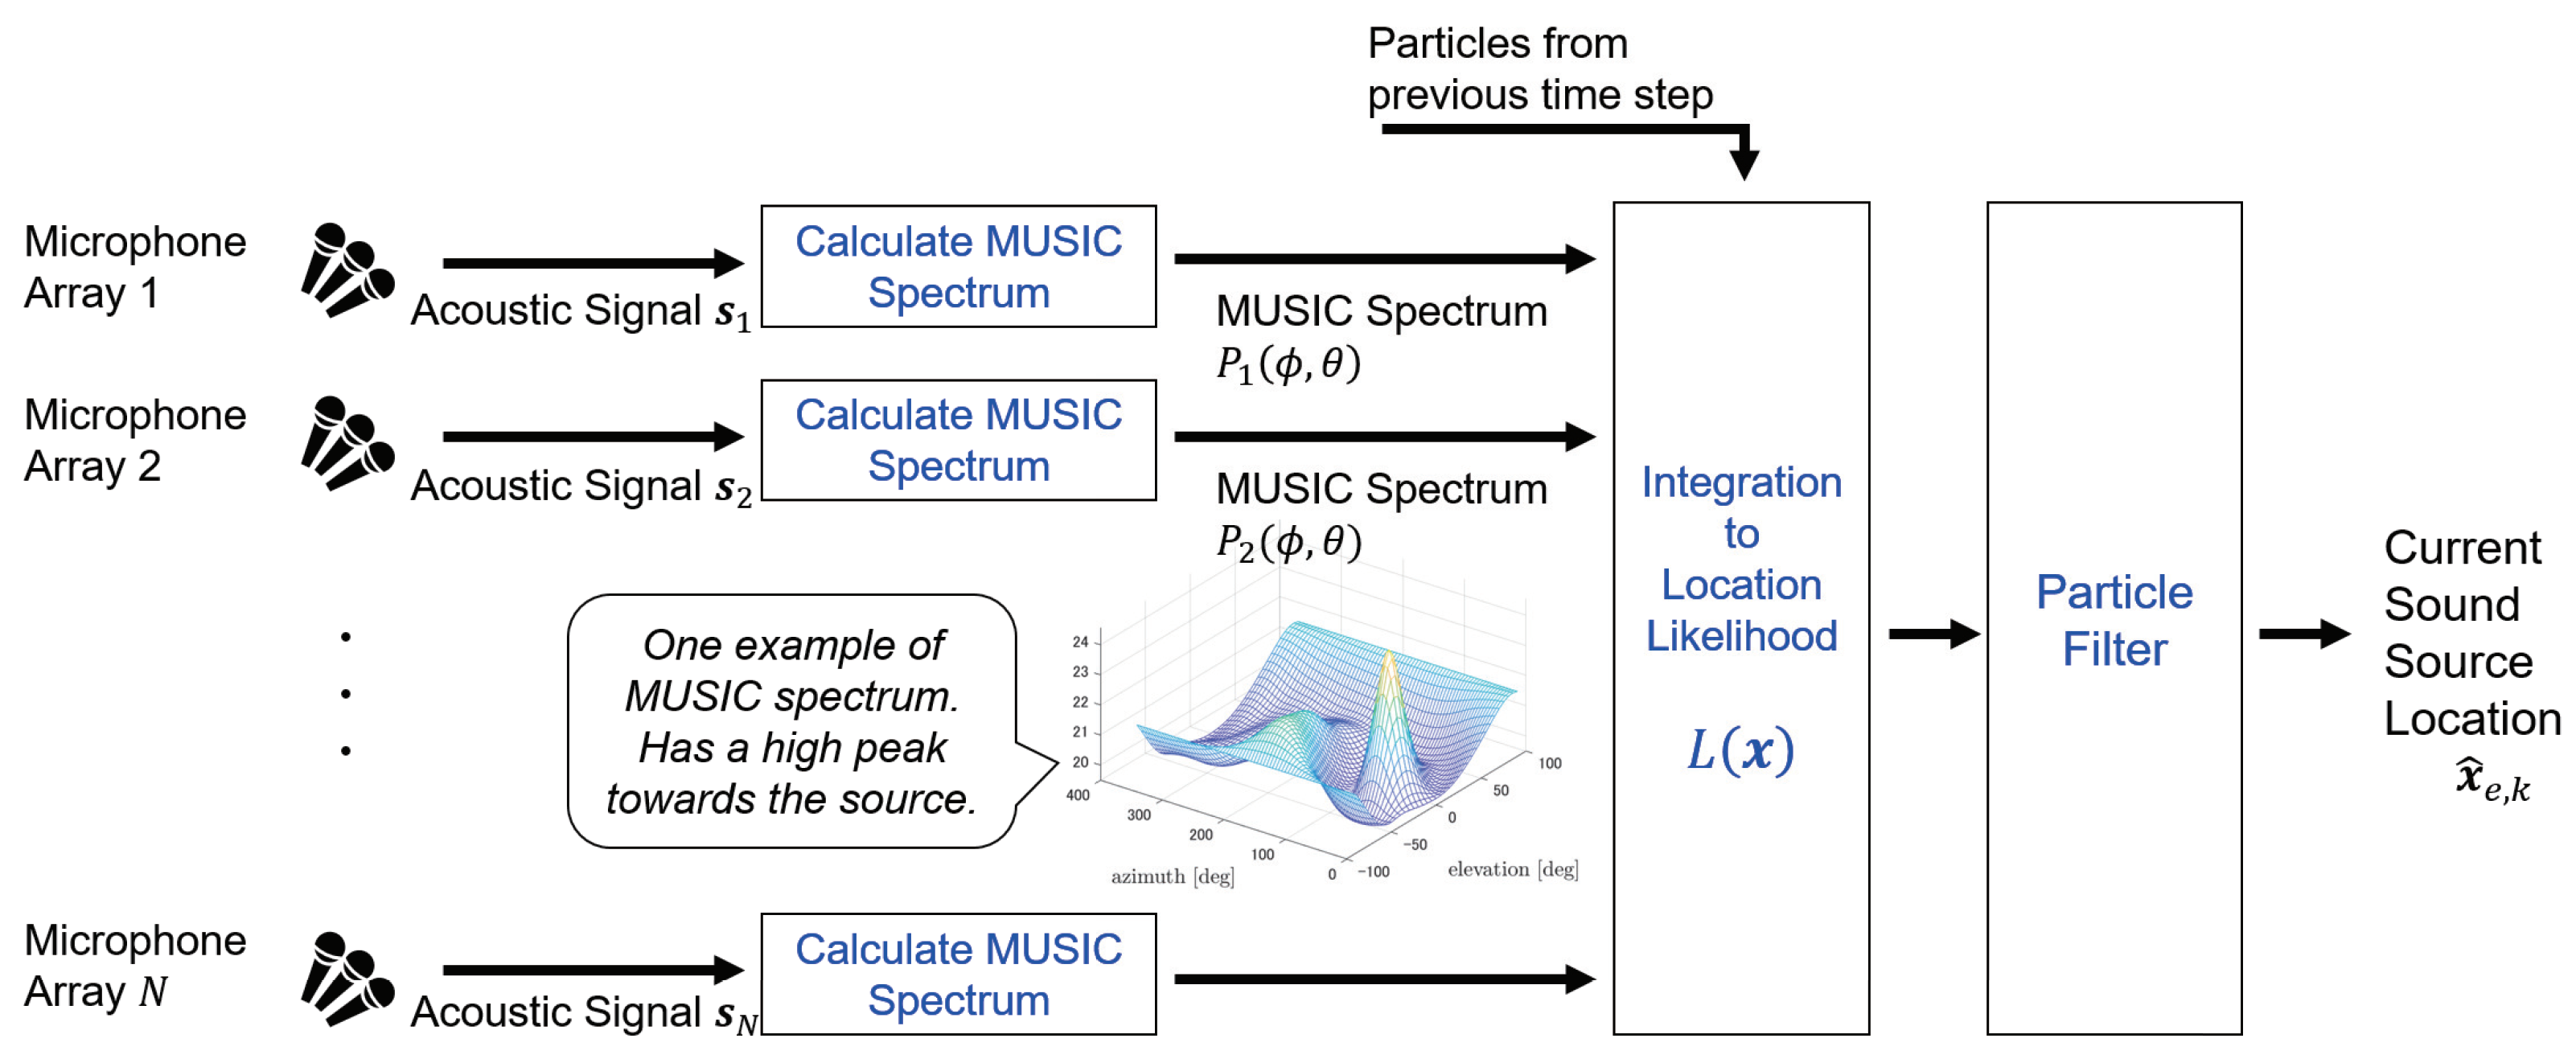
3.2. System Outline
3.3. Estimation of Direction Likelihood Distribution
3.4. Converting to Location Likelihood Distribution
3.5. Tracking Based on Location Likelihood Distribution
3.6. Initialization of Particle Filter
3.7. Particle Update
3.8. Location Estimation
4. Evaluation
4.1. Evaluation Outline
4.2. Simulation Results and Discussion

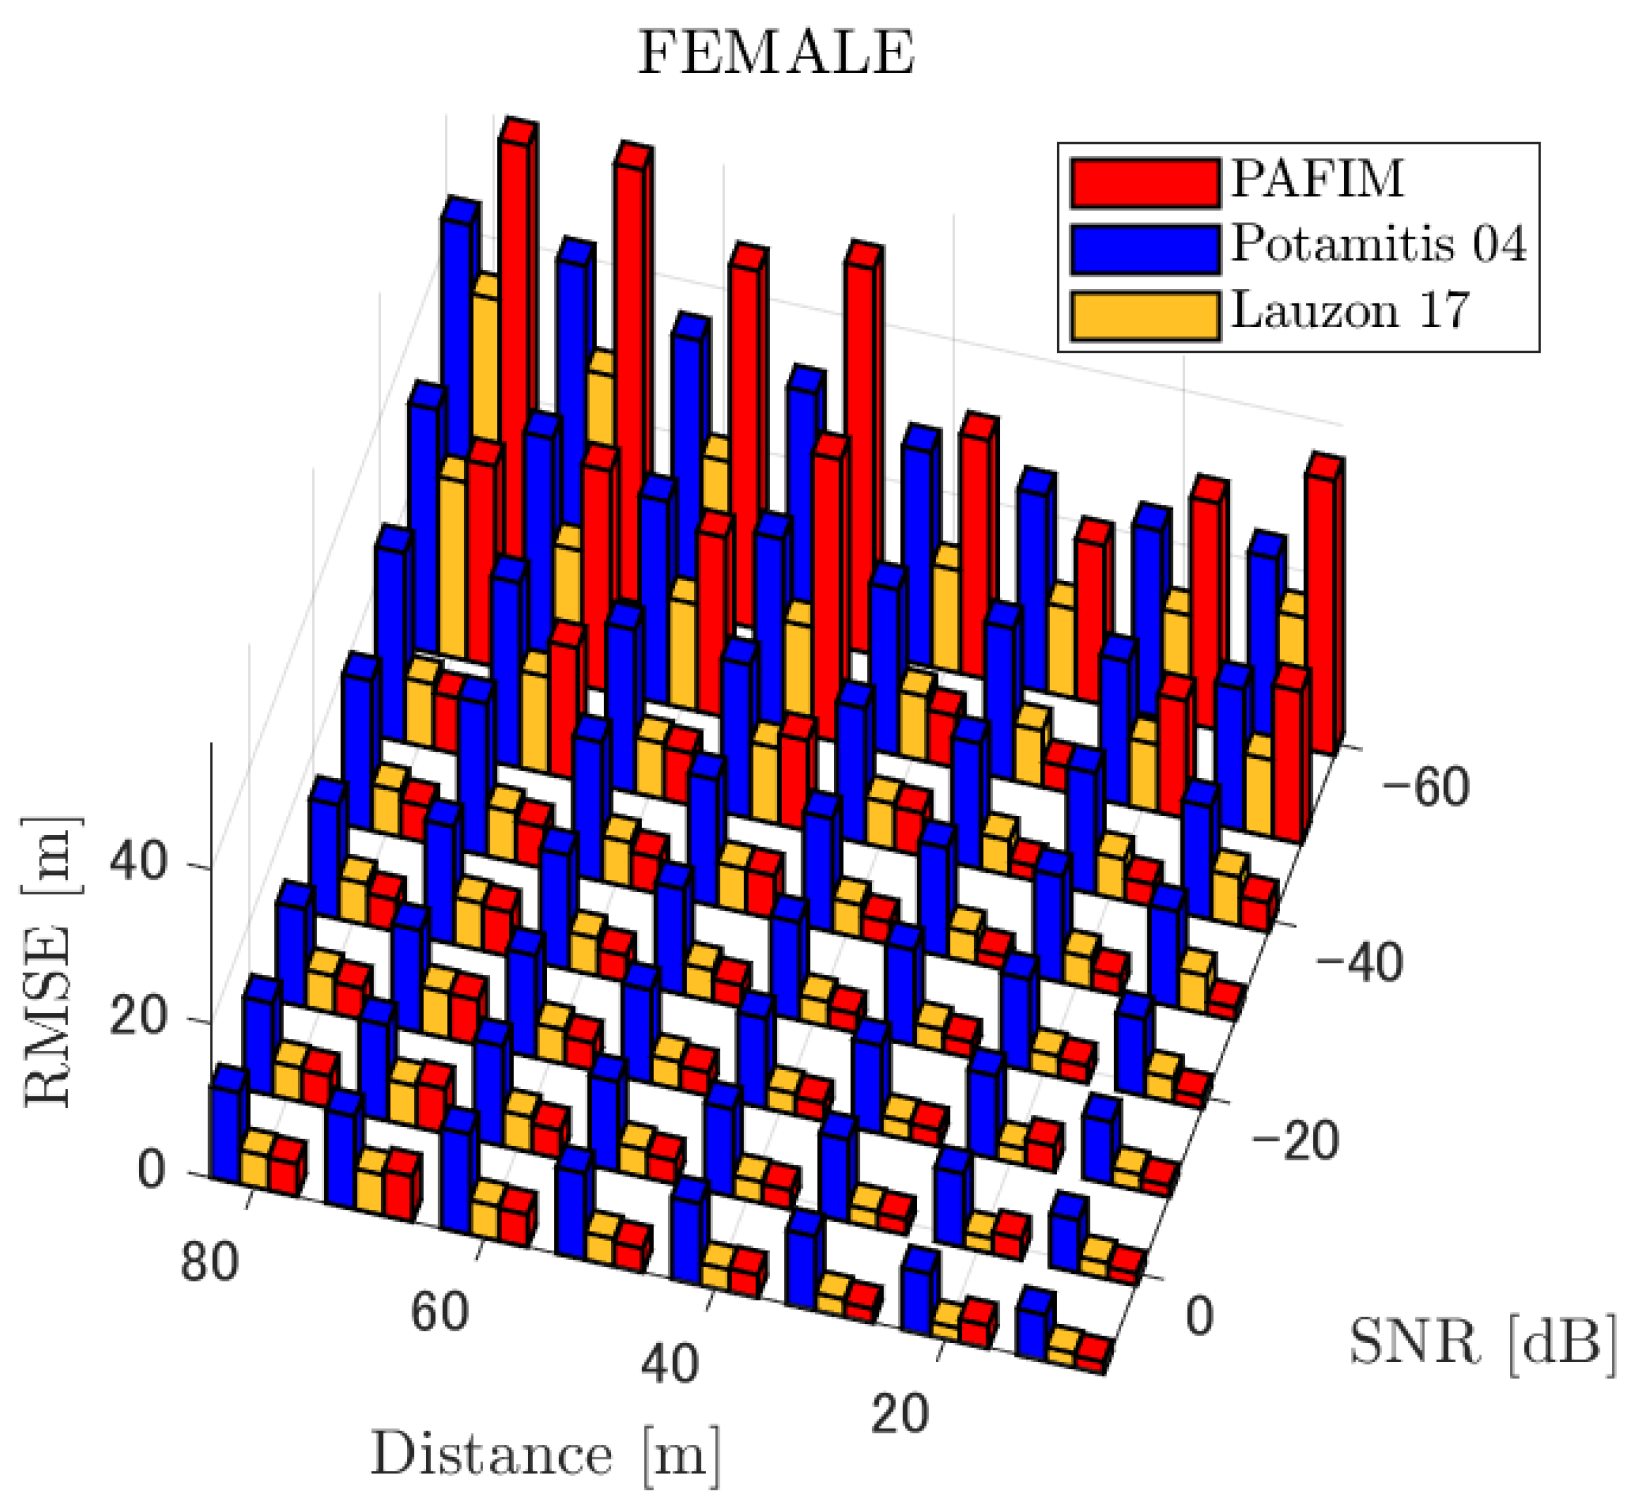
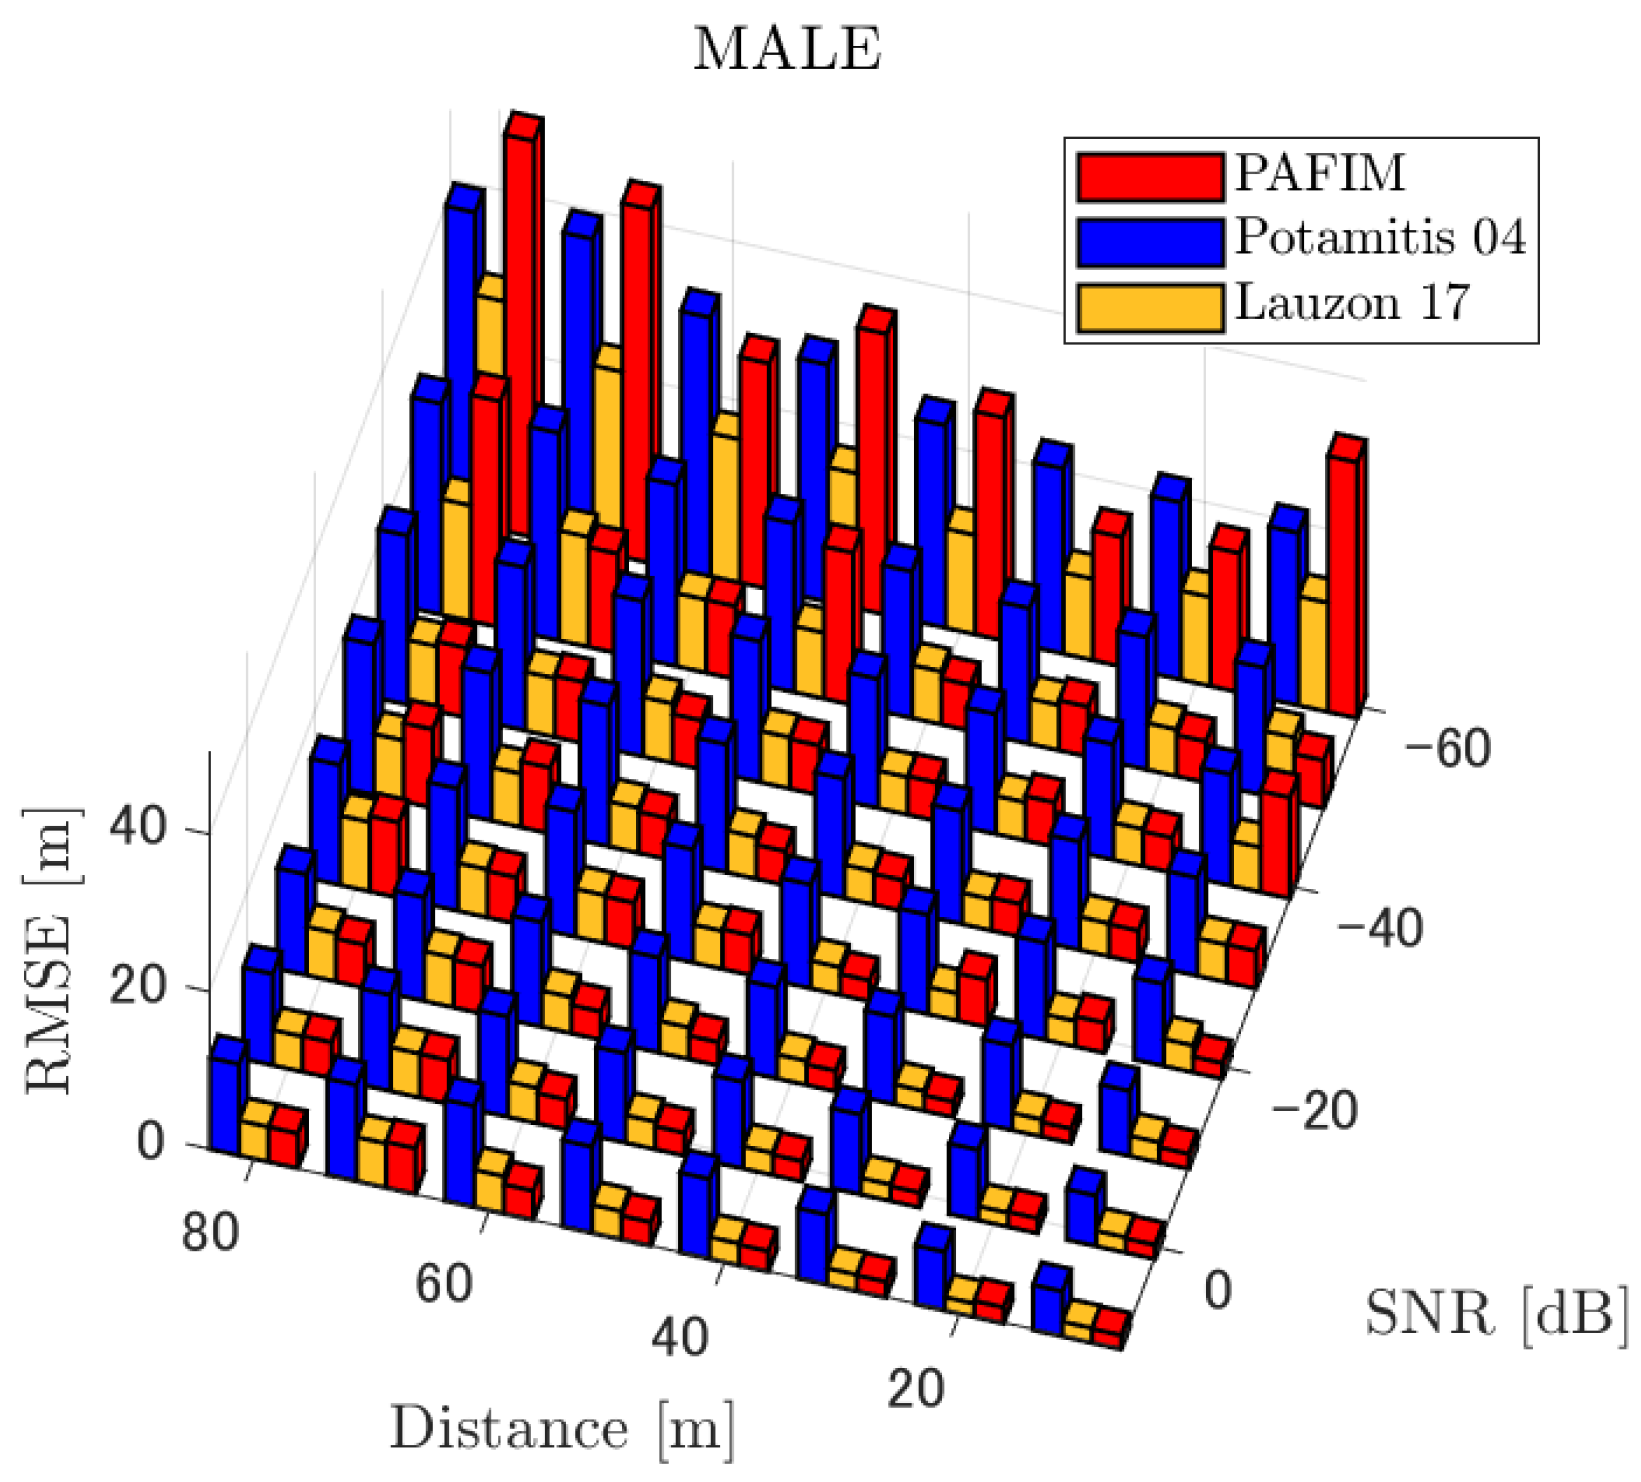
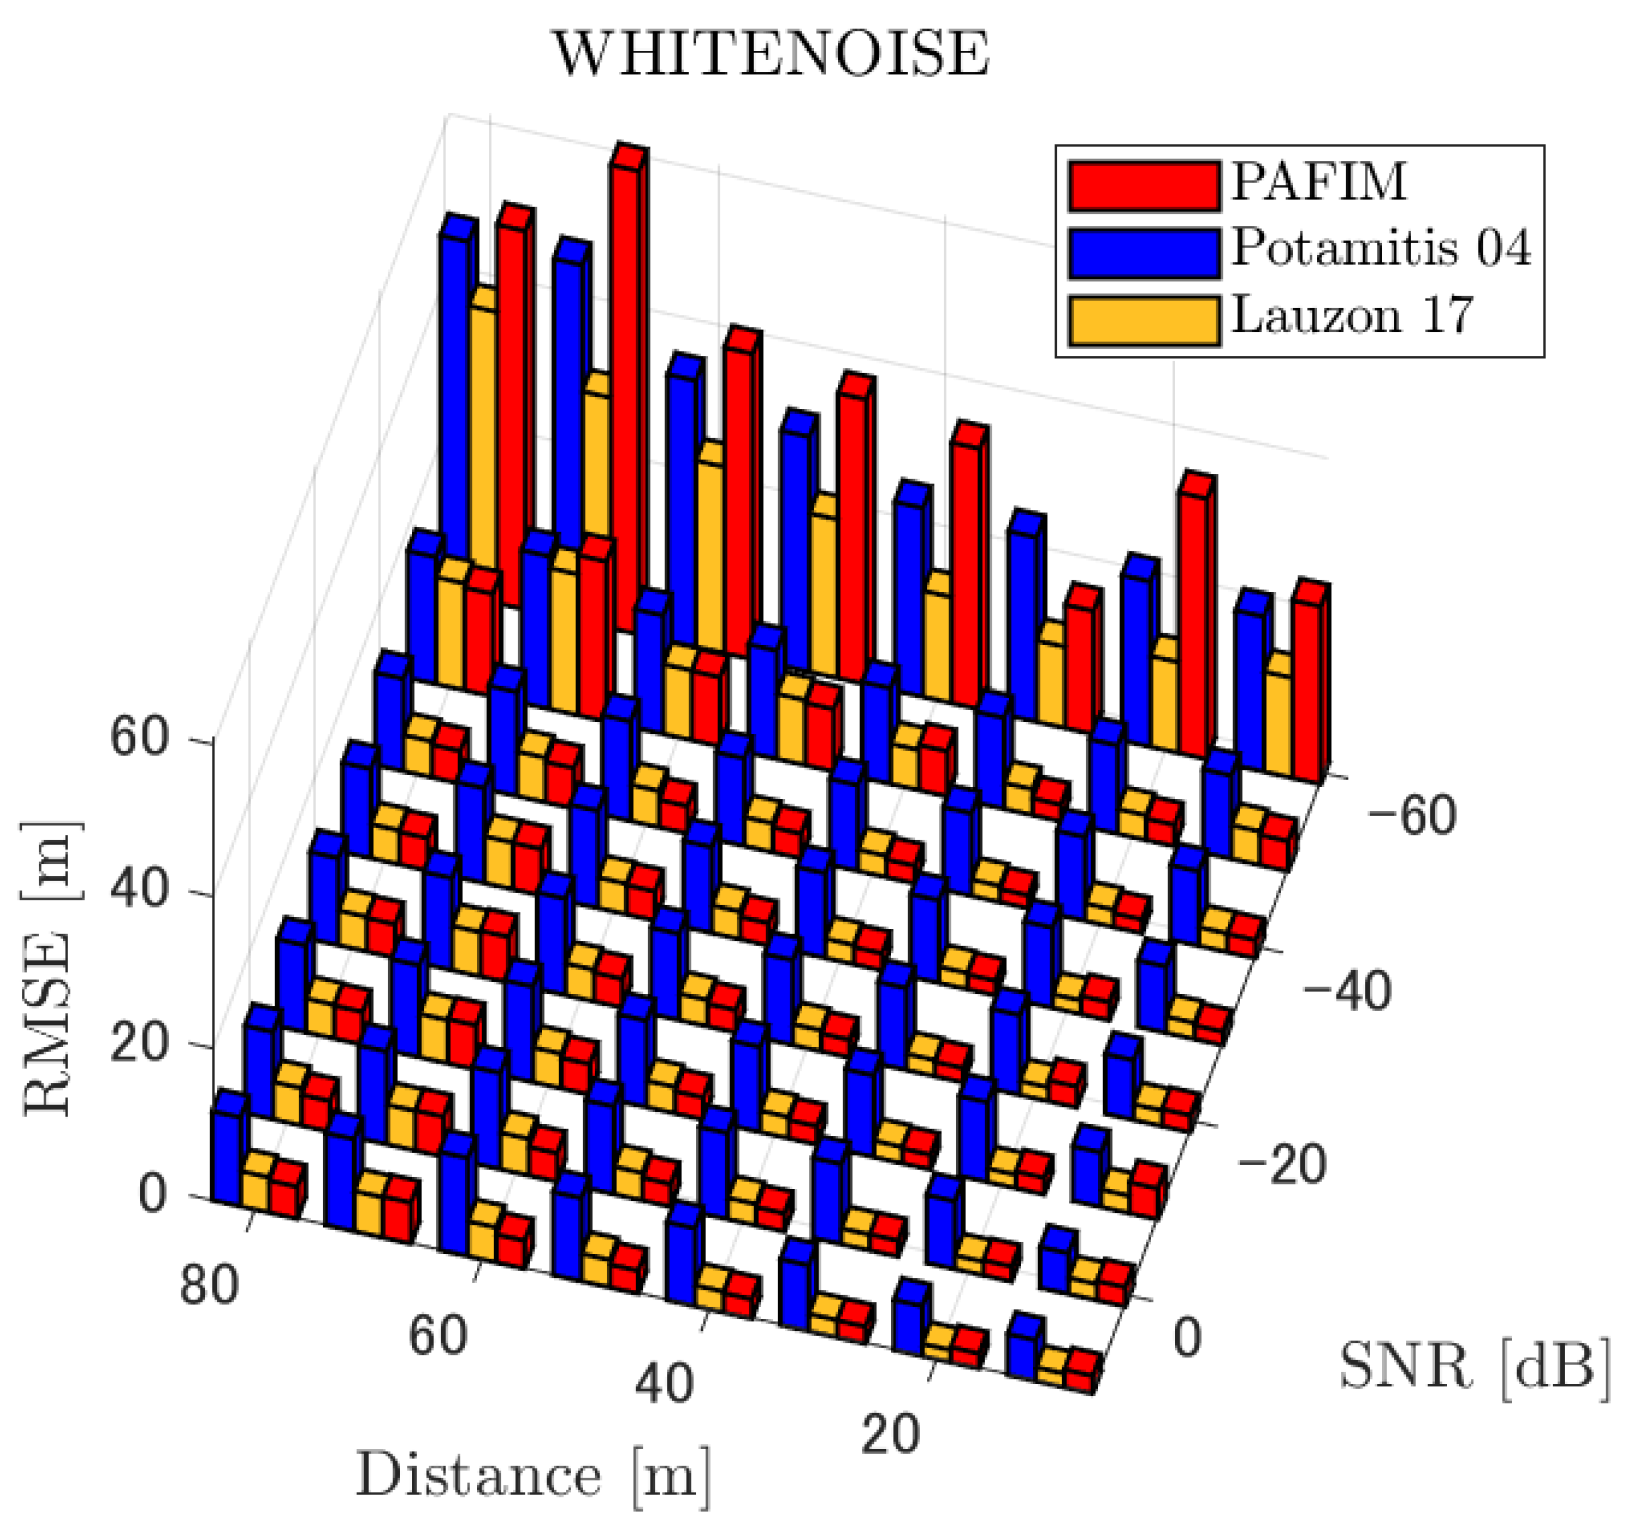
| Female | Male | White Noise | ||
|---|---|---|---|---|
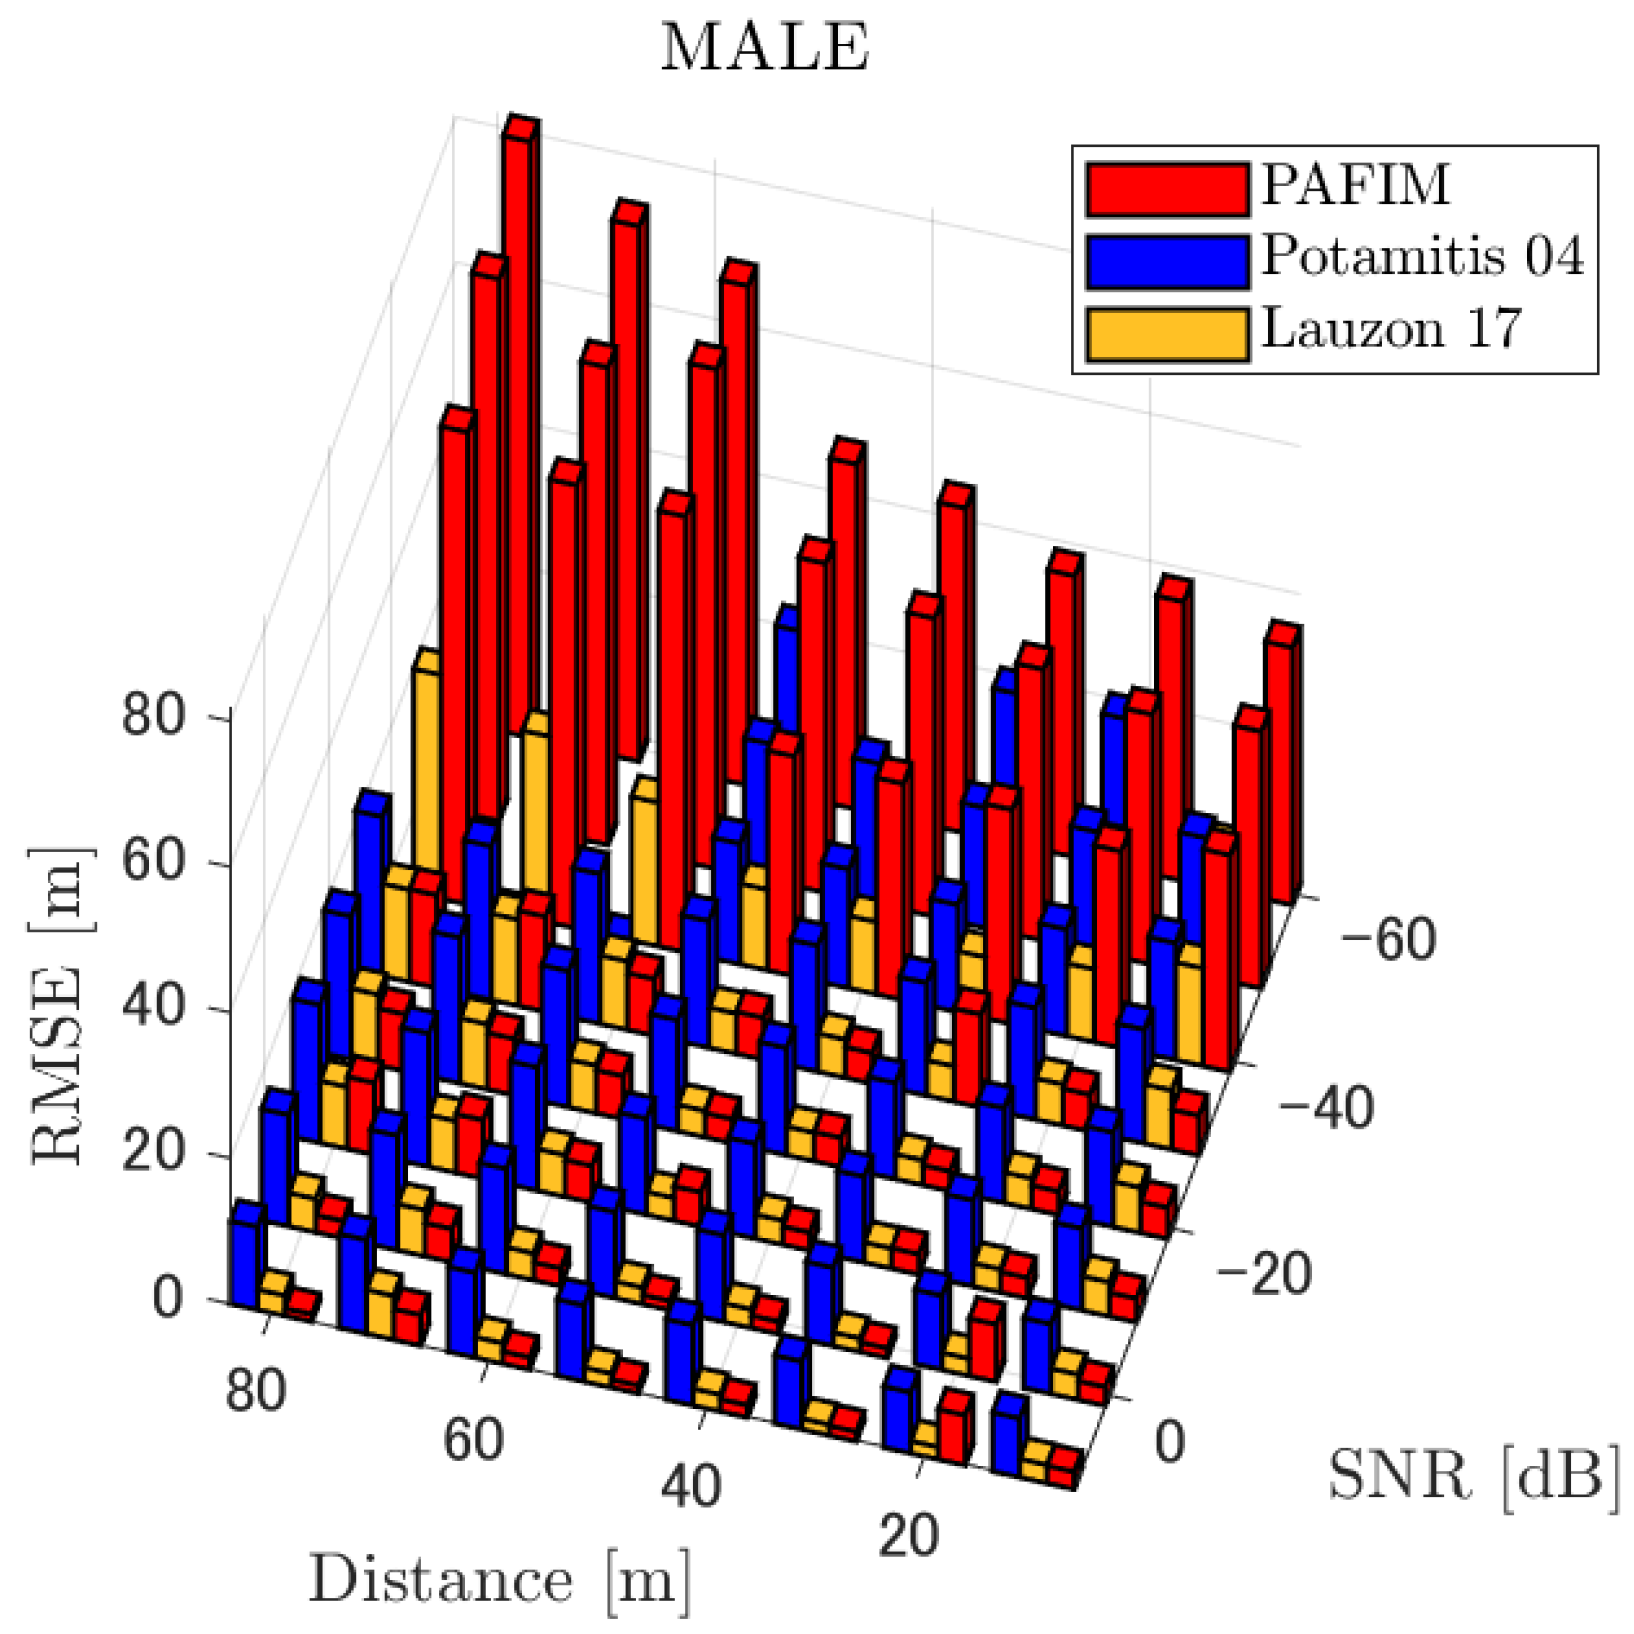
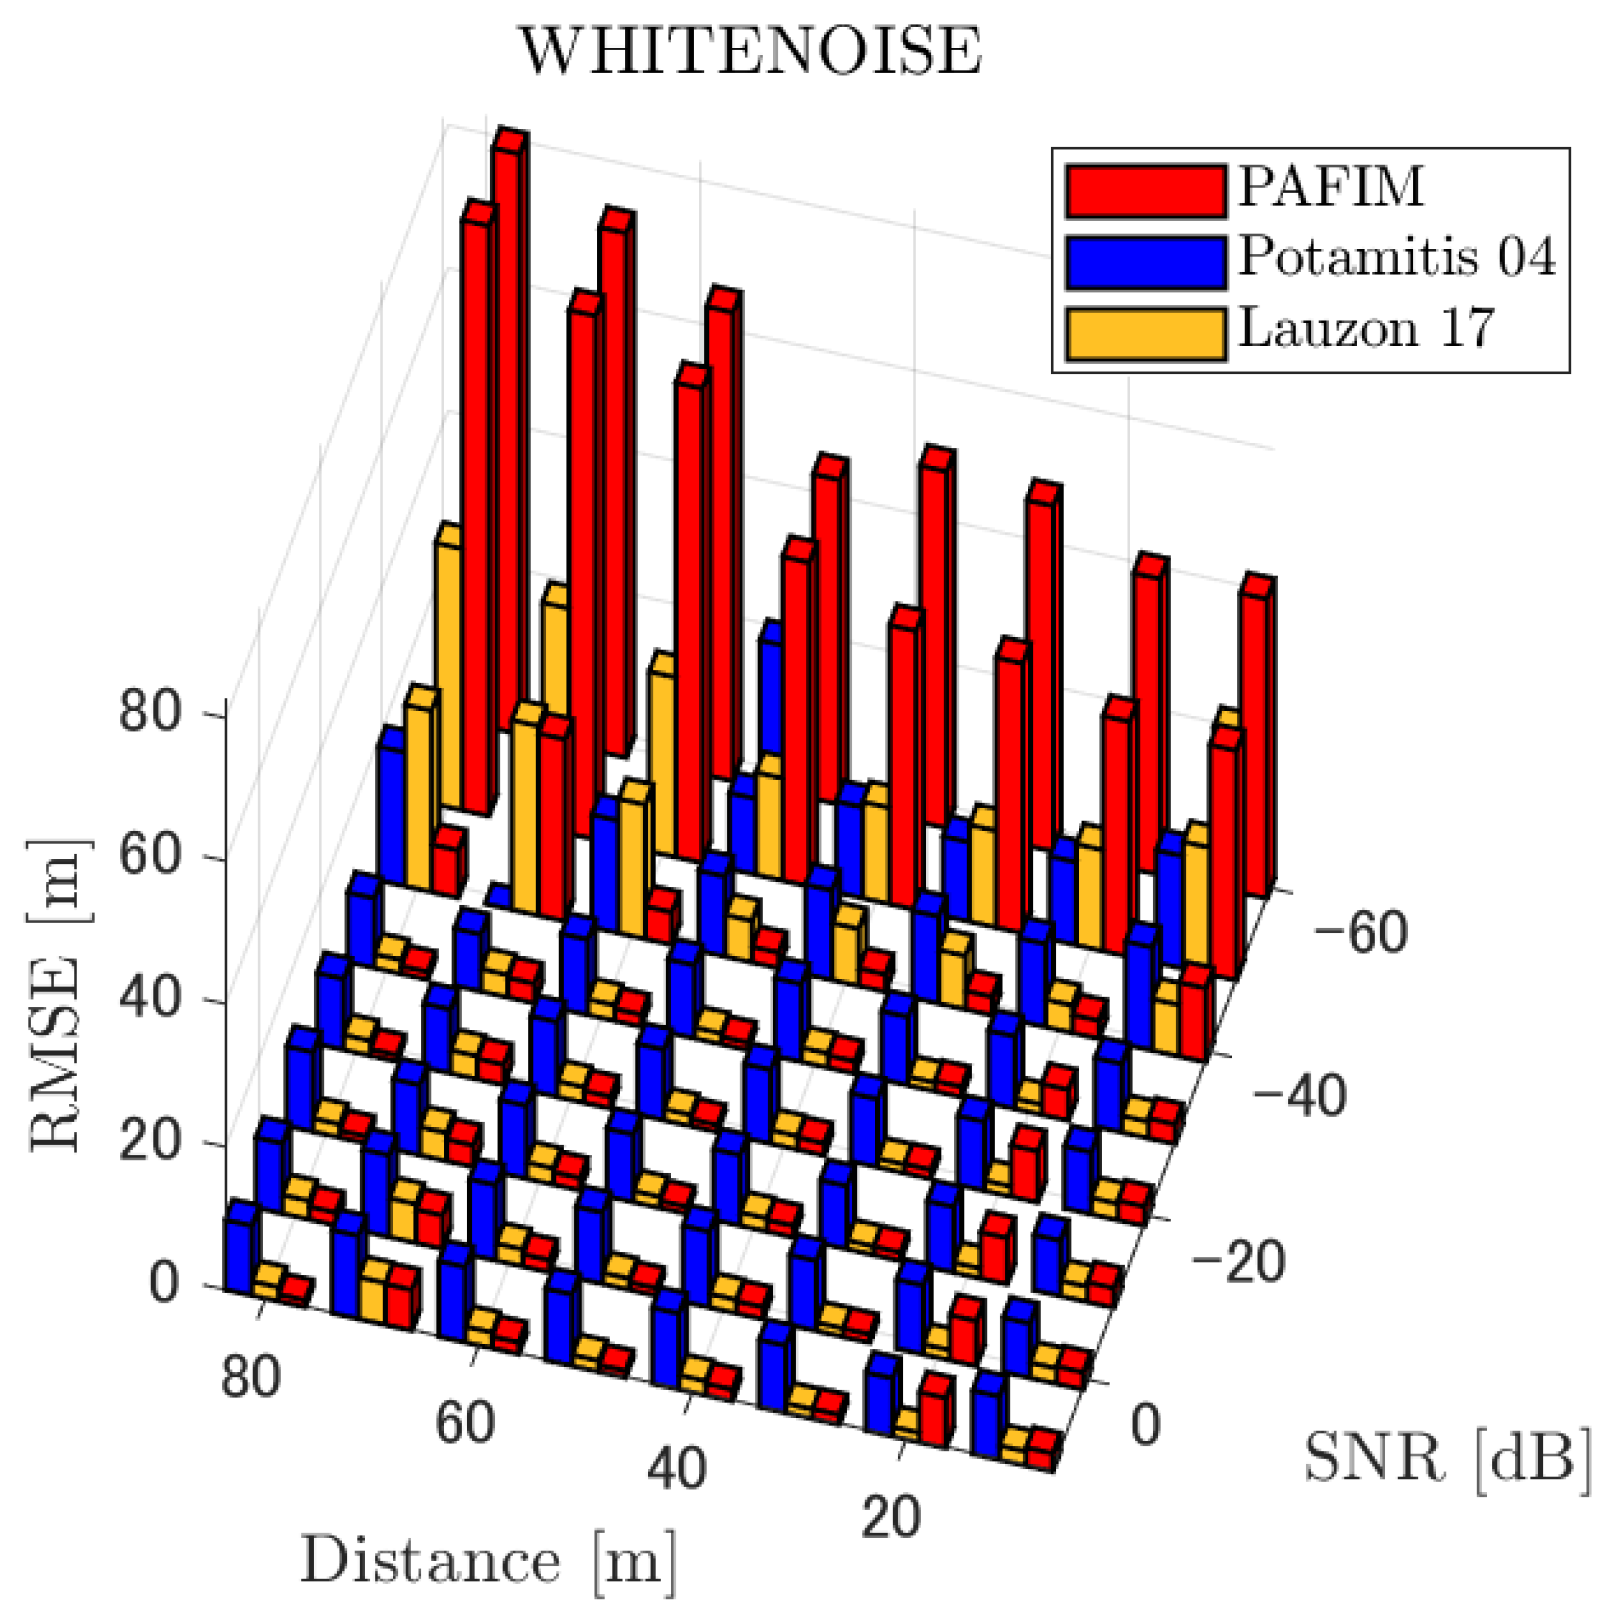
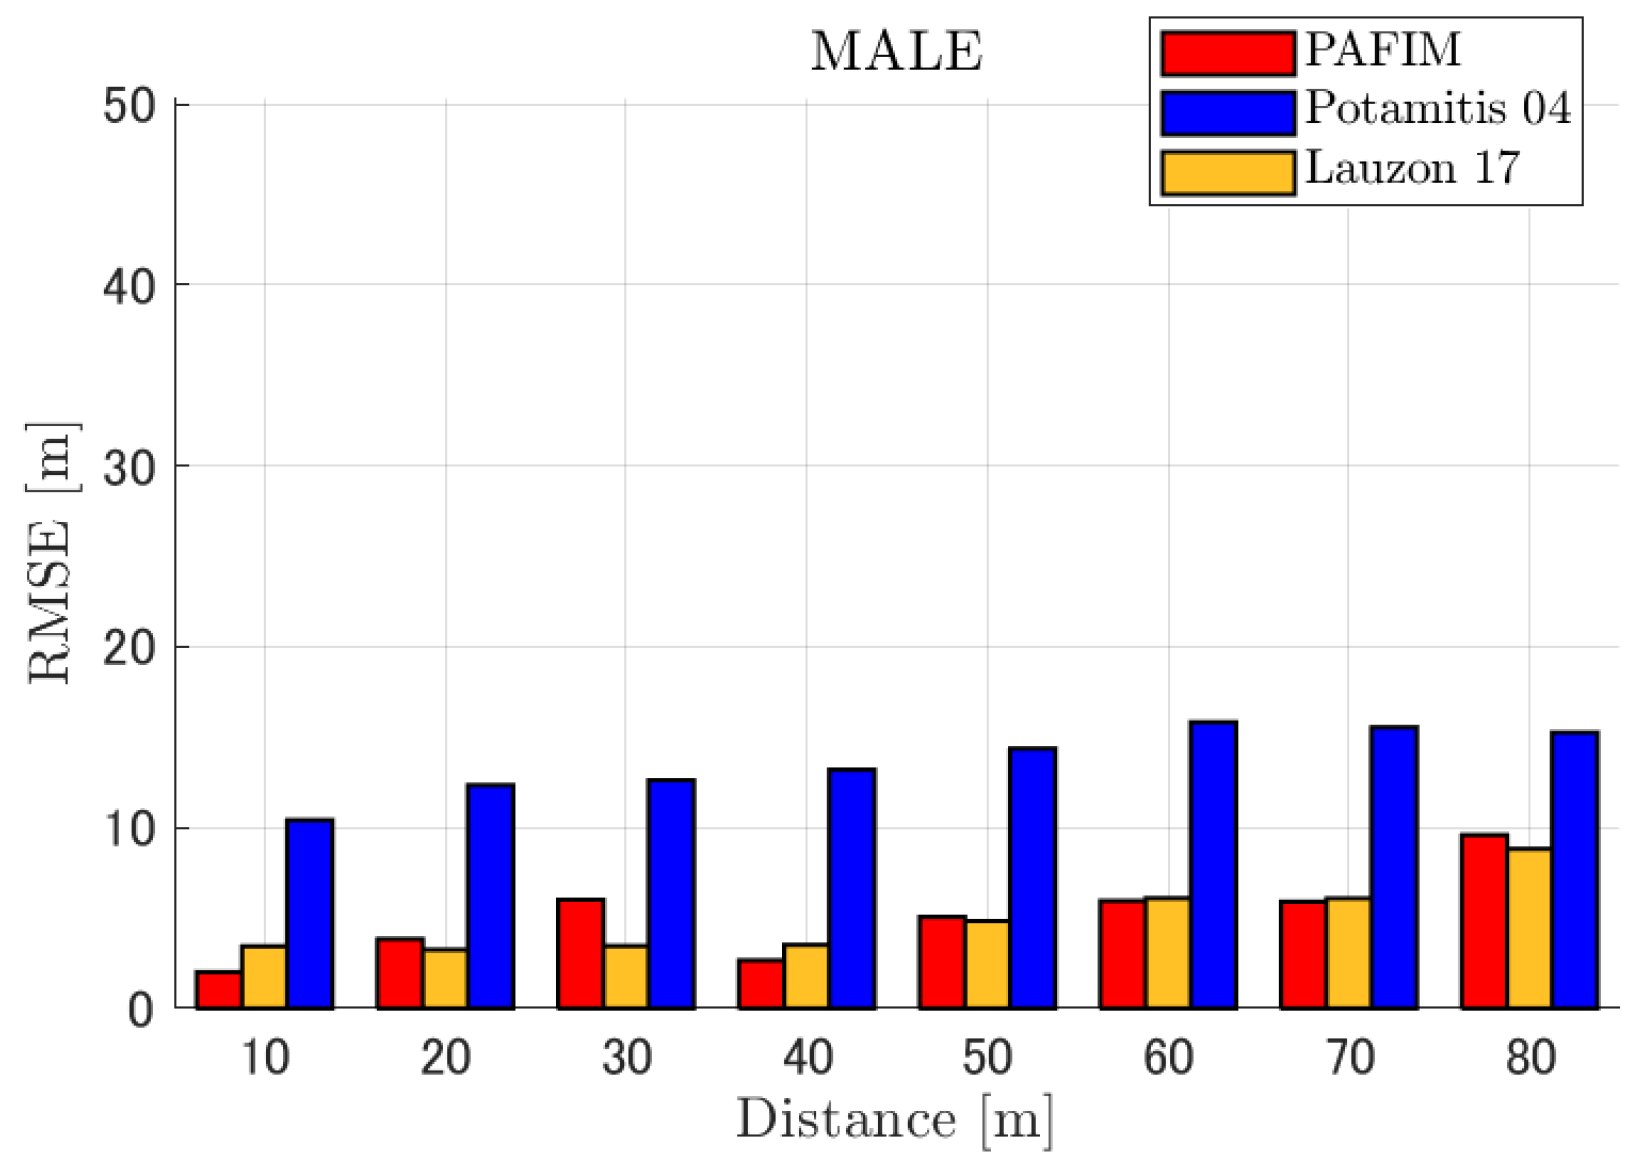
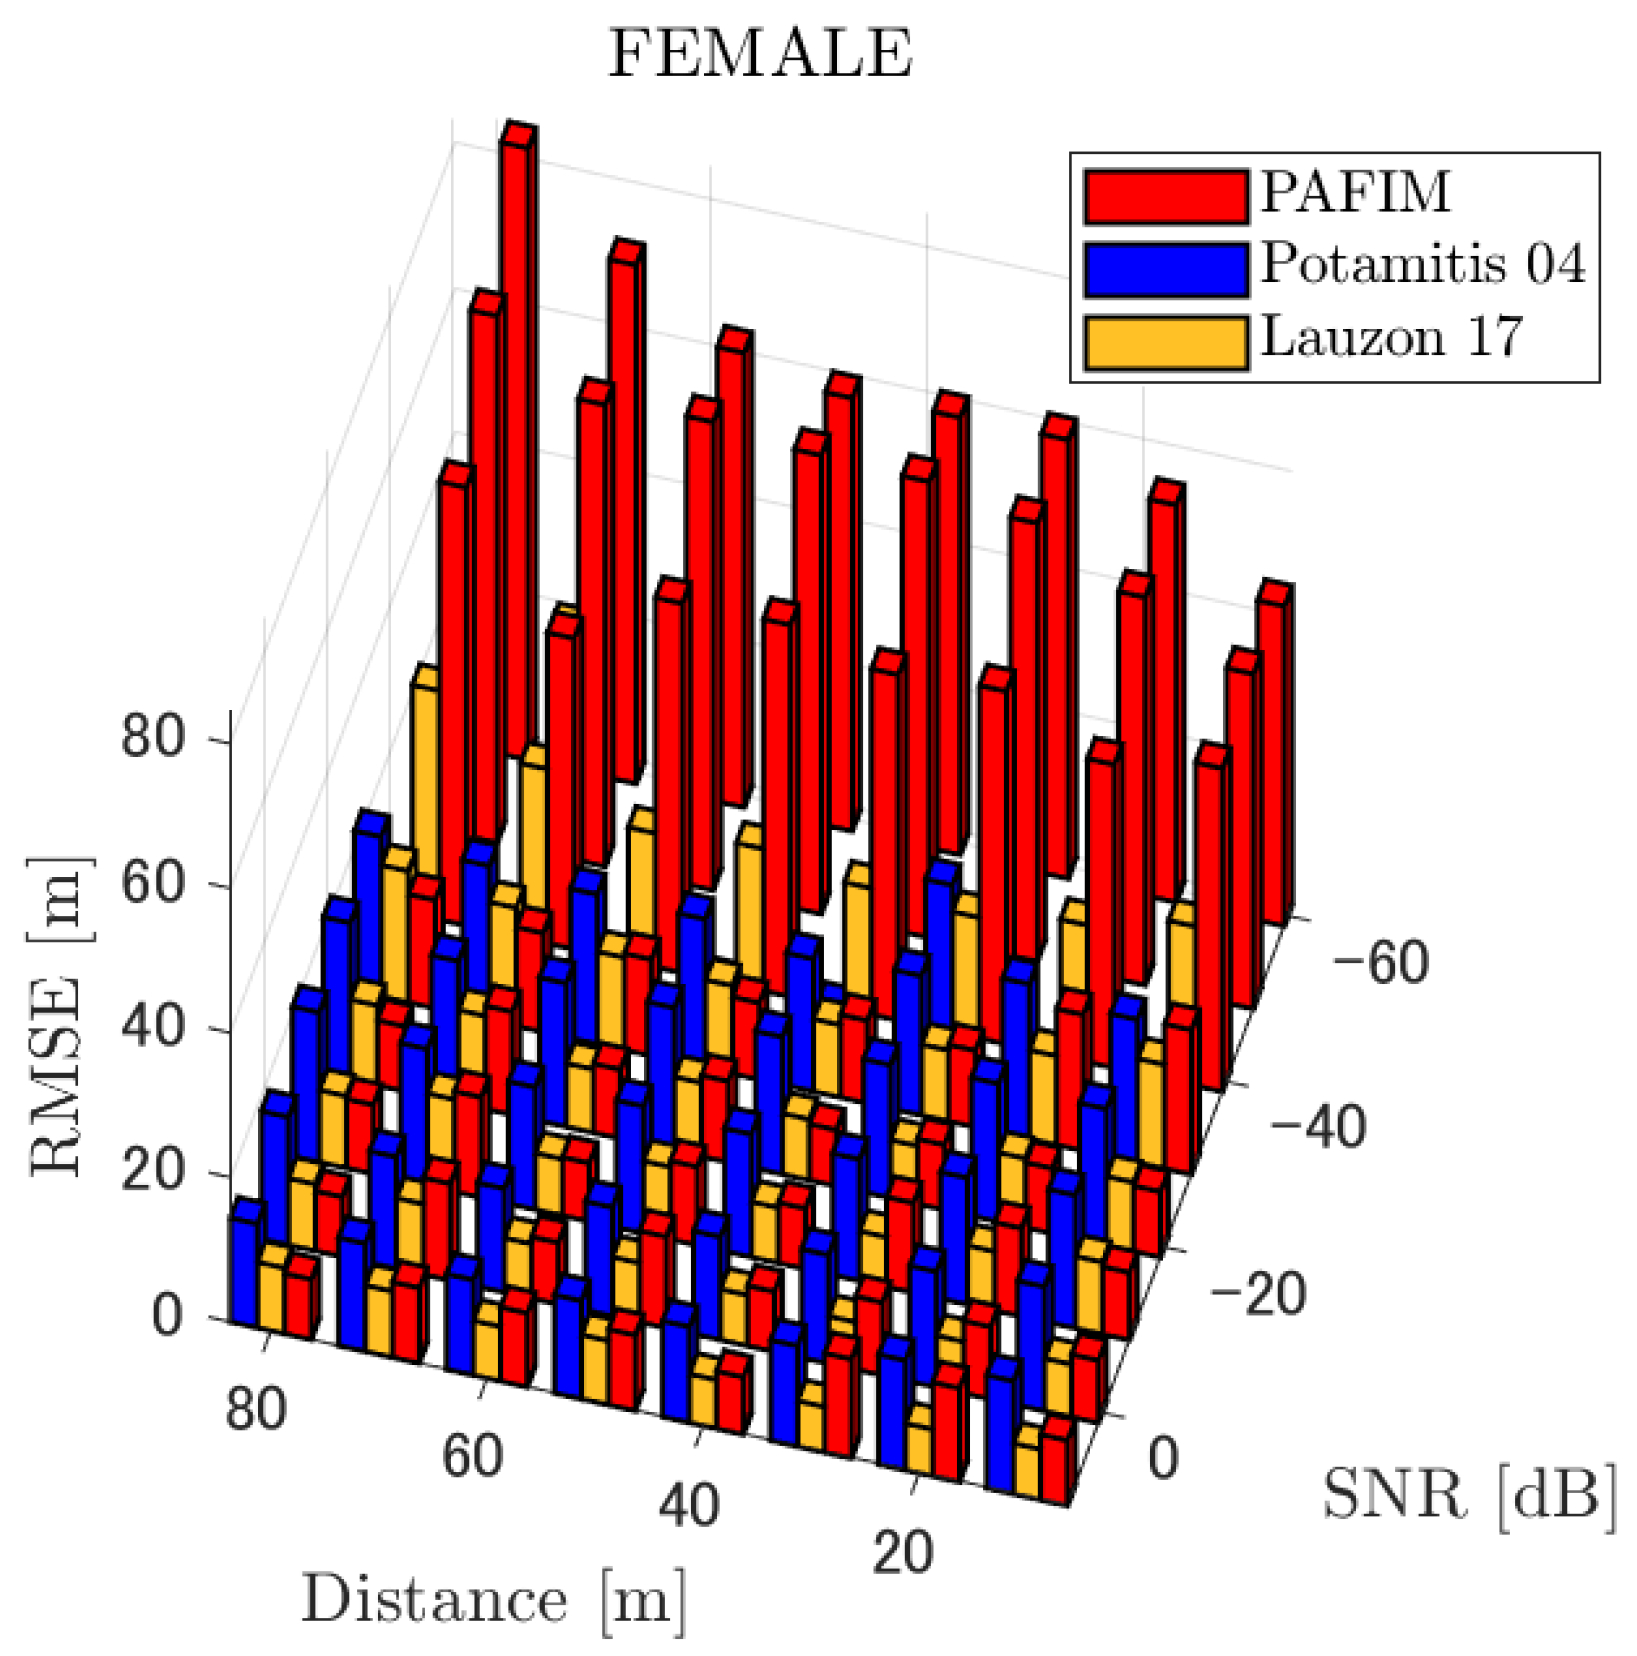
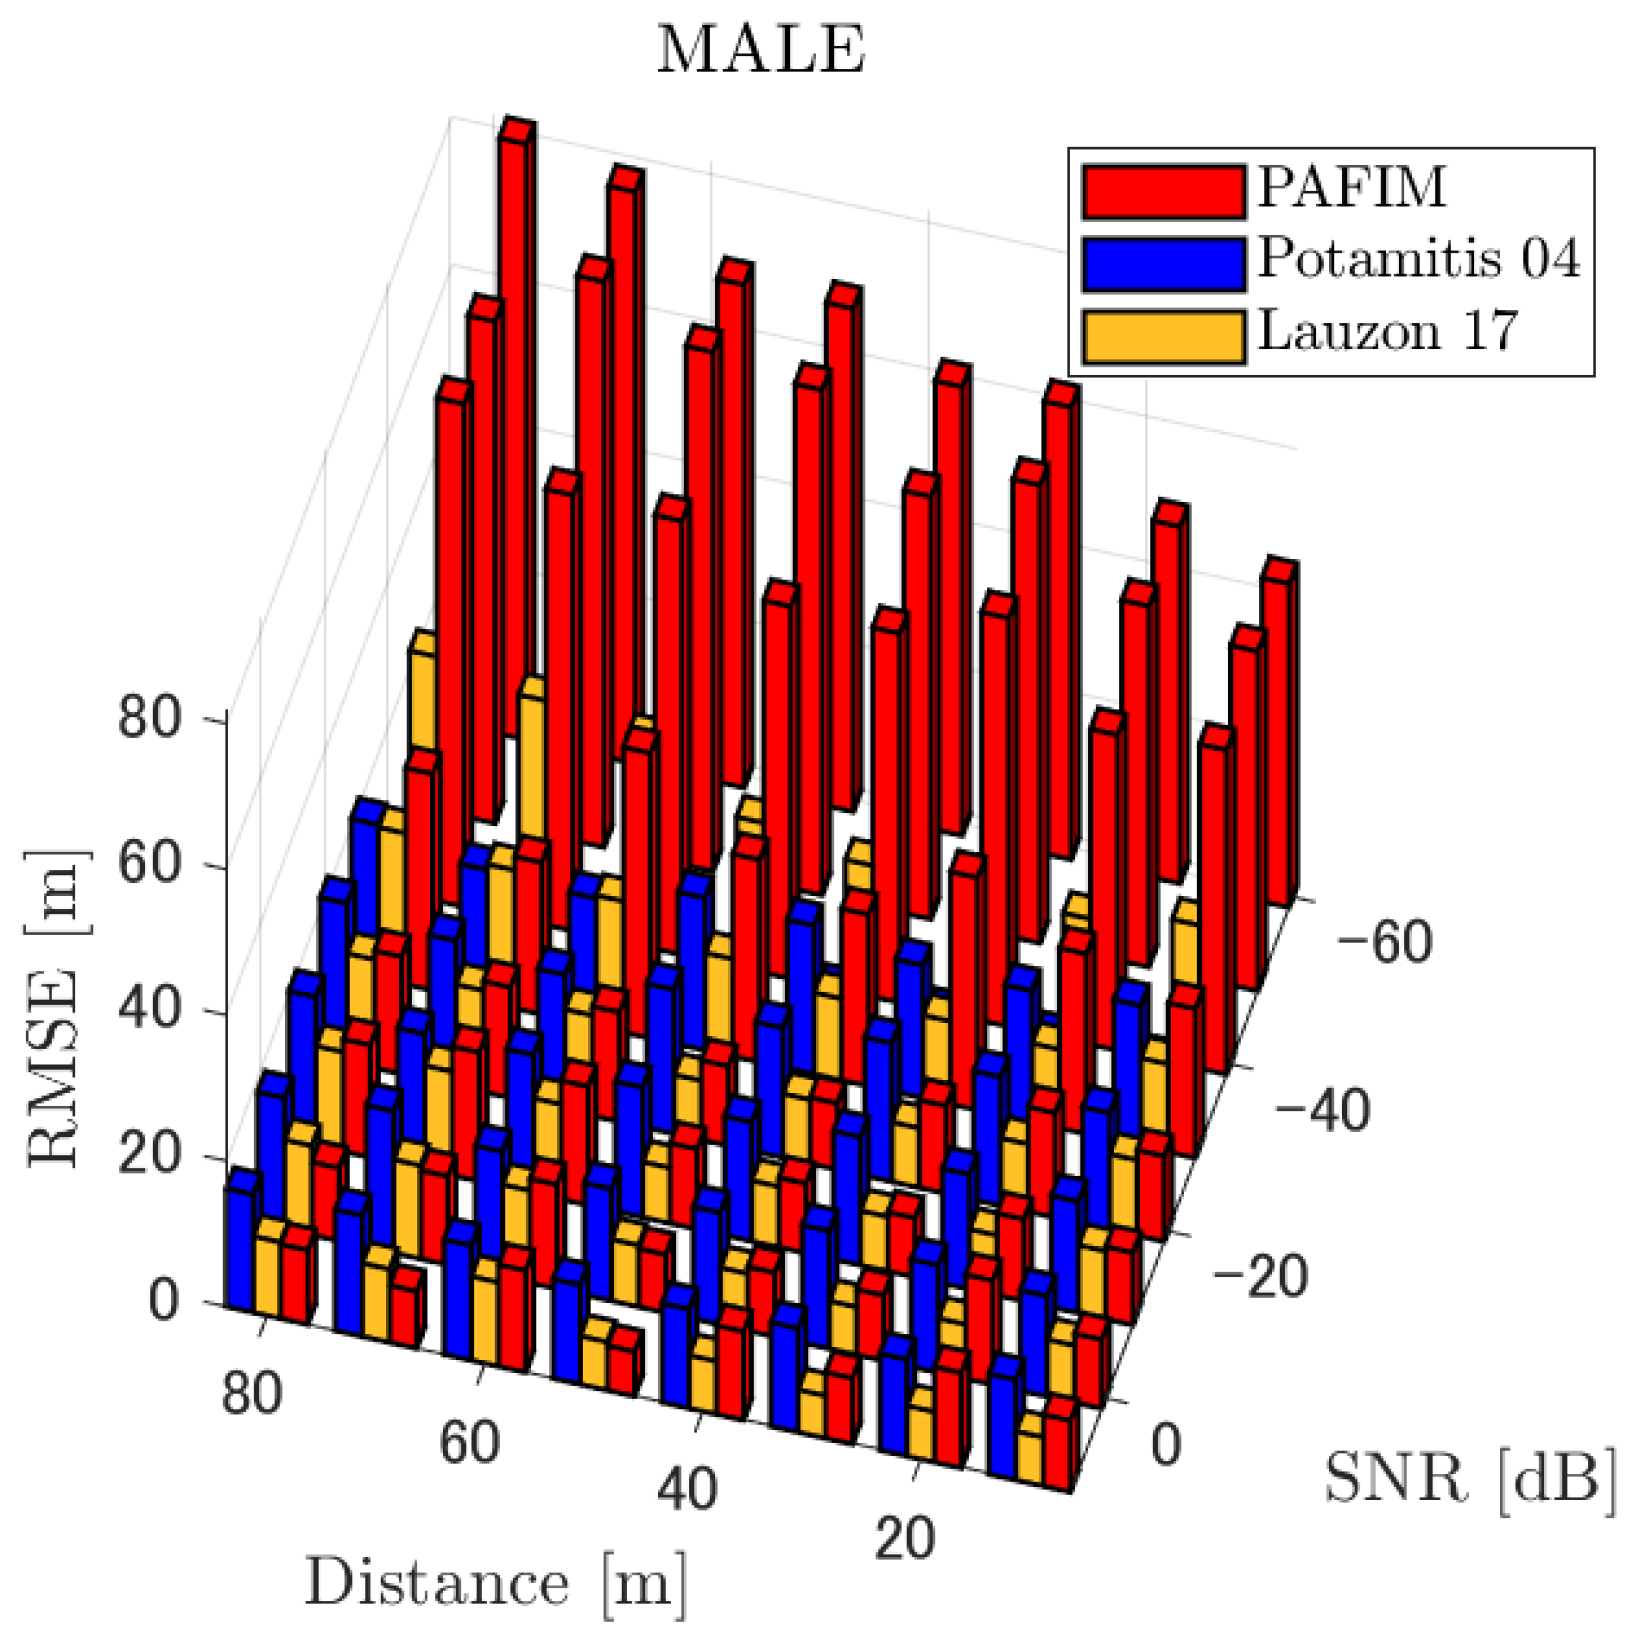
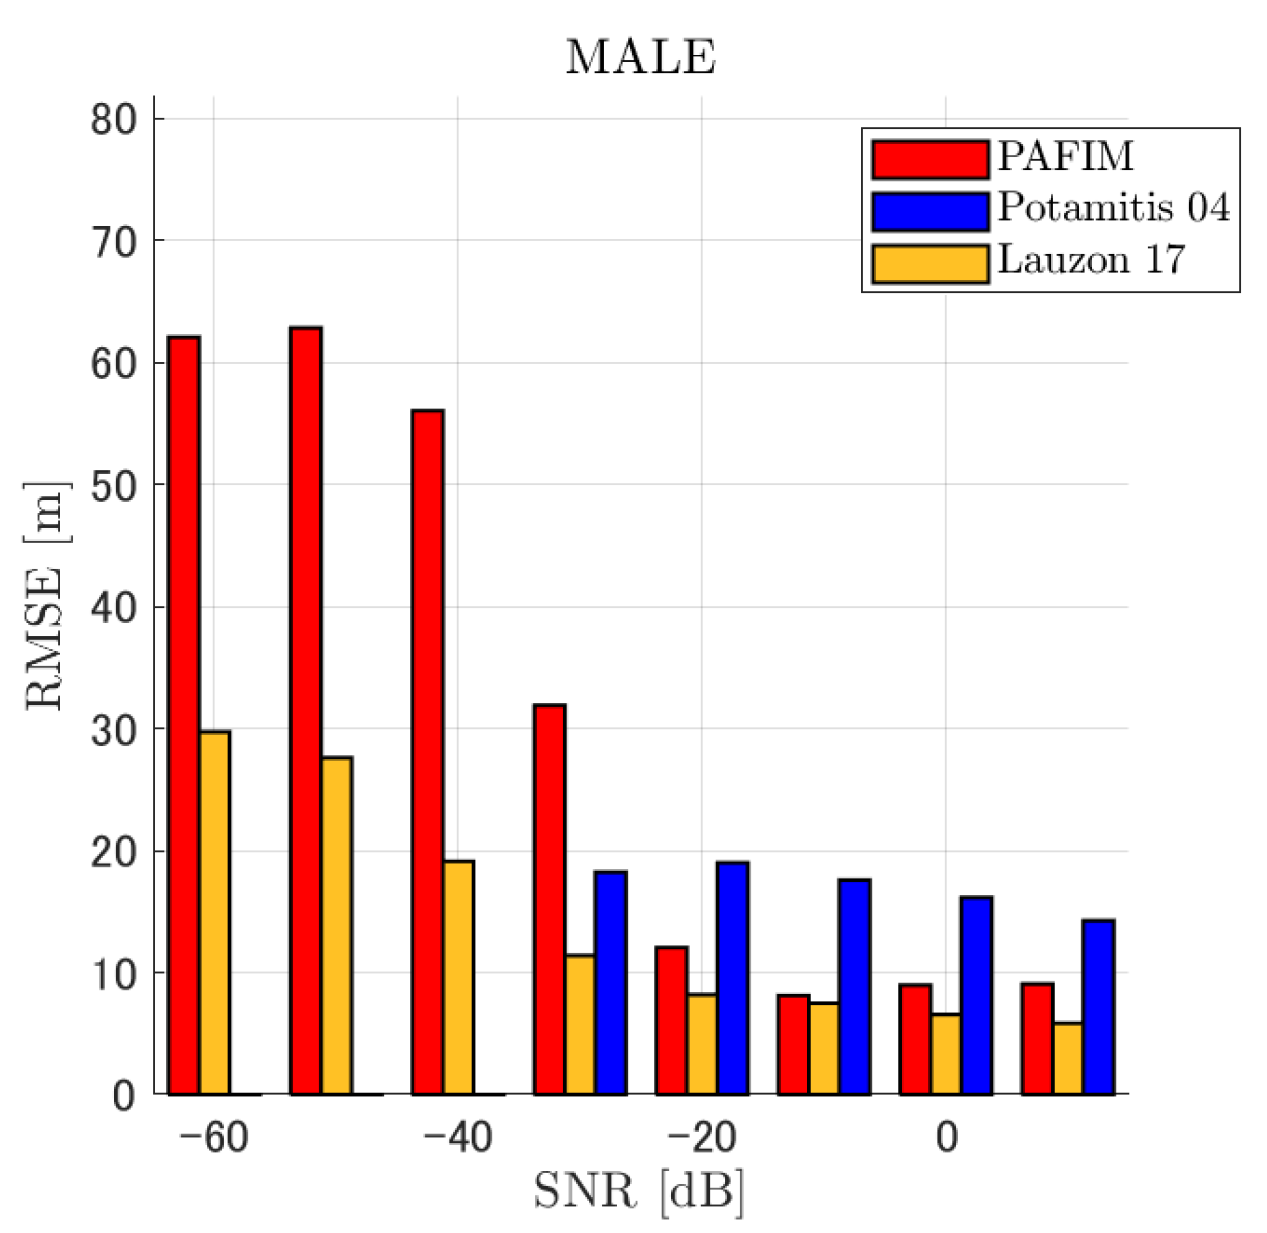
| Stationary | Figure 5 | Overall | Figure 6 | Figure 7 |
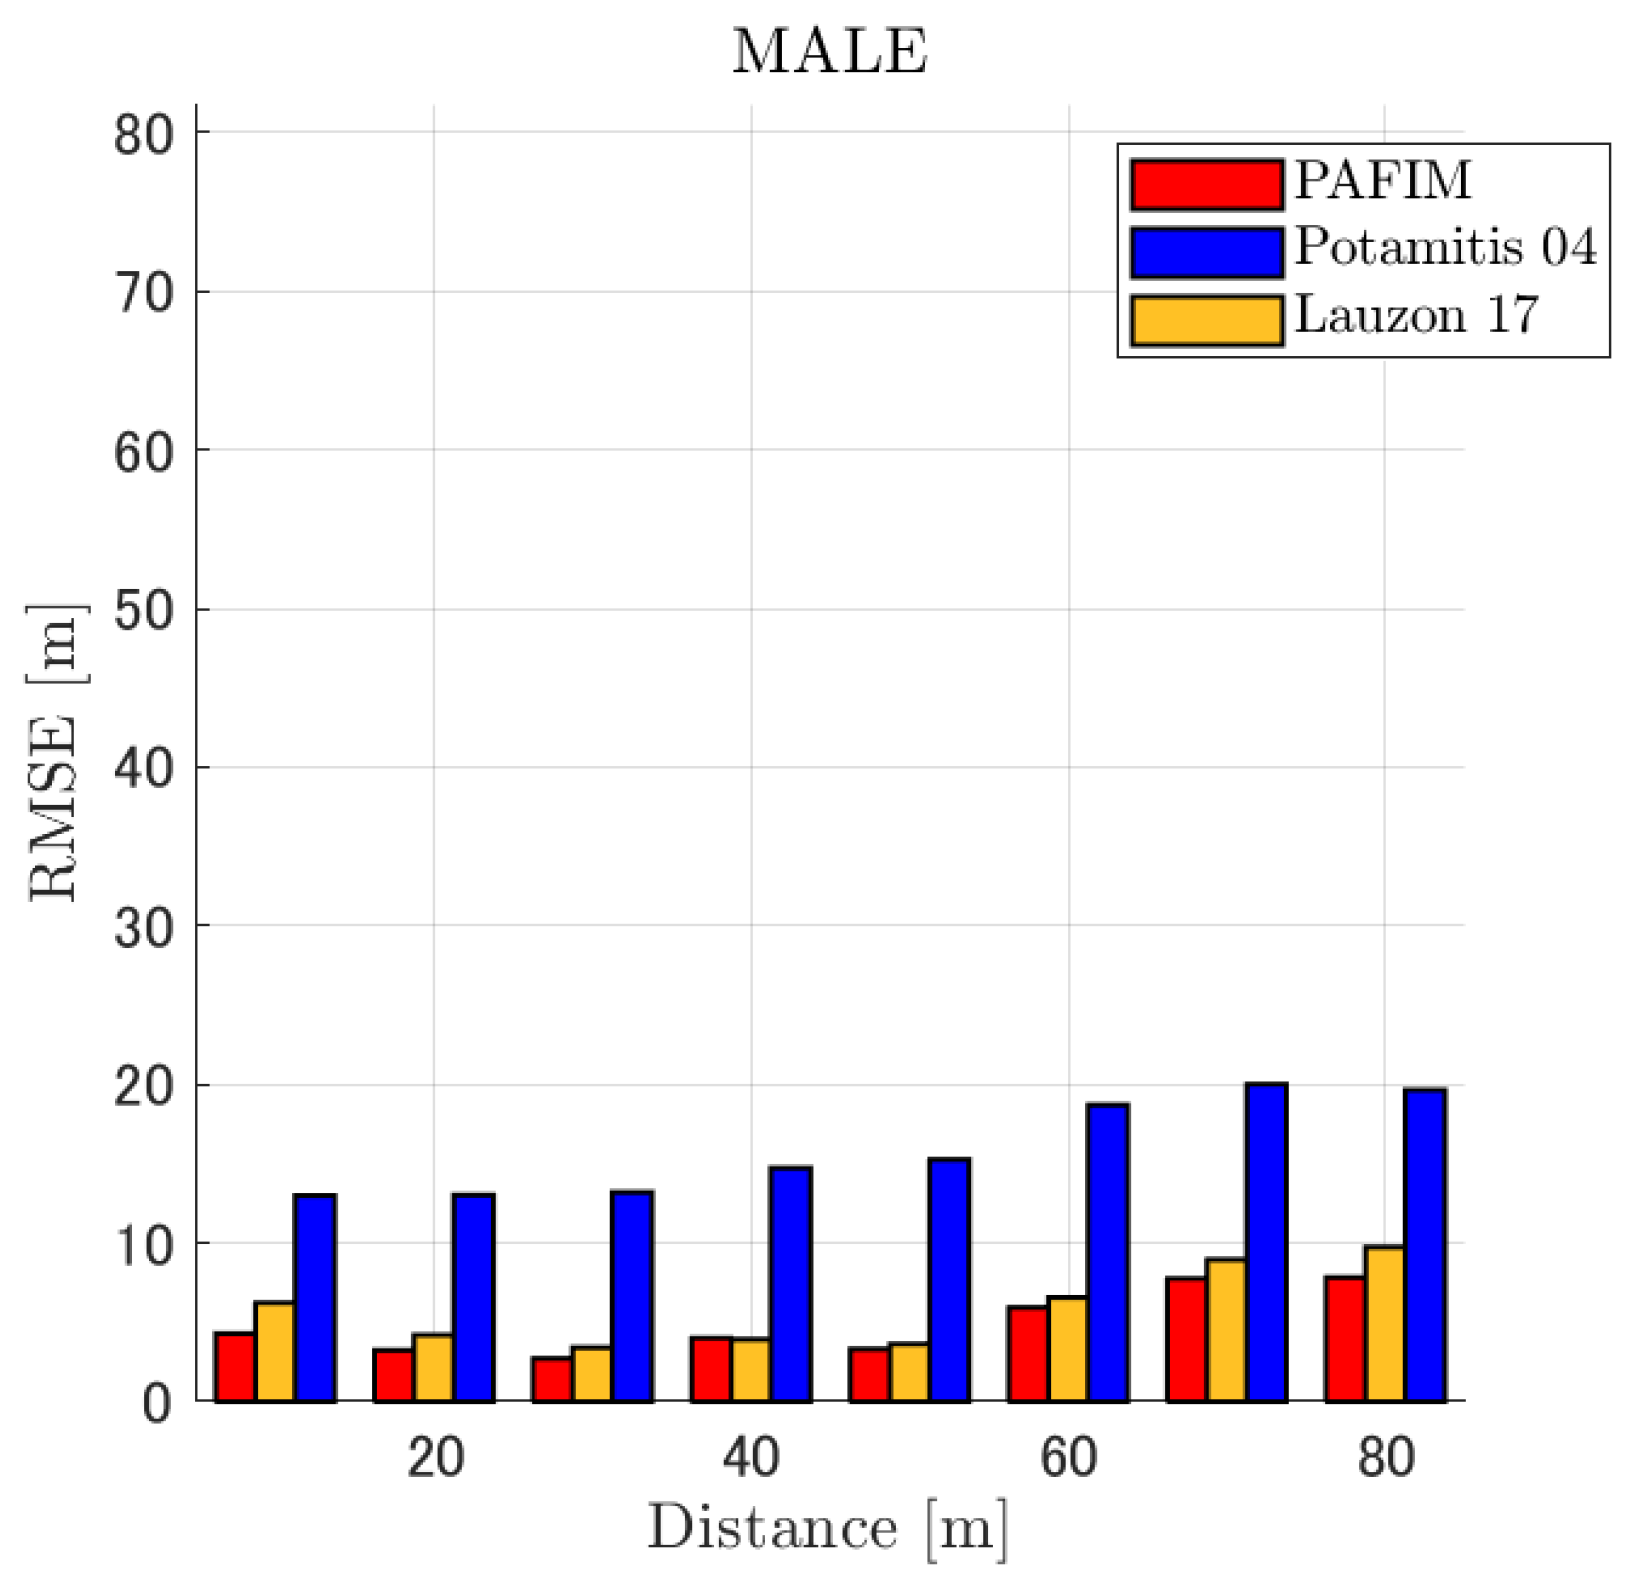
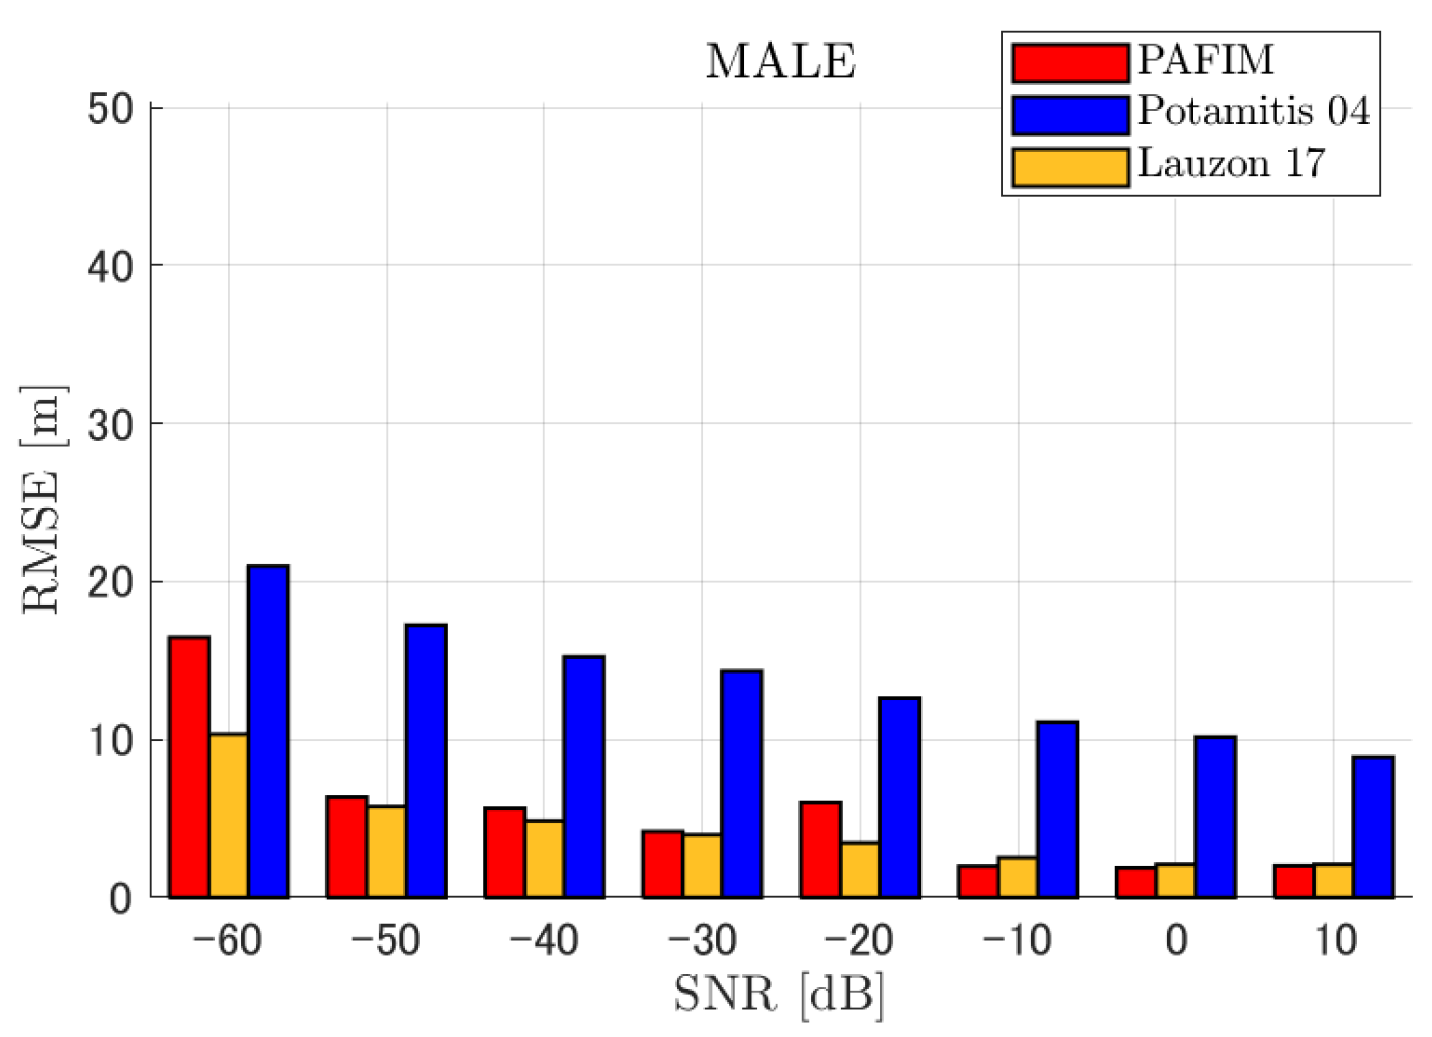
| Fixed the distance at 30 m | Figure 8 | |||
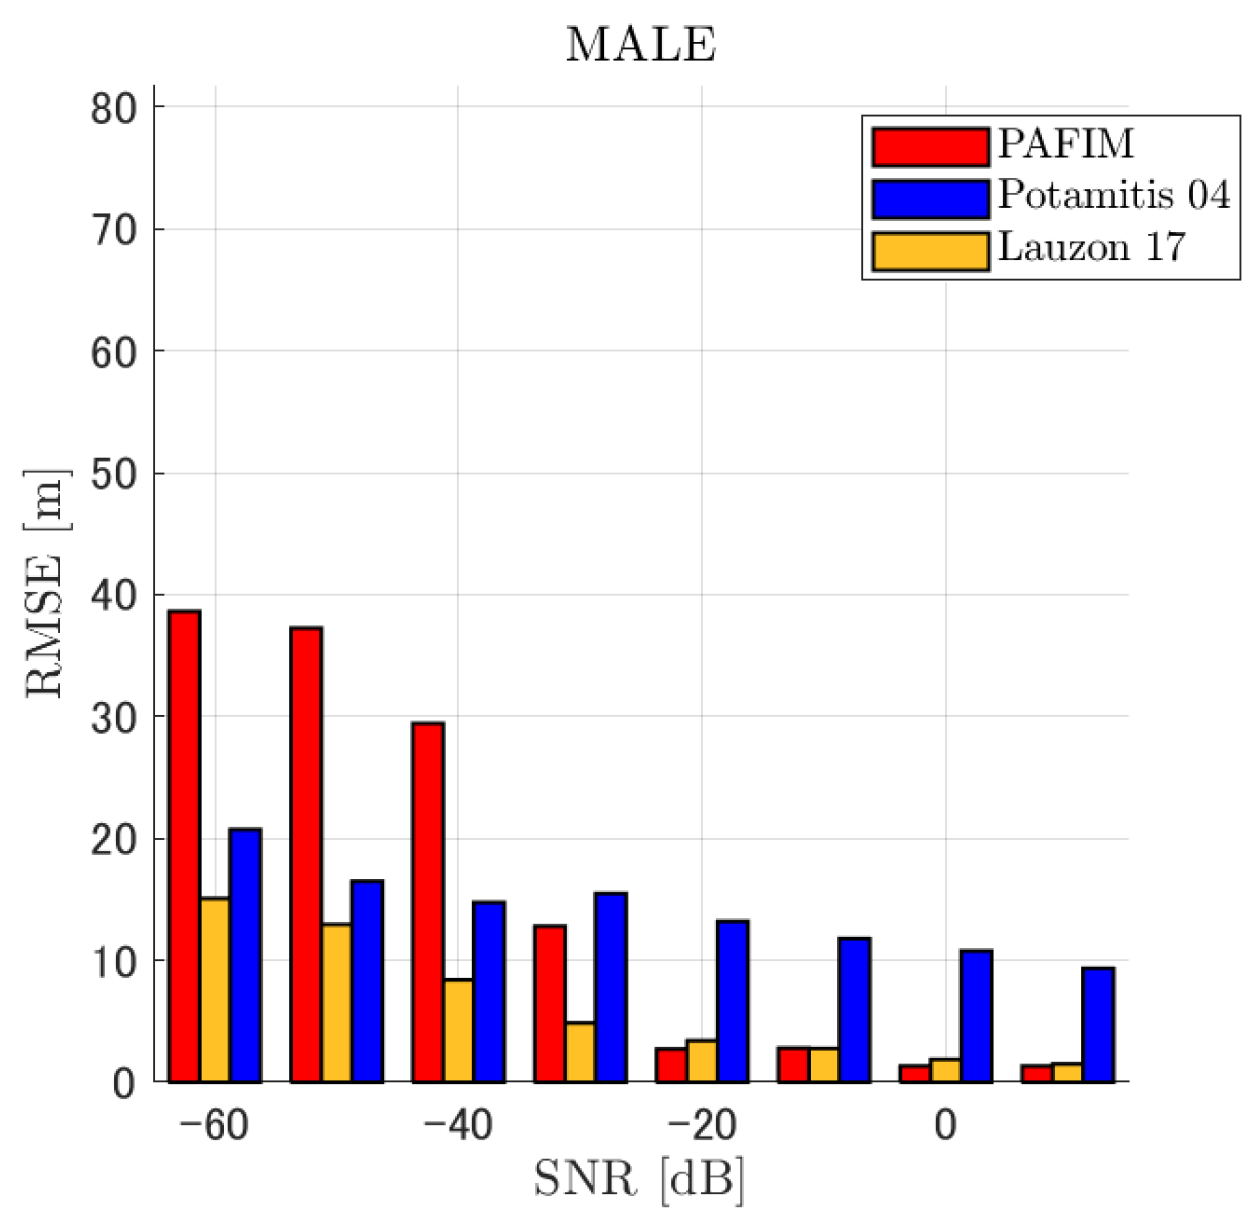
| Fixed the SNR at −20 dB | Figure 9 | |||
| Circle | Figure 10 | Overall | Figure 11 | Figure 12 |
| Fixed the distance at 30 m | Figure 13 | |||
| Fixed the SNR at −20 dB | Figure 14 | |||
| Random walk | Figure 15 | Overall | Figure 16 | Figure 17 |
| Fixed the distance at 30 m | Figure 18 | |||
| Fixed the SNR at −20 dB | Figure 19 | |||


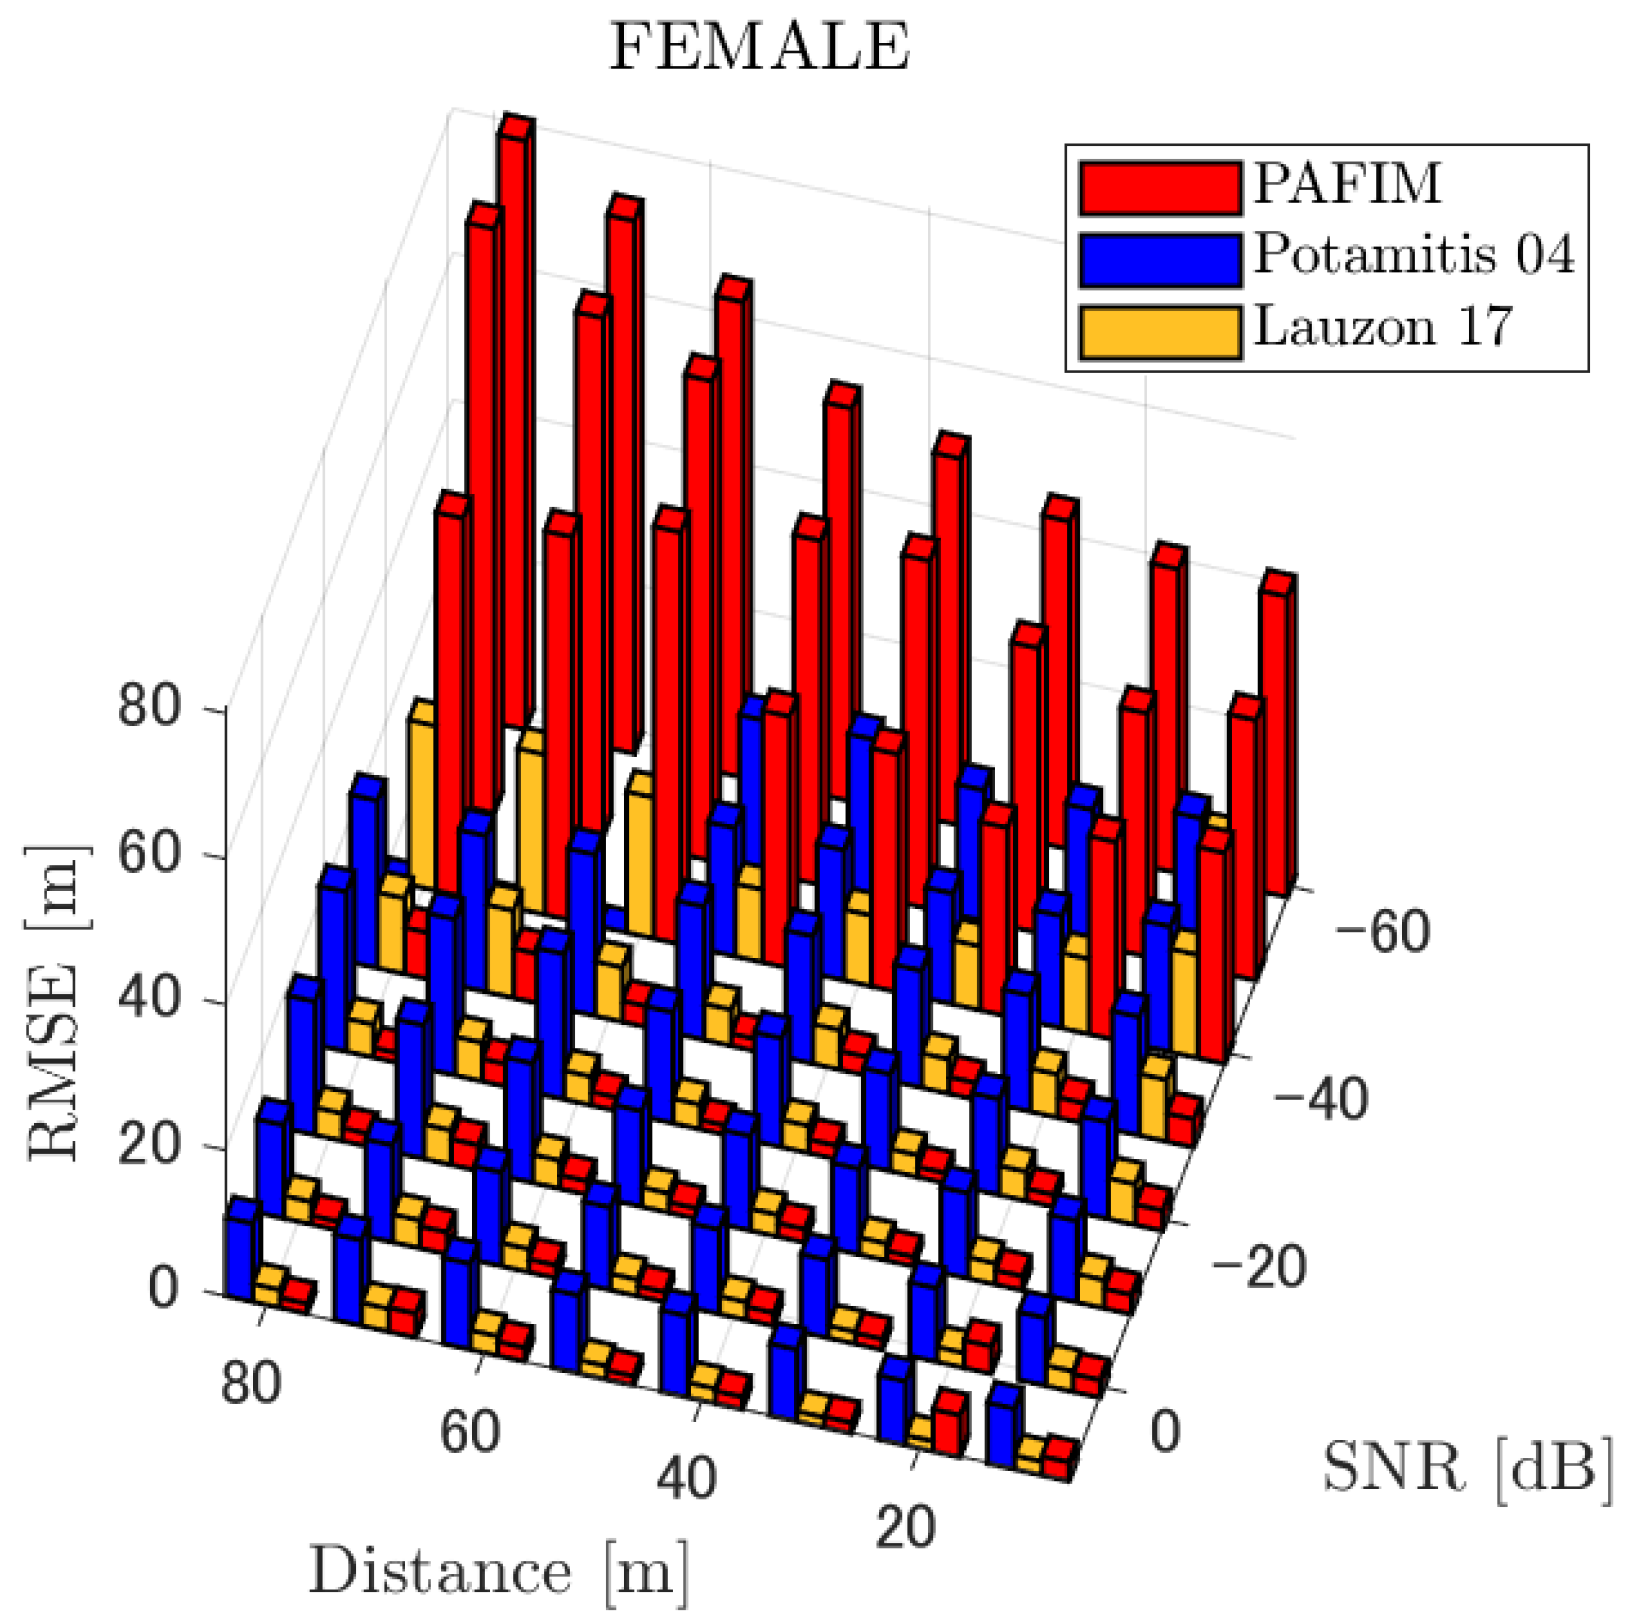
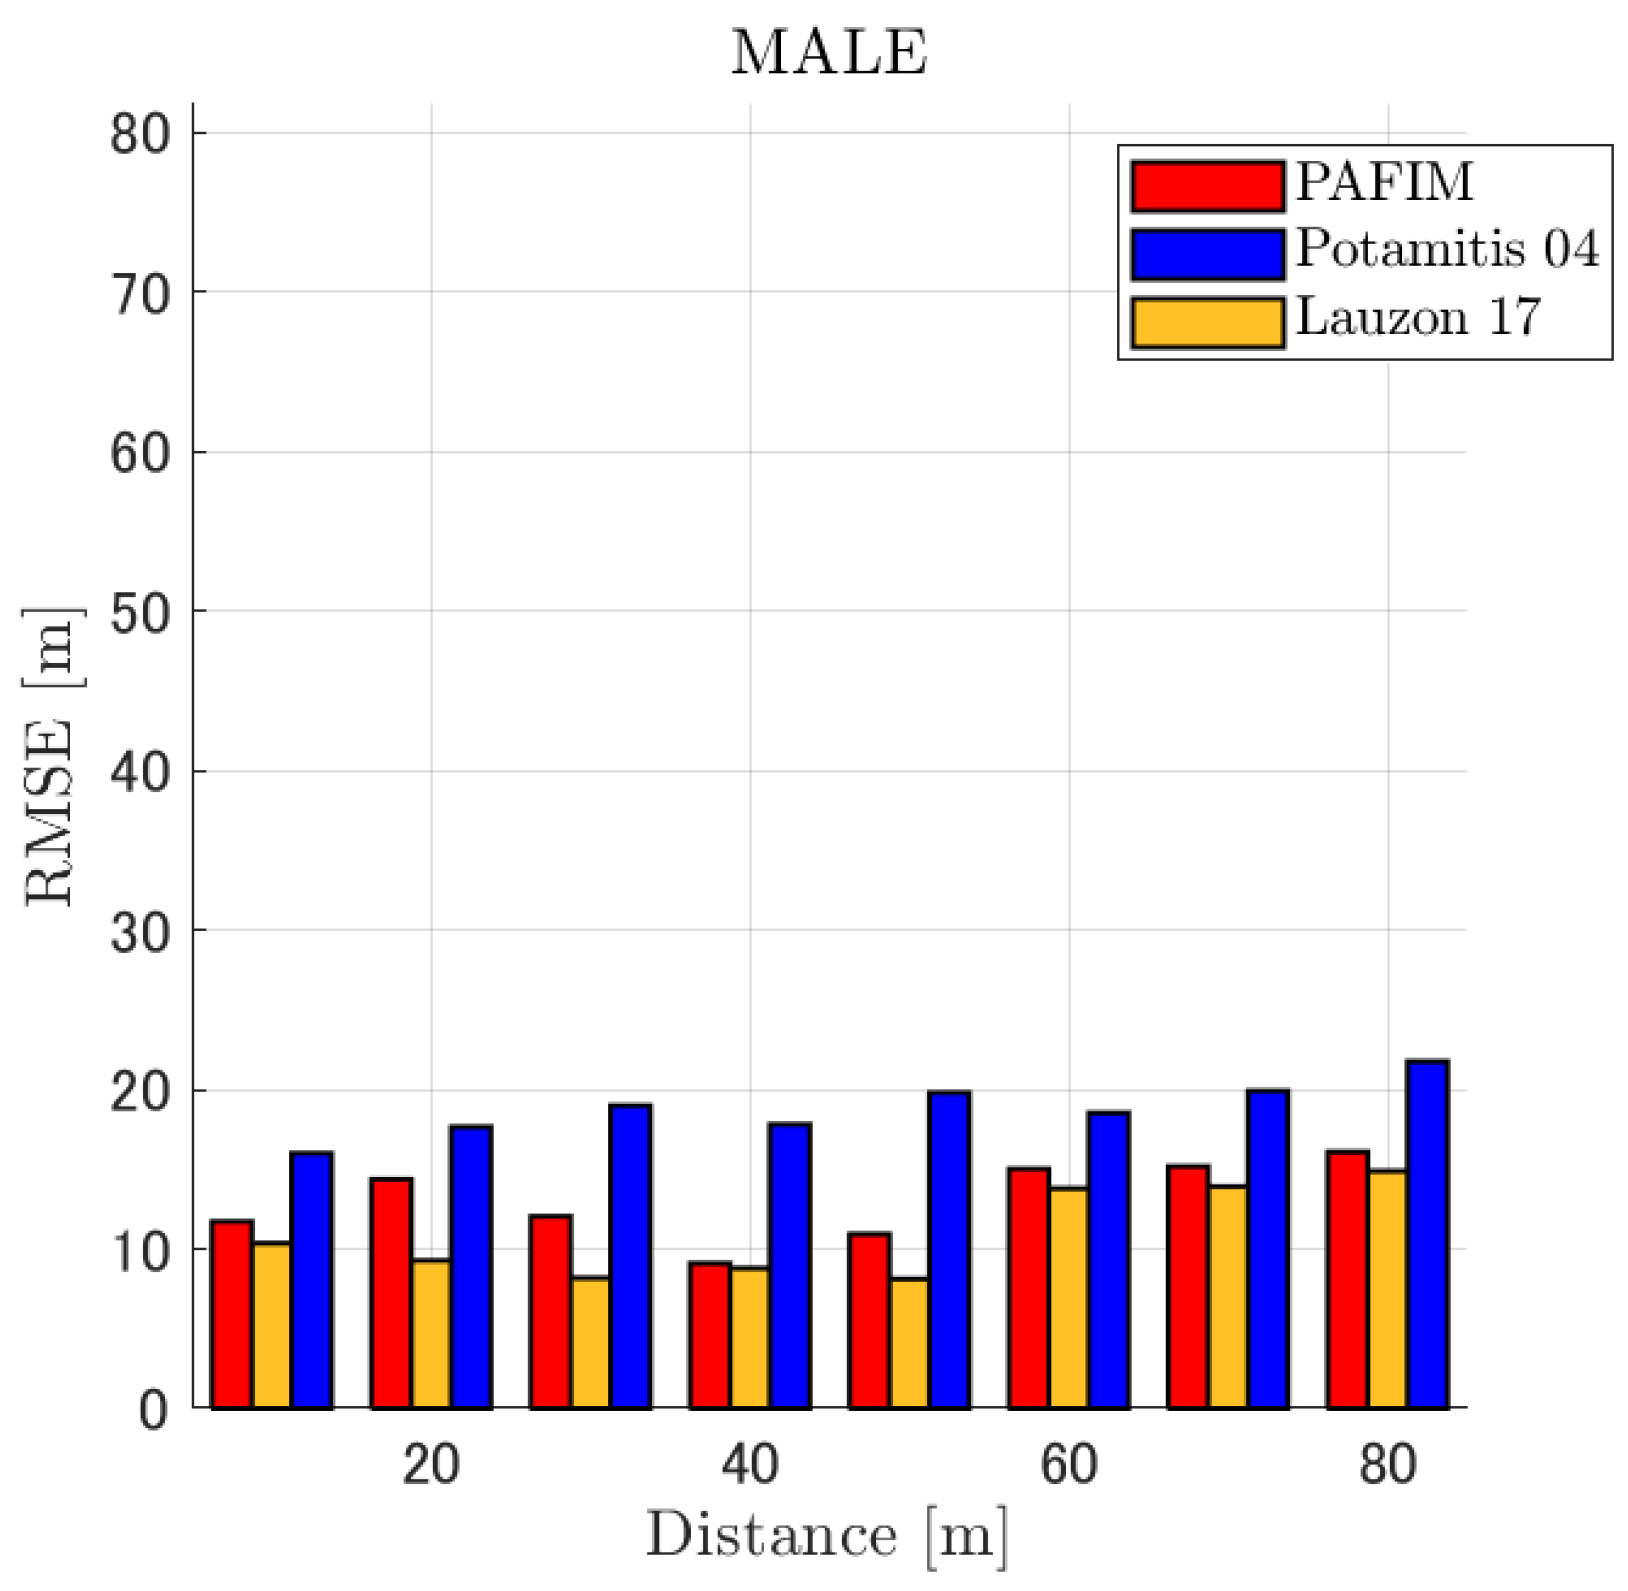
4.2.1. Discussion: Distance
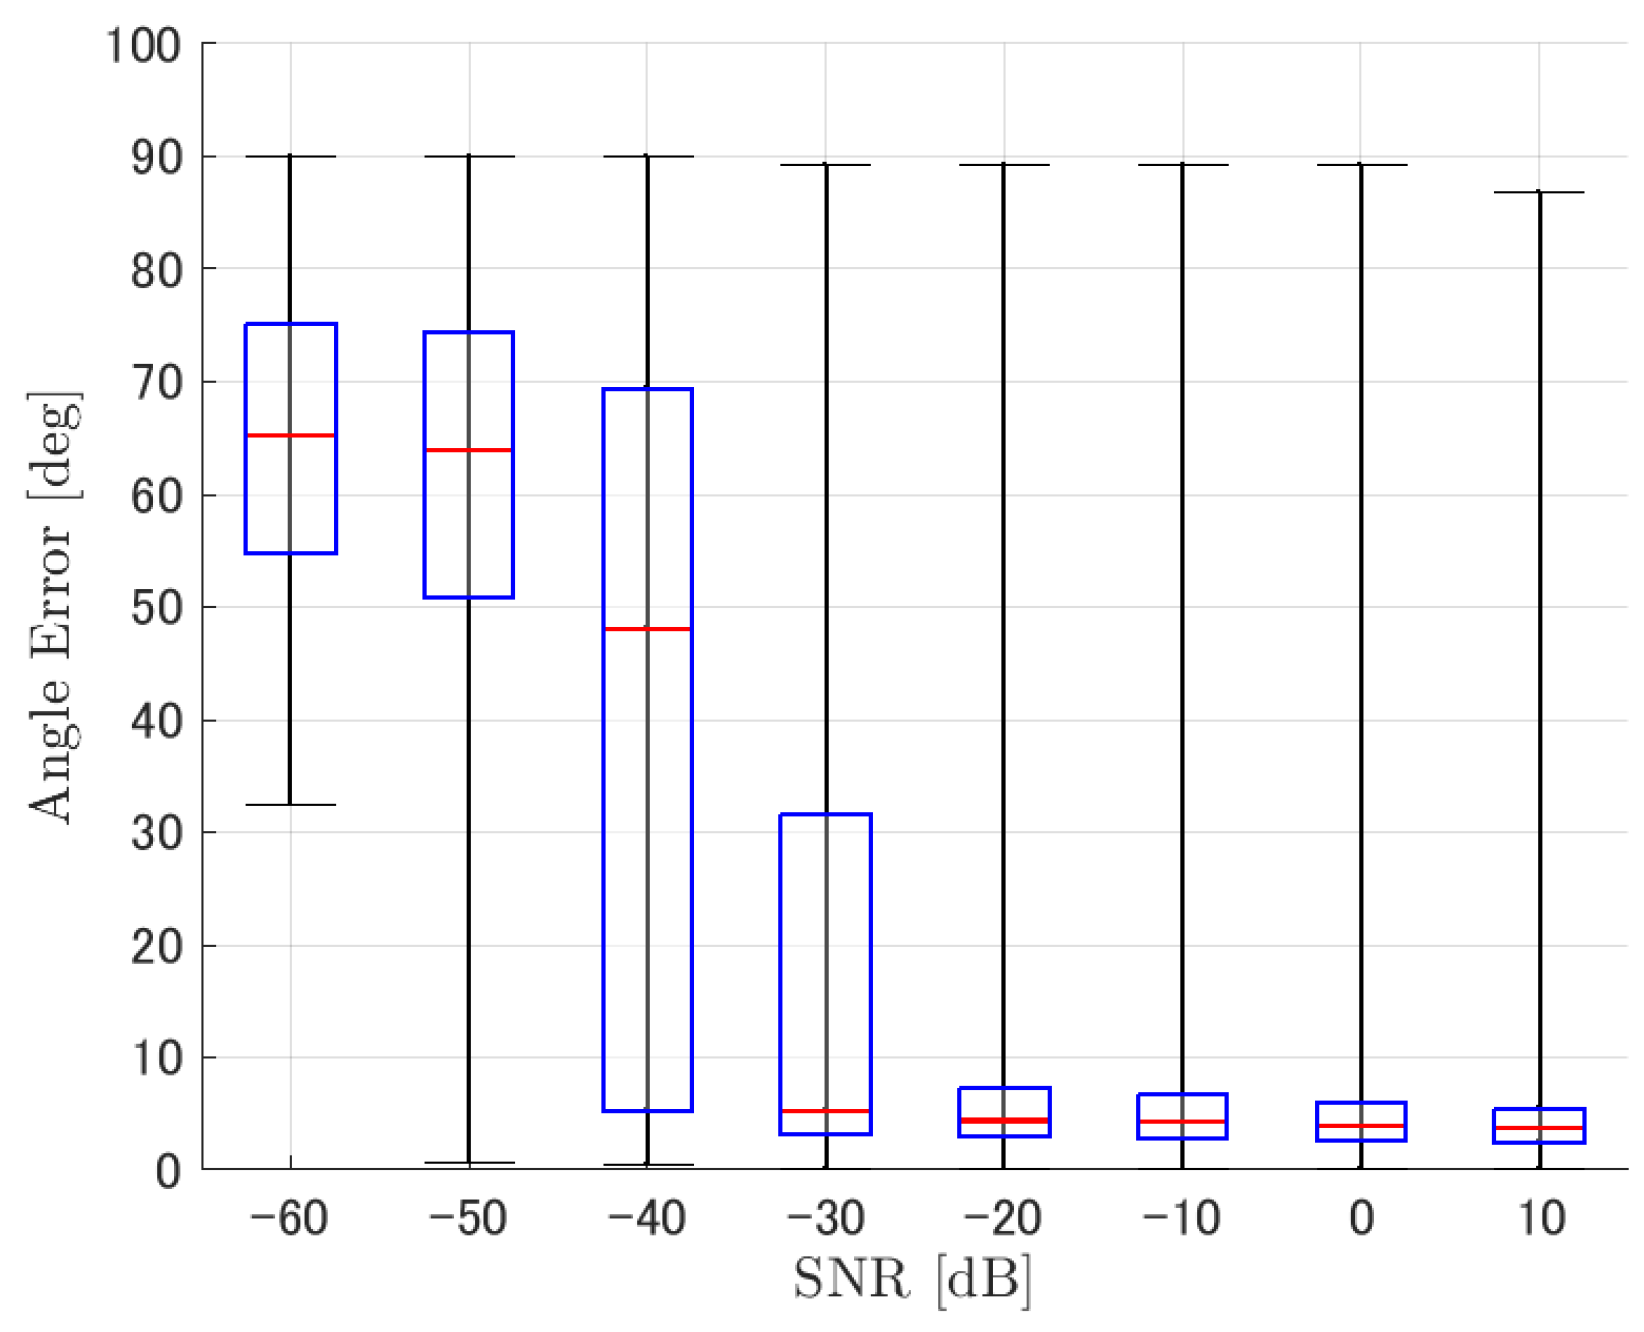
4.2.2. Discussion: SNR
4.2.3. Discussion: Overall Performance
5. Conclusions
Author Contributions
Funding
Institutional Review Board Statement
Informed Consent Statement
Data Availability Statement
Conflicts of Interest
Abbreviations
| SNR | Signal-to-noise ratio |
| MUSIC | Multiple signal classification |
| PAFIM | Particle filtering with integrated MUSIC |
| RMSE | Root-mean-square error |
References
- Hoshiba, K.; Washizaki, K.; Wakabayashi, M.; Ishiki, T.; Kumon, M.; Bando, Y.; Gabriel, D.; Nakadai, K.; Okuno, H. Design of UAV-embedded microphone array system for sound source localization in outdoor environments. Sensors 2017, 17, 2535. [Google Scholar] [CrossRef] [PubMed]
- Nonami, K.; Hoshiba, K.; Nakadai, K.; Kumon, M.; Okuno, H.G.; Tanabe, Y.; Yonezawa, K.; Tokutake, H.; Suzuki, S.; Yamaguchi, K.; et al. Recent R&D technologies and future prospective of flying robot in tough robotics challenge. In Disaster Robotics; Springer: Berlin/Heidelberg, Germany, 2019; pp. 77–142. [Google Scholar]
- Nakadai, K.; Kumon, M.; Okuno, H.G.; Hoshiba, K.; Wakabayashi, M.; Washizaki, K.; Ishiki, T.; Gabriel, D.; Bando, Y.; Morito, T.; et al. Development of microphone-array-embedded UAV for search and rescue task. In Proceedings of the IEEE/RSJ International Conference on Intelligent Robots and Systems (IROS), Vancouver, BC, Canada, 24–28 September 2017; pp. 5985–5990. [Google Scholar]
- Nakajima, H.; Nakadai, K.; Hasegawa, Y.; Tsujino, H. Adaptive step-size parameter control for real-world blind source separation. In Proceedings of the IEEE International Conference on Acoustics, Speech and Signal Processing, Las Vegas, NV, USA, 31 March–4 April 2008; pp. 149–152. [Google Scholar]
- Sugiyama, O.; Uemura, S.; Nagamine, A.; Kojima, R.; Nakamura, K.; Nakadai, K. Outdoor acoustic event identification with DNN using a quadrotor-embedded microphone array. J. Robot. Mechatronics 2017, 29, 188–197. [Google Scholar] [CrossRef]
- Wakabayashi, M.; Washizaka, K.; Hoshiba, K.; Nakadai, K.; Okuno, H.G.; Kumon, M. Design and Implementation of Real-Time Visualization of Sound Source Positions by Drone Audition. In Proceedings of the IEEE/SICE International Symposium on System Integration (SII), Honolulu, HI, USA, 12–15 January 2020; pp. 814–819. [Google Scholar]
- Furukawa, K.; Okutani, K.; Nagira, K.; Otsuka, T.; Itoyama, K.; Nakadai, K.; Okuno, H.G. Noise correlation matrix estimation for improving sound source localization by multirotor UAV. In Proceedings of the IEEE/RSJ International Conference on Intelligent Robots and Systems, Tokyo, Japan, 3–7 November 2013; pp. 3943–3948. [Google Scholar]
- Strauss, M.; Mordel, P.; Miguet, V.; Deleforge, A. DREGON: Dataset and methods for UAV-embedded sound source localization. In Proceedings of the IEEE/RSJ International Conference on Intelligent Robots and Systems (IROS), Madrid, Spain, 1–5 October 2018; pp. 1–8. [Google Scholar]
- Yamada, T.; Itoyama, K.; Nishida, K.; Nakadai, K. Sound Source Tracking by Drones with Microphone Arrays (forthcoming). In Proceedings of the IEEE/SICE International Symposium on System Integration, Honolulu, HI, USA, 12–15 January 2020. [Google Scholar]
- Yamada, T.; Itoyama, K.; Nishida, K.; Nakadai, K. Sound Source Tracking Using Integrated Direction Likelihood for Drones with Microphone Arrays. In Proceedings of the IEEE/SICE International Symposium on System Integration (SII), Fukushima, Japan, 11–14 January 2021; pp. 394–399. [Google Scholar]
- Nakadai, K.; Nakajima, H.; Yamada, K.; Hasegawa, Y.; Nakamura, T.; Tsujino, H. Sound source tracking with directivity pattern estimation using a 64 ch microphone array. In Proceedings of the IEEE/RSJ International Conference on Intelligent Robots and Systems, Edmonton, AB, Canada, 2–6 August 2005; pp. 1690–1696. [Google Scholar]
- Nakadai, K.; Nakajima, H.; Murase, M.; Kaijiri, S.; Yamada, K.; Nakamura, T.; Hasegawa, Y.; Okuno, H.G.; Tsujino, H. Robust tracking of multiple sound sources by spatial integration of room and robot microphone arrays. In Proceedings of the IEEE International Conference on Acoustics Speech and Signal Processing Proceedings, Toulouse, France, 14–19 May 2006; Volume 4. [Google Scholar]
- Portello, A.; Bustamante, G.; Danès, P.; Piat, J.; Manhes, J. Active localization of an intermittent sound source from a moving binaural sensor. In Proceedings of the Forum Acuticum, Krakow, Poland, 7–12 September 2014. [Google Scholar]
- Nguyen, Q.V.; Colas, F.; Vincent, E.; Charpillet, F. Localizing an intermittent and moving sound source using a mobile robot. In Proceedings of the IEEE/RSJ International Conference on Intelligent Robots and Systems (IROS), Daejeon, Korea, 9–14 October 2016; pp. 1986–1991. [Google Scholar]
- Evers, C.; Dorfan, Y.; Gannot, S.; Naylor, P.A. Source tracking using moving microphone arrays for robot audition. In Proceedings of the IEEE International Conference on Acoustics, Speech and Signal Processing (ICASSP), New Orleans, LA, USA, 5–9 March 2017; pp. 6145–6149. [Google Scholar]
- Evers, C.; Habets, E.A.P.; Gannot, S.; Naylor, P.A. DoA Reliability for Distributed Acoustic Tracking. IEEE Signal Process. Lett. 2018, 25, 1320–1324. [Google Scholar] [CrossRef]
- Sasaki, Y.; Tanabe, R.; Takemura, H. Probabilistic 3D sound source mapping using moving microphone array. In Proceedings of the IEEE/RSJ International Conference on Intelligent Robots and Systems (IROS), Daejeon, Korea, 9–14 October 2016; pp. 1293–1298. [Google Scholar]
- Lauzon, J.; Grondin, F.; Létourneau, D.; Desbiens, A.L.; Michaud, F. Localization of RW-UAVs using particle filtering over distributed microphone arrays. In Proceedings of the IEEE/RSJ International Conference on Intelligent Robots and Systems (IROS), Vancouver, BC, Canada, 24–28 September 2017; pp. 2479–2484. [Google Scholar]
- Brandstein, M.S.; Silverman, H.F. A practical methodology for speech source localization with microphone arrays. Comput. Speech Lang. 1997, 11, 91–126. [Google Scholar] [CrossRef]
- Valin, J.M.; Michaud, F.; Rouat, J. Robust 3D Localization and Tracking of Sound Sources Using Beamforming and Particle Filtering. In Proceedings of the IEEE International Conference on Acoustics Speech and Signal Processing Proceedings, Toulouse, France, 14–19 May 2006; Volume 4. [Google Scholar]
- Ishi, C.T.; Even, J.; Hagita, N. Speech activity detection and face orientation estimation using multiple microphone arrays and human position information. In Proceedings of the IEEE/RSJ International Conference on Intelligent Robots and Systems (IROS), Hamburg, Germany, 28 September–2 October 2015; pp. 5574–5579. [Google Scholar]
- Gabriel, D.; Kojima, R.; Hoshiba, K.; Itoyama, K.; Nishida, K.; Nakadai, K. 2D sound source position estimation using microphone arrays and its application to a VR-based bird song analysis system. Adv. Robot. 2019, 33, 403–414. [Google Scholar] [CrossRef]
- Potamitis, I.; Chen, H.; Tremoulis, G. Tracking of multiple moving speakers with multiple microphone arrays. IEEE Trans. Speech Audio Process. 2004, 12, 520–529. [Google Scholar] [CrossRef]
- Knapp, C.; Carter, G. The generalized correlation method for estimation of time delay. IEEE Trans. Acoust. Speech Signal Process. 1976, 24, 320–327. [Google Scholar] [CrossRef]
- Schmidt, R. Multiple emitter location and signal parameter estimation. IEEE Trans. Antennas Propag. 1986, 34, 276–280. [Google Scholar] [CrossRef]
- Wang, L.; Cavallaro, A. Acoustic Sensing From a Multi-Rotor Drone. IEEE Sens. J. 2018, 18, 4570–4582. [Google Scholar] [CrossRef]
- Itou, K.; Yamamoto, M.; Takeda, K.; Takezawa, T.; Matsuoka, T.; Kobayashi, T.; Shikano, K.; Itahashi, S. JNAS: Japanese speech corpus for large vocabulary continuous speech recognition research. J. Acoust. Soc. Jpn. (E) 1999, 20, 199–206. [Google Scholar] [CrossRef][Green Version]


Publisher’s Note: MDPI stays neutral with regard to jurisdictional claims in published maps and institutional affiliations. |
© 2021 by the authors. Licensee MDPI, Basel, Switzerland. This article is an open access article distributed under the terms and conditions of the Creative Commons Attribution (CC BY) license (https://creativecommons.org/licenses/by/4.0/).
Share and Cite
Yamada, T.; Itoyama, K.; Nishida, K.; Nakadai, K. Assessment of Sound Source Tracking Using Multiple Drones Equipped with Multiple Microphone Arrays. Int. J. Environ. Res. Public Health 2021, 18, 9039. https://doi.org/10.3390/ijerph18179039
Yamada T, Itoyama K, Nishida K, Nakadai K. Assessment of Sound Source Tracking Using Multiple Drones Equipped with Multiple Microphone Arrays. International Journal of Environmental Research and Public Health. 2021; 18(17):9039. https://doi.org/10.3390/ijerph18179039
Chicago/Turabian StyleYamada, Taiki, Katsutoshi Itoyama, Kenji Nishida, and Kazuhiro Nakadai. 2021. "Assessment of Sound Source Tracking Using Multiple Drones Equipped with Multiple Microphone Arrays" International Journal of Environmental Research and Public Health 18, no. 17: 9039. https://doi.org/10.3390/ijerph18179039
APA StyleYamada, T., Itoyama, K., Nishida, K., & Nakadai, K. (2021). Assessment of Sound Source Tracking Using Multiple Drones Equipped with Multiple Microphone Arrays. International Journal of Environmental Research and Public Health, 18(17), 9039. https://doi.org/10.3390/ijerph18179039